Article

Optimizing Sample Size to Assess the Genetic Diversity in Common Vetch (Vicia sativa L.) Populations Using Start Codon Targeted (SCoT) Markers

The State Key Laboratory of Grassland Agro-Ecosystems, College of Pastoral Agriculture Science and Technology, Lanzhou University, Lanzhou 730020, China
*
Author to whom correspondence should be addressed.
Molecules 2017, 22(4), 567; https://doi.org/10.3390/molecules22040567
Submission received: 11 February 2017 / Revised: 28 March 2017 / Accepted: 29 March 2017 / Published: 31 March 2017
(This article belongs to the Section Molecular Diversity)

Abstract

:
Common vetch (Vicia sativa subsp. sativa L.) is a self-pollinating annual forage legume with worldwide importance. Here, we investigate the optimal number of individuals that may represent the genetic diversity of a single population, using Start Codon Targeted (SCoT) markers. Two cultivated varieties and two wild accessions were evaluated using five SCoT primers, also testing different sampling sizes: 1, 2, 3, 5, 8, 10, 20, 30, 40, 50, and 60 individuals. The results showed that the number of alleles and the Polymorphism Information Content (PIC) were different among the four accessions. Cluster analysis by Unweighted Pair Group Method with Arithmetic Mean (UPGMA) and STRUCTURE placed the 240 individuals into four distinct clusters. The Expected Heterozygosity (HE) and PIC increased along with an increase in sampling size from 1 to 10 plants but did not change significantly when the sample sizes exceeded 10 individuals. At least 90% of the genetic variation in the four germplasms was represented when the sample size was 10. Finally, we concluded that 10 individuals could effectively represent the genetic diversity of one vetch population based on the SCoT markers. This study provides theoretical support for genetic diversity, cultivar identification, evolution, and marker-assisted selection breeding in common vetch.

1. Introduction

Common vetch (Vicia sativa L. subsp. sativa L.), known as an important self-pollinating forage legume [1,2], is one of the most commonly grown cover crops in the world [3] and is used as pasture, hay and silage [4]. Common vetch also has the ability to grow across a complex range of climate and soil conditions [5,6,7]. In addition, common vetch can fit well into cereal rotations (intercrops) to reduce the incidence of diseases in succeeding non-legume crops [8]. Due to the advantages of its economic value and ecological protection, common vetch is widely cultivated in many parts of the world, including Turkey, China, eastern Asia, India and the USA [1,9,10]. Although common vetch has a high research value, there is currently no scientific sampling size for this species, which has hindered species-related research to some extent. In order to obtain relatively high genetic diversity from a population and select a few individuals in a given region for the efficient conservation of common vetch, an appropriate sampling size should be considered. The method of collecting many seeds from one or a few individuals will result in the loss of the majority of genetic diversity in a population. If more individuals are included in a sample, the sampling size will encompass a high level of diversity, but an exceedingly large sample size from a population will increase the workload for the maintenance and management of the germplasm, particularly when the seeds have to be reproduced in the germplasm storage. To ensure efficient, economical, and maximal retention of the genetic diversity of each vetch population during sampling, it is necessary to have an optimal sampling size to capture the diversity with a manageable number of individuals in one population. To achieve this sampling size, detailed analysis of population genetic diversity and comparison of the genetic constitution of common vetch should be implemented.
With the development of molecular marker technology, a variety of molecular markers have been used to evaluate genetic diversity in crops. Examples include the amplified fragment length polymorphism (AFLP) in Taraxacum koksaghyz Rodin [11], single nucleotide polymorphism (SNP) in Miscanthus [12], restriction fragment length polymorphism (RFLP) in rubber tree (Hevea spp.) [13], and simple sequence repeats (SSR) in Alfalfa (Medicago sativa) [14] and in Siberian wild rye (Elymus sibiricus) [15]. The start codon targeted (SCoT) polymorphism is a new marker system, and it was developed based on the short-conserved region flanking the adenine–thymine–guanine (ATG) start codon in plant genes [16,17]. SCoT is similar to the random amplified polymorphic DNA (RAPD) and inter simple sequence repeat (ISSR) because a single primer is used as forward and reverse [18]. SCoT marker has been successfully applied in mango (Mangifera indica L.), grape (Vitis vinifera L.), peanut (Arachis hypogaea L.), Siberian wild rye (Elymus sibiricus L.), and chickpea (Cicer arietinum L.) [18,19,20,21,22].
To determine the appropriate number of individuals that should be sampled to represent reasonable genetic diversity in a population, we designed an experiment to study the genetic variation patterns of different populations of common vetch with SCoT markers. The optimized sampling size could provide useful information for studies of genetic diversity, cultivar identification, evolution, and marker-assisted selection breeding in common vetch.

2. Results

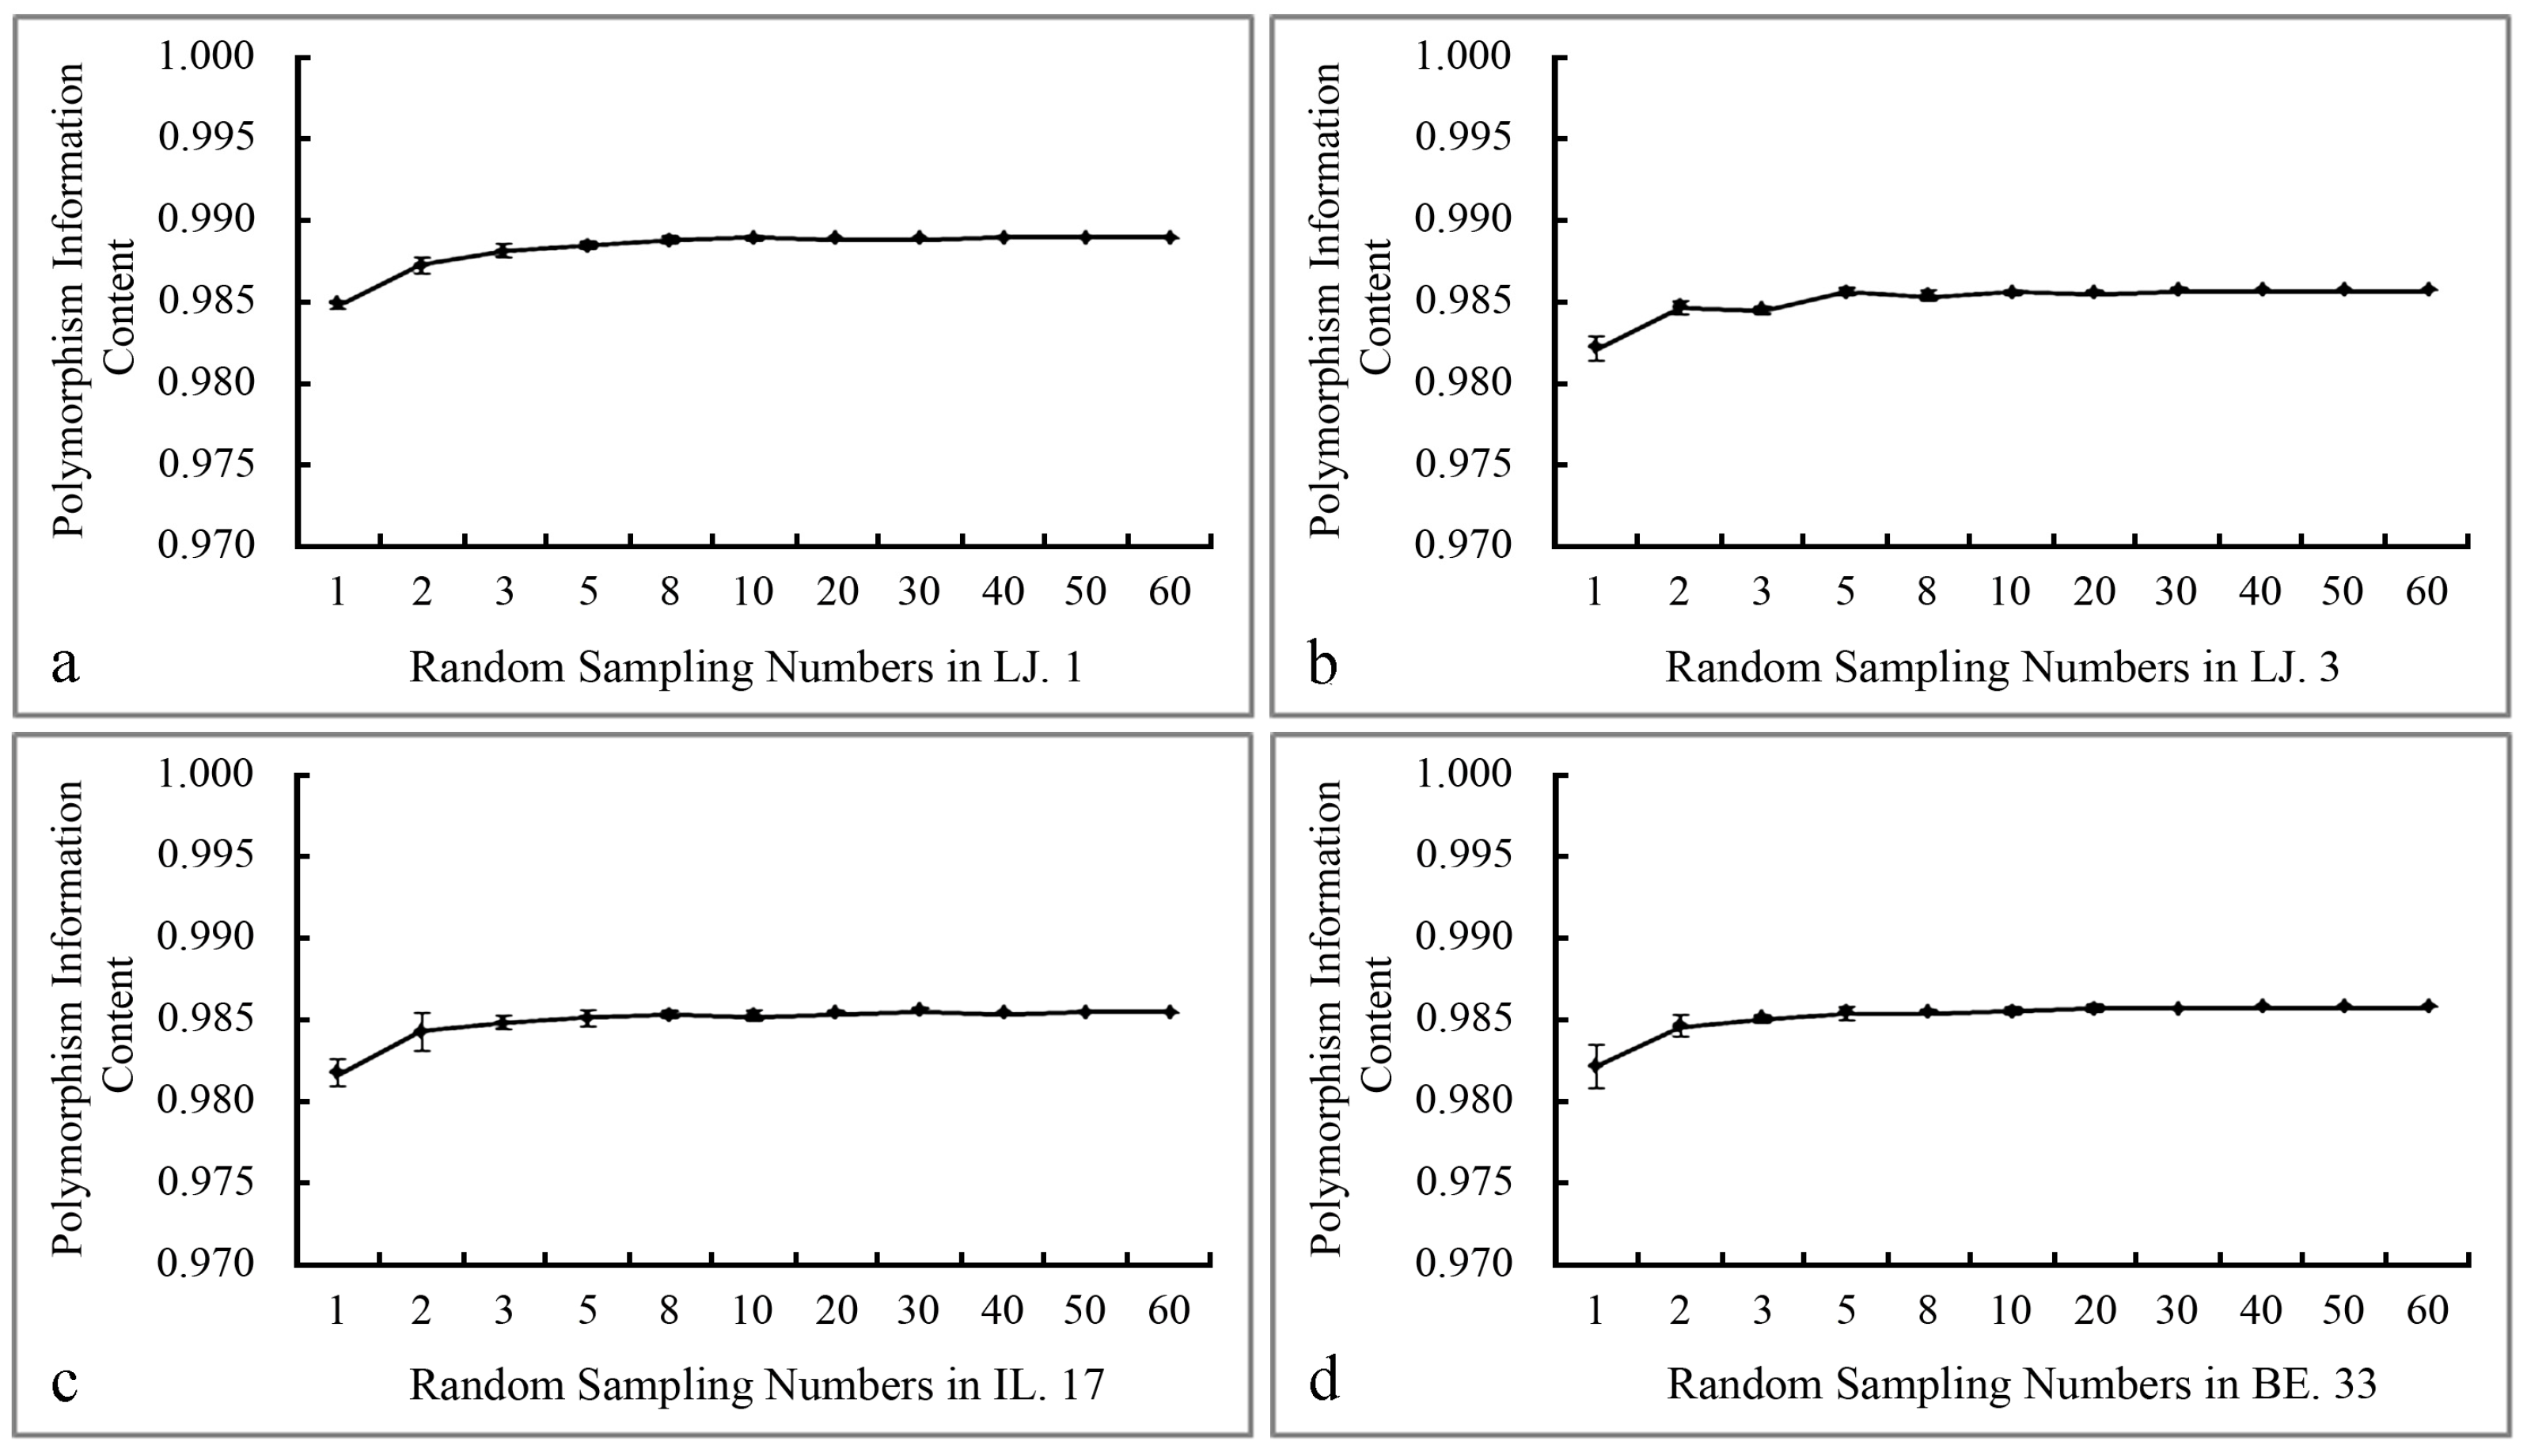
2.1. The Polymorphism and Genetic Diversity Analysis of SCoT Markers

Alleles and genetic diversity parameters are important indicators of the genetic characteristics of the species. In this study, we calculated the genetic diversity parameters in four vetch accessions (Table 1). We observed that the five SCoT primers amplified 122 alleles with an average of 24.4 alleles per locus in the four vetch accessions. Furthermore, the Percentage of Polymorphic Bands (PPB) of five primers were all 100, indicating that the five primers had very high specificity in these four populations. The primers that we selected had high PIC (Figure 1) and high HE (Table 2).
Across the individuals that were in different sampling sizes, when the sample size was less than 10 individuals, the HE values gradually increased, but at sample sizes greater than 10 individuals, the changes in the HE values tended to be stable (Table 2). The PIC values increased with the increase in sample sizes up to 10 individuals, and reached a plateau in sample sizes greater than 10 individuals (Figure 1). The Number of allele (Na) and the Reserve Percentage (RP) of the four accessions increased along with the sampling size increase from 1 to 10 individuals but did not change obviously when the sample size exceeded 10 individuals. The RP value of the four germplasms in different sampling sizes represented more than 90% of the genetic variation in the total population when the sample size was 10 (Table 2). The Fixation index (FST) values are an important index to determine the degree of genetic differentiation of germplasm. The FST values were ranged from 0.25 to 0.45. With the increase of sampling size up to 10, the value of FST gradually increased (Table 3). The Shannon information index (I) of four accessions ranged from 0.67 to 0.69 (Table 3), indicating the high biodiversity within the accessions. The Resolving Power (Rp) of the five SCoT primers ranged from 2.67 to 13.90; the values were inferred based on the ability of the primer to differentiate between genotypes (Table 4).

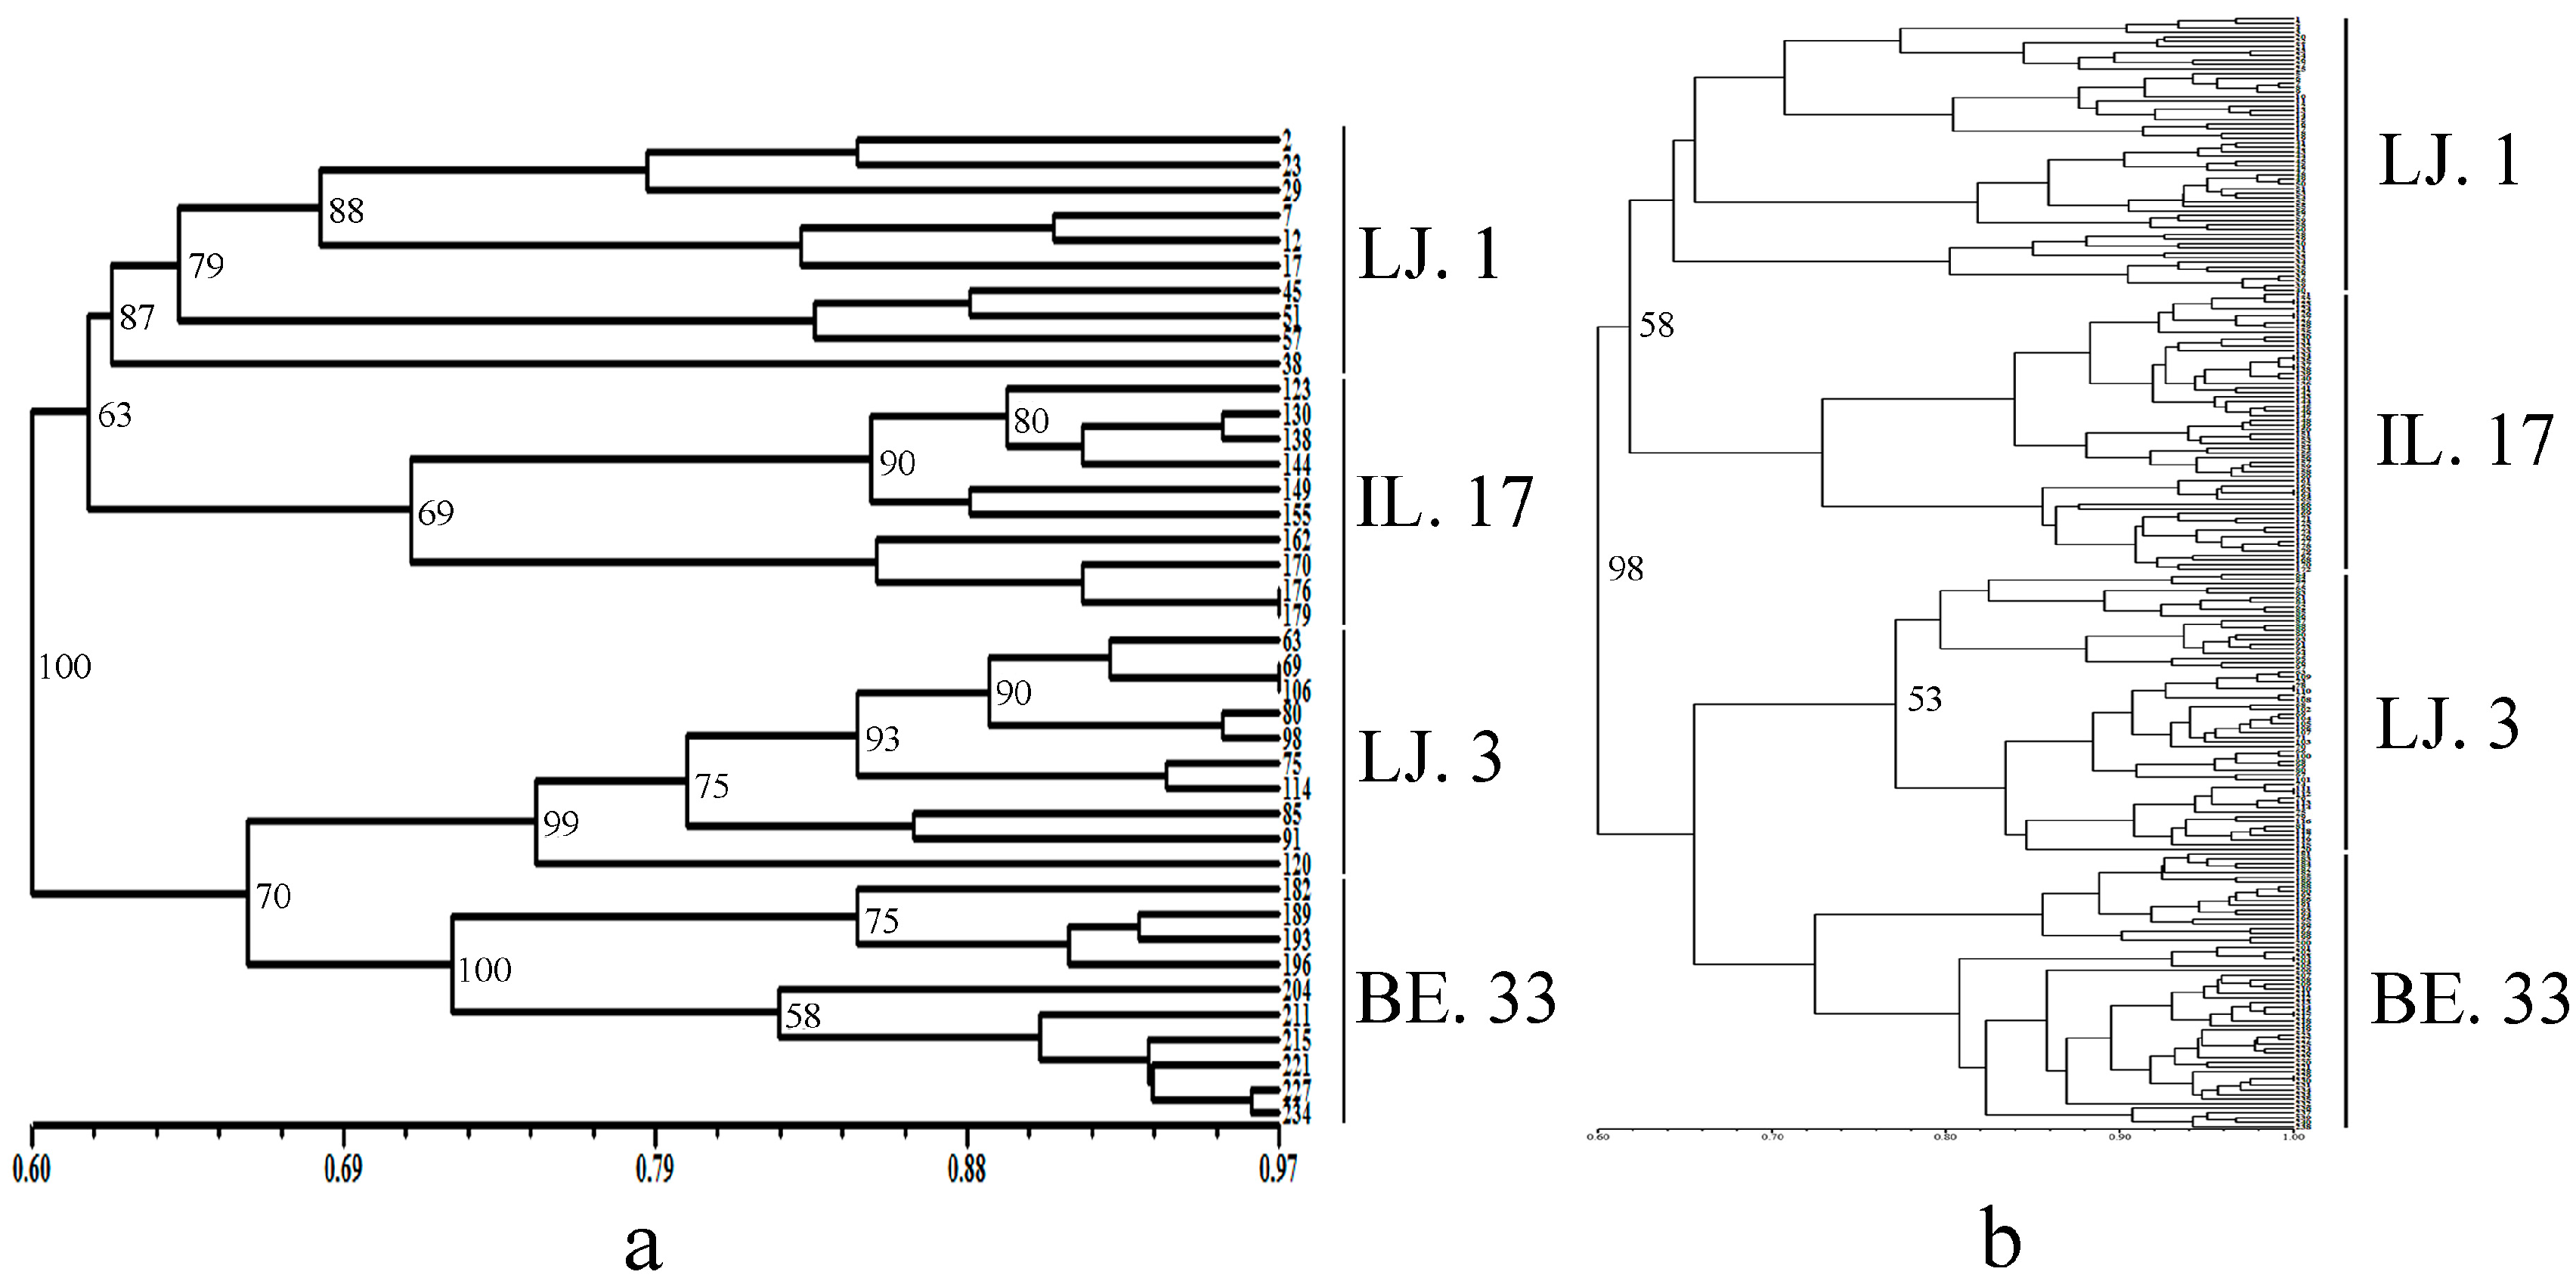
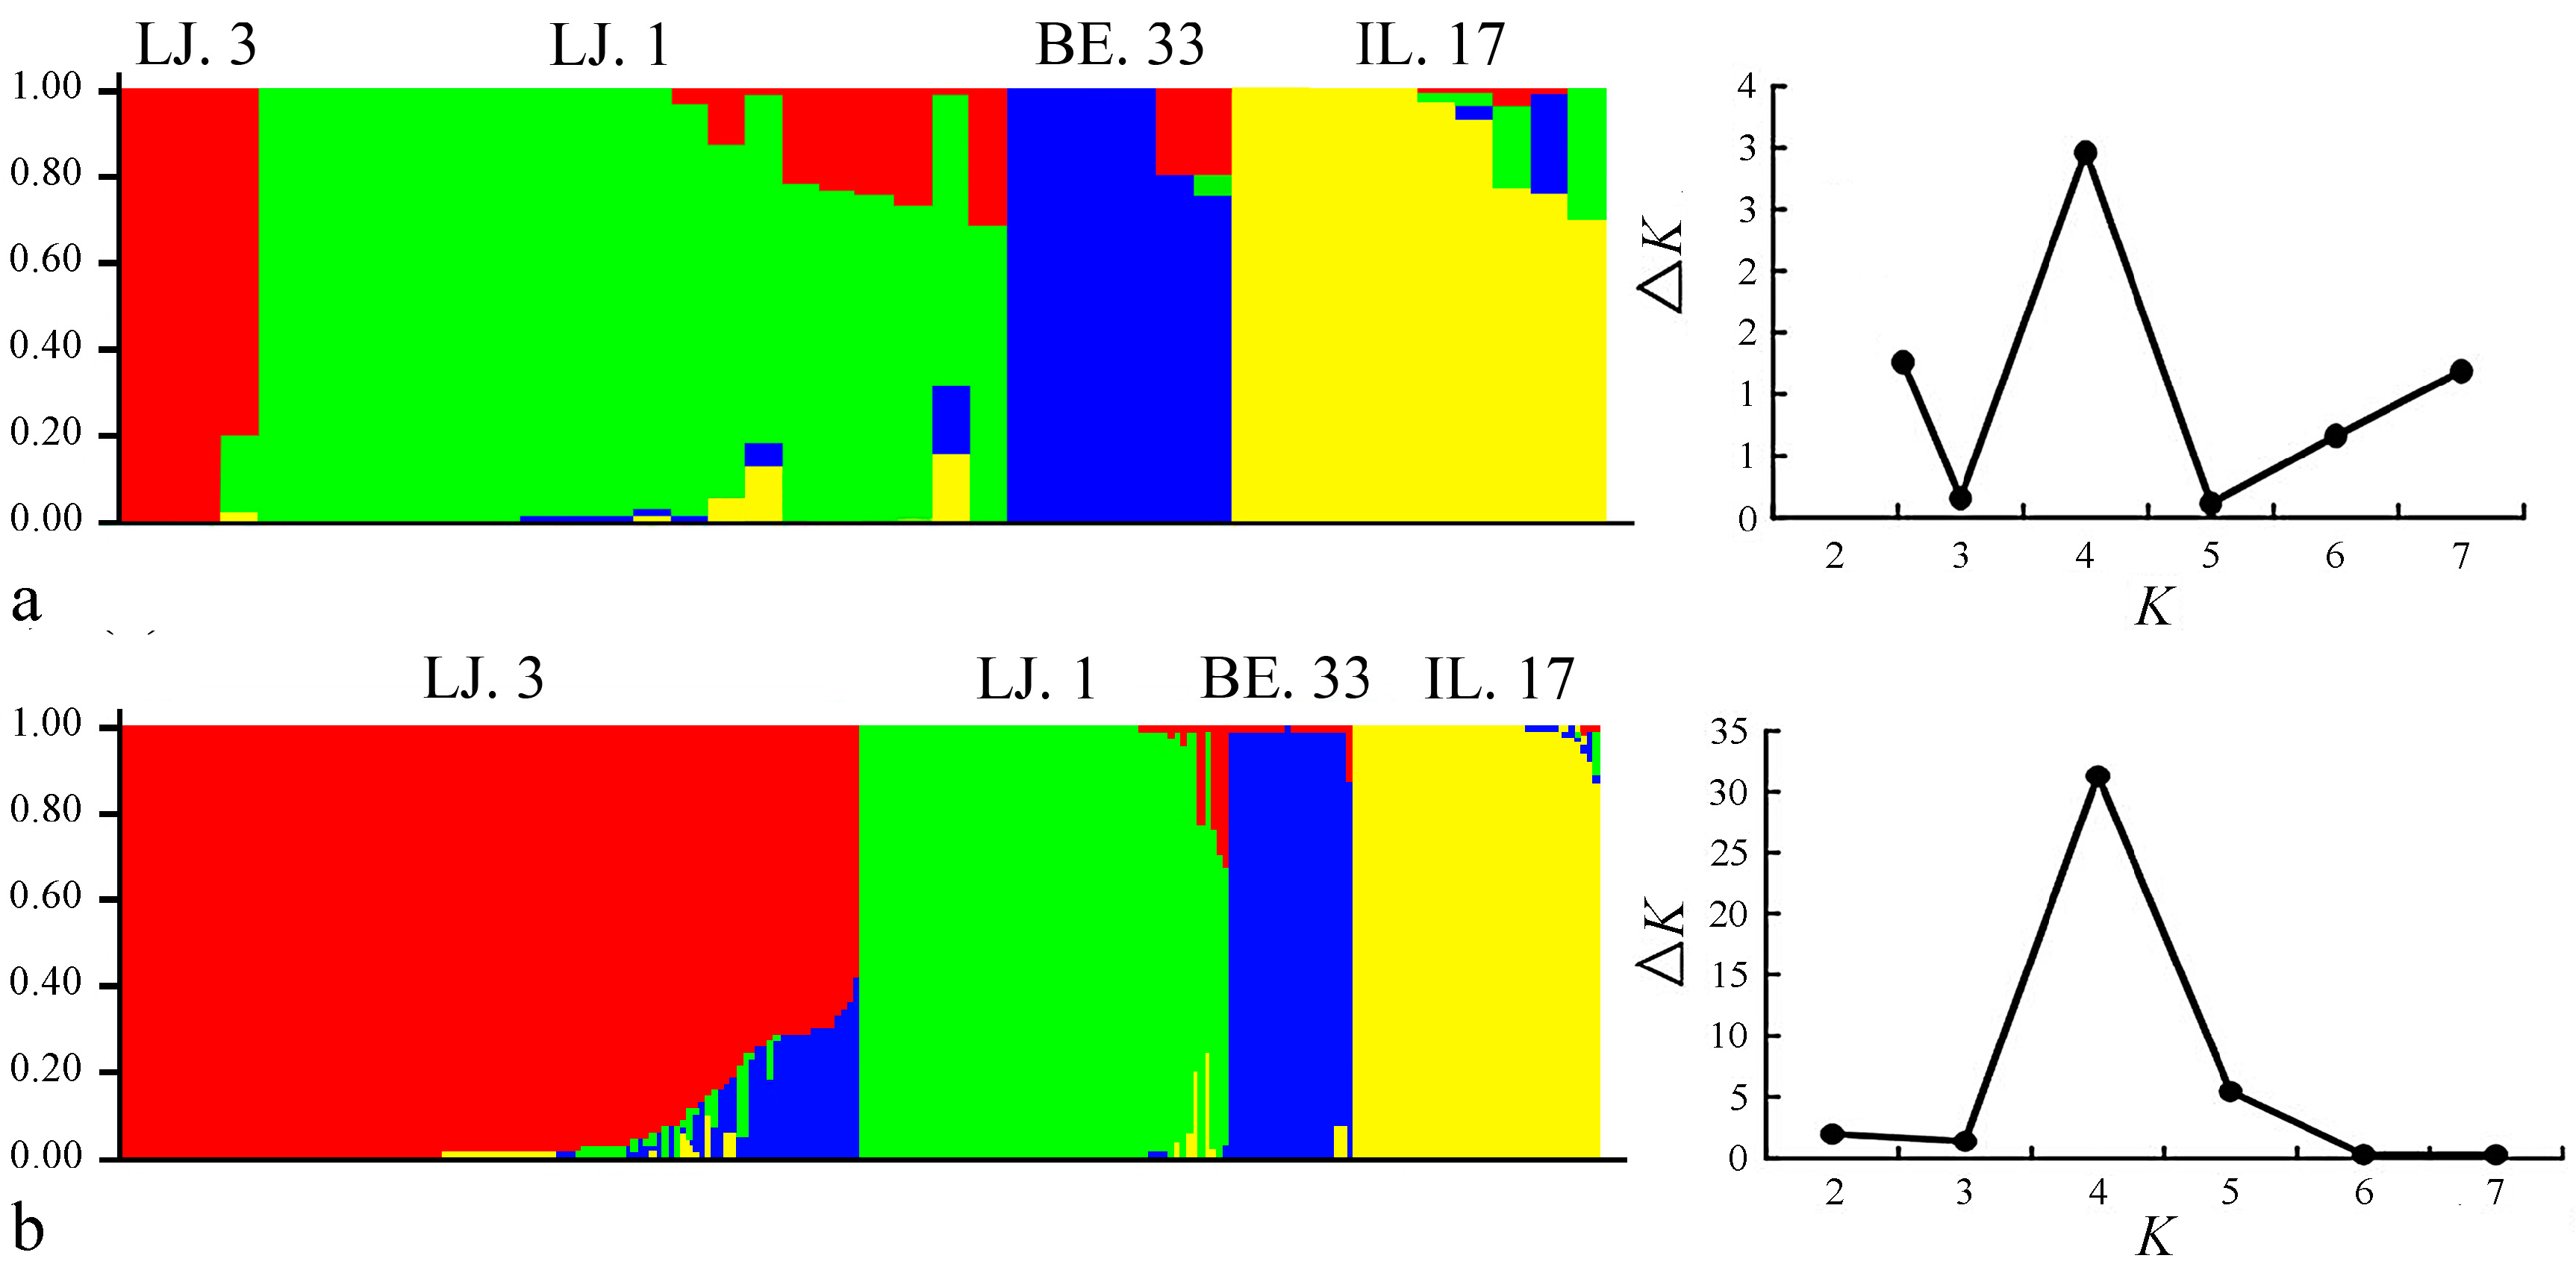
2.2. Cluster and Population Structure Analysis

We used the Unweighted Pair Group Method with Arithmetic Mean (UPGMA) and STRUCTURE 2.3.4 software to investigate the relationships between the different sampling levels. According to the UPGMA dendrogram (Figure 2), based on Jaccard’s genetic similarity, only bootstrap values higher than 50% are presented. If the bootstrap value was less than 50%, it cannot sufficiently provide the meaning and polymorphic phylogeny of the accessions [23,24]. The clustering result showed that the sampling level of 10 individuals was consistent with that of 60 individuals. The individuals of the different sampling sizes were assigned to four linkage clusters. The 240 individuals from four different populations were clustered together, and the populations from one location, such as LJ. 1 and LJ. 3, were not clustered together. This finding confirmed the genetic diversity of common vetch from another perspective. The STRUCTURE 2.3.4 software was used to verify the feasibility of the proposed random sampling results. It was run for K = 2–8 based on the distribution of the five SCoT primers among the individuals at different sampling levels. Each color represents one cluster. In Figure 3, we can see that STRUCTURE inferred four clusters. In addition, based on the maximum likelihood and delta KK) values, we found that whether the sampling level was 10 or 60, the number of optimum groups was four (Figure 3). The two types of software demonstrated that the number of the clusters was consistent with the number of randomly selected germplasms and that a random sampling level at 10 individuals can represent most of the genetic diversity obtained with 60 individuals.

3. Discussion

Genetic diversity is one of the most important indicators of biodiversity and is the basic material for the survival and reproduction of species. The study of the genetic diversity of different accessions not only clearly elucidated the genetic structure and characteristics of their populations but also provided technical support for the utilization and protection of their germplasm resources, which has far-reaching implications for endangered or complex species [16].
Common vetch is an annual and strictly self-pollinating forage legume. According to the biological principle on population genetics of species with different breeding systems, comparatively rich genetic diversity should be expected within this species, which may be caused by the trait of a strict closed pollination for the common vetch [25]. Presently, molecular genetic diversity of common vetch is mainly focused on EST-SSR markers and AFLP [2,3,4,5,6]. SCoT markers were firstly introduced in the common vetch, and showed a relatively higher polymorphic than EST-SSR markers [2,4,5].
The proposed statistical models to obtain a general estimation of the number of samples that should be collected to represent a population [25,26] determined that if the population is a Mendelian population, then the appropriate number of individuals is 30 for a plant species to properly represent an ideal population [26]. For wild soybean (Glycine soja) populations, researchers studied the germplasms in several areas and determined that they only needed to sample 27 to 52 individuals for the representation of most of the genetic information of the accessions [27]. However, for the Agropyron Gaertn. species, the genetic diversity of different germplasms and individuals were studied by random sampling, and the researchers concluded that at least 12 individuals can represent the majority of the genetic diversity of the species [28]. This finding indicates that there are differences in the genetic information of different species and that the corresponding sampling sizes are also significantly different. In this study, we used SCoT markers to study common vetch. Compared with other molecular markers such as SSR, AFLP, and SSAP, SCoT markers have the advantages of simple operation, low cost and abundant polymorphisms, and they are more conducive to molecular-assisted breeding. Based on the DNA products amplified from the five selected SCoT primers, the experiment found high genetic variation in the common vetch population, with 100% of polymorphic loci. The high values of polymorphic loci were also found in orchardgrass (Dactylis glomerata L.) and Trichoderma koningii using SCoT markers [29,30]. Furthermore, the FST, HE, PIC and I values of four accessions also showed the high level of genetic diversity for common vetch accessions.
In the present study, alleles and the RP values were used as the criterion for estimating the genetic diversity of the four common vetch populations, which include both cultivated varieties and wild accessions. As indicated in Table 2, the increase in genetic diversity shows a strong correlation with the increasing number of randomly collected samples with 1, 2, 3, 5, 8, 10, 20, 30, 40, 50, and 60 individuals. The increase in genetic diversity is dramatic with an increase in individuals of up to 10, and the increase in genetic diversity becomes slow and rapidly reaches a plateau when more than 10 individuals are included in the sample set. We concluded that a set of 10 randomly collected individuals can represent the majority of genetic diversity in the population, of which the RP value of alleles is over 90%. In general, more than 90% of RP values of the alleles can represent most of the germplasm genetic information. We concluded that the random sampling size of 10 individuals could highly represent the genetic information of common vetch populations.
Compared with the genetic diversity of the wild accessions IL. 17 and BE. 33, the genetic diversity of the cultivated varieties LJ. 1 and LJ. 3 showed higher values at the same sampling level, which are reflected in the indices of HE, PIC, Na, and RP (Table 2). We concluded that LJ. 1 and LJ. 3, as cultivated varieties, underwent individual selection during breeding activities and had higher levels of homozygosity among individuals.
The development of a core collection for a plant would provide a subset of accessions that represented the most diversity of the entire collection. As a polymorphic molecular marker technology, SCoT would be useful for evaluating the genetic diversity in the development of the core collection in the vetch. To screen a core collection from thousands of vetch accessions, 10 individuals per accession would require more time and labor. Based on all statistical indexes in different sampling levels (Figure 1), we suggest that five individuals per accession would be optimal. At this sampling level, the RP values of alleles exceeded 80% (Table 2).

4. Materials and Methods

4.1. Plant Materials and DNA Extraction

In total, 240 individuals of four common vetch accessions were used in this study (Table 1). The seeds of four accessions were supplied by the National Plant Germplasm System (NPGS, America) and Lanzhou University. The seeds of the four accessions were sown in the Yuzhong Experimental Station of Lanzhou University (N 35°57′, E 104°09′), Lanzhou, China. The annual precipitation is 400 mm, and the mean annual temperature is 6.7 °C (from the year 2013 to 2015) [31]. All accessions in a total of 240 individuals were used for the genetic diversity analysis. Sixty individuals of each accession were sampled for the extraction of DNA. Leaf samples were obtained from young plants, and a revised cetyltrimethylammonium ammonium bromide (CTAB) method [32] was used for the extraction of DNA. The DNA quality was determined using a Nanodrop spectrophotometer (NanoDrop Products, Wilmington, DE, USA), and the DNA concentration was determined using 1.4% agarose gel electrophoresis. Eventually, the extraction DNA were diluted to 25 ng/μL and stored at −20 °C for further PCR amplification.

4.2. PCR Amplification

In this experiment, a total of 25 SCoT primers were screened by using agarose gel electrophoresis (Table 5) [17,19]. After screening and optimization, we selected five primers with higher polymorphisms and clear bands (Table 6).
The PCR reactions were all conducted in volumes of 10 μL containing 2.0 μL 25 ng/μL DNA, 5.0 μL 2× Power Taq PCR Master Mix (Bioteke, Beijing, China), 1.0 μL of each primer and 2.0 μL double-distilled water. The PCR programs were set at 94 °C for 4 min, followed by 35 cycles of 1 min at 94 °C, 1 min at 50 °C and 2 min at 72 °C, with a final extension at 72 °C for 7 min. After PCR amplification, fragments were separated in 1.4% agarose gel containing 0.14 μg/mL of Goldview through electrophoresis in 1× TBE buffer solution at 129 V for 2 h 15 min. DNA fragments were visualized under the ultravlolet (UV) light Gel Doc (TM) XR System (Bio-Rad, Hercules, CA, USA), and photo documentation was obtained for each gel.

4.3. Data Analysis

The amplified bands were scored as absent (0) or present (1), and only reproducible bands were considered. To evaluate the genetic diversity within the germplasm, the indexes of Expected Heterozygosity (HE), Polymorphic Information Content (PIC), and the observed number of alleles (Na) were calculated as previously described [4,33]. Using the number of alleles observed in a sample to estimate the number of different alleles at a single locus in a population [34]. The Reserve Percentage (RP), which is an important indicator of the proportion of alleles remaining in the sample population was calculated [35], and the Analysis of Molecular Variance (AMOVA) was used to partition the total genetic variation among species, among populations within species and within populations via AMOVA Version 1.55 [36]. A cluster analysis was performed to generate a dendrogram; the dendrogram which was constructed by Jaccard’s genetic similarity matrix to display accession relationships using the UPGMA and Nei’s unbiased genetic distance with the help of SAHN clustering via the NTSYS-pc.V.2.1 software package [37], and the bootstrap values were calculated by free tree + tree view (version 1.6.6 for Windows) [38]. A model-based approach implemented in the software program STRUCTURE 2.3.4 was used to subdivide the individuals into different subgroups [39]. We used the ad hoc measure ∆K [40] to estimate the number of groups. Under the admixture model of the STRUCTURE software, a burn-in period of 10,000 iterations and a run of 100,000 replications of Markov Chain Monte Carlo after burn-in were performed. The membership of each genotype was tested for the range of genetic clusters from K = 2 to K = 8 (each with 10 independent runs). The FST values of the alleles of different sampling sizes were also calculated by the software ARLEQUIN version 3.11 [41]. The Rp value of the primer in each accession was measured in accordance with Rp = ΣIb [42]. The Shannon information index (I) values between four accessions were analyzed using POPGENE 32 Version 1.31 [43].

5. Conclusions

In this study, four different germplasms including 240 individuals were used for the determination of a sampling size for common vetch. The results showed differing degrees of genetic variation on the various sampling levels. Based on the results, we concluded that a sample of 10 individuals is optimal for future studies of common vetch, as this sampling size can represent over 90% of the genetic diversity of the population. This sampling size could provide technical support for molecular breeding and the protection of germplasm of common vetch.

Acknowledgments

The study was supported by the National Basic Research Program of China (2014CB138704), the National Natural Science Foundation of China (31672476) and the Fundamental Research Funds for the Central Universities (lzujbky-2016-2). We would like to thank the US National Plant Germplasm System (NPGS) for providing the vetch accessions used in the study.

Author Contributions

Conceived and designed the experiments: Z.L., Y.W.; Performed the experiments: X.C., R.D.; Analyzed the data: X.C., W.L.; Wrote the paper: X.C. and Z.L.

Conflicts of Interest

The authors declare no conflict of interest.

References

  1. Arslan, E.; Ertuğrul, K.; Öztürk, A.B. Karyological studies of some species of the genus Vicia L. (Leguminosae) in Turkey. Caryologia 2012, 65, 106–113. [Google Scholar] [CrossRef]
  2. Liu, Z.P.; Liu, P.; Luo, D.; Liu, W.X.; Wang, Y.R. Exploiting Illumina sequencing for the development of 95 novel polymorphic EST-SSR markers in common vetch (Vicia sativa subsp. sativa). Molecules 2014, 19, 5777–5789. [Google Scholar] [CrossRef] [PubMed]
  3. Potokina, E.; Blattner, F.; Alexandrova, T.; Bachmann, K. AFLP diversity in the common vetch (Vicia sativa L.) on the world scale. Theor. Appl. Genet. 2002, 105, 58–67. [Google Scholar] [PubMed]
  4. Chung, J.W.; Kim, T.S.; Suresh, S.; Lee, S.Y.; Cho, G.T. Development of 65 novel polymorphic cDNA-SSR markers in common vetch (Vicia sativa subsp. sativa) using next generation sequencing. Molecules 2013, 18, 8376–8392. [Google Scholar] [PubMed]
  5. Chung, J.W.; Kim, T.S.; Sundan, S.; Lee, G.A.; Park, J.H.; Cho, G.T.; Lee, H.S.; Lee, J.Y.; Lee, M.C.; Baek, H.J.; et al. New cDNA-SSR markers in the narrow-leaved vetch (Vicia sativa subsp. nigra) using 454 pyrosequencing. Mol. Breed. 2014, 33, 749–754. [Google Scholar] [CrossRef]
  6. Kim, T.S.; Raveendar, S.; Suresh, S.; Lee, G.A.; Lee, J.R.; Cho, J.H.; Lee, S.Y.; Ma, K.H.; Cho, G.T.; Chung, J.W. Transcriptome analysis of two Vicia sativa subspecies: Mining molecular markers to enhance genomic resources for vetch improvement. Genes 2015, 6, 1164–1182. [Google Scholar] [CrossRef] [PubMed]
  7. Kolkman, J.M.; Kelly, J.D. Agronomic traits affecting resistance to white mold in common bean. Crop Sci. 2002, 42, 693–699. [Google Scholar] [CrossRef]
  8. Dhima, K.V.; Lithourgidis, A.S.; Vasilakoglou, I.B.; Dordas, C.A. Competition indices of common vetch and cereal intercrops in two seeding ratio. Field Crop. Res. 2007, 100, 249–256. [Google Scholar] [CrossRef]
  9. Kahlaoui, S.; Walker, D.J.; Correal, E.; Martínez-Gómez, P.; Hassen, H.; Bouzid, S. The morphology, chromosome number and nuclear DNA content of Tunisian populations of three Vicia species. Afr. J. Biotechnol. 2009, 8, 3184–3191. [Google Scholar]
  10. Jaaska, V. Isozyme evidence on the specific distinctness and phylogenetic position of Vicia incise (Fabaceae). Open Life Sci. 2008, 3, 169–176. [Google Scholar]
  11. Arias, M.; Hernandez, M.; Remondegui, N.; Huvenaars, K.; Van, D.P.; Ritter, E. First genetic linkage map of Taraxacum koksaghyz Rodin based on AFLP, SSR, COS and EST-SSR markers. Sci. Rep. 2016, 6, 31031. [Google Scholar] [CrossRef] [PubMed]
  12. De Cesare, M.; Hodkinson, T.R.; Barth, S. Chloroplast DNA markers (cpSSRs, SNPs) for Miscanthus, Saccharum and related grasses (Panicoideae, Poaceae). Mol. Breed. 2010, 26, 539–544. [Google Scholar] [CrossRef]
  13. Lespinasse, D.; Rodiergoud, M.; Grivet, L.; Leconte, A.; Legnate, H.; Seguin, M. A saturated genetic linkage map of rubber tree (Hevea spp.) based on RFLP, AFLP, microsatellite, and isozyme markers. Theor. Appl. Genet. 2000, 100, 127–138. [Google Scholar] [CrossRef]
  14. Liu, Z.P.; Chen, T.L.; Ma, L.C.; Zhao, Z.G.; Zhao, P.X.; Nan, Z.B.; Wang, Y.R. Global transcriptome sequencing using the Illumina platform and the development of EST-SSR markers in autotetraploid alfalfa. PLoS ONE 2013, 8, 83549. [Google Scholar]
  15. Zhou, Q.; Luo, D.; Ma, L.C.; Xie, W.G.; Wang, Y.R.; Liu, Z.P. Development and cross-species transferability of EST-SSR markers in Siberian wildrye (Elymus sibiricus L.) using Illumina sequencing. Sci. Rep. 2016, 6, 20549. [Google Scholar] [CrossRef] [PubMed]
  16. Bhattacharyya, P.; Kumaria, S.; Kumar, S.; Tandon, P. Start Codon Targeted (SCoT) marker reveals genetic diversity of Dendrobium nobile Lindl., an endangered medicinal orchid species. Gene 2013, 529, 21–26. [Google Scholar] [CrossRef] [PubMed]
  17. Collard, B.C.Y.; Mackill, D.J. Start codon targeted (SCoT) polymorphism: A simple, novel DNA marker technique for generating gene-targeted markers in plants. Plant Mol. Biol. Rep. 2008, 27, 86–93. [Google Scholar] [CrossRef]
  18. Guo, D.L.; Zhang, J.Y.; Liu, C.H. Genetic diversity in some grape varieties revealed by SCoT analyses. Mol. Biol. Rep. 2012, 39, 5307–5313. [Google Scholar] [CrossRef] [PubMed]
  19. Luo, C.; He, X.H.; Chen, H.; Ou, S.J.; Gao, M.P. Analysis of diversity and relationships among mango cultivars using Start Codon Targeted (SCoT) markers. Biochem. Syst. Ecol. 2010, 38, 1176–1184. [Google Scholar] [CrossRef]
  20. Xiong, F.; Zhong, R.C.; Han, Z.Q.; Jiang, J.; He, L.Q.; Zhuang, W.J.; Tang, R.H. Start codon targeted polymorphism for evaluation of functional genetic variation and relationships in cultivated peanut (Arachishypogaea L.) genotypes. Mol. Biol. Rep. 2011, 38, 3487–3494. [Google Scholar] [CrossRef] [PubMed]
  21. Zhang, J.C.; Xie, W.G.; Wang, Y.R.; Zhao, X.H. Potential of start codon targeted (SCoT) markers to estimate genetic diversity and relationships among chinese Elymus sibiricus accessions. Molecules 2015, 20, 5987–6001. [Google Scholar] [CrossRef] [PubMed]
  22. Pakseresht, F.; Talebi, R.; Karami, E. Comparative assessment of ISSR, DAMD and SCoT markers for evaluation of genetic diversity and conservation of landrace chickpea (Cicer arietinum L.) genotypes collected from north-west of Iran. Physiol. Mol. Biol. Plants 2013, 19, 563–574. [Google Scholar] [CrossRef] [PubMed]
  23. Zhao, D.; Wang, M.; Zeng, J.; Yan, W.M.; Wang, J.Q.; Ma, T.; Hang, R. Bacterial community compositions in response to sediment properties in urban lakes of Nanjing. Afr. J. Microbiol. Res. 2012, 6, 2929–2940. [Google Scholar]
  24. Felsenstein, J. Confidence limits on phylogenies: An approach using the bootstrap. Evolution 1985, 39, 783–791. [Google Scholar] [CrossRef]
  25. Engelmann, F. Use of biotechnologies for the conservation of plant biodiversity. In Vitro Cell. Dev. Plant 2011, 47, 5–16. [Google Scholar] [CrossRef]
  26. Sjögren, P.; Wyöni, P.I. Conservation genetics and detection of rare alleles in finite populations. Conserv. Biol. 1994, 8, 267–270. [Google Scholar] [CrossRef]
  27. Zhu, W.Y.; Zhou, T.Y.; Zhong, M.; Lu, B.R. Sampling strategy for wild soybean (Glycine soja) populations based on their genetic diversity and fine-scale spatial genetic structure. Front. Biol. 2007, 2, 397–402. [Google Scholar] [CrossRef]
  28. Che, Y.H.; Li, L.H.; He, P.R. Sampling size for genetic diversity in Agropyron Gaertn. based on gliadin. J. Plant Genet. Resour. 2004, 3, 216–221. [Google Scholar]
  29. Jiang, L.F.; Qi, X.; Zhang, X.Q.; Huang, L.K.; Ma, X.; Xie, W.G. Analysis of diversity and relationships among orchardgrass (Dactylis glomerata L.) accessions using start codon-targeted markers. Genet. Mol. Res. 2014, 13, 4406–4418. [Google Scholar] [CrossRef] [PubMed]
  30. Gajera, H.P.; Hirpara, D.G.; Katakpara, Z.A.; Patel, S.V.; Golakiya, B.A. Molecular evolution and phylogenetic analysis of biocontrol genes acquired from SCoT polymorphism of mycoparasitic Trichoderma koningii inhibiting phytopathogen Rhizoctonia solani Kuhn. Infect. Genet. Evol. 2016, 45, 383–392. [Google Scholar] [CrossRef] [PubMed]
  31. Hu, X.W.; Pan, J.; Min, D.D.; Fan, Y.; Ding, X.Y.; Fan, S.G.; Baskin, C.C.; Baskin, J.M. Seed dormancy and soil seedbank of the invasive weed Chenopodium hybridum in north-western china. Weed Res. 2016, 57, 54–64. [Google Scholar] [CrossRef]
  32. Gawel, N.J.; Jarret, R.L. A modified CTAB DNA extraction procedure for Musa and Ipomoea. Plant Mol. Biol. Rep. 1991, 9, 262–266. [Google Scholar] [CrossRef]
  33. Borovics, A.; Mátyás, C. Decline of genetic diversity of sessile oak at the retracting (xeric) limits. Ann. For. Sci. 2013, 70, 835–844. [Google Scholar] [CrossRef]
  34. Huang, S.P.; Weir, B.S. Estimating the total number of alleles using a sample coverage method. Genetics 2001, 159, 1365–1373. [Google Scholar] [PubMed]
  35. Liu, W.X.; Li, L.H.; Liu, W.H. SSR analysis on the sampling strategy of Psathyrostachys huashanic Keng population. J. Triticeae Crops 2006, 26, 16–20. [Google Scholar]
  36. Fitzpatrick, B.M. Power and sample size for nested analysis of molecular variance. Mol. Ecol. 2009, 18, 3961–3966. [Google Scholar] [CrossRef] [PubMed]
  37. Rohlf, F.J. NTSYS-pc: Numerical Taxonomy and Multivariate Analysis System; Exeter Software: New York, NY, USA, 1992. [Google Scholar]
  38. Pavlicek, A.; Hrda, S.; Flegr, J. FreeTree-freeware program for construction of phylogenetic trees on the basis of distance data and bootstrap/jackknife analysis of the tree robustness. Application in the RAPD analysis of genus Frenkelia. Folia Biol. 1999, 45, 97–99. [Google Scholar]
  39. Pritchard, J.K.; Stephens, M.; Donnelly, P. Inference of population structure using multilocus genotype data. Genetics 2000, 155, 945–959. [Google Scholar] [PubMed]
  40. Evanno, G.; Regnaut, S.; Goudet, J. Detecting the number of clusters of individuals using the software structure: A simulation study. Mol. Ecol. 2005, 14, 2611–2620. [Google Scholar] [CrossRef] [PubMed]
  41. Excoffier, L.; Laval, G.; Schneider, S. Arlequin (version 3.0): An integrated software package for population genetics data analysis. Evol. Bioinform. 2005, 1, 47–50. [Google Scholar]
  42. Prevost, A.; Wilkinson, M. A new system of comparing PCR primers applied to ISSR fingerprinting of potato cultivars. Theor. Appl. Genet. 1999, 98, 107–112. [Google Scholar] [CrossRef]
  43. Yeh, F.; Yang, R.; Boyle, T. Quick User Guide. In Popgene; University of Alberta: Edmonton, AB, Canada, 1999. [Google Scholar]
Sample Availability: Samples of the compounds are available from the authors.
Figure 1. Polymorphism Information Content of the four accessions at different sampling sizes. (a) LJ. 1; (b) LJ. 3; (c) IL. 17; (d) BE. 33.
Molecules 22 00567 g001
Figure 2. The Unweighted Pair Group Method with Arithmetic Mean (UPGMA) dendrogram of common vetch based on Jaccard’s genetic similarity; only bootstrap values higher than 50% are presented. (a) Forty individuals of four germplasm; (b) 240 individuals of four germplasm and the genetic distance of start codon targeted (SCoT) markers.
Molecules 22 00567 g002
Figure 3. STRUCTURE analysis of the genetic structure of the four vetch accessions. The maximum delta KK) values were calculated to determine the topmost level of structure for K ranging from 2 to 8 (each with 10 independent runs). Here, K was four and four clusters. One color represented one cluster. The red: LJ. 3; The green: LJ. 1; The blue: BE. 33; The yellow: IL. 17. (a) The genetic structure of 10 individuals for each of the four accessions as inferred by STRUCTURE with the SCoT markers data set; (b) The genetic structure of 60 individuals for each of the four accessions as inferred by STRUCTURE with the SCoT markers data set.
Molecules 22 00567 g003
Table 1. Names of common vetch accessions and their origins.
AccessionsType of AccessionsSample CodeOrigin of Germplasm
LJ. 1Cultivated variety, Lanjian No. 11–60China
LJ. 3Cultivated variety, Lanjian No. 361–120China
IL. 17Wild accession, No. 17121–180Israel
BE. 33Wild accession, No. 33181–240Belgium
Table 2. Expected heterozygosity (HE), the observed number of alleles (Na) and the Reserve Percentage (RP) at different sampling sizes of the four accessions.
Sampling No. (Sampling Size)LJ. 1LJ. 3IL. 17BE. 33
NaRPHENaRPHENaRPHENaRPHE
1 (1)6758%0.98515956%0.98235657%0.98225855%0.9825
2 (2)8775%0.98747269%0.98477172%0.98467269%0.9849
3 (3)9784%0.98827470%0.98457980%0.98517975%0.9853
4 (5)10489%0.98868480%0.98568788%0.98548581%0.9857
5 (8)10893%0.98898884%0.98548889%0.98569187%0.9857
6 (10)11297%0.98909590%0.98569192%0.98569490%0.9858
7 (20)11397%0.98899691%0.98559596%0.98579893%0.9860
8 (30)11498%0.989010095%0.98579798%0.985810095%0.9859
9 (40)11599%0.989010297%0.98579899%0.985710499%0.9860
10 (50)116100%0.989010398%0.985799100%0.985810499%0.9860
11 (60)116100%0.9890105100%0.985799100%0.9858105100%0.9860
Table 3. The Fixation index values (FST) and the Shannon information index of the four accessions.
Sampling No. (Sampling Size)LJ. 1LJ. 3IL. 17BE. 33
1 (1)0.000.000.000.00
2 (2)0.250.310.330.34
3 (3)0.340.370.360.37
4 (5)0.350.400.390.39
5 (8)0.390.410.420.42
6 (10)0.440.440.440.45
7 (20)0.440.430.440.45
8 (30)0.430.440.440.44
9 (40)0.440.450.450.45
10 (50)0.450.450.450.45
11 (60)0.450.450.450.45
Shannon information index0.670.680.690.69
Table 4. The Resolving Power (Rp), the Expected Heterozygosity (HE) and Polymorphism Information Content (PIC) of each primer in each accession.
PrimerLJ. 1LJ. 3IL. 17BE. 33
RpHEPICRpHEPICRpHEPICRpHEPIC
Scot288.530.94420.94135.900.92820.92353.070.88340.87206.000.91140.9046
Scot3513.670.94130.93816.400.92160.916010.730.93440.930511.100.93450.9306
Scot3613.900.95180.94967.500.91940.91384.200.93740.93377.430.92160.9161
Scot379.170.94080.93764.330.92480.91979.100.92750.92276.100.93090.9266
Scot388.630.95110.94885.870.94420.94126.030.94450.94162.670.94920.9467
Table 5. Information for the 25 SCoT primers used in screening in materials.
PrimerPrimer Sequence (5′-3′)PrimerPrimer Sequence (5′-3′)
Scot12ACGACATGGCGACCAACGScot41CAATGGCTACCACTGACA
Scot13ACGACATGGCGACCATCGScot42CAATGGCTACCATTAGCG
Scot14ACGACATGGCGACCACGCScot43CAATGGCTACCACCGCAG
Scot15ACGACATGGCGACCGCGAScot44CAATGGCTACCATTAGCC
Scot16ACCATGGCTACCACCGACScot45ACAATGGCTACCACTGAC
Scot23CACCATGGCTACCACCAGScot46ACAATGGCTACCACTGAG
Scot28CCATGGCTACCACCGCCAScot47ACAATGGCTACCACTGCC
Scot35CATGGCTACCACCGGCCCScot48ACAATGGCTACCACTGGC
Scot36GCAACAATGGCTACCACCScot49ACAATGGCTACCACTGCG
Scot37CAATGGCTACCACTAGCCScot50ACAATGGCTACCACTGGG
Scot38CAATGGCTACCACTAACGScot51ACAATGGCTACCACTGTC
Scot39CAATGGCTACCACTAGCGScot52ACAATGGCTACCACTGCA
Scot40CAATGGCTACCACTACAG
Table 6. Information for the five SCoT primers used in the genetic diversity analysis in common vetch.
PrimerTm/°CPPBNaHEPICRange of Band Size (bp)
Scot2861.9100%250.93740.9339200–2100
Scot3564.1100%210.94290.9400200–1900
Scot3657.3100%290.95400.9520240–2200
Scot3761.9100%230.94440.9415250–2400
Scot3861.9100%240.95180.9496220–1800
Average 100%24.40.94610.9434
Note: PPB: Percentage of Polymorphic Bands; Na: Observed number of alleles; HE: Expected Heterozygosity; PIC: Polymorphic Information Content.

