
Bioactive Components from Qingwen Baidu Decoction against LPS-Induced Acute Lung Injury in Rats

 , ,
, ,
Abstract
: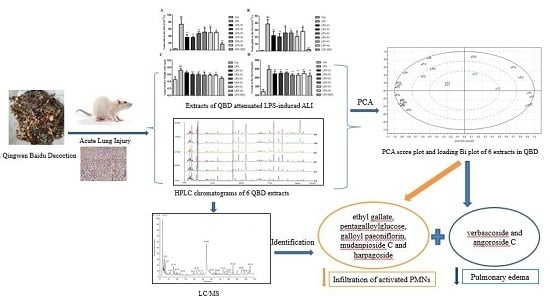
1. Introduction
2. Results
2.1. QBD Decreases LPS-Induced ALI in Rat
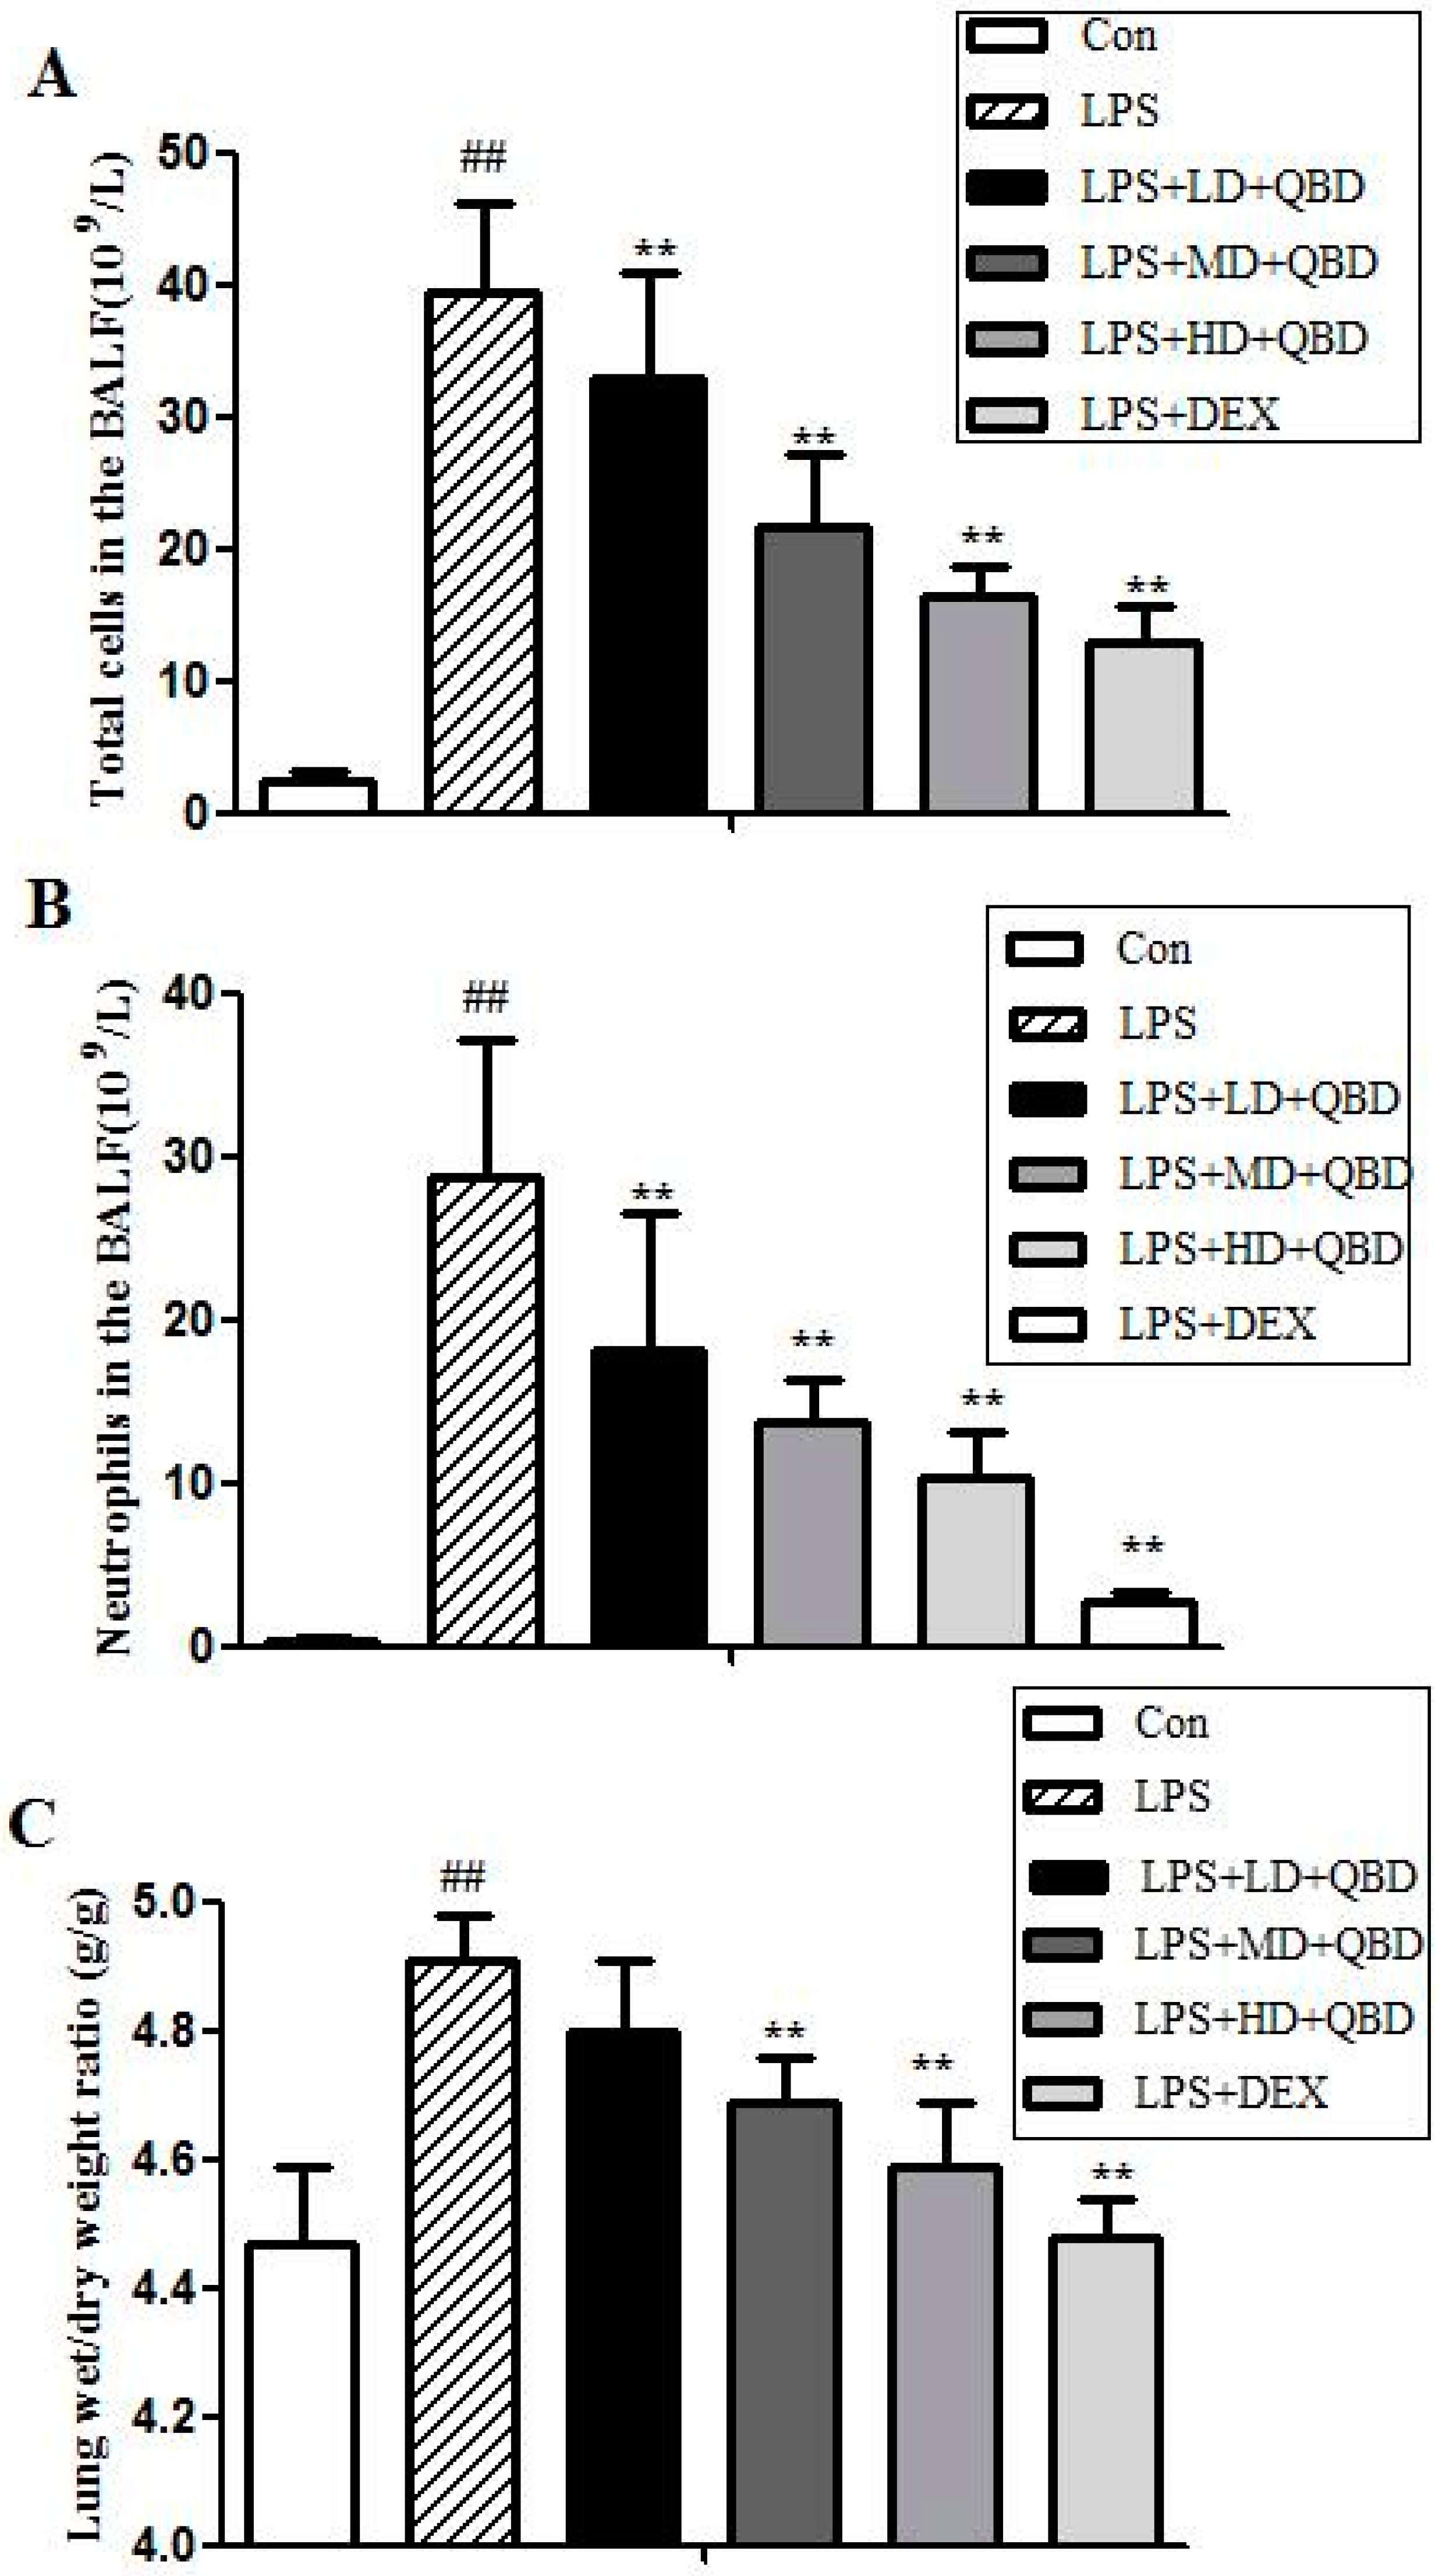
2.1.1. QBD Decreases LPS-Induced Cell Infiltration
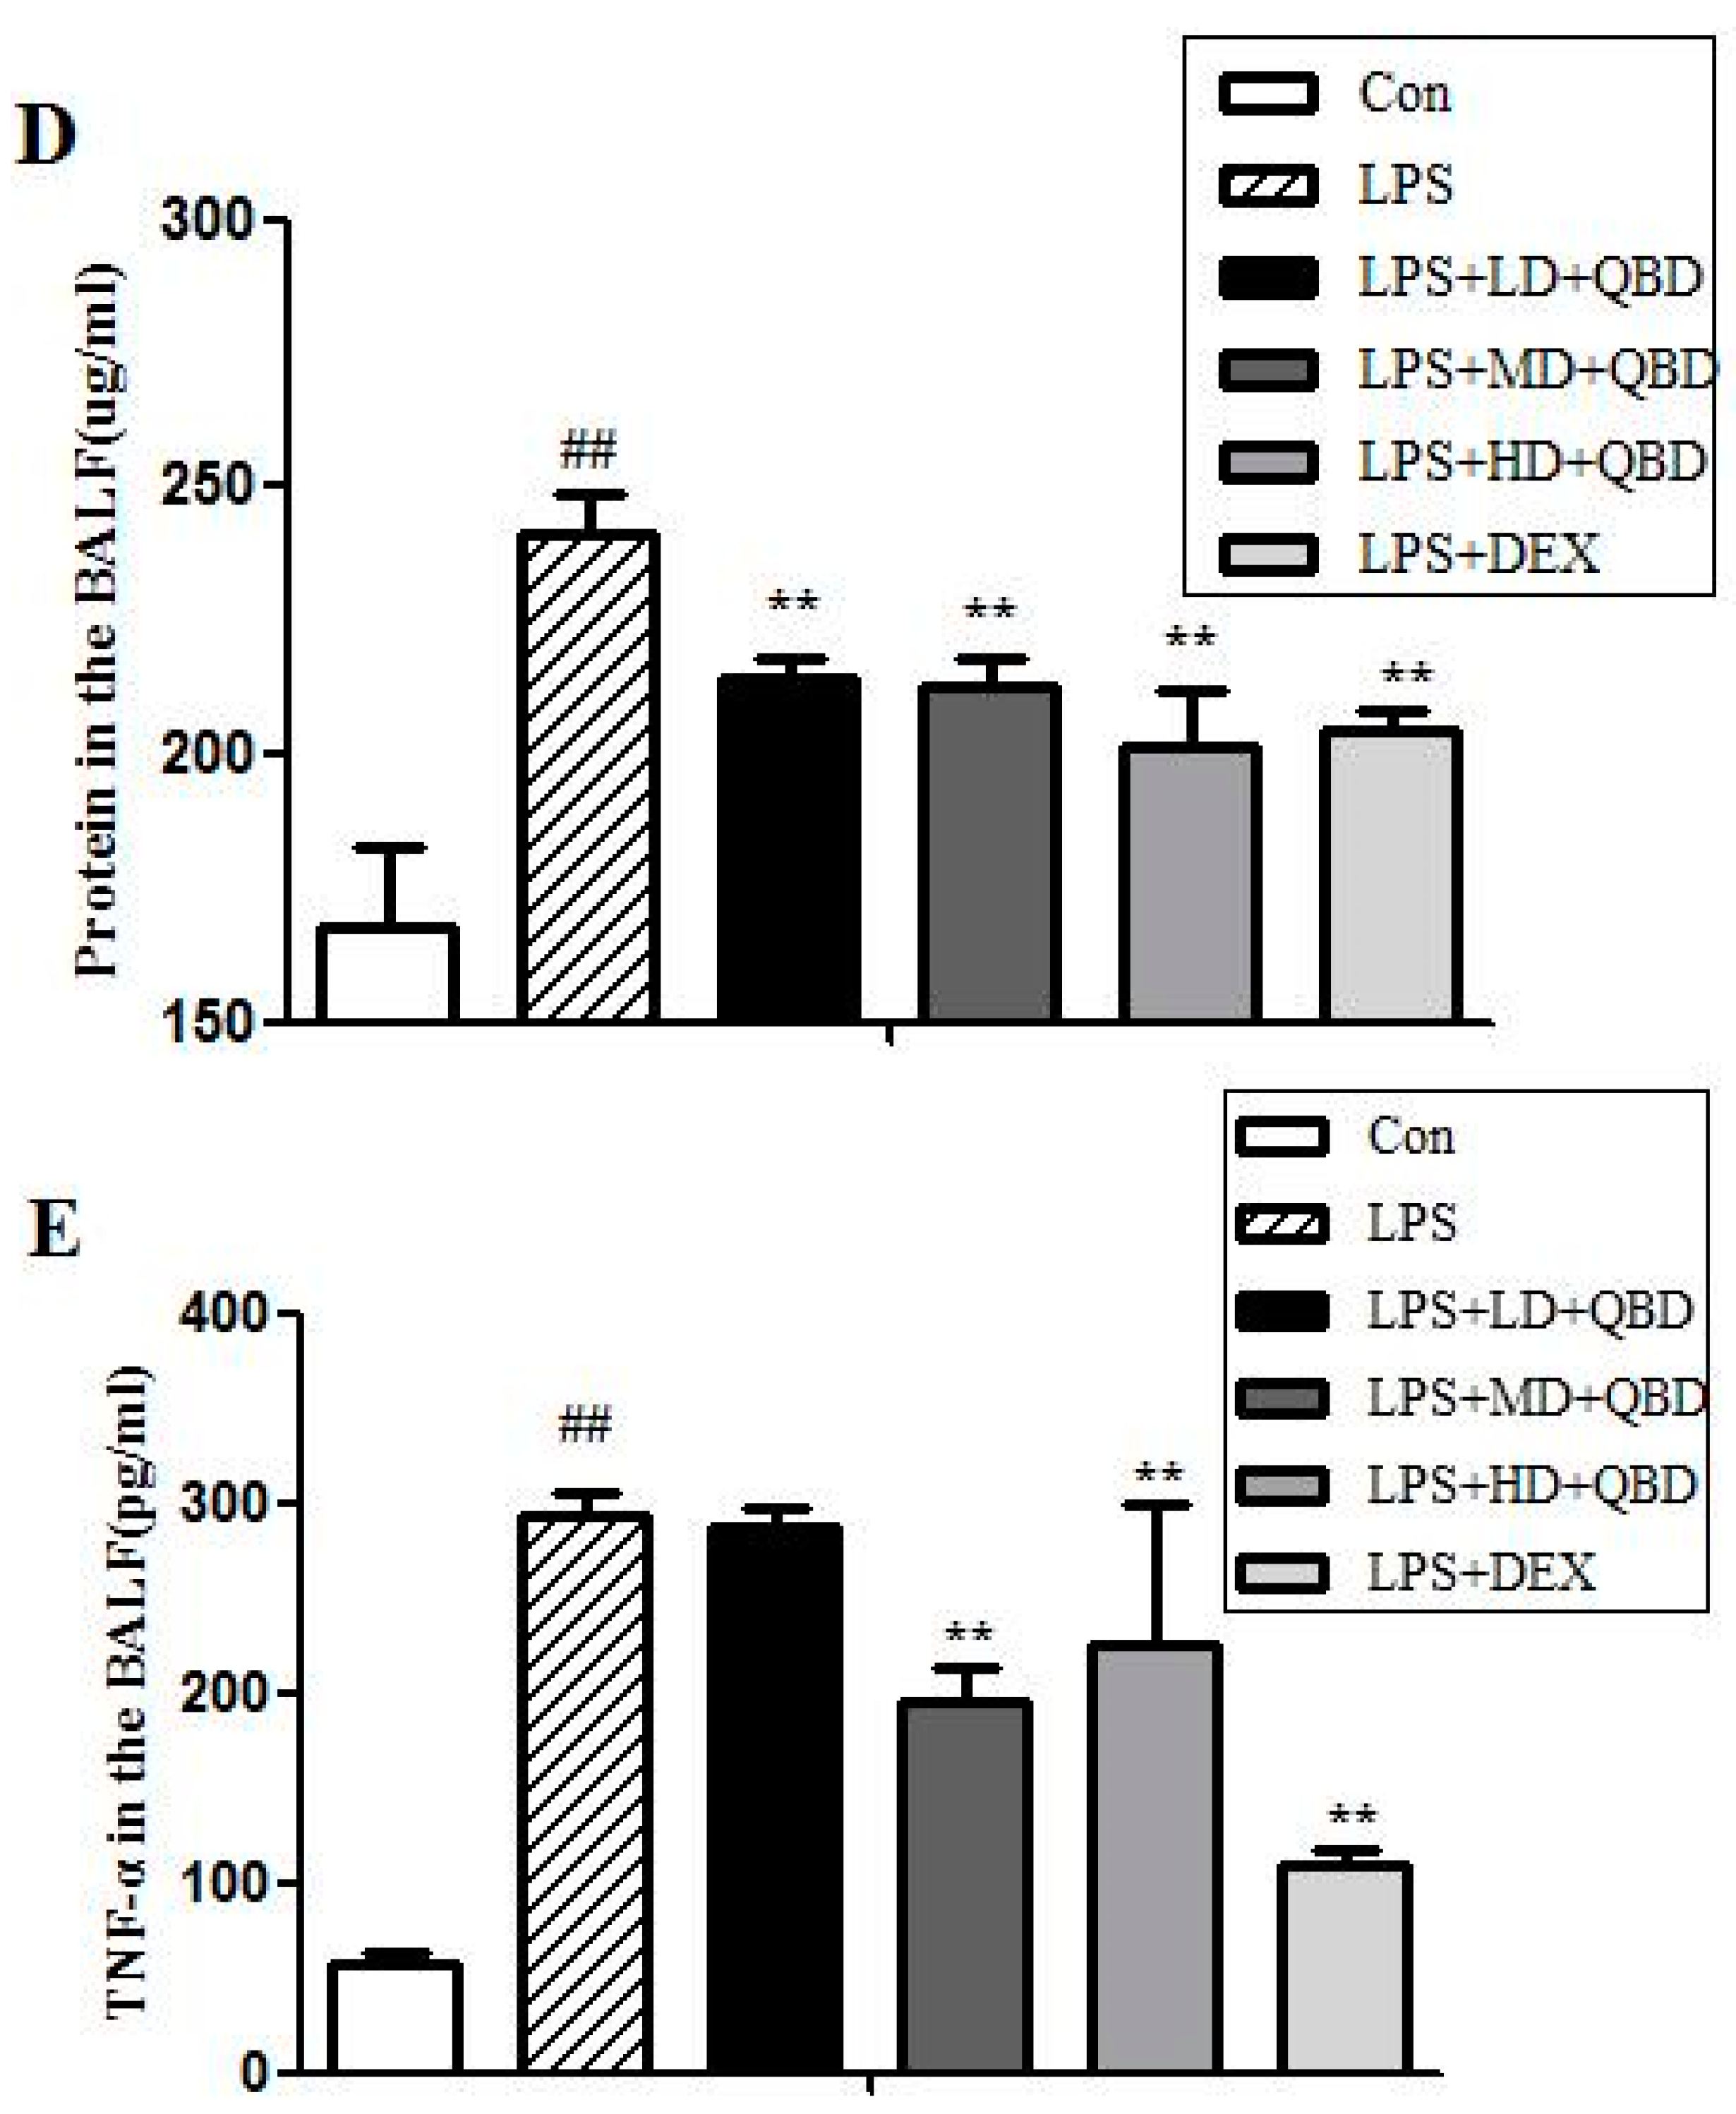
2.1.2. QBD Attenuated LPS-Induced Protein Leakage and Pulmonary Edema
2.1.3. Effects of QBD on LPS-Induced TNF-α in BALF
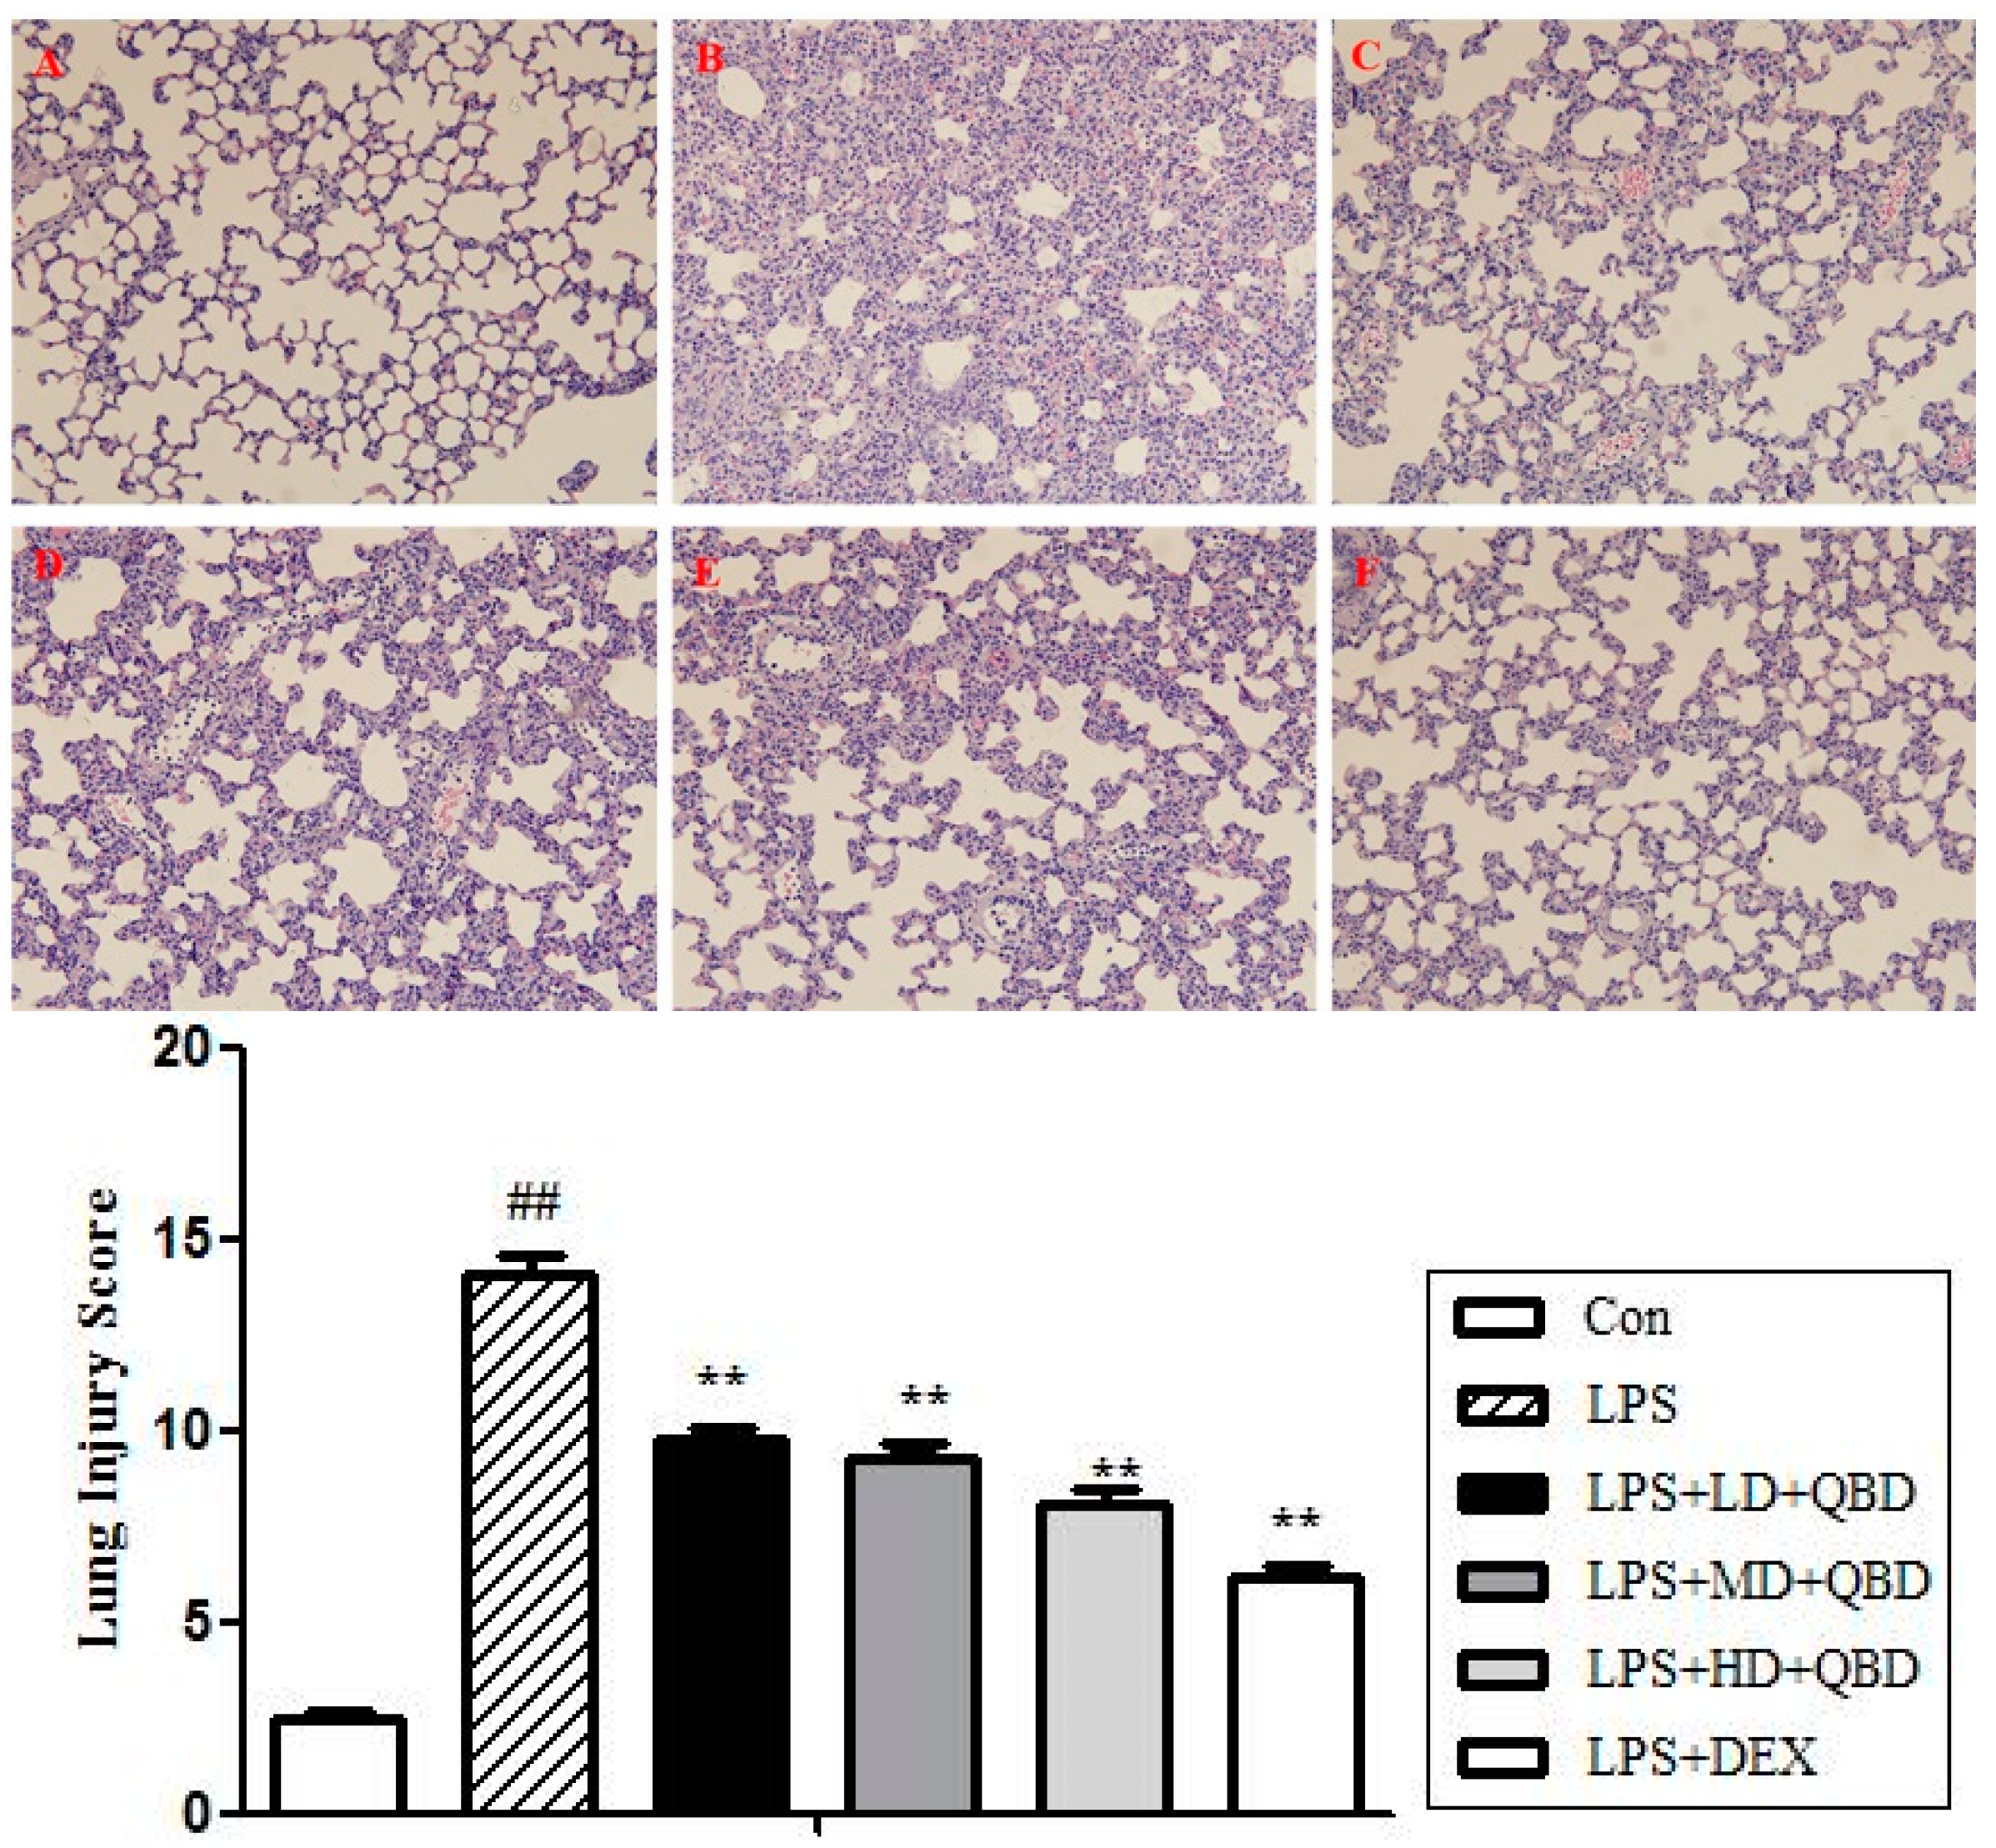
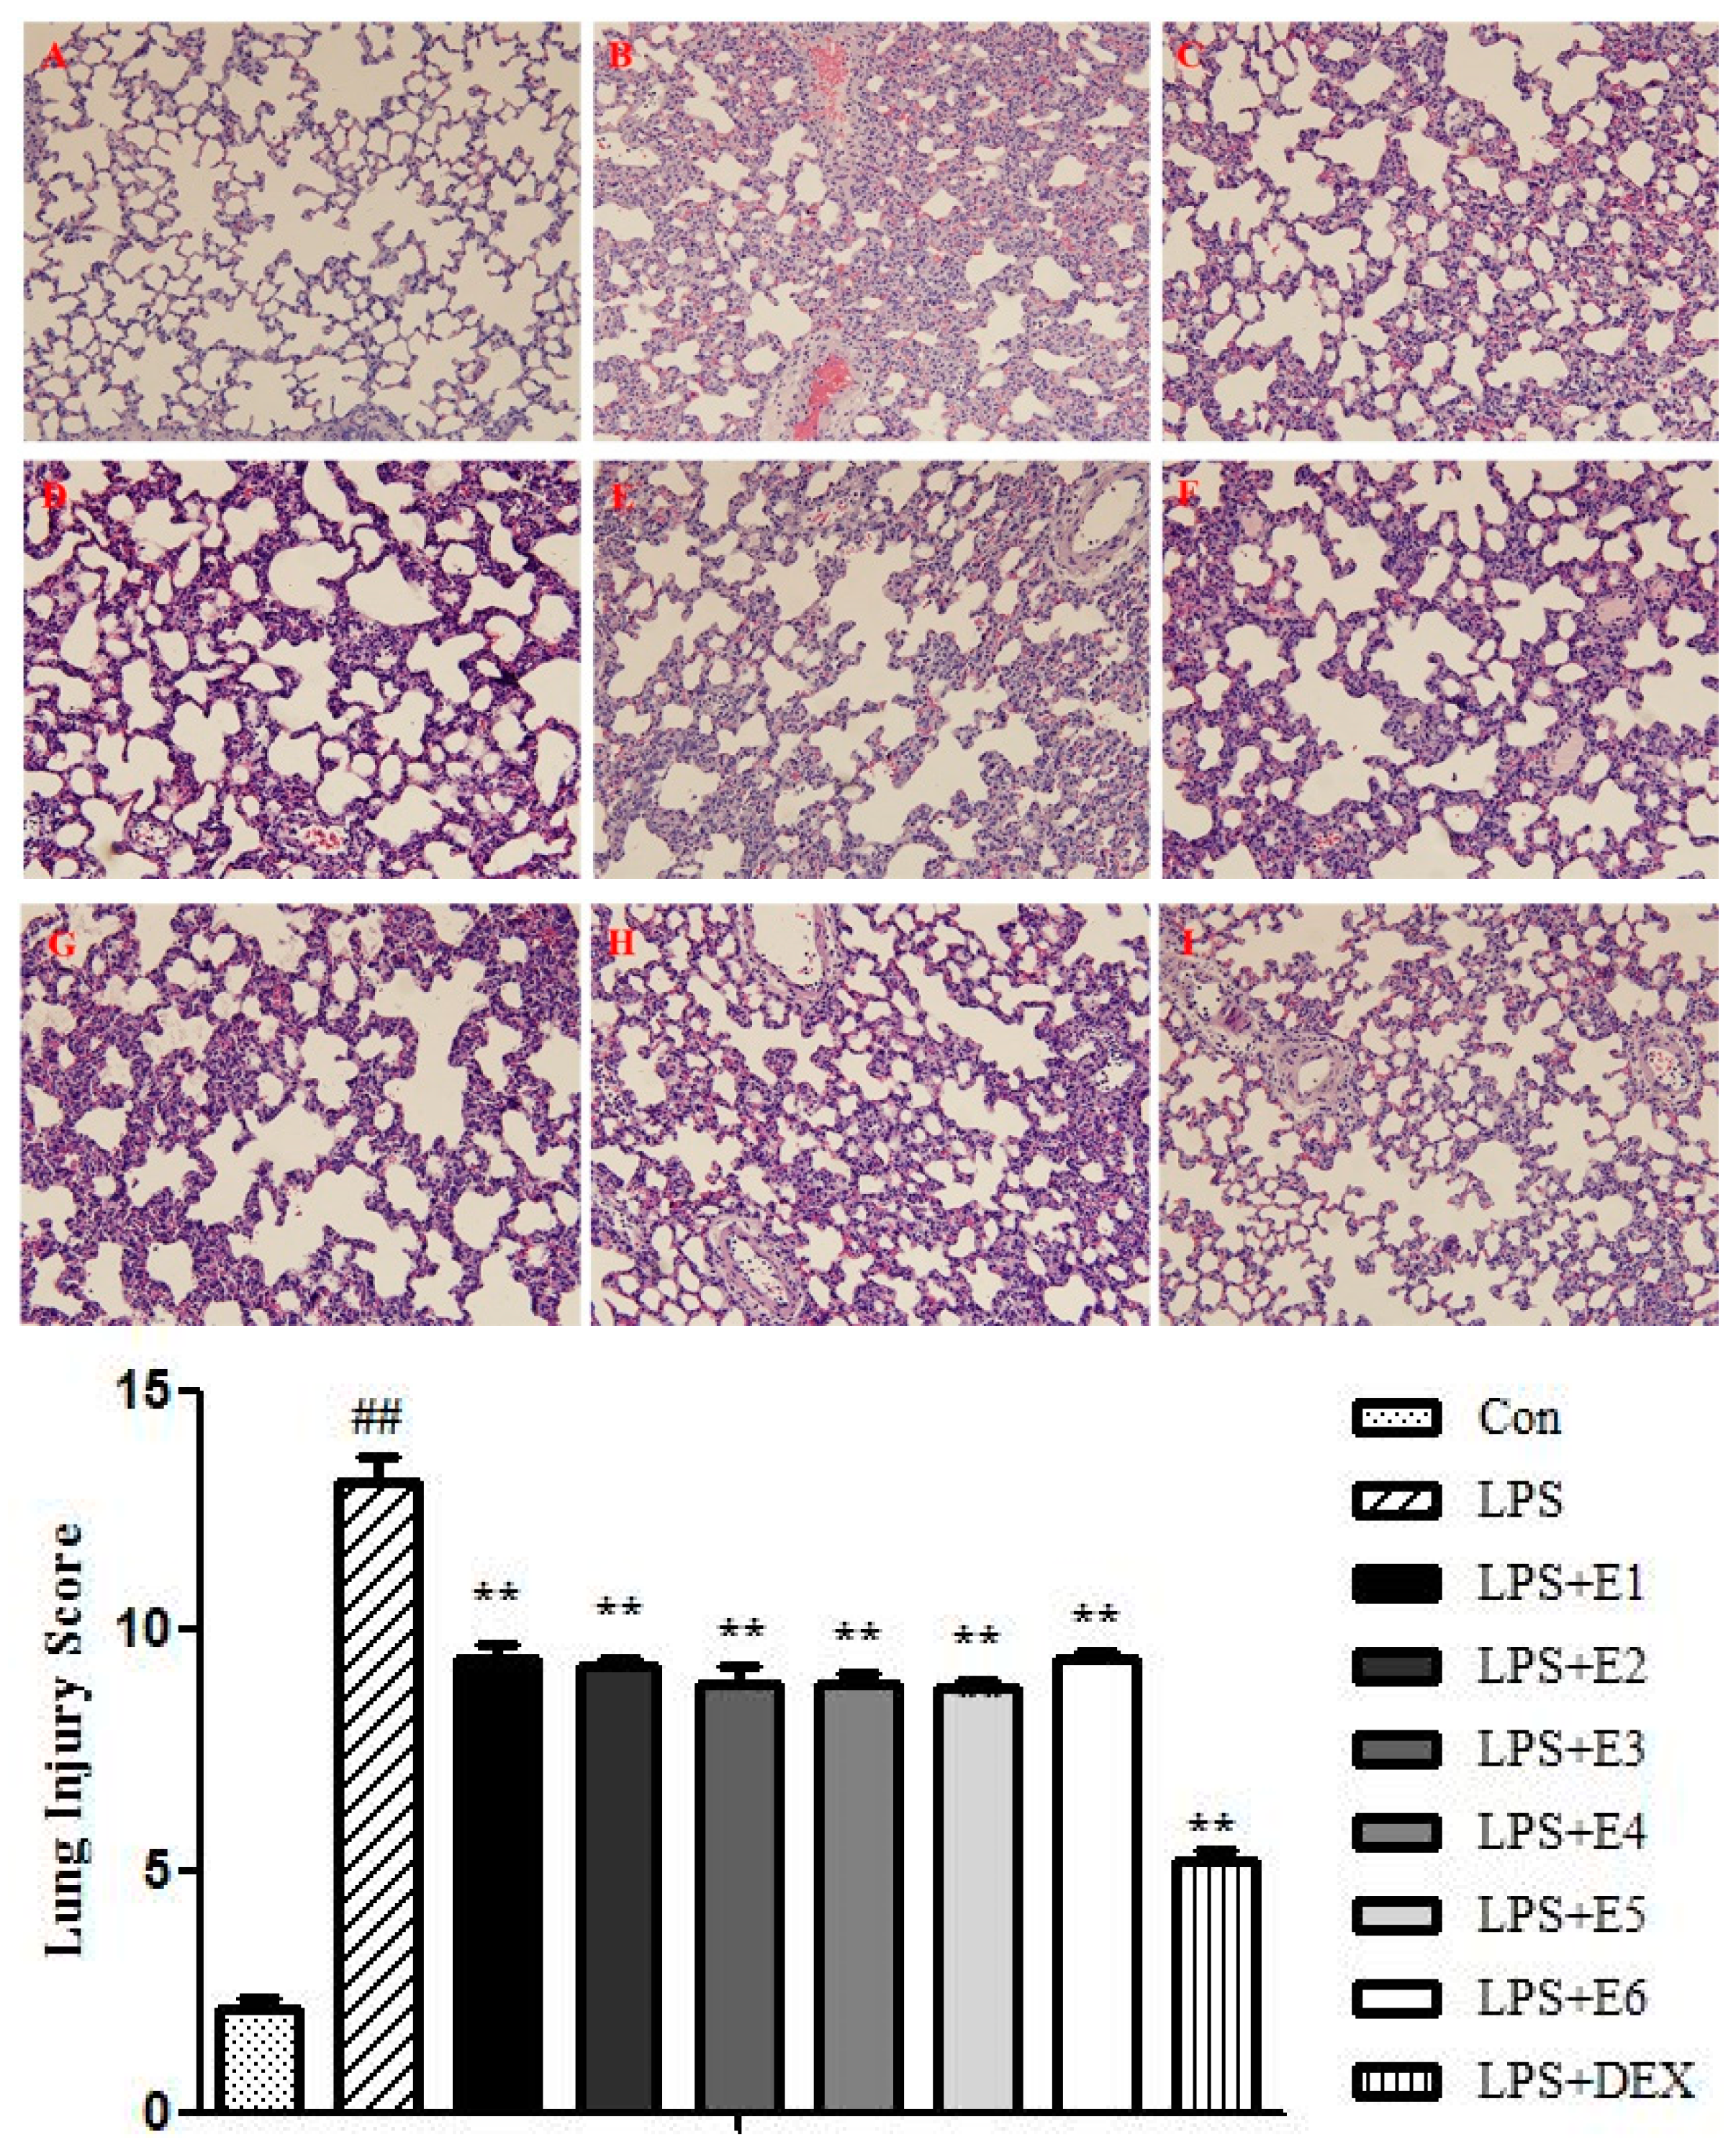
2.1.4. QBD Improved Lung Histopathology in ALI
2.2. Extracts of QBD Attenuated LPS-Induced ALI
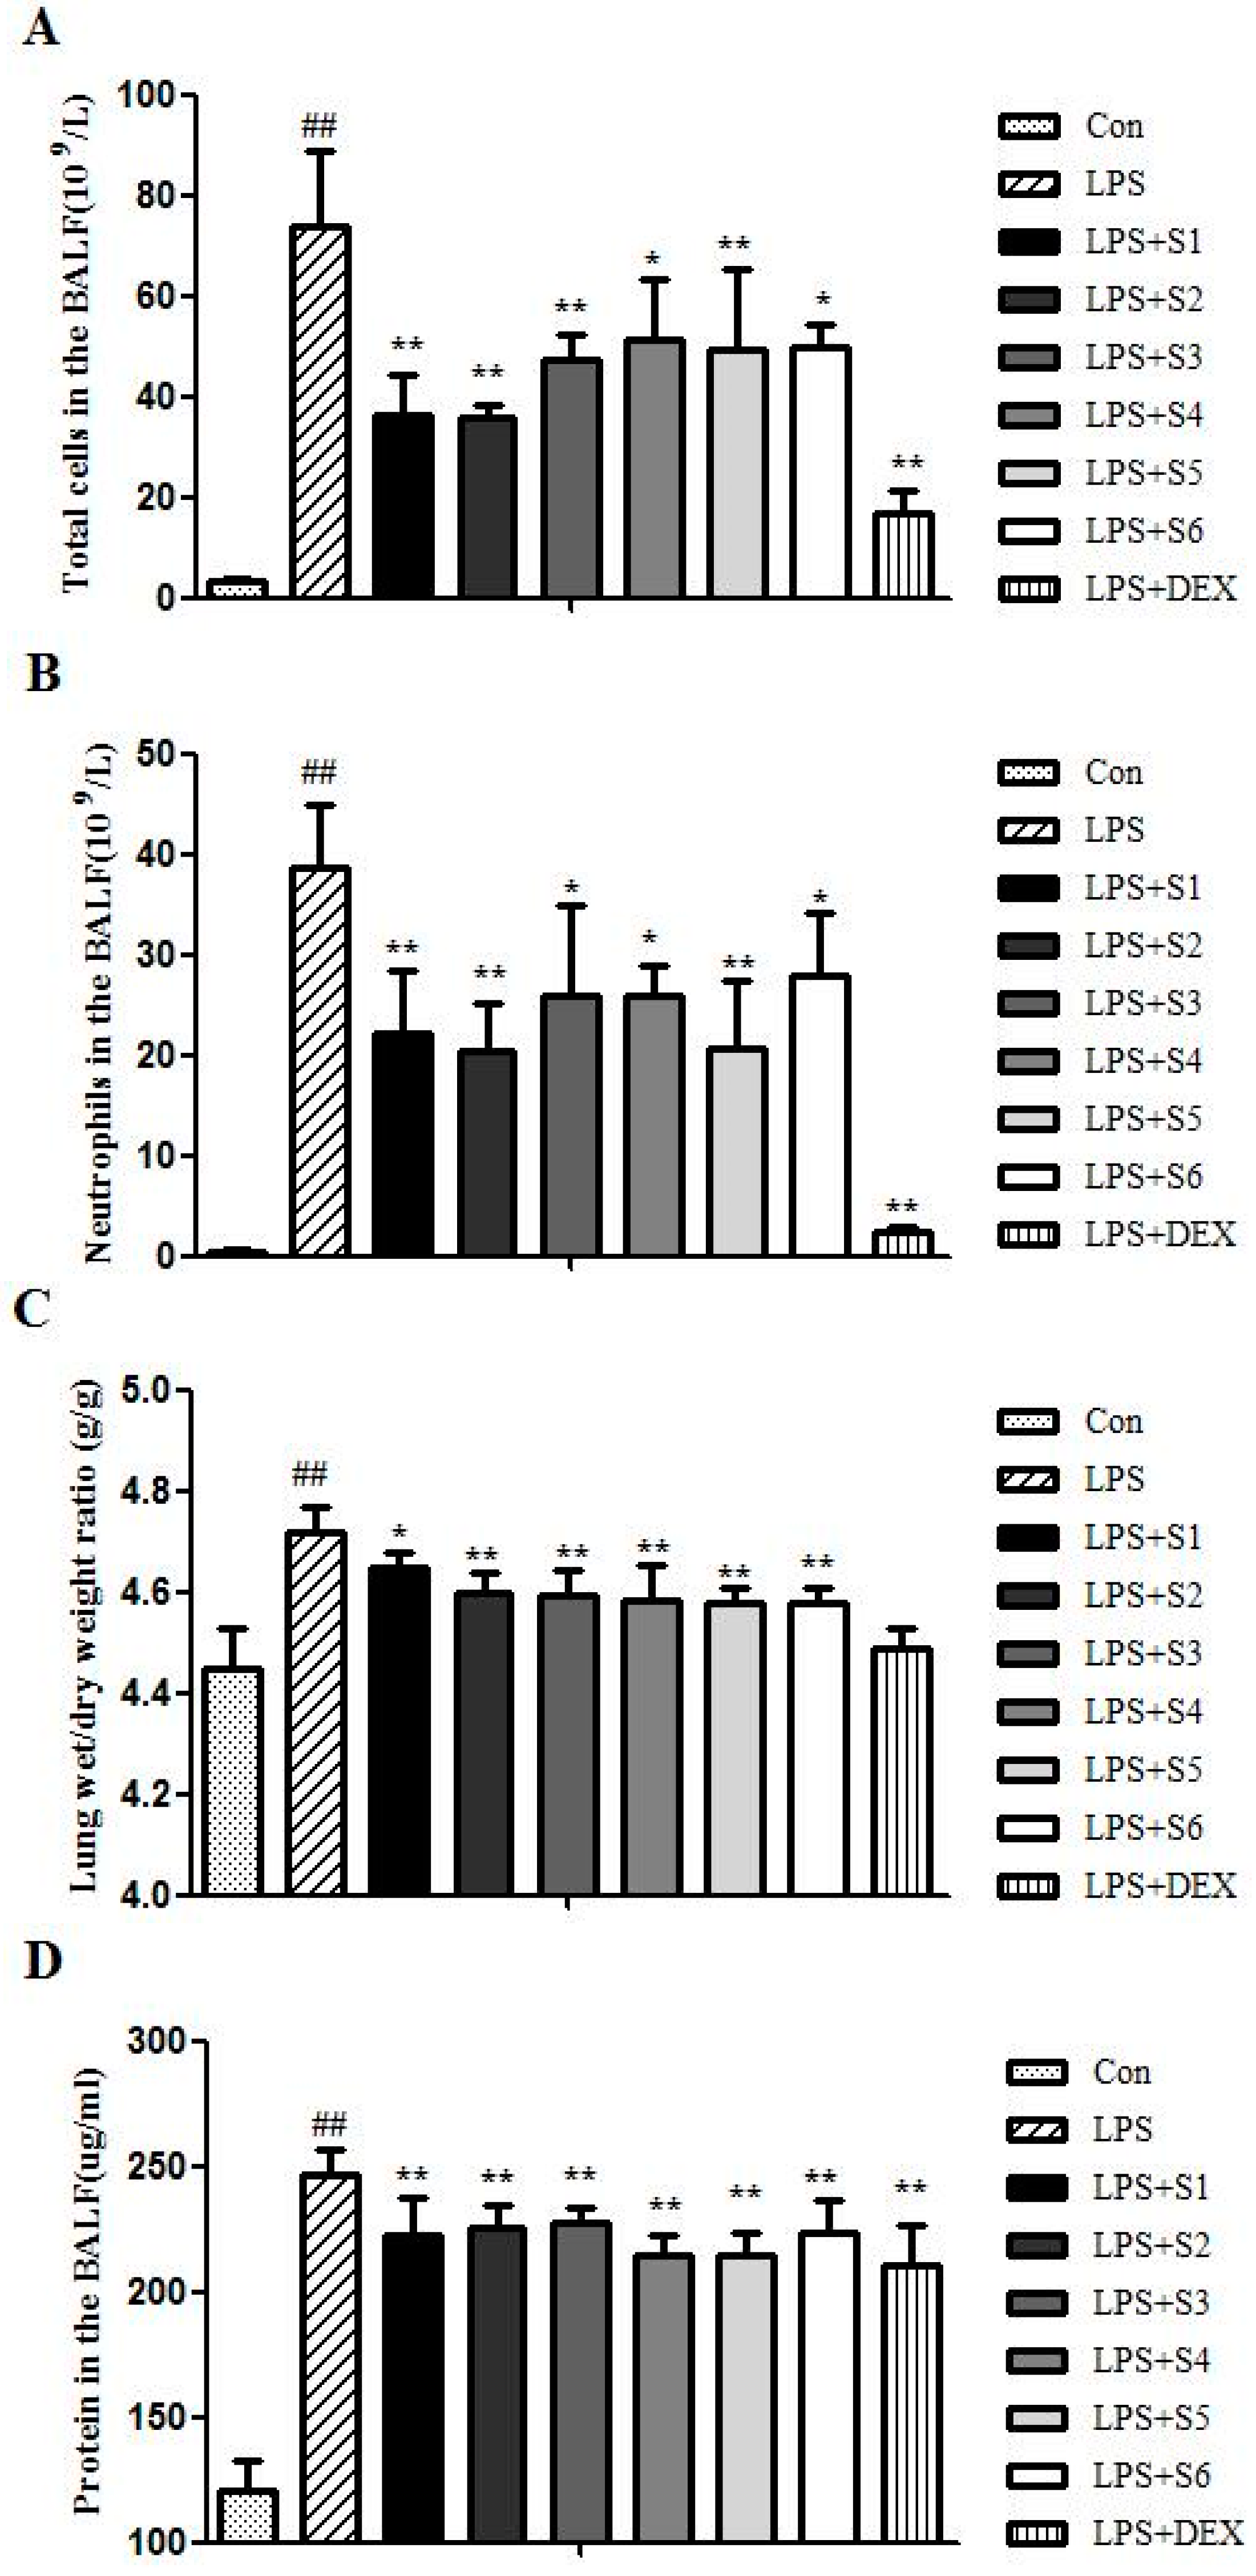
2.2.1. Extracts of QBD Decreased LPS-Induced Cell Infiltration
2.2.2. Extracts of QBD Attenuated LPS-Induced Protein Leakage and Pulmonary Edema
2.2.3. Extracts of QBD Improved Lung Histopathology in ALI
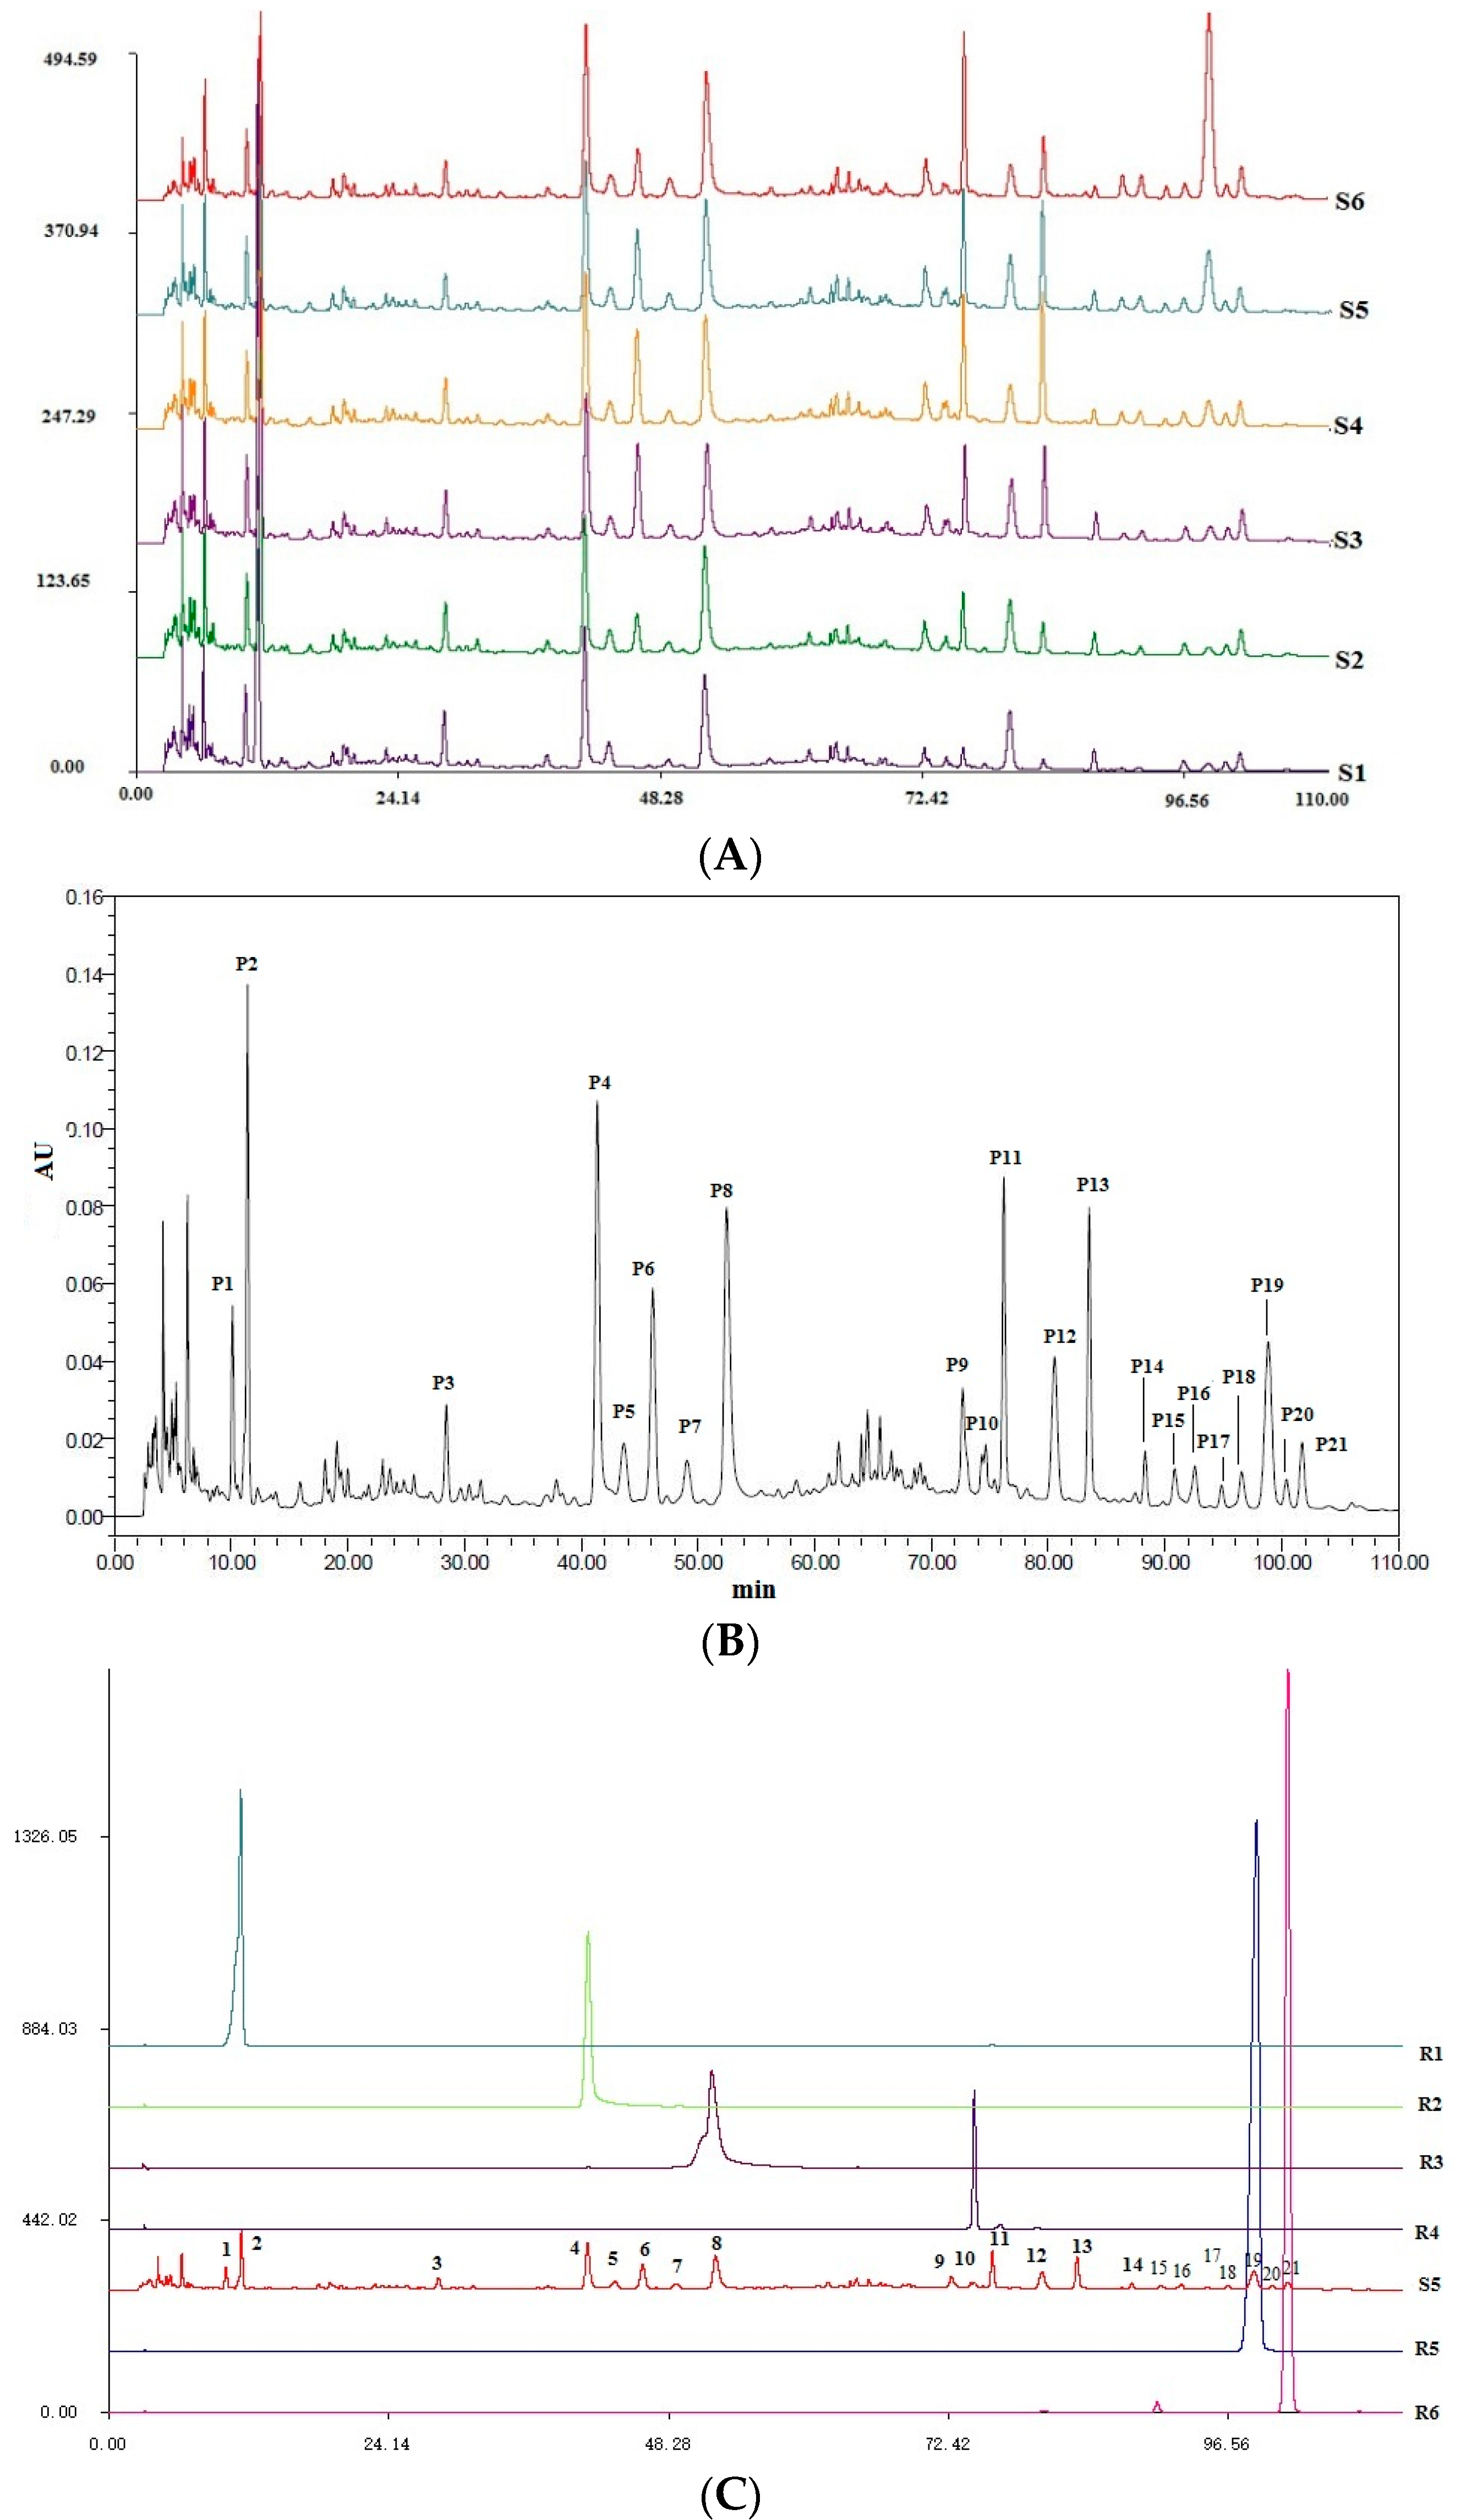
2.3. Quality Control of Six Extracts in QBD
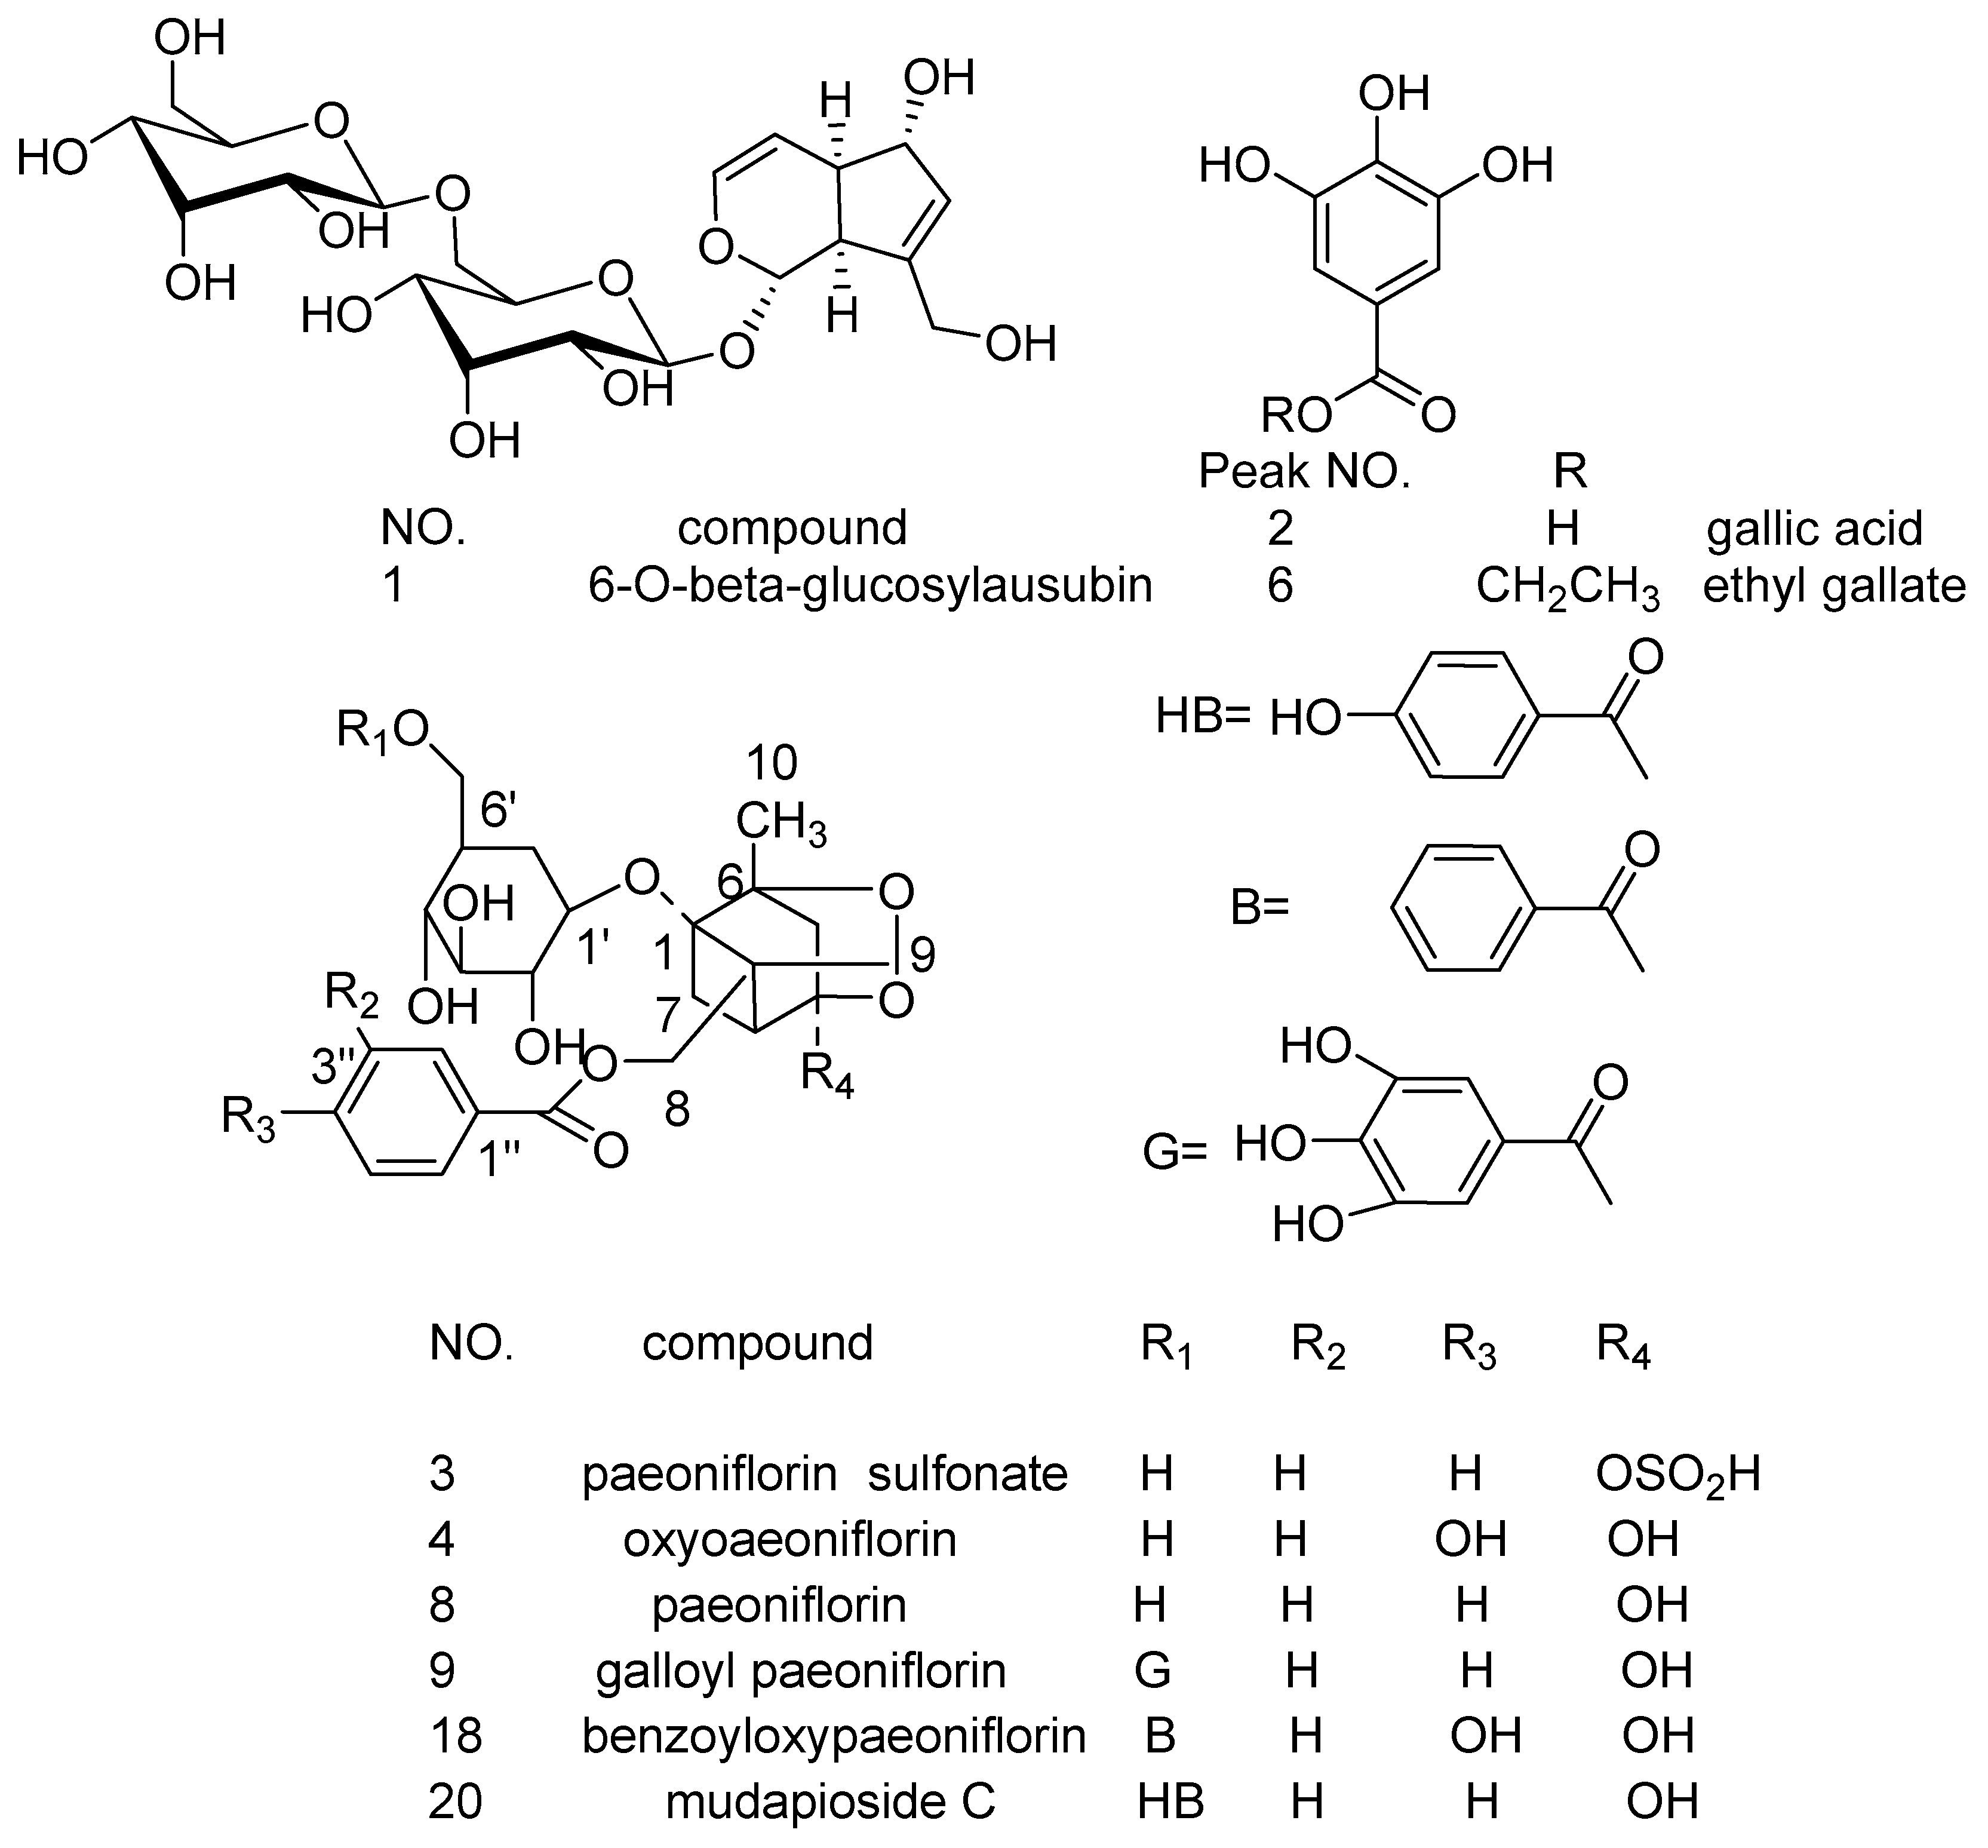
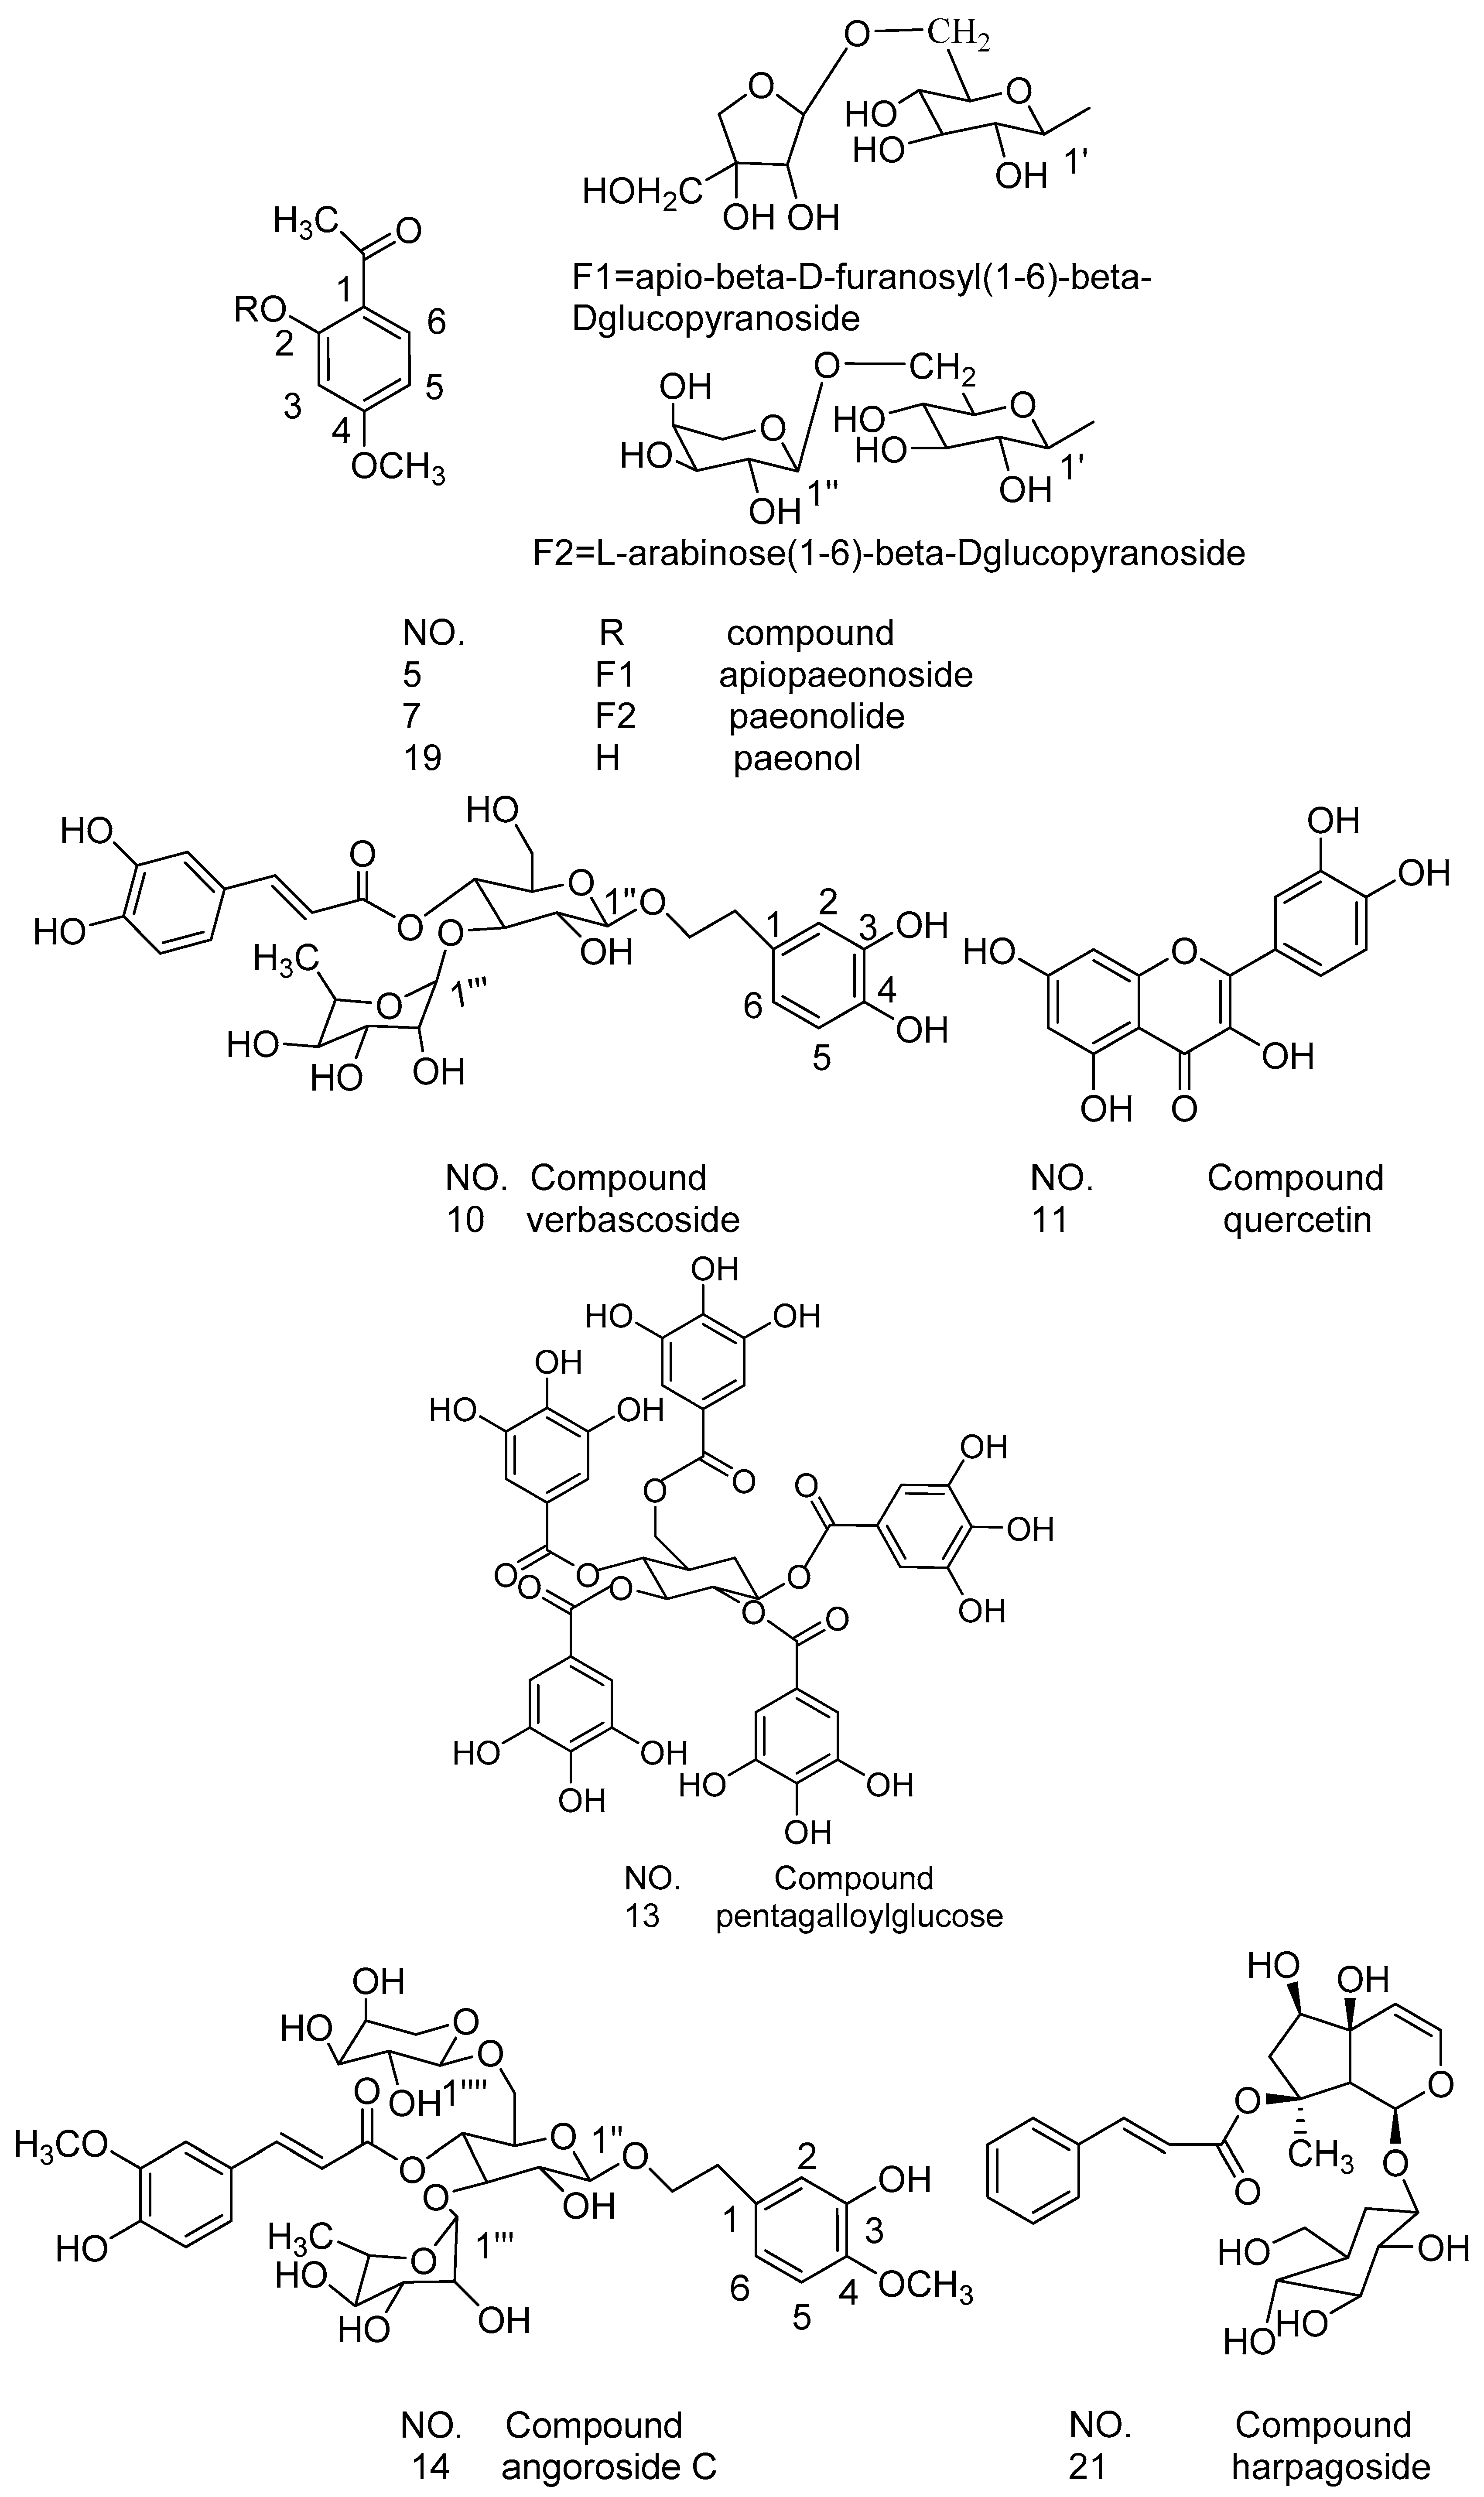
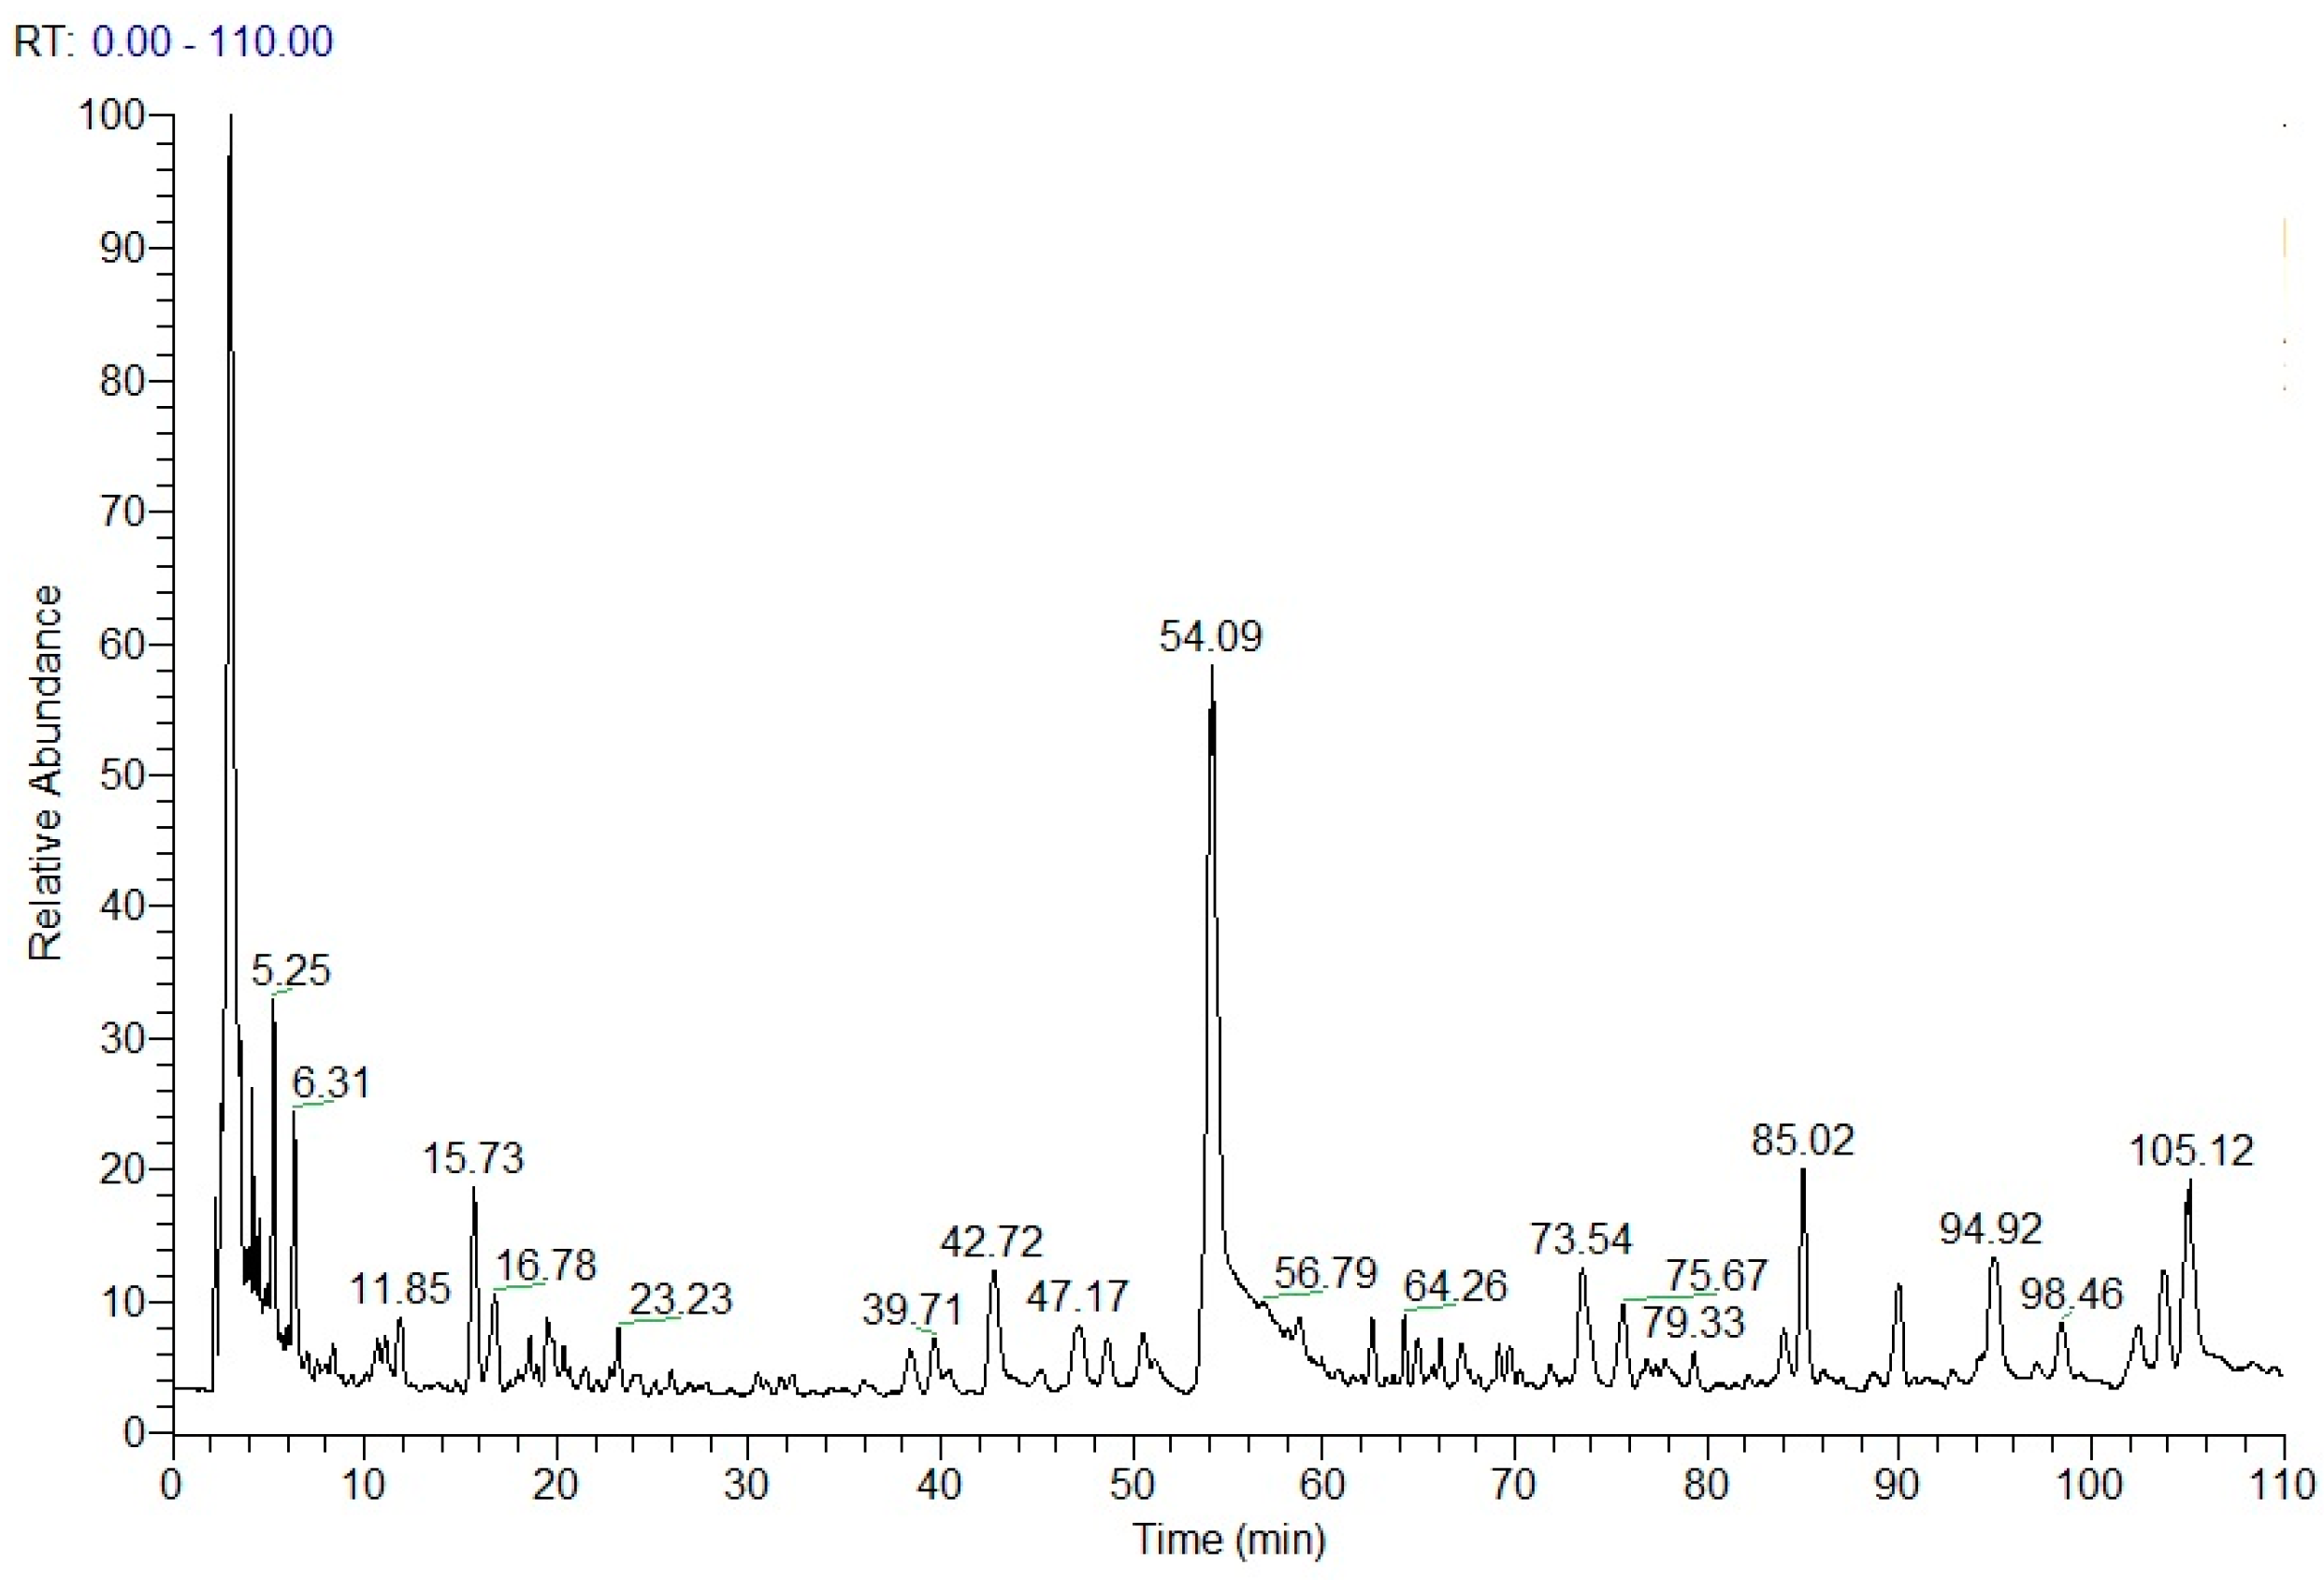
2.4. Chemical Structure Analysis by HPLC-DAD-ESI-MSn
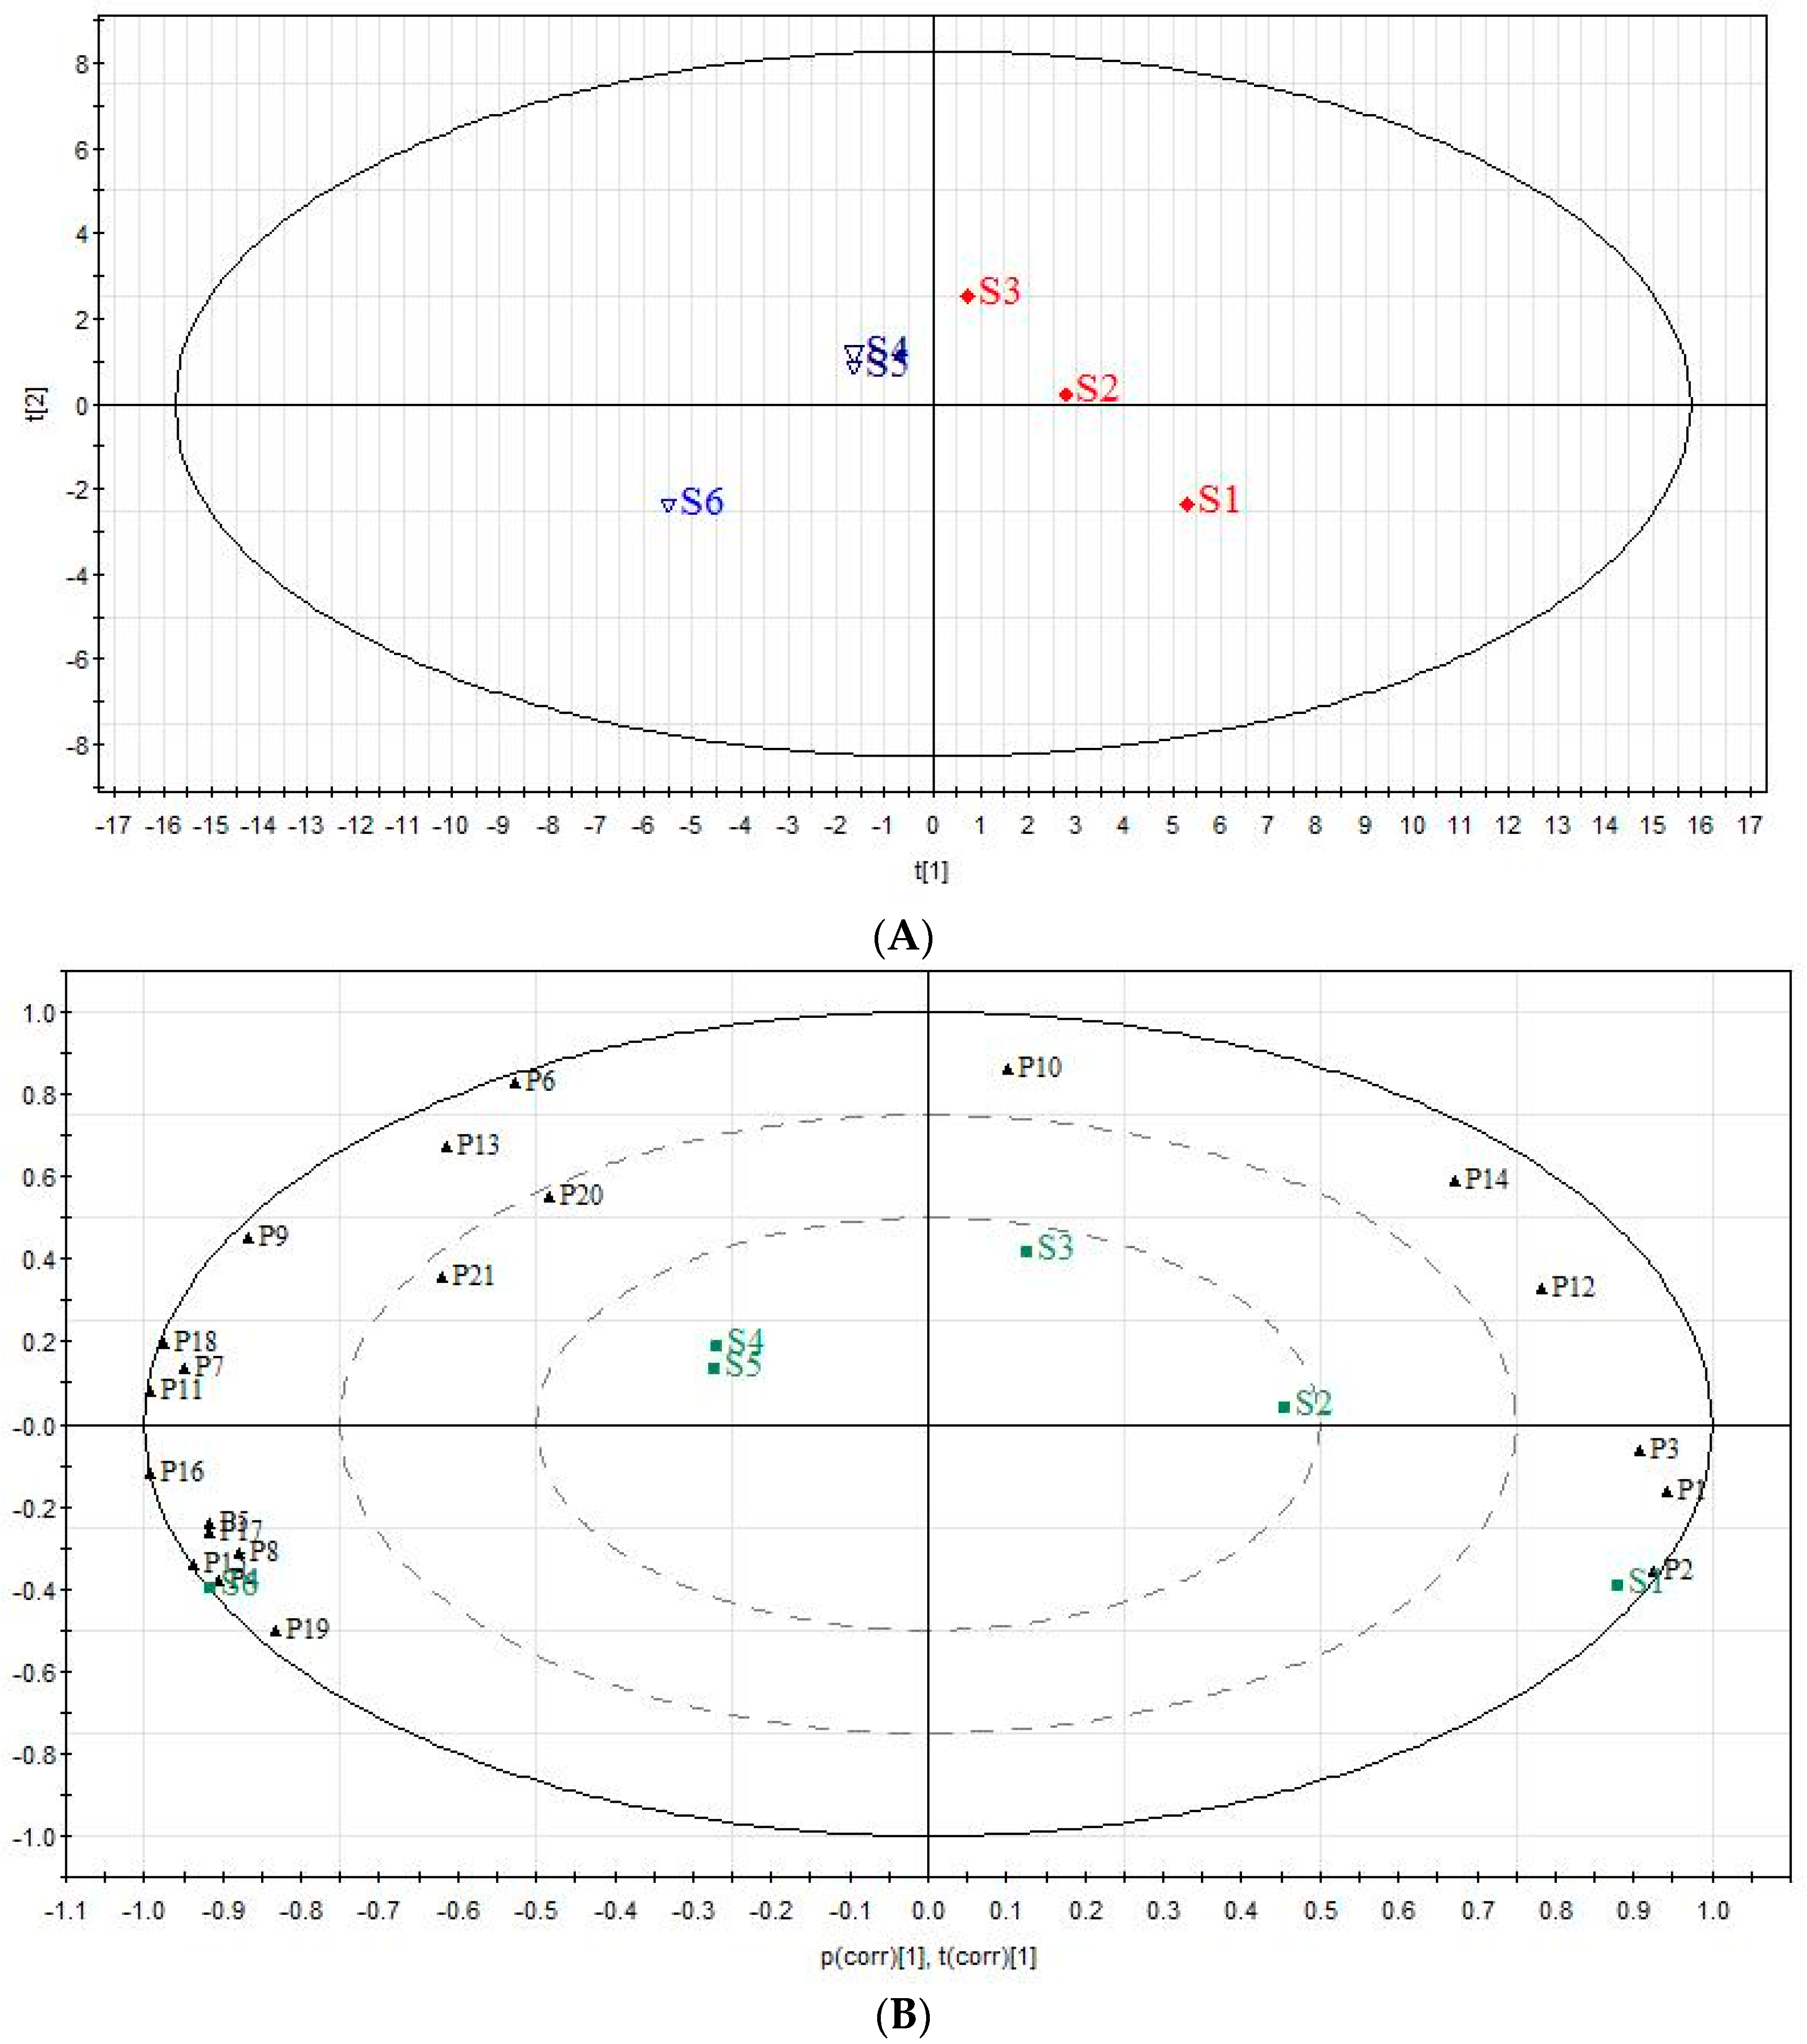
2.5. The Analysis of Chemical Components Changes of Six Extracts in QBD from PCA
3. Discussion
4. Materials and Methods
4.1. Chemicals and Reagents
4.2. Animal Experiments
4.2.1. Animals and Housing
4.2.2. Preparation of QBD and Its Extracts
4.2.3. Treatment of Animals
4.2.4. Measurement of Cytokines, Cell Counts and Protein Concentration in BALF
4.2.5. Wet-To-Dry Lung Weight Ratio (W/D Ratio)
4.2.6. Histological Analysis of Lungs
4.3. Quality Control of Extracts
4.4. Dereplication by HPLC-DAD-ESI-MSn
4.5. Principal Component Analysis
4.6. Statistical Analysis
5. Conclusions
Supplementary Materials
Acknowledgments
Author Contributions
Conflicts of Interest
Abbreviations
| QBD | Qingwen Baidu Decoction |
| ALI | Acute Lung Injury |
| LPS | Lipopolysaccharide |
| PCA | Principal Component Analysis |
| PMNs | polymorphonuclear leukocytes |
| ARDS | Acute respiratory distress syndrome |
| ICU | intensive care units |
| TCMs | traditional Chinese medicines |
| BALF | Bronchoalveolar Lavage Fluid |
| W/D ratio | wet-to-dry lung weight ratio |
| TNF-α | tumor necrosis factor-a |
| DEX | Dexamethasone |
| RPA | relative peak areas |
| NS | normal saline |
| CID | collision induced dissociation |
| ANOVA | one-way analysis of variance |
References
- Ware, L.B.; Matthay, M.A. The acute respiratory distress syndrome. N. Engl. J. Med. 2000, 342, 1334–1349. [Google Scholar] [CrossRef] [PubMed]
- Fernando, F.V.; Ferguson, N.D.; Esteban, A. Epidemiology of acute lung injury and acute respiratory distress syndrome. Semin. Respir. Crit. Care Med. 2006, 27, 327–336. [Google Scholar]
- Rubenfeld, G.D.; Caldwell, E.; Peabody, E.; Weaver, D.; Martin, L.D.; Hudson, J.; Neff, M.; Stern, C.E. Incidence and outcomes of acute lung injury. N. Engl. J. Med. 2005, 353, 1685–1693. [Google Scholar] [CrossRef] [PubMed]
- Piantadosi, C.A.; Schwartz, D.A. The Acute Respiratory Distress syndrome. Ann. Intern. Med. 2004, 141, 460–470. [Google Scholar] [CrossRef] [PubMed]
- Herridge, M.S.; Angus, D.C. Acute Lung injury-affecting many lives. N. Engl. J. Med. 2005, 353, 1736–1738. [Google Scholar] [CrossRef] [PubMed]
- El-Agamy, D.S. Nilotinib ameliorates lipopolysaccharide-induced acute lung injury in rats. Toxicol. Appl. Pharmacol. 2011, 253, 153–160. [Google Scholar] [CrossRef] [PubMed]
- Eiznhamer, D.A.; Flavin, M.T.; Jesmok, G.J.; Borgia, J.F.; Nelson, D.J.; Burhop, K.E.; Xu, Z.Q. Effective attenuation of endotoxin-induced acute lung injury by 2, 3-diacetyloxybenzoic acid in two independent animal models. Pulm. Pharmacol. Ther. 2004, 17, 105–110. [Google Scholar] [CrossRef] [PubMed]
- Graziano, F.M.; Cook, E.B.; Stahl, J.L. Cytokines, chemokines, RANTES, and eotaxin. Allergy Asthma Proc. 1999, 20, 141–146. [Google Scholar] [CrossRef] [PubMed]
- Berkow, R.L.; Dodson, M.R. Biochemical mechanisms involved in the priming of neutrophils by tumor necrosis factor. J. Leukoc. Biol. 1988, 44, 345–352. [Google Scholar] [PubMed]
- Kabir, K.; Gelinas, J.P.; Chen, M.; Chen, D.; Zhang, D.; Luo, X.; Yang, J.H.; Carter, D.; Rabinovici, R. Characterization of a murine model of endotoxin-induced acute lung injury. Shock 2002, 17, 300–303. [Google Scholar] [CrossRef] [PubMed]
- Gustavo, M.B.; Frevert, C.W.; Martin, T.R. Animal models of acute lung injury. Am. J. Physiol. Lung Cell. Mol. Physiol. 2008, 295, 379–399. [Google Scholar]
- Chu, G.K. Clinical observation on treating 13 cases of influenza A (H1N1) patients with respiratory distress syndrome in TCM. Clin. J. Chin. Med. 2012, 4, 103–104. [Google Scholar]
- Yu, Z.M.; Liu, Z.H.; Chen, J.; Zeng, Q. Anti-Inflammatory Effect of Qingwen Baidu Decoction in Sepsis Rats. Chin. J. Integr. Med. 2014, 20, 934–943. [Google Scholar] [CrossRef] [PubMed]
- Shen, W.Y.; Wang, F.; Xu, W.; Huang, Q. Ancient and modern use of Qingwen Baidu Decoction. Heilongjiang J. Tradit. Chin. Med. 2012, 6, 3–4. [Google Scholar]
- Yu, Z.M.; Liu, Z.H.; Chen, J.; Zhu, H.L. Qingwen Baidu Decoction inhibited the inflammatory mediators of warm disease heat syndrome in rats. Pharmacol. Clin. Chin. Mater. Med. 2010, 26, 3–6. [Google Scholar]
- Yu, Z, M.; Liu, Z.H.; Chen, J.; Zhu, H.L.; Zhong, Z.X. Qingwen Baidu Decoction inhibited the systemic inflammatory mediators IL—1, 6, 10, 18, TNF-alpha and IFN—Gamma in the rabbit. Pharmacol. Clin. Chin. Mater. Med. 2009, 25, 3–5. [Google Scholar]
- Leng, J.C.; Wang, W.X.; Li, Q.L. Clinical Efficacy of Qingwen Baidu Drink in Treating Sepsis and Its Effect on Cytokine. Chin. J. Inf. Tradit. Chin. 2009, 16, 11–13. [Google Scholar]
- Wang, F.; He, S.D.; Zhang, C.Z.; Luo, X.F. Study on Protective effect of Qingwen Baidu Liquid on Rats’ Acute Lung Injury. Chin. J. Tradit. Med. Sci. Technol. 2013, 20, 117–119. [Google Scholar]
- He, S.D.; Luo, X.F.; Zhao, W.; Wang, H.; Zhou, Y.; Zhang, C. Effect of Qingwen Baidu Decoction on Expression of Serum Cytokine TNF-α, IL-8 and IL-10 in Rats with Lipopolysaccharide induced Acute Lung Injury. Chin. Arch. Tradit. Chin. Med. 2011, 29, 2067–2070. [Google Scholar]
- Wang, F.; Zhang, C.Z.; Li, X.J. The Influence of Qingwen Baidu Decoction on the Expression of Pro-inflammatory and Anti-inflammatory Cytokines of the Acute Lung Injury in Rats. J. Zhejiang Univ. Chin. Med. 2011, 35, 391–394. [Google Scholar]
- Xu, G.L.; Xie, M.; Yang, X.Y.; Song, Y.; Yan, C.; Yang, Y.; Zhang, X.; Liu, Z.-Z.; Tian, Y.-X.; Wang, Y.; et al. Spectrum-Effect Relationships as a Systematic Approach to Traditional Chinese Medicine Research: Current Status and Future Perspectives. Molecules 2014, 19, 17897–17925. [Google Scholar] [CrossRef] [PubMed]
- Wu, G.T.; Du, L.D.; Zhao, L.; Shang, R.; Liu, D.; Jing, O.; Liang, J.; Ren, Y. The total alkaloids of Aconitum tanguticum protect against lipopolysaccharide-induced acute lung injury in rats. J. Ethnopharmacol. 2014, 155, 1483–1491. [Google Scholar] [CrossRef] [PubMed]
- Wang, J.Z.; Xu, F.; Liu, Z.; Ma, L.M.; Shang, M.Y.; Liu, G.X.; Cai, S.Q. Identification of chemical constituents in Scrophulariae Radix by HPLC-IT-TOF-MS. China J. Chin. Mater. Med. 2016, 41, 1257–1268. [Google Scholar]
- Zhao, W.J.; Lin, Y.; Li, P.F.; Liu, Y. Analysis of chemical constituents of Moutan cortex by HPLC-QTOFMS. J. Pharm. Pract. 2014, 32, 261–265. [Google Scholar]
- Li, S.L.; Song, J.Z.; Choi, F.F.; Qiao, C.F.; Zhou, Y.; Han, Q.B.; Xu, H.X. Chemical profiling of Radix Paeoniae evaluated by ultra-performance liquid chromatography/photo-diode-array/quadrupole time-of-flight mass spectrometry. J. Pharm. Biomed. Anal. 2009, 49, 253–266. [Google Scholar] [CrossRef] [PubMed]
- Lian, H.Y.; Xu, W.Y.J.; Liang, Q.D.; Ma, Z.C.; Wang, Y.; Tang, X.; Tan, H.; Xiao, C.; Gao, Y. Chemical Comparison between Decoctions of Radix Paeoniae Rubra and Radix Paeoniae Alba by UPLC-QTOF MS. J. Chin. Mass Spectrom. Soc. 2014, 35, 269–277. [Google Scholar]
- Xu, S.J.; Yang, L.; Zeng, X.; Zhang, M.; Wang, Z.T. Characterization of compounds in the Chinese herbal drug Mu-Dan-Pi by liquid chromatography coupled to electrospray ionization mass spectrometry. Rapid Commun. Mass Spectrom. 2006, 20, 3275–3288. [Google Scholar] [CrossRef] [PubMed]
- Liu, E.H.; Qi, L.W.; Li, B. High-speed separation and characterization of major constituents in Radix Paeoniae Rubra by fast highperformance liquid chromatography coupled with diode-array detection and time-of-flight mass spectrometry. Rapid Commun. Mass Spectrom. 2009, 23, 119–130. [Google Scholar] [CrossRef] [PubMed]
- Jing, J.; Chan, C.O.; Xu, L.J.; Jin, D.; Cao, X.; Mok, D.K.W.; Parekh, H.S.; Chen, S. Development of an in-line HPLC fingerprint ion-trap mass spectrometric method for identification and quality control of Radix Scrophulariae. J. Pharm. Biomed. Anal. 2011, 56, 830–835. [Google Scholar] [CrossRef] [PubMed]
- Yang, S.; Xu, H.F.; Zhao, B.S.; Li, S.; Li, T.; Xu, X.; Zhang, T.; Lin, R.; Li, J.; Li, X. The Difference of Chemical Components and Biological Activities of the Crude Products and the Salt-Processed Product from Semen Cuscutae. Evid. Based Complement. Altern. Med. 2016, 1–9. [Google Scholar] [CrossRef] [PubMed]
- Wu, Y.; Singer, M.; Thouron, F.; Alaoui-El-Azher, M.; Touqui, L. Effect of surfactant on pulmonary expression of type IIA PLA (2) in an animal model of acute lung injury. Am. J. Physiol. Lung Cell. Mol. Physiol. 2002, 282, 743–750. [Google Scholar] [CrossRef] [PubMed]
- Szarka, R.J.; Wang, N; Gordon, L.; Nation, P.N.; Smith, R.H. A murine model of pulmonary damage induced by lipopolysaccharide via intranasal instillation. J. Immunol. Methods 1997, 202, 49–57. [Google Scholar] [CrossRef]
- Abraham, E. Neutrophils and acute lung injury. Crit. Care Med. 2003, 31, 195–199. [Google Scholar] [CrossRef] [PubMed]
- Marzocco, S.; Piccinelli, A.L.; Rastrelli, L.; Mazzon, E.; Cuzzocrea, S.; Autore, G. inhibition of inducible nitric oxide synthase in vitro and in vivo by a water-soluble extract of Wendita calysina leaves. Naunyn Schmiedeberg’s Arch. Pharmacol. 2007, 375, 349–358. [Google Scholar] [CrossRef] [PubMed]
- Diaz, A.M.; Abad, M.J.; Fernandez, L. Phenylpropanoid glycosides from Scrophularia scorodonia: In vitro anti-inflammatory activity. Life Sci. 2004, 74, 2515–2526. [Google Scholar] [CrossRef] [PubMed]
- Liu, H.; Zheng, Y.F.; Li, C.Y. Discovery of Anti-inflammatory Ingredients in Chinese Herbal Formula Kouyanqing Granule based on Relevance Analysis between Chemical Characters and Biological Effects. Sci. Rep. 2015, 5, 1–15. [Google Scholar] [CrossRef] [PubMed]
- Kamiya Mehla, K.; Sakshi Balwani, S.; Anurag Agrawal, A.; Ghosh, B. Ethyl gallate attenuates acute lung injury through Nrf2 signaling. Biochimie 2013, 95, 2404–2414. [Google Scholar] [CrossRef] [PubMed]
- Lv, G.F.; Zheng, J.; Zhou, H.; Zheng, Y.; Wang, Y.; Wei, G.; Huang, M.; Jiang, D.; Wei, L. The screening and isolation of an effective anti-endotoxin monomer from Radix Paeoniae Rubra using affinity biosensor technology. Int. Immunopharmacol. 2005, 5, 1007–1017. [Google Scholar]
- Lv, G.F.; Xiao, G.X.; Wei, G.; Guo, Y.B.; Zheng, J. Study of the anti-endotoxin effect of β-1,2,3,4,6-penta-O-galloyl-d-glucopyranose in vitro. Chin. J. Burns 2005, 21, 282–284. [Google Scholar]
- Gyurkovska, V.; Alipieva, K.; Maciuk, A.; Dimitrova, P.; Ivanovskaa, N.; Haasd, C.; Bleyd, T.; Georgieve, M. Anti-inflammatory activity of Devil’s claw in vitro systems and their active constituents. Food Chem. 2011, 125, 171–178. [Google Scholar] [CrossRef]
Sample Availability: Samples of the compounds are available from the authors. |


| No | Rt (min) | Molecular Formula | Molecular Weight (m/z) | Observed Ion Peaks (m/z) | Identified Compound |
|---|---|---|---|---|---|
| P1 | 10.78 | C21H32O14 | 508.1787 | 553.1783[M + HCOO]−, 507.1732[M-H]− | 6-O-β-glucosyl-aucubin [23] |
| P2 | 11.85 | C7H6O5 | 170.0210 | 169.0145[M-H]−, 124.8813[M-COO]−, 97.1030[M-COO-CO]−, 80.9518[M-COO-CO-HO]− | gallic acid [24,25] |
| P3 | 29.04 | C23H28O13S | 544.1245 | 543.1188[M-H]−, 421.1752[M-H-C7H6O]− | paeoniflorin sulfonate [24,25] |
| P4 | 42.72 | C23H28O12 | 496.1575 | 495.1511[M-H]−, 465.1869[M-H-HCO]−, 333.1177[M-H-glc]− | oxypaeoniflorin [24,25,26] |
| P5 | 45.19 | C20H28O12 | 460.1575 | 459.1588[M-H]−, 505.1576[M + HCOO]− | apiopaeonoside [24,27] |
| P6 | 47.17 | C9H10O5 | 198.0523 | 197.0457[M-H]−, 168.9350[M-H-C2H5]− | ethyl gallate [23] |
| P7 | 50.52 | C20H28O12 | 460.1575 | 459.1523[M-H]−, 505.1576[M + HCOO]− | paeonolide [24,27] |
| P8 | 54.09 | C23H28O11 | 480.1626 | 525.1609[M + HCOO]−, 478.9111[M-H]−, 449.1719[M-H-CH2O]− | paeoniflorin [23] |
| P9 | 73.54 | C30H32O15 | 632.1736 | 631.1671[M-H]−, 613.2833[M-H-H2O]−, 491.2346[M-H-H2O-C7H6O2]− | galloyl paeoniflorin [24,26,27] |
| P10 | 75.65 | C29H36O15 | 624.2049 | 623.2987[M-H]−, 461.2122[M-H-caffeoyl]−, 315.1192[M-H-caffeoyl-rhamnosyl]− | verbascoside [23] |
| P11 | 77.38 | C15H10O7 | 302.0421 | 300.9996[M-H]−, 228.9682[M-H-O-2CO]−, 256.9158[M-H-O-CO]− | quercetin [24,27] |
| P12 | 81.38 | C24H28O12 | 507.1525[M-H]- | unknown | |
| P13 | 85.02 | C41H32O26 | 940.1176 | 939.1130[M-H]−, 769.1382[M-H-C7H6O5]− | pentagalloylglucose [25,27,28] |
| P14 | 89.98 | C36H48O19 | 784.2784 | 783.2723[M-H]−, 607.3094[M-H-feruloyl]−, 589.3885[M-H-feruloyl-H2O]−, 461.1645, [ferulic acid–H]− | angoroside C [29] |
| P15 | 92.68 | C41H30O25 | 923.1136[M + H]+ | unknown | |
| P16 | 94.92 | C47H66O3 | 679.5094[M + H]+ | unknown | |
| P17 | 97.15 | C52H60O2 | 717.4650[M + H]+ | unknown | |
| P18 | 98.46 | C30H32O13 | 600.1837 | 599.1782[M-H]−, 447.2278[M-H-C7H6O2-HCHO]−, 477.1727[M-H-C7H6O2]− | benzoyloxy-paeoniflorin [24,28] |
| P19 | 99.88 | C9H10O3 | 166.0624 | 167.0695[M + H]+, 148.8797 [M + H-H2O]−, | paeonol [24] |
| P20 | 102.44 | C30H32O13 | 600.1837 | 599.1783[M-H]−, 477.1727[M-H-C7H6O2]−, 447.2278[M-H-C7H6O2-HCHO]− | mudanpioside C [24] |
| P21 | 103.77 | C24H30O11 | 494.1783 | 493.1729[M-H]−, 345.1204[M-H-cinnamic acid]− | harpagoside [29] |
© 2017 by the authors. Licensee MDPI, Basel, Switzerland. This article is an open access article distributed under the terms and conditions of the Creative Commons Attribution (CC BY) license (http://creativecommons.org/licenses/by/4.0/).
Share and Cite
Zhang, Q.; Lei, H.-M.; Wang, P.-L.; Ma, Z.-Q.; Zhang, Y.; Wu, J.-J.; Nie, J.; Chen, S.-J.; Han, W.-J.; Wang, Q.; et al. Bioactive Components from Qingwen Baidu Decoction against LPS-Induced Acute Lung Injury in Rats. Molecules 2017, 22, 692. https://doi.org/10.3390/molecules22050692
Zhang Q, Lei H-M, Wang P-L, Ma Z-Q, Zhang Y, Wu J-J, Nie J, Chen S-J, Han W-J, Wang Q, et al. Bioactive Components from Qingwen Baidu Decoction against LPS-Induced Acute Lung Injury in Rats. Molecules. 2017; 22(5):692. https://doi.org/10.3390/molecules22050692
Chicago/Turabian StyleZhang, Qi, Hai-Min Lei, Peng-Long Wang, Zhi-Qiang Ma, Yan Zhang, Jing-Jing Wu, Jing Nie, Su-Juan Chen, Wen-Jie Han, Qing Wang, and et al. 2017. "Bioactive Components from Qingwen Baidu Decoction against LPS-Induced Acute Lung Injury in Rats" Molecules 22, no. 5: 692. https://doi.org/10.3390/molecules22050692