1. Introduction
Photodynamic therapy (PDT) is a noninvasive method used for the treatment of malignant tumors based on the combination of the photosensitizer (PS) and light irradiation [
1]. It can be used either as a primary or adjunctive treatment for solid cancers of various parts of the body including the bladder, esophagus, head and neck, brain, lung, prostate, intraperitoneal cavity, breast, prostate and skin [
2]. Recently, PDT had gained more and more attention due to its significant advantages of destroying tumor cells effectively and selectively without injuring surrounding healthy tissues, and had been widely used as a new treatment that improves the quality of life of patients [
2,
3,
4,
5,
6].
In PDT the PS allows for the transfer and translation of light energy into a type II chemical reaction, producing singlet oxygen (
1O
2) by transferring energy to the surrounding ground-state oxygen, which was extremely cytotoxic and was believed to play a major role in cell killing [
2,
7,
8,
9]. Chlorin e6, the most studied and best known photosensitizer used in PDT in many countries worldwide, possesses clear structure, better tumor targeting ability, strong photodynamic activity and lower cytotoxicity [
3,
10,
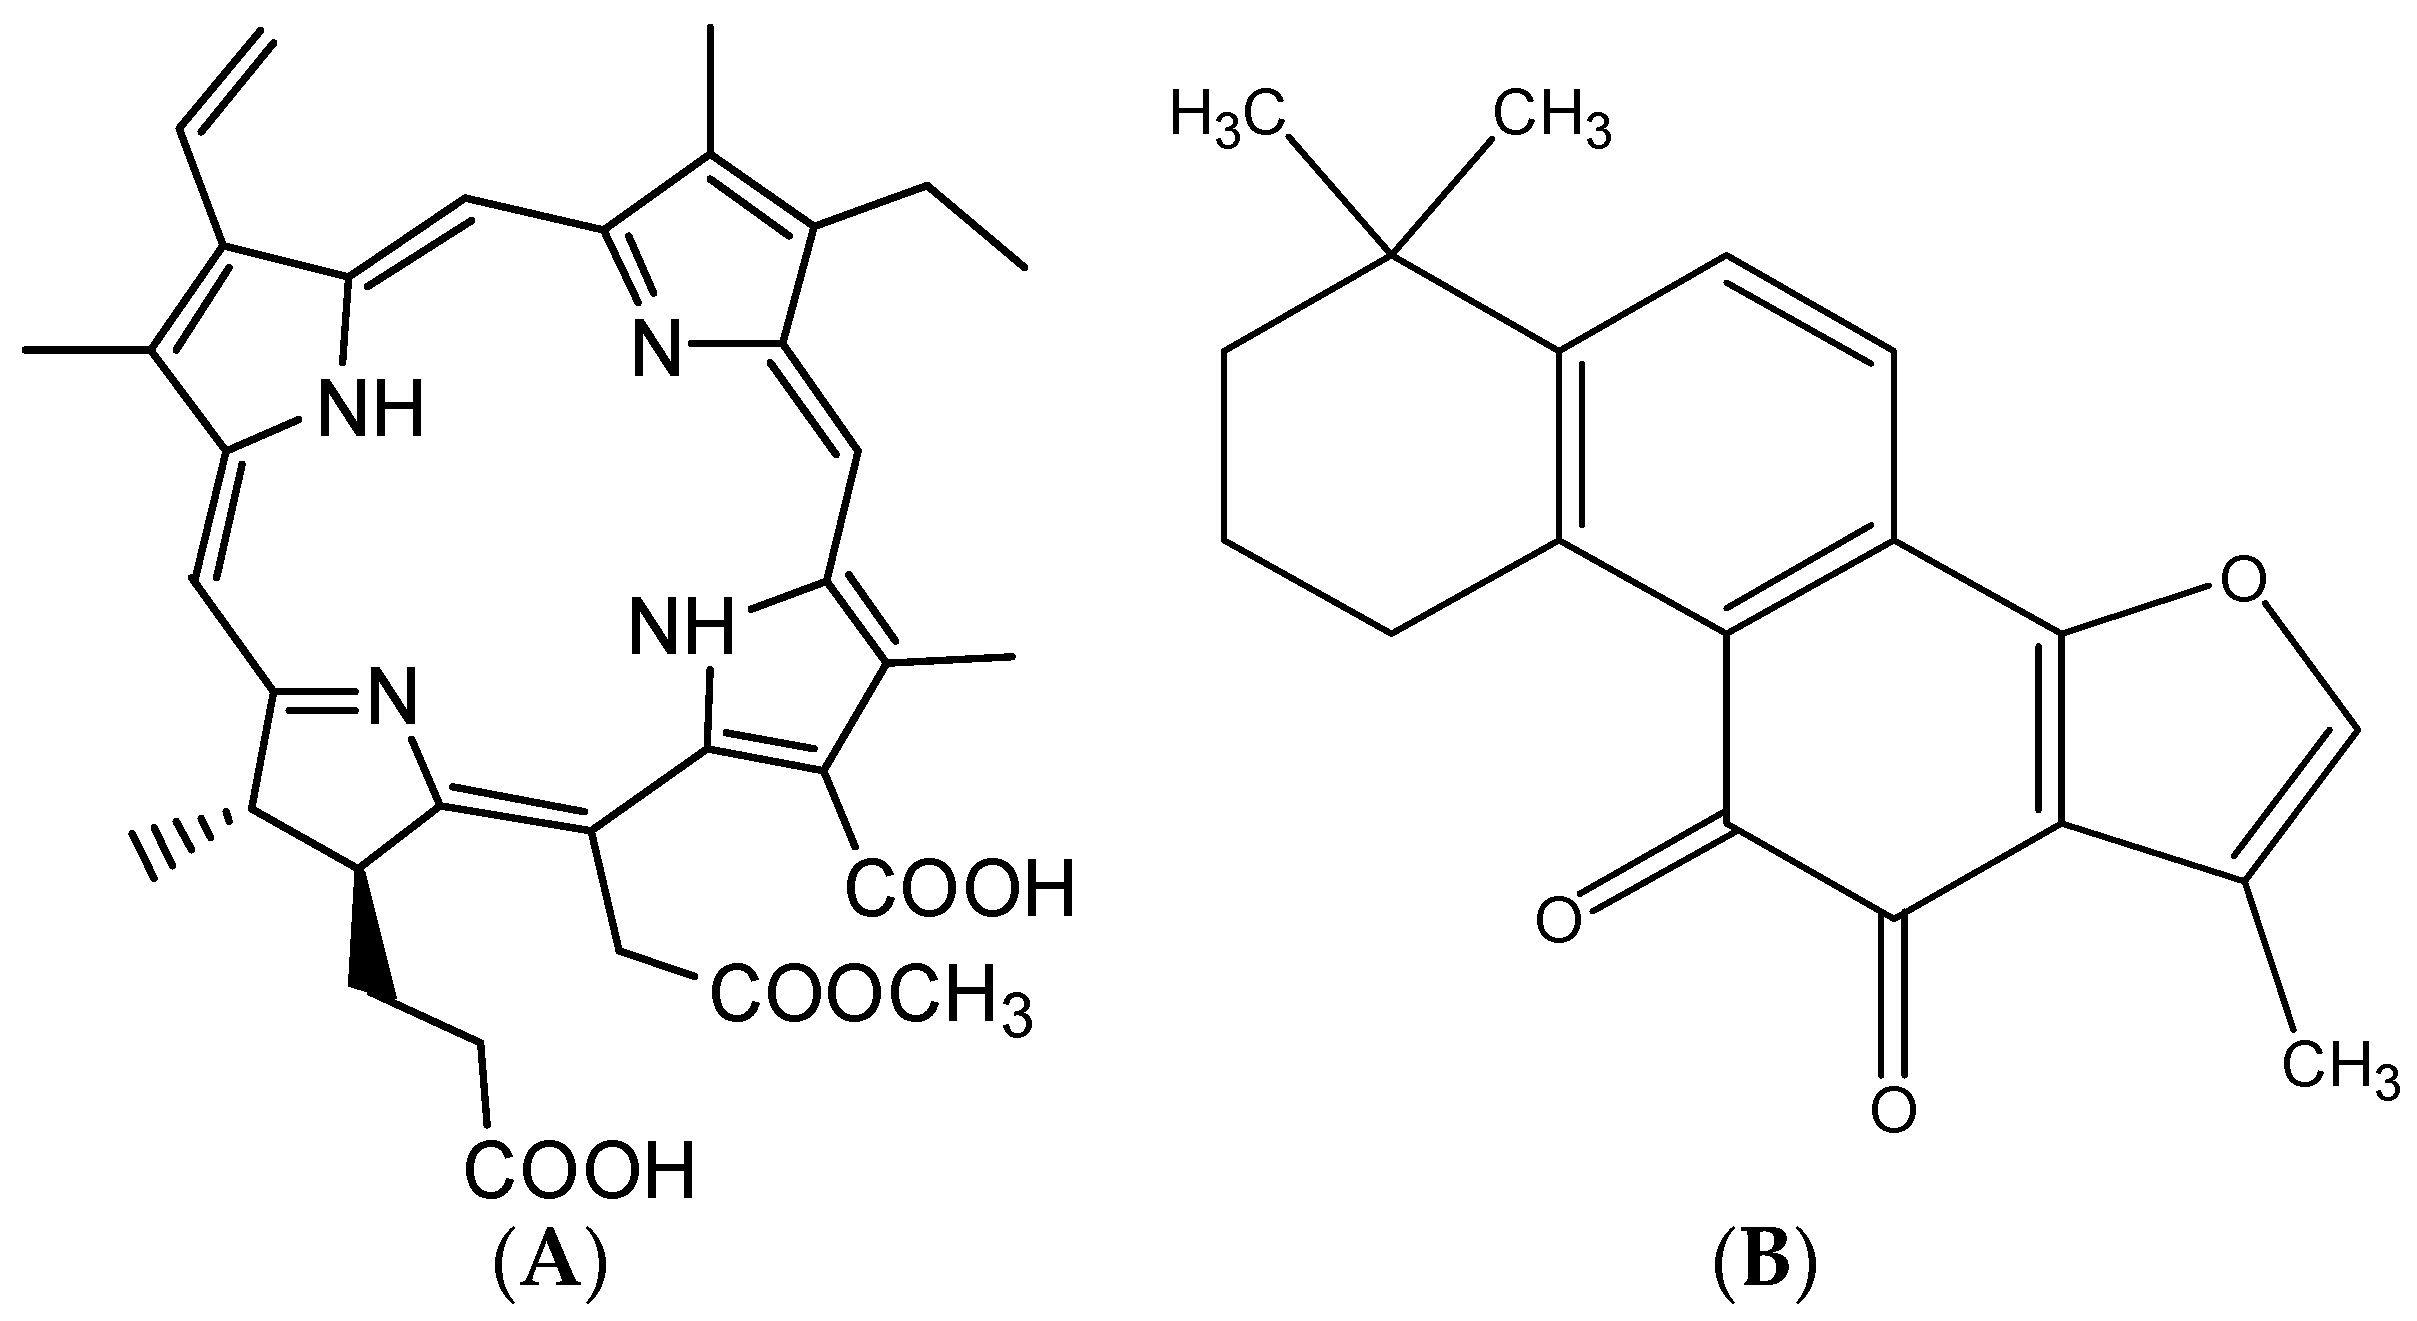
11]. 2,7,12,18-Tetramethyl-3-ethenyl-8-ethyl-13-carboxyl-15-formyloxyethyl-17-propionyloxy-17, 18-chlorin (CMME,
Figure 1A) is a derivative of chlorin e6, which is a new second generation drug development candidate for tumor photodynamic therapy [
12]. The absorption coefficient of CMME is approximately one order of magnitude higher than that of the current PDT drugs such as sodium porfimer and xibofen, since the photosensitive action spectrum of CMME is in the best red light band [
13,
14]. Besides the mentioned benefits, CMME also has the advantage of chemical stability, a high tumor/normal tissue distribution ratio, and strong photosensitizing and antineoplastic activity [
15,
16].
Due to its various advantages described above, further research and development of CMME is of great significance. The pharmacokinetic properties of a drug play an important role in its therapeutic safety and clinical rational drug use. Yang et al. reported a FLD method for determination of CMME in Sprague-Dawley rat plasma with the LLOQ of 0.5 μg/mL, which was higher than that in this work [
17]. However, the fluorescence efficiency was easily affected by temperature, solvent and acidity, which affected the shape and intensity of the fluorescence spectrum [
17,
18]. Thus, a suitable liquid chromatographic method that will allow analysis of CMME in pre-clinical is still lacking.
CMME, is a large heterocyclic aromatic molecule with a conjugated π-system, consisting of a core of three pyrrole rings and one reduced pyrrole ring coupled through four methine linkages [
15]. Owing to the strong conjugated system, CMME has strong ultraviolet absorption and a UV method should be sensitive enough for direct analysis [
15,
19]. In addition, because of the simple HPLC conditions and straightforward sample pre-treatment procedure, the method is easy and fast to perform [
20]. However, up to date, there are no reports on the determination of CMME using HPLC-UV.
The purpose of this study was to develop and validate a HPLC method for quantitative determination of CMME in beagle dog plasma. The method was evaluated in terms of selectivity, sensitivity, linearity, accuracy, precision and stability in accordance to the recommendations published by the FDA, and it was successfully applied to quantitative levels of CMME in beagle dog pharmacokinetic studies.
3. Experimental Section
3.1. Chemicals and Reagents
A CMME reference substance (Lot: 20150112) and powder injection (98.73% purity) were synthesized at Haining Green Liter Pharmaceutical Technology Co., Ltd. (Haining, China). Tanshinone IIA (internal standard, IS, 98% purity) was purchased from the Dalian Meilun Biotechnology Co. Ltd. (Dalian, China). Methanol and glacial acetic acid, both of HPLC grade, were purchased from Tedia (Fairfield, CA, USA). Ammonium acetate (analytical reagent grade) was purchased from Shanghai Chemical Reagent Company (Shanghai, China). Ultra-pure water was prepared in-house using a Milli-Q system from Millipore (Bedford, MA, USA).
3.2. Instruments
The analysis was performed on a Shimadzu LC-10 series HPLC system (Shimadzu, Kyoto, Japan), including two LC-10A pumps, a SIL-10ADvp autosampler, a CTO-10ASvp column oven and a SPD-10A UV detector. The data was collected and processed using Shimadzu CLASS-VP software (Version 6.14 SP1, Shimadzu, Kyoto, Japan).
3.3. Chromatographic Conditions
Chromatographic separation was performed on a Diamonsil C18 column (100 mm × 4.6 mm, 5 μm; Dikma, Beijing, China). The mobile phase consisted of methanol and 20 mM ammonium acetate (containing 0.3% glacial acetic acid) (85:15, v/v) was delivered at a flow rate of 1.0 mL/min. The column temperature was 25 °C with UV detection at 400 nm. This method was applied to analyze the plasma samples from beagle dogs dosed with CMME.
3.4. Preparation of Calibration Standards and Quality Control Samples
The stock solutions of CMME were prepared at concentrations of 1.00 mg/mL in 60% PBS buffer and 40% methanol. A series of standard working solutions were prepared by further dilution of the stock solutions with the diluents (methanol–water: 80:20, v/v). The stock solutions of IS were prepared at concentrations of 0.50 mg/mL in methanol. The IS working solution was diluted with methanol–water (80:20, v/v) to get a final concentration of 250.00 μg/mL. All working solutions were stored at +4 °C prior to sample processing. Calibration standards of CMME in the dog plasma were prepared at concentrations of 0.05, 0.10, 0.20, 0.50, 1.00, 2.00 and 5.00 μg/mL along with quality control (QC) standards at concentrations of 0.15 μg/mL (LQC, low QC), 0.80 μg/mL (MQC, middle QC), and 4.00 μg/mL (HQC, high QC). The concentration of the IS working solution was 250.00 μg/mL.
3.5. Sample Preparation
The samples of beagle dog plasma were taken out from −80 °C freezer and thawed at room temperature prior to use. The samples were vortexed adequately before processing. An aliquot of 100 μL plasma sample and 10 μL IS working solution were mixed together by vortexing for 30 s and then extracted by protein precipitation with 200 μL acetonitrile for 3 min by a vortex mixer. After centrifugation at 12,000 rpm for 10 min, the supernatant was transferred into vial and a 20 μL aliquot was injected into the HPLC system for analysis.
3.6. Method Validation
The bioanalytical method was fully validated according to the FDA guidelines [
24].
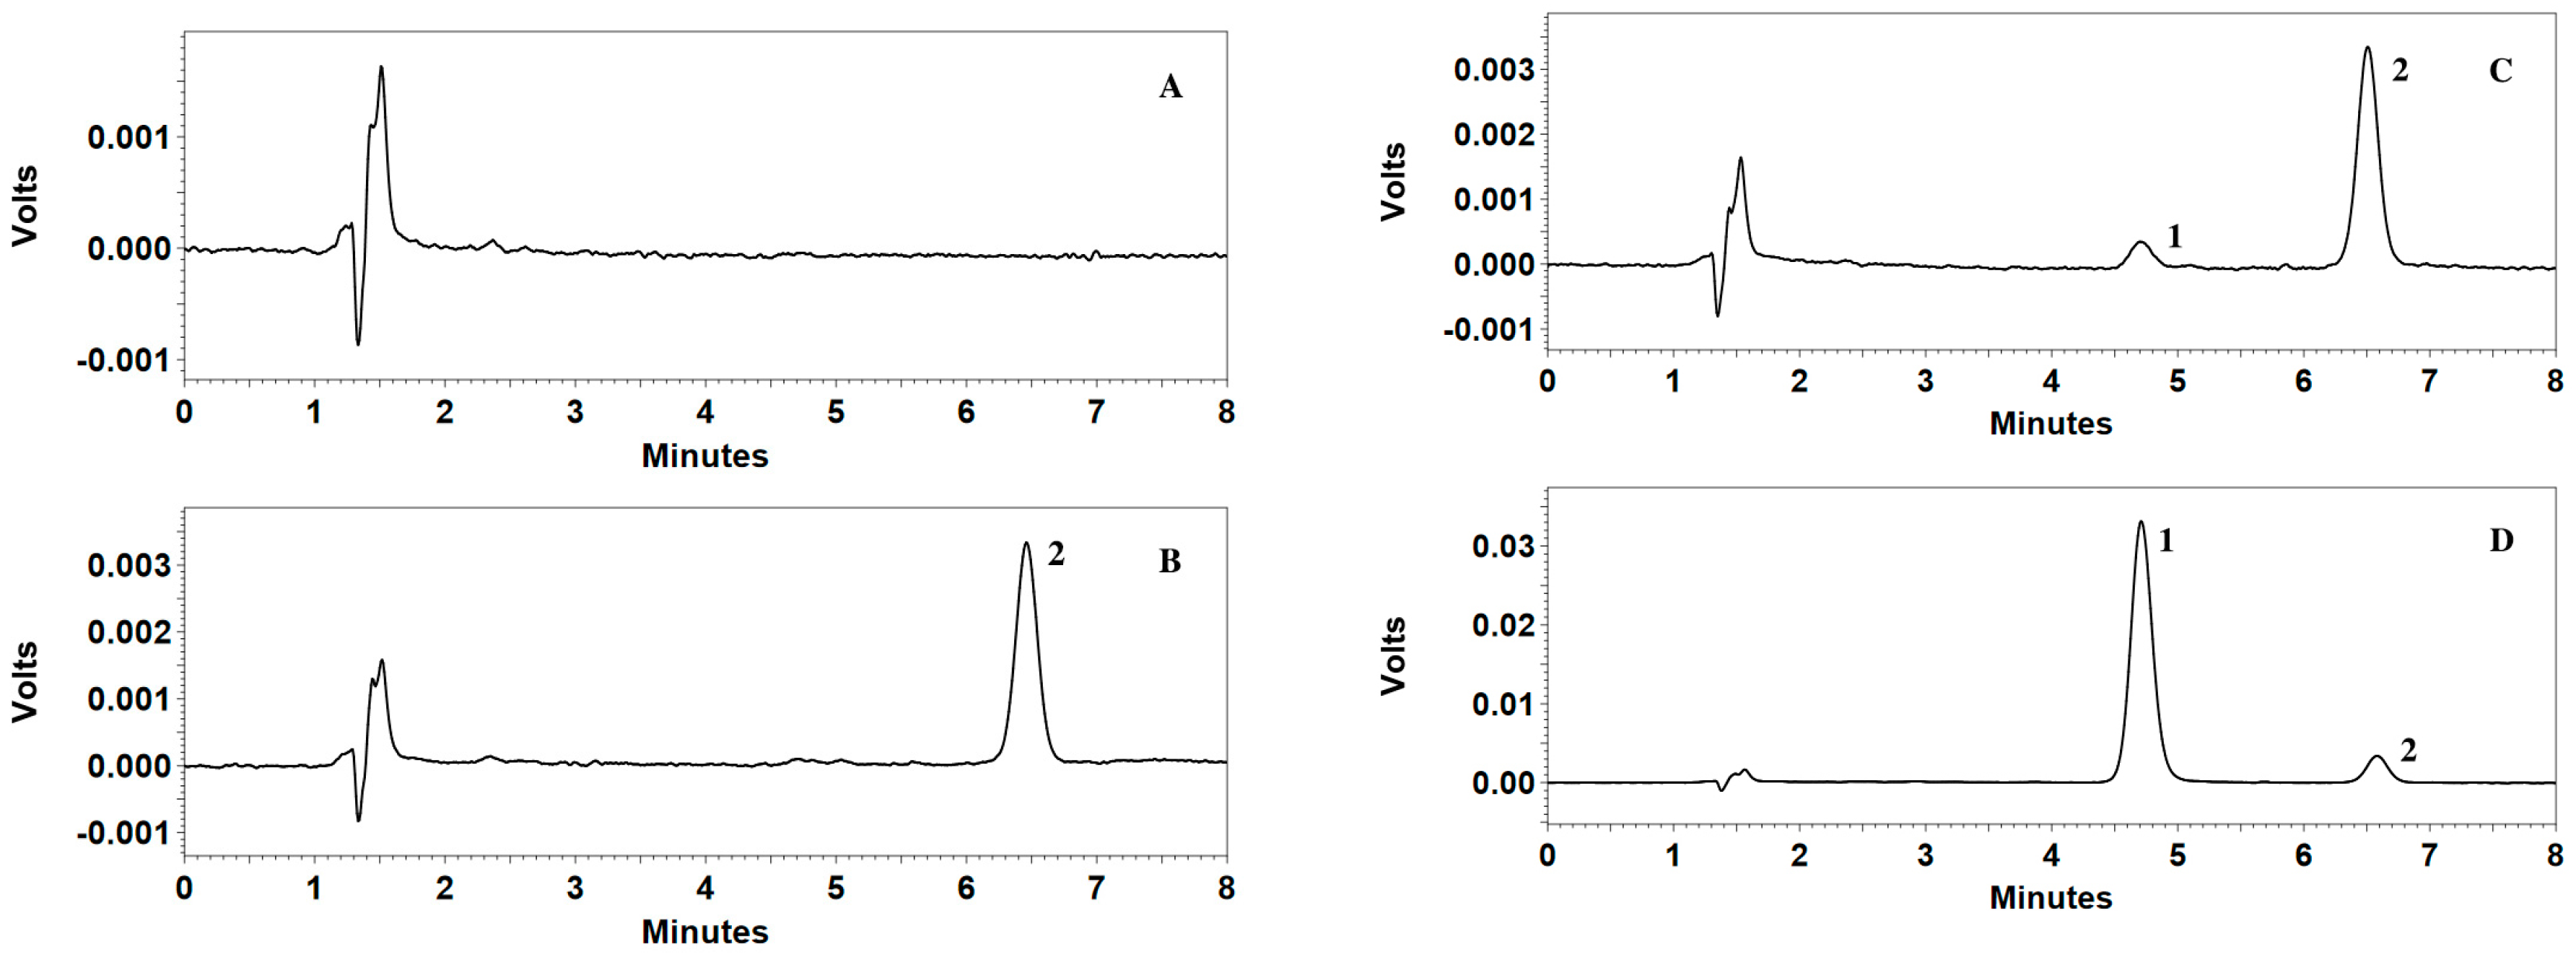
3.6.1. Specificity
Specificity of the method was investigated by blank plasma samples from six different sources, blank plasma spiked with IS, blank plasma spiked with CMME at LLOQ and plasma samples in a preclinical study. The method is selective if the response of the interfering peaks at the retention time of the drug is less than 20% of the mean response of the six extracted samples at LLOQ.
3.6.2. Linearity and Lower Limit of Quantitation
The linearity was assessed by plotting the peak area of the CMME/IS ration against the concentration of CMME (0.05–5.00 μg/mL) on three consecutive days with least-squares linear regression analysis. Standards should not deviate by more than 15% of nominal concentrations, except at LLOQ where the standard should not deviate by more than 20%.The acceptance criterion for the standard curve is that at least 75% of non-zero standards should meet the above criteria, including the LLOQ. The LLOQ was established using five samples independent of the standards and was determined with a precision less than 20% and accuracy within ±20%.
3.6.3. Recovery
The extract recovery was evaluated by comparing the mean peak areas for extracted samples (n = 5) at three concentrations (0.15, 0.80 and 4.00 μg/mL) with the mean peak areas of unextracted standards that represent 100% recovery. The recovery of IS was also evaluated in the same way.
3.6.4. Precision and Accuracy
The intra-day and inter-day precision and accuracy were assessed by analyzing five replicates of four concentration levels of QC samples (LLOQ, LQC, MQC, and HQC) on the same day and on three validation days. The criteria for acceptability of the data included accuracy within ±15% (20% for LLOQ) relative error (R.E.) from the nominal values and a precision within 15% (20% for LLOQ) relative standard deviation (R.S.D.).
3.6.5. Stability
Stability studies were assessed by analyzing three replicates of the QC samples at two concentrations. The long-term stability was assessed after storage of the samples for three months at −80 °C The freeze and thaw stability was evaluated after three freeze (−80 °C) and thaw cycles. The short-term stability was evaluated after exposure of the samples to room temperature for 1 and 2 h. The post-preparative stability was analyzed after storage of the samples in the autosampler for 12 h and 24 h at room temperature. Stability sample results should be within 15% of nominal concentrations.
3.6.6. Sample Dilution
To demonstrate the ability of diluting plasma samples containing CMME at concentrations above the assay upper limit of calibration curve, a set of plasma samples were prepared containing CMME at a concentration of 8.00 μg/mL, 20.00 μg/mL, 40.00 μg/mL and stored at −80 °C overnight prior to analysis. After thawing at room temperature, the spiked samples were diluted with blank plasma to generate the final concentration of 4.00 μg/mL. Then the samples (n = 5) were processed and analyzed. The accuracy expressed as RE% and precision expressed as RSD% of these samples should be within ±15%.
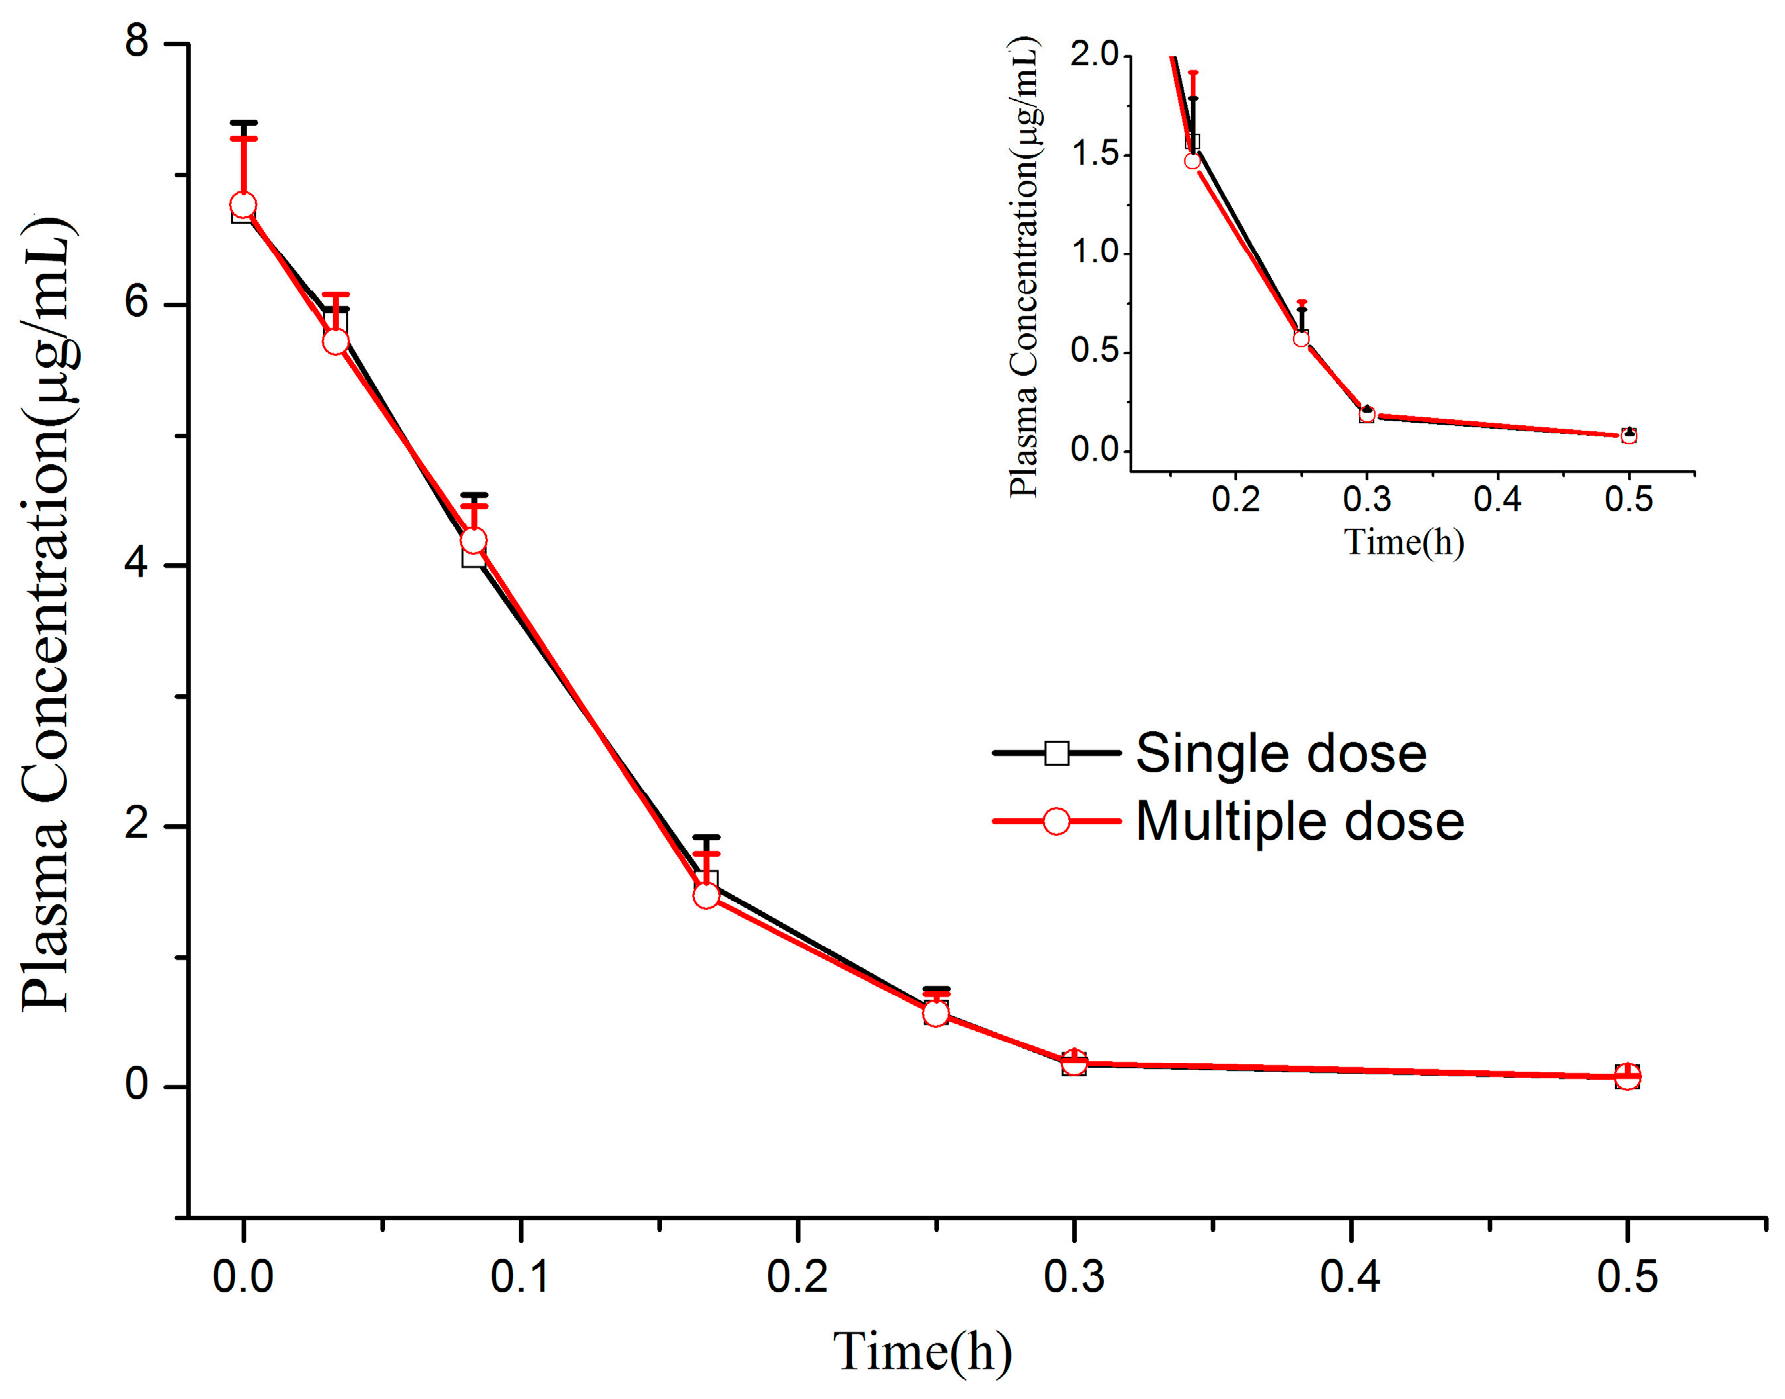
3.7. Application of the Method in Pharmacokinetic Study
Beagle dogs, weighing 10.2 ± 0.8 kg, half male and half female, were obtained from Experimental Animal Center of Second Military Medical University (Shanghai, China; animal permit number: SCXK (Hu) 2012-0003). The animals were fasted overnight with free access to water for at least 12 h before administration. The CMME powder was dissolved in 0.9% saline solution with the concentration of 4 mg/mL. Twelve beagle dogs were divided into two groups and administered by left forelimb intravenous injection at a single dose of 1.2 mg/kg and multiple doses of 1.2 mg/kg/day for seven consecutive days (three times a day). Beagle dog blood samples (approximately 0.5 mL) were collected in heparin-coated tubes prior before administration and at different time points (0, 0.033, 0.083, 0.167, 0.25, 0.5, 1, 2, 3 and 4 h) after single-dose intravenous administration. For the multiple-dose studies, the blood-sampling scheme mentioned above was applied to beagle dogs on days 1 and 7, while blood samples were only collected immediately prior to every dosage on days 4–6 for the determination of trough concentrations. All blood samples were centrifuged at 6500 rpm for 10 min. The plasma was separated and frozen below −80 °C until assay.
At the time of measurement, first three time points (i.e., 0, 0.033 and 0.083 h) of single-dose and multiple-dose plasma samples were diluted with blank plasma of a dilution factor of 5 (to 80 μL of blank plasma, added 20 μL of i.v. treated dog plasma sample), because these points were out of our validation range. As for the other time points, the measured values were not diluted. The pharmacokinetic parameters of CMME were calculated using the non-compartmental model with the BAPP 3.0 software (Center of Drug Metabolism and Pharmacokinetics, China Pharmaceutical University, Nanjing, China).


