Systems Biology Approach to Bioremediation of Nitroaromatics: Constraint-Based Analysis of 2,4,6-Trinitrotoluene Biotransformation by Escherichia coli

Abstract
:1. Introduction
2. Results and Discussion
2.1. Characterization of E. coli TNT Biotransformation Capacity
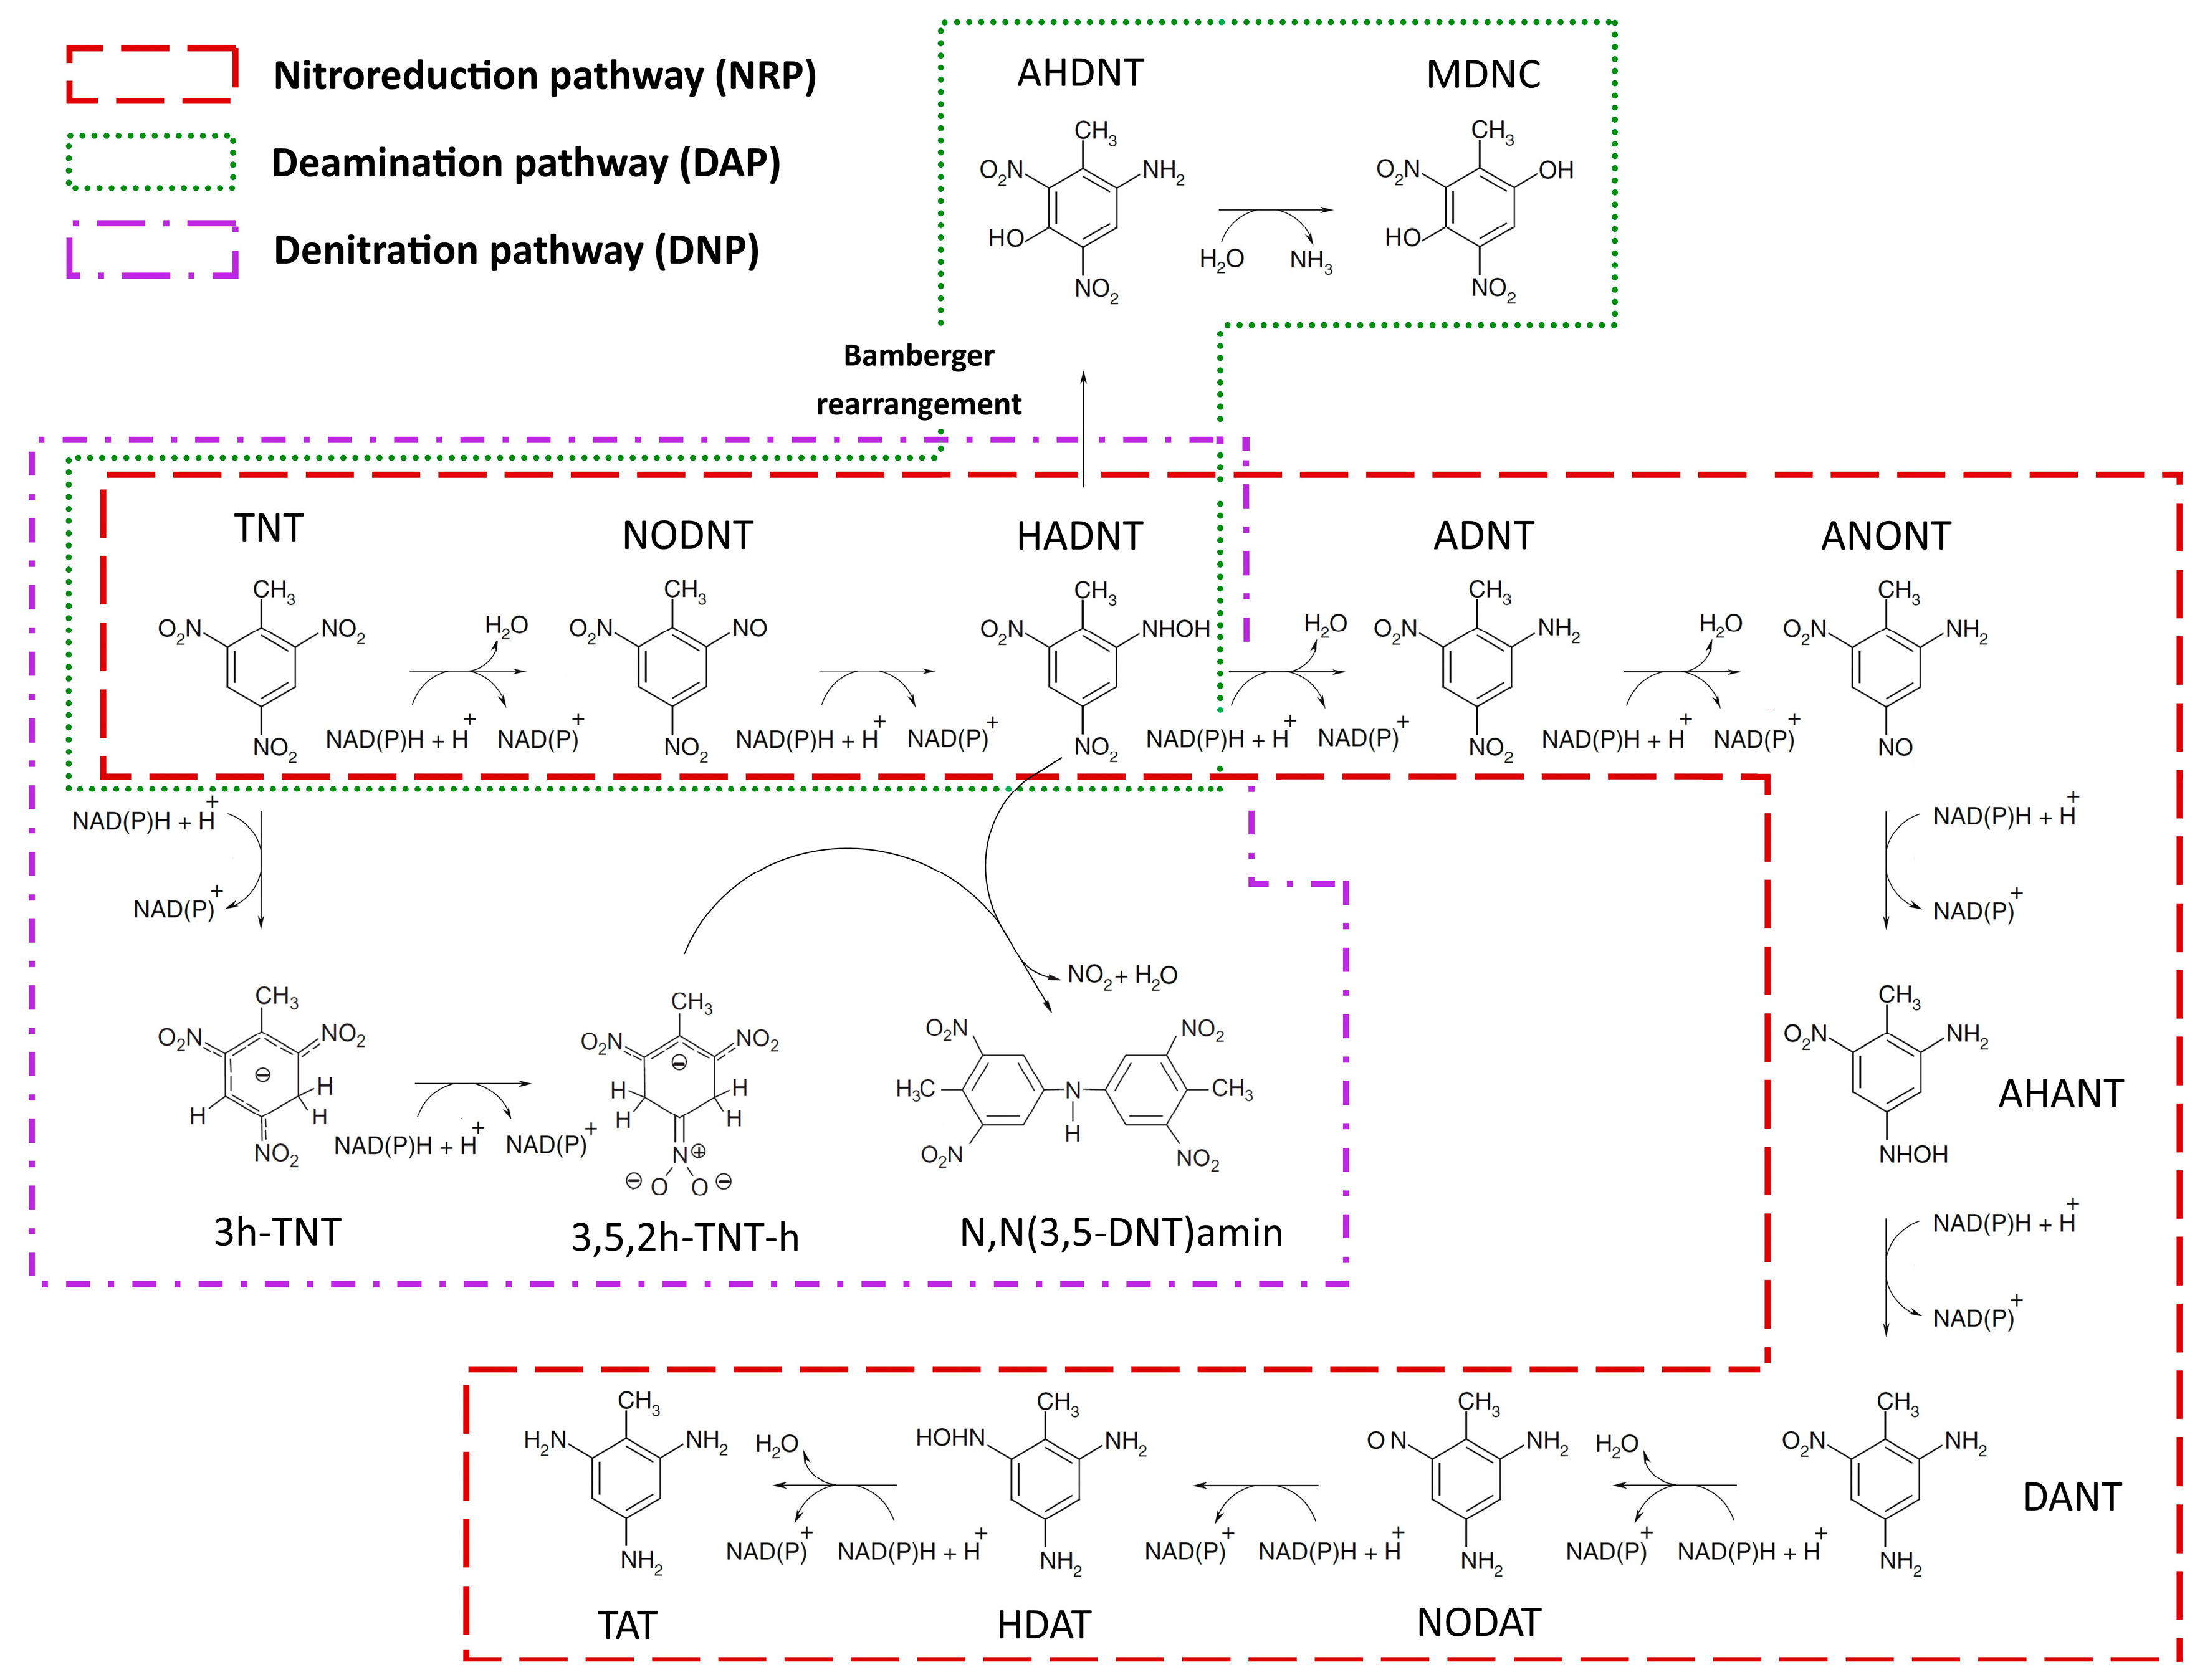
2.1.1. Nitroreduction Pathway
FBA and FVA
Sampling of Flux Space
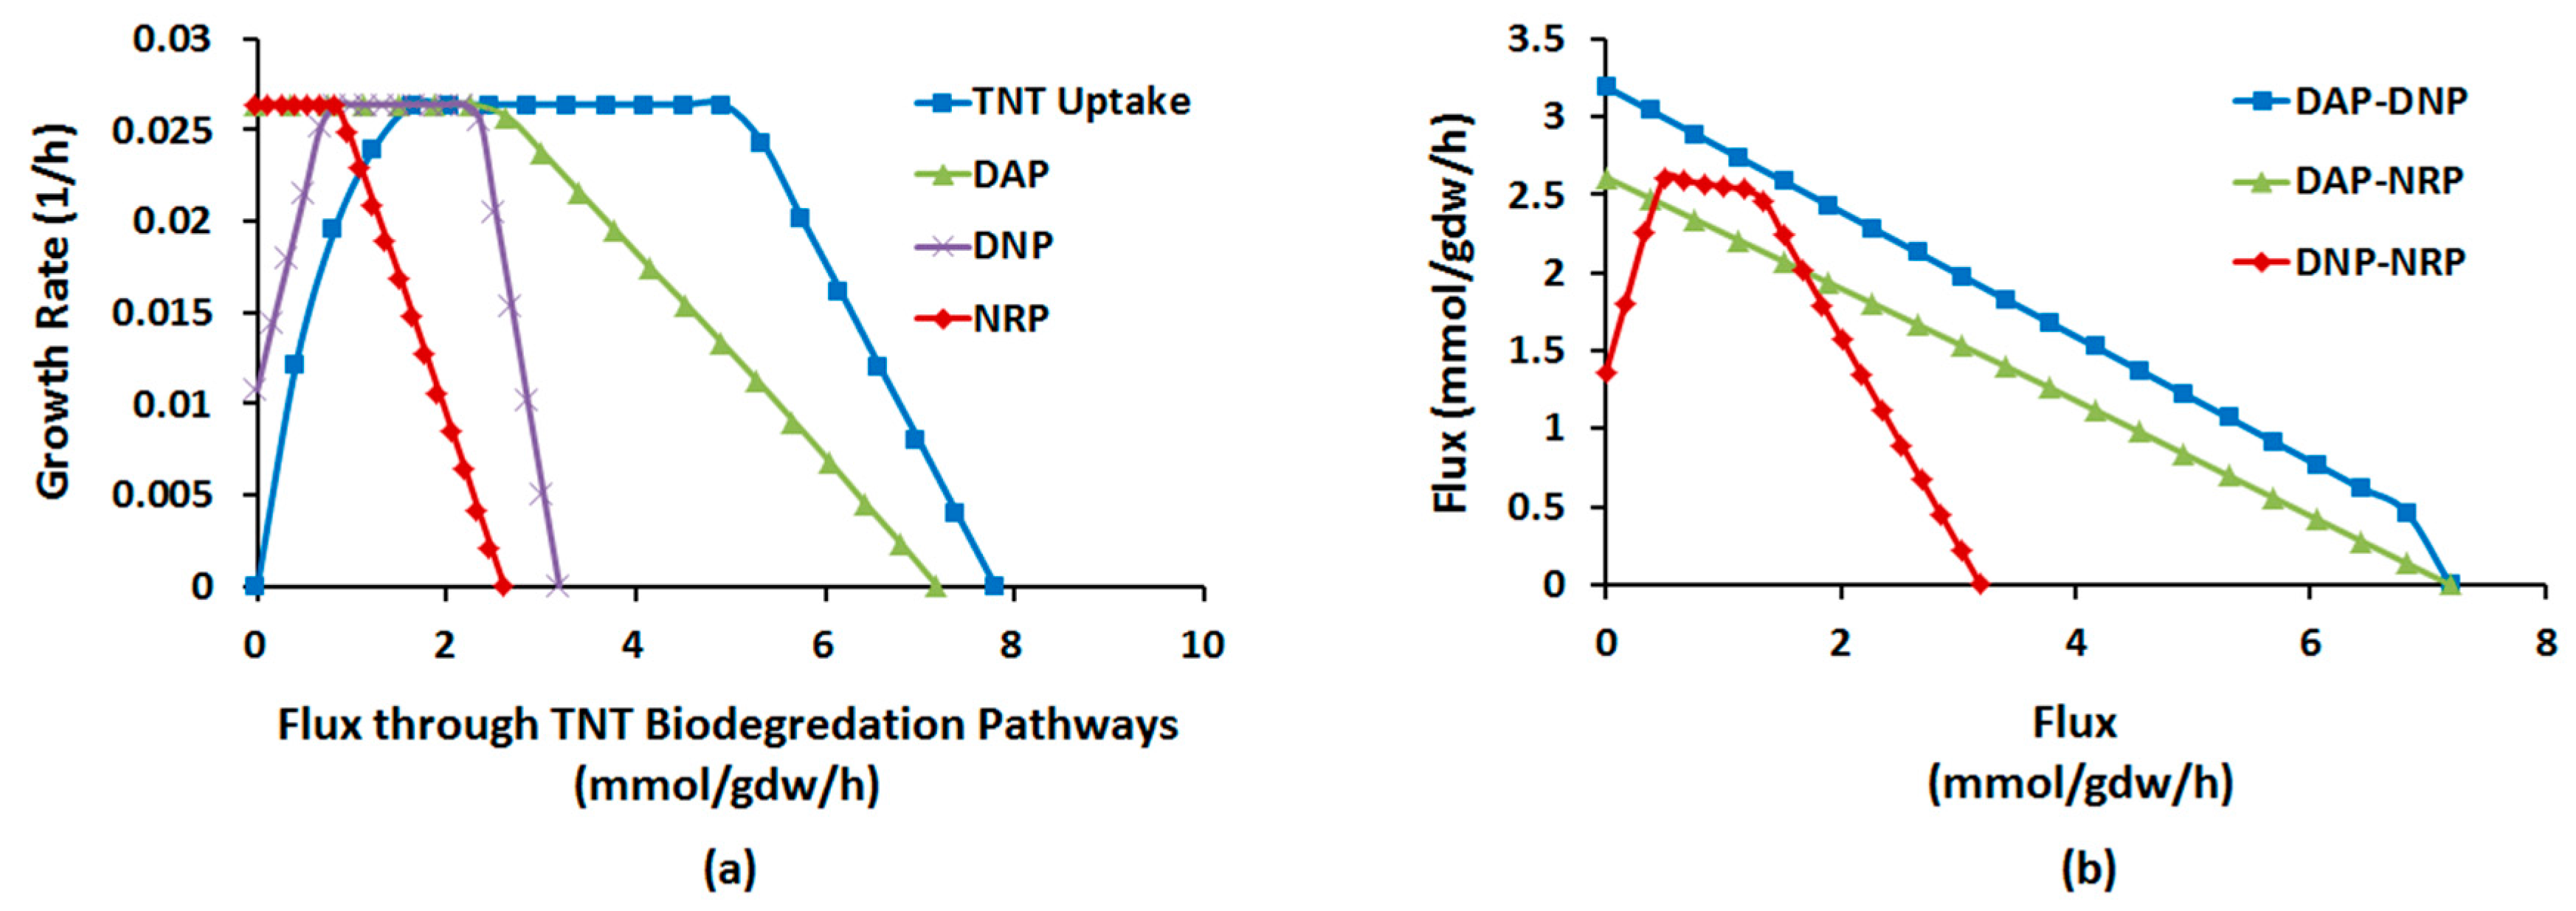
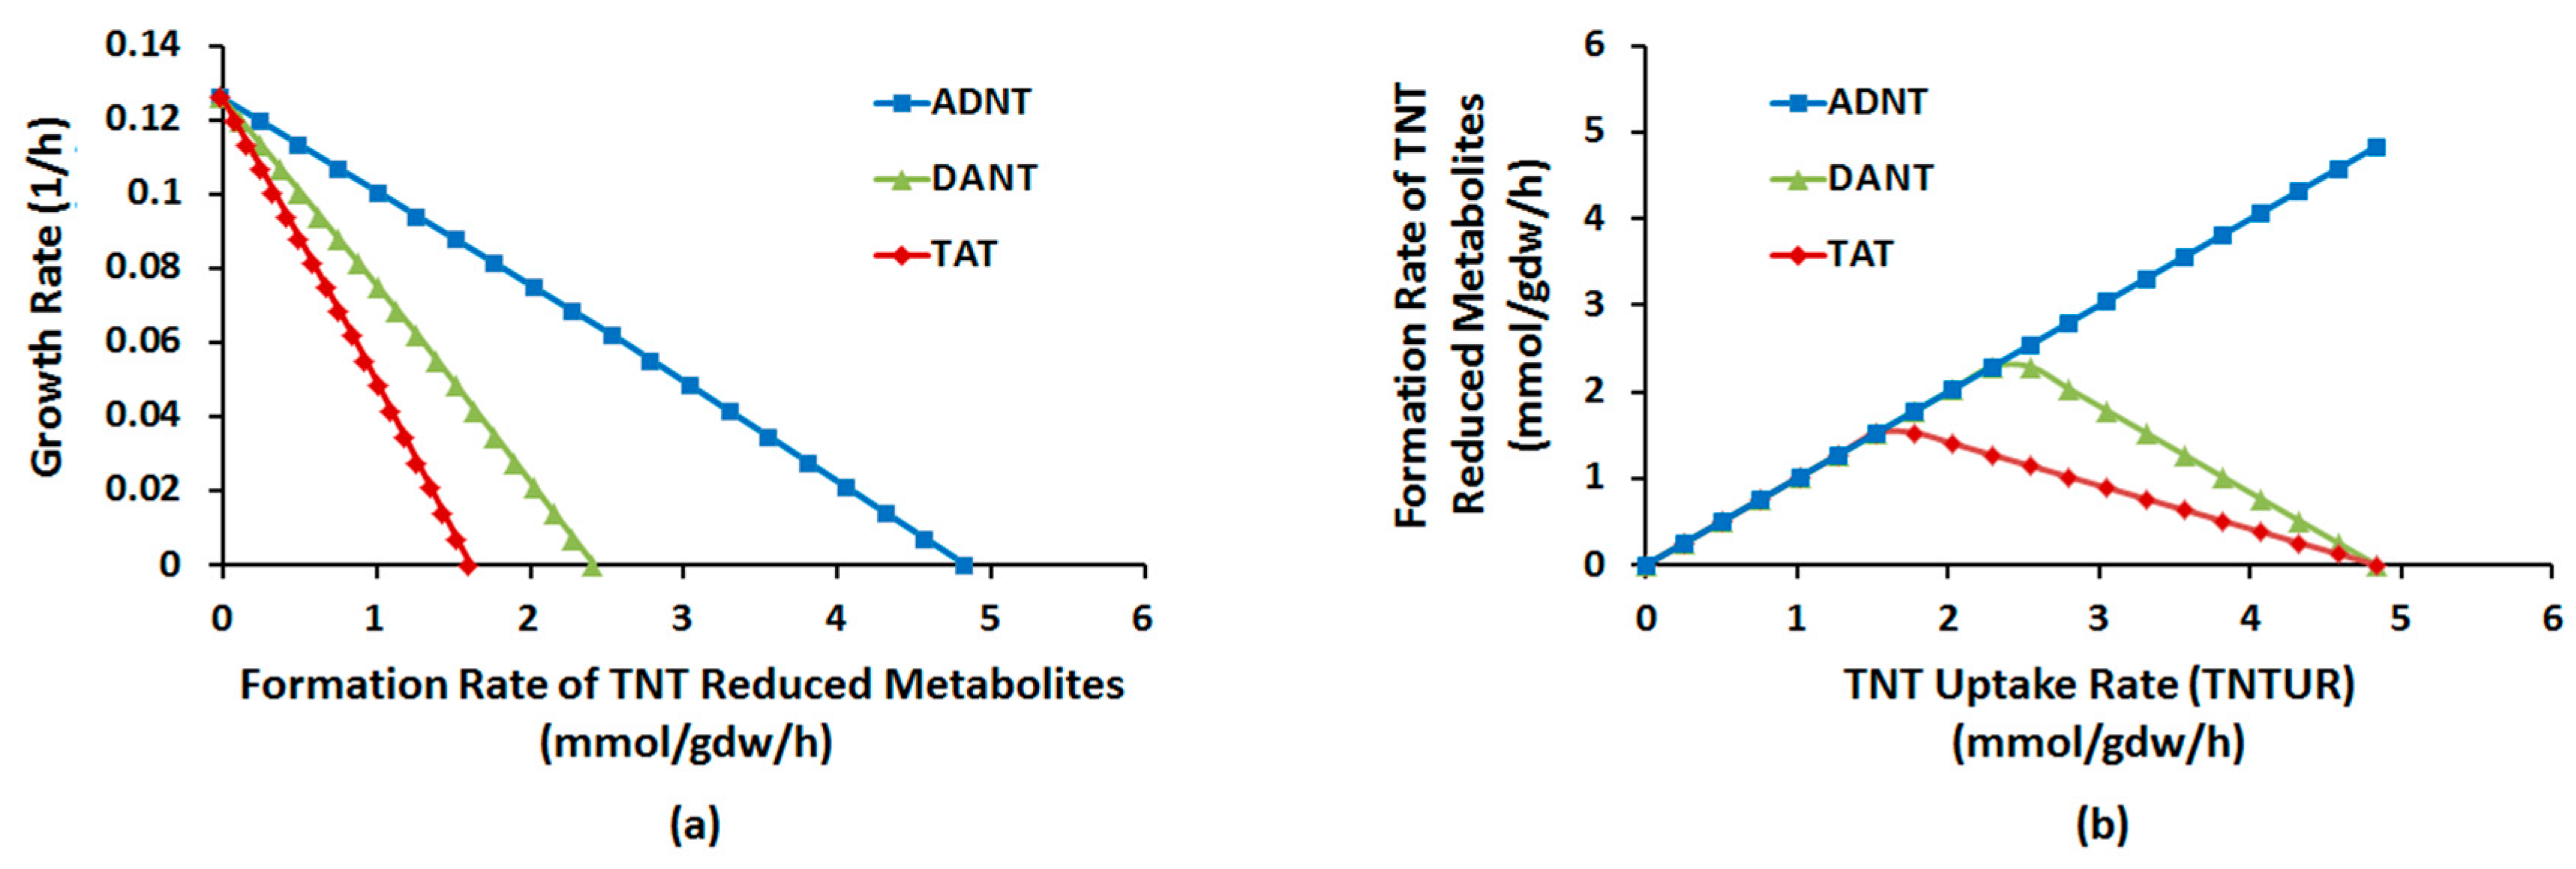
Robustness Analysis
2.1.2. Deamination Pathway
2.1.3. Denitration Pathway
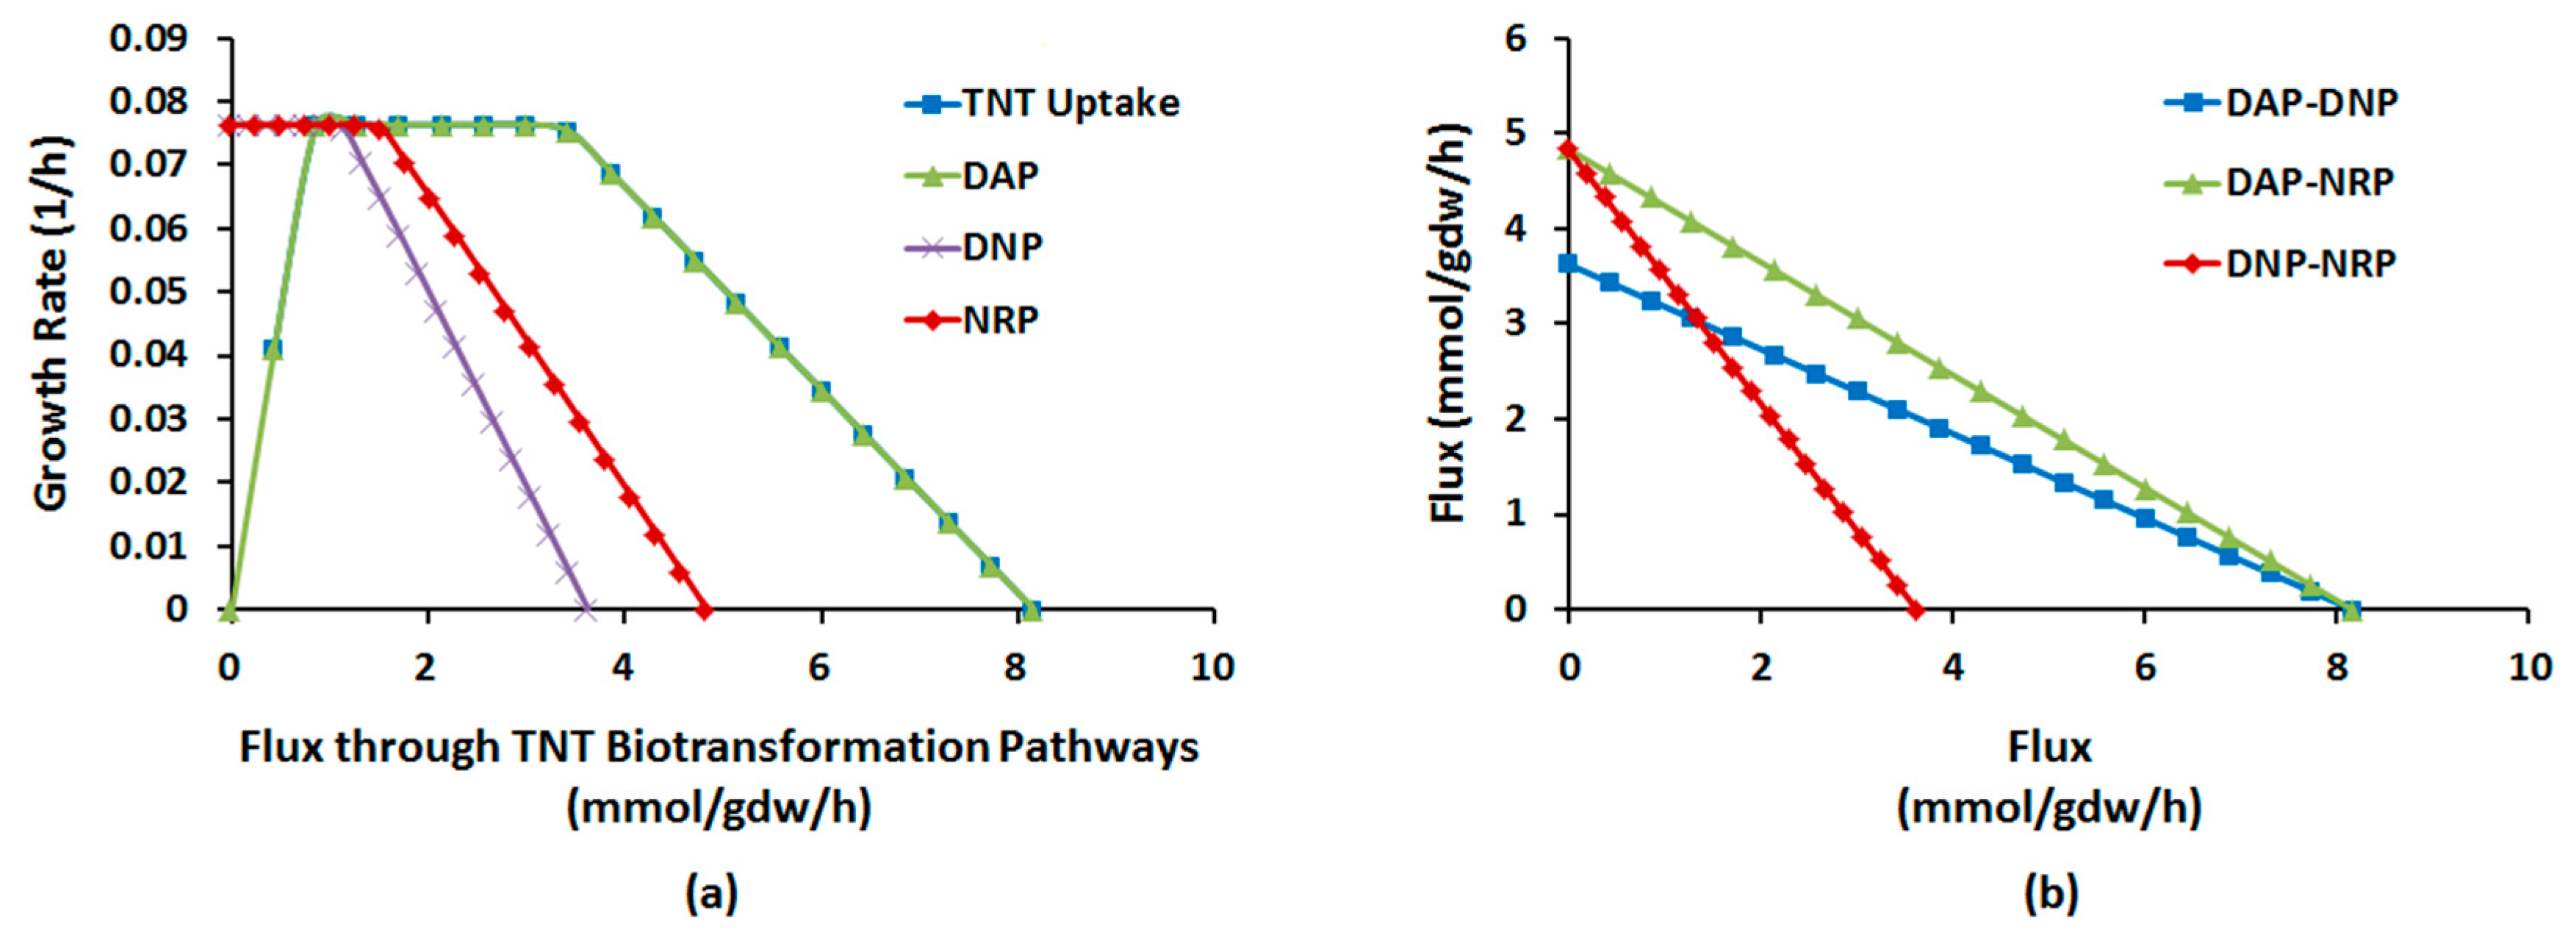
2.1.4. Interactions between Multiple TNT Biotransformation Pathways
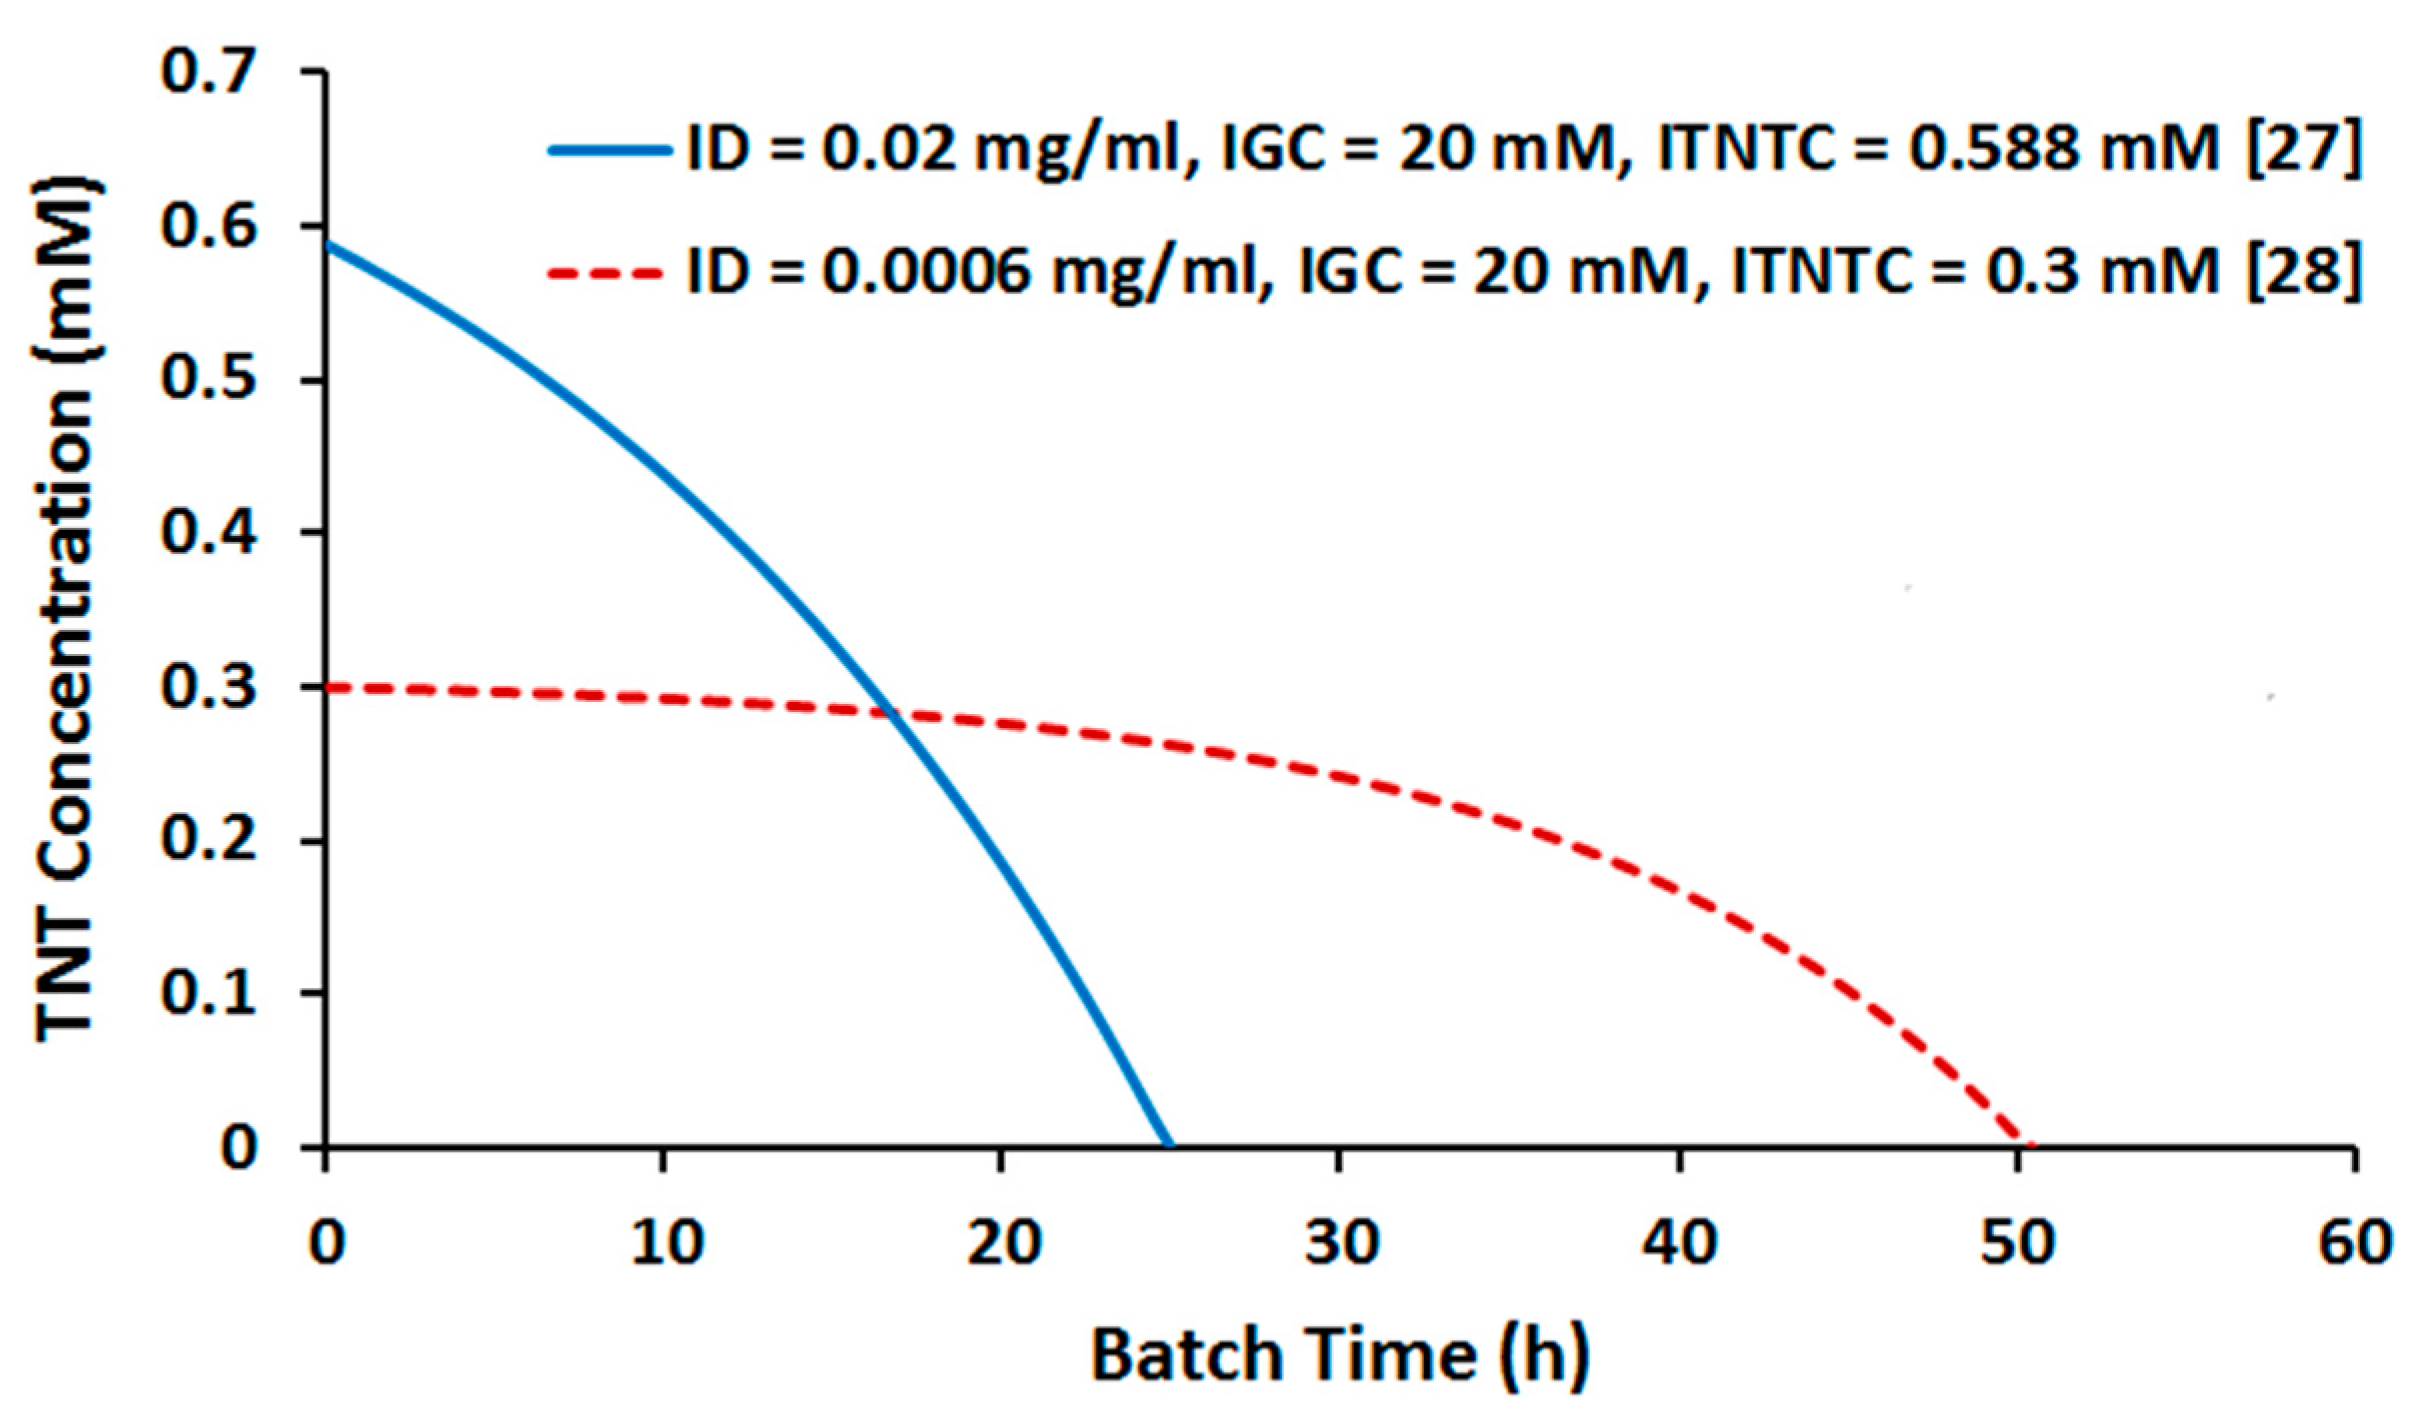
2.2. Batch Culture Simulation
2.3. Influence of Cultivation Condition on TNT Biotransformation Efficiency
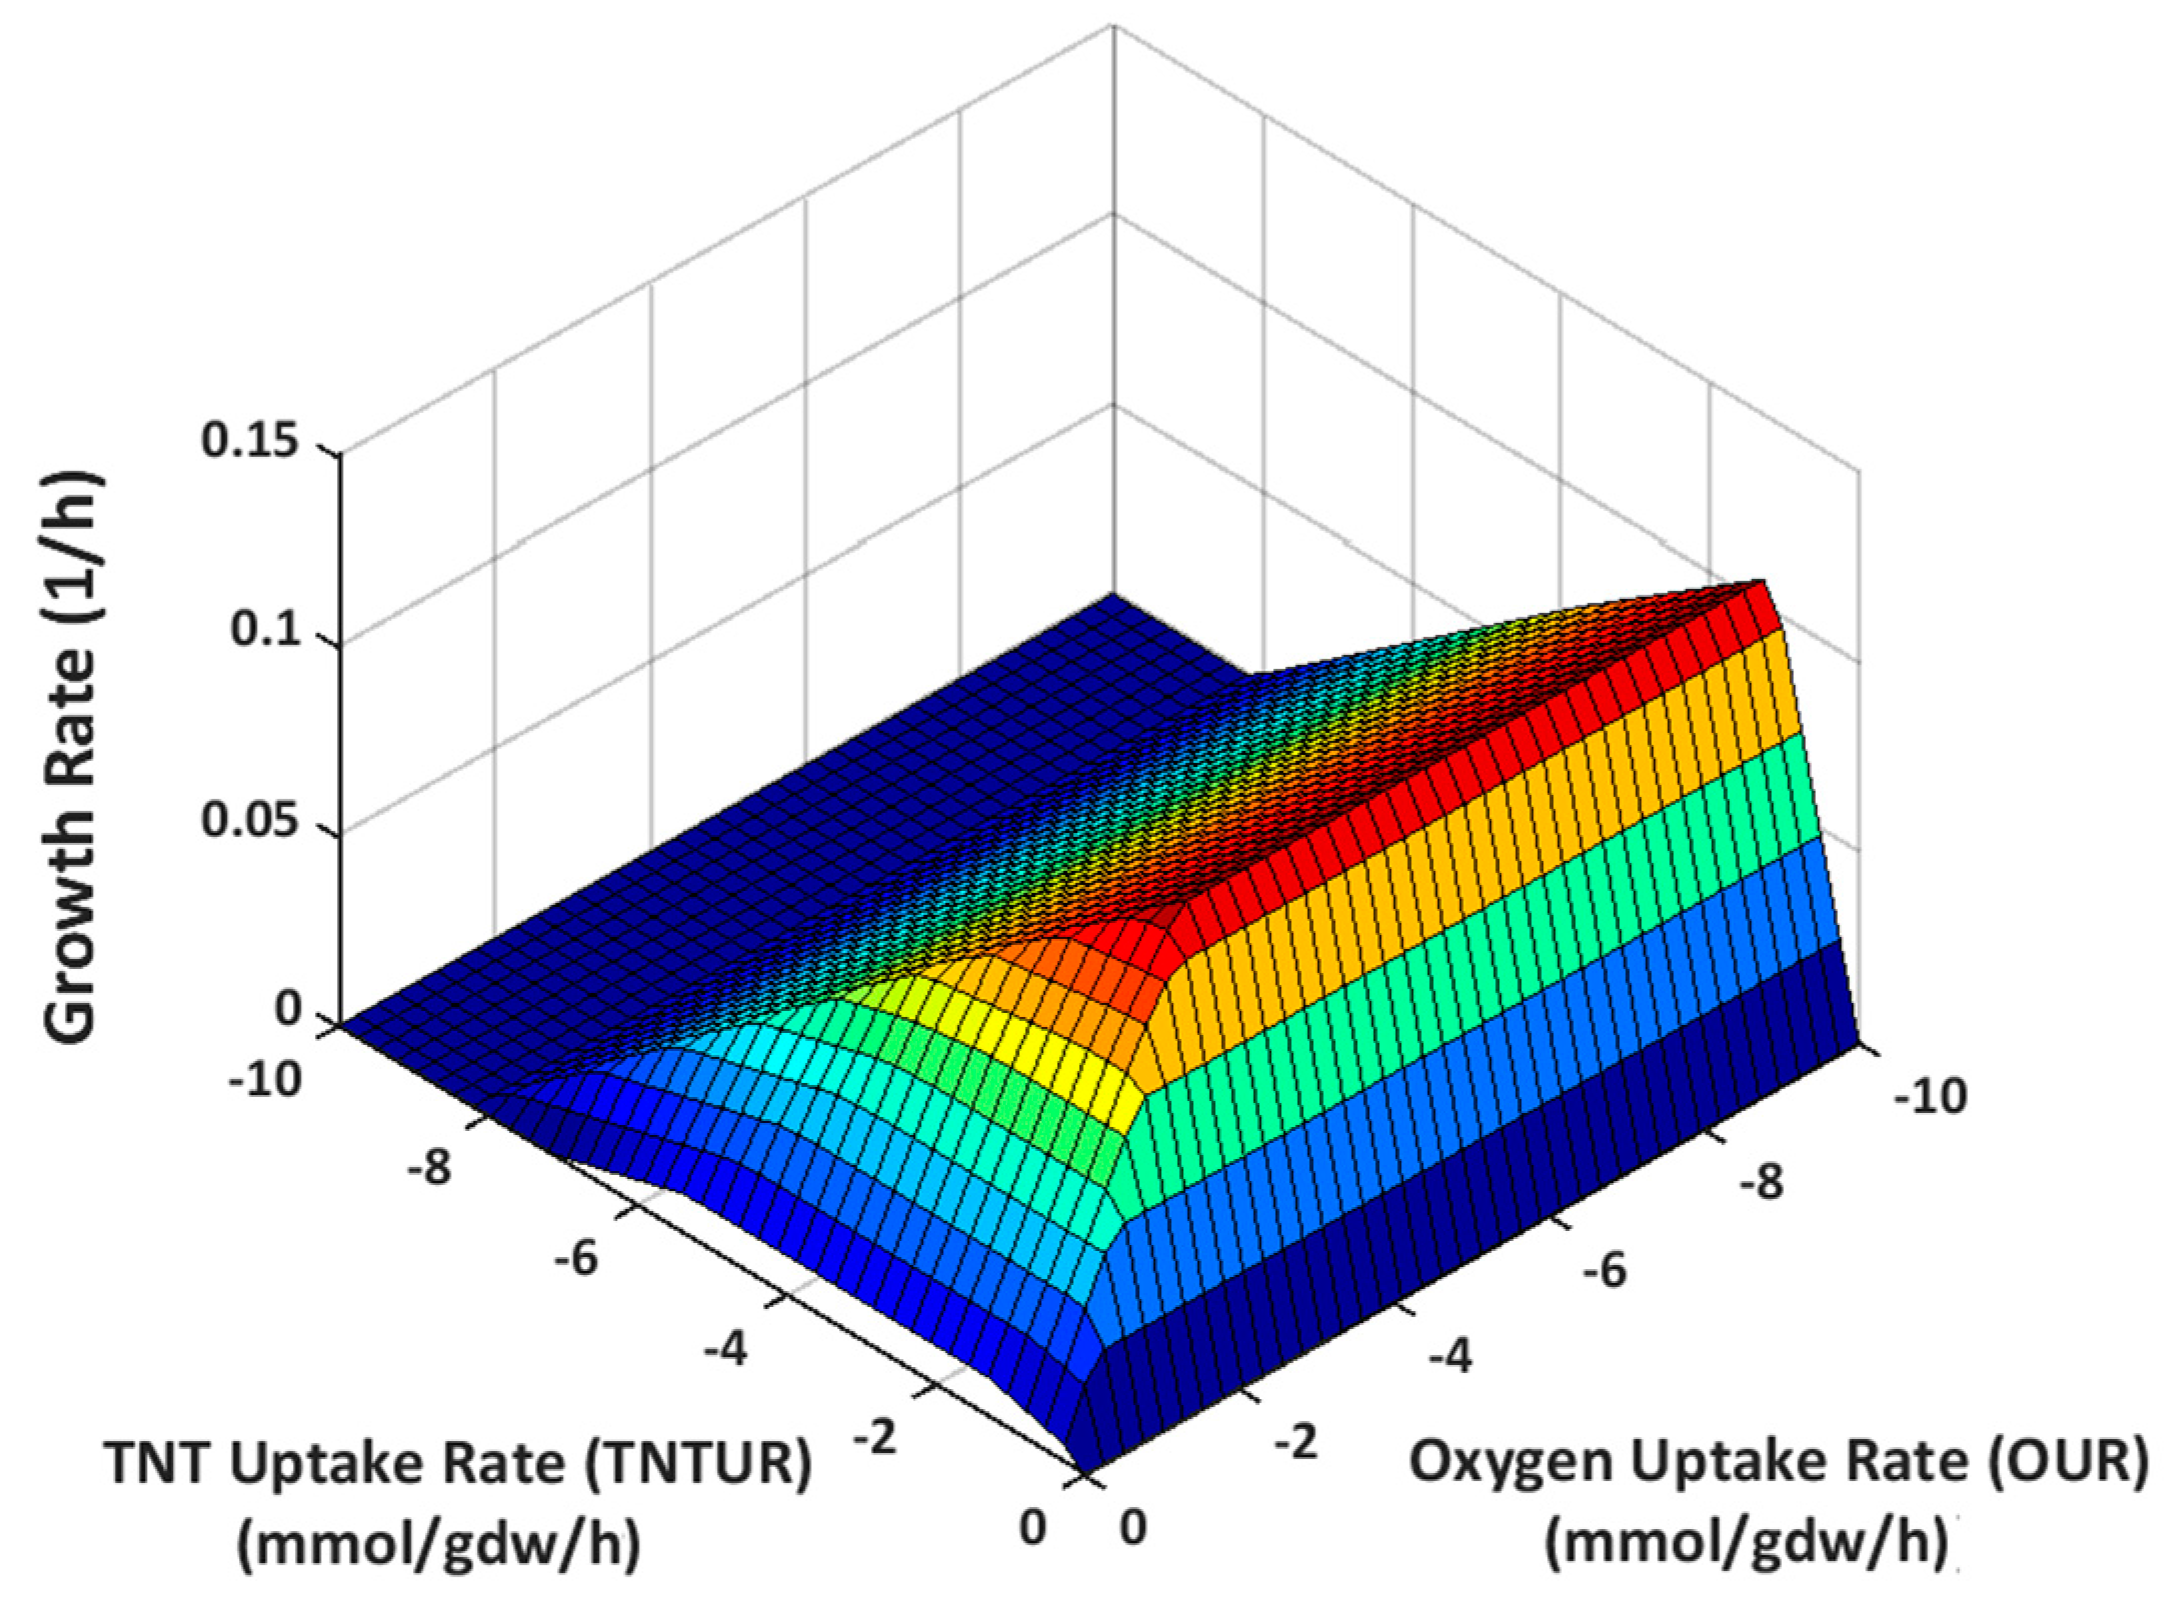
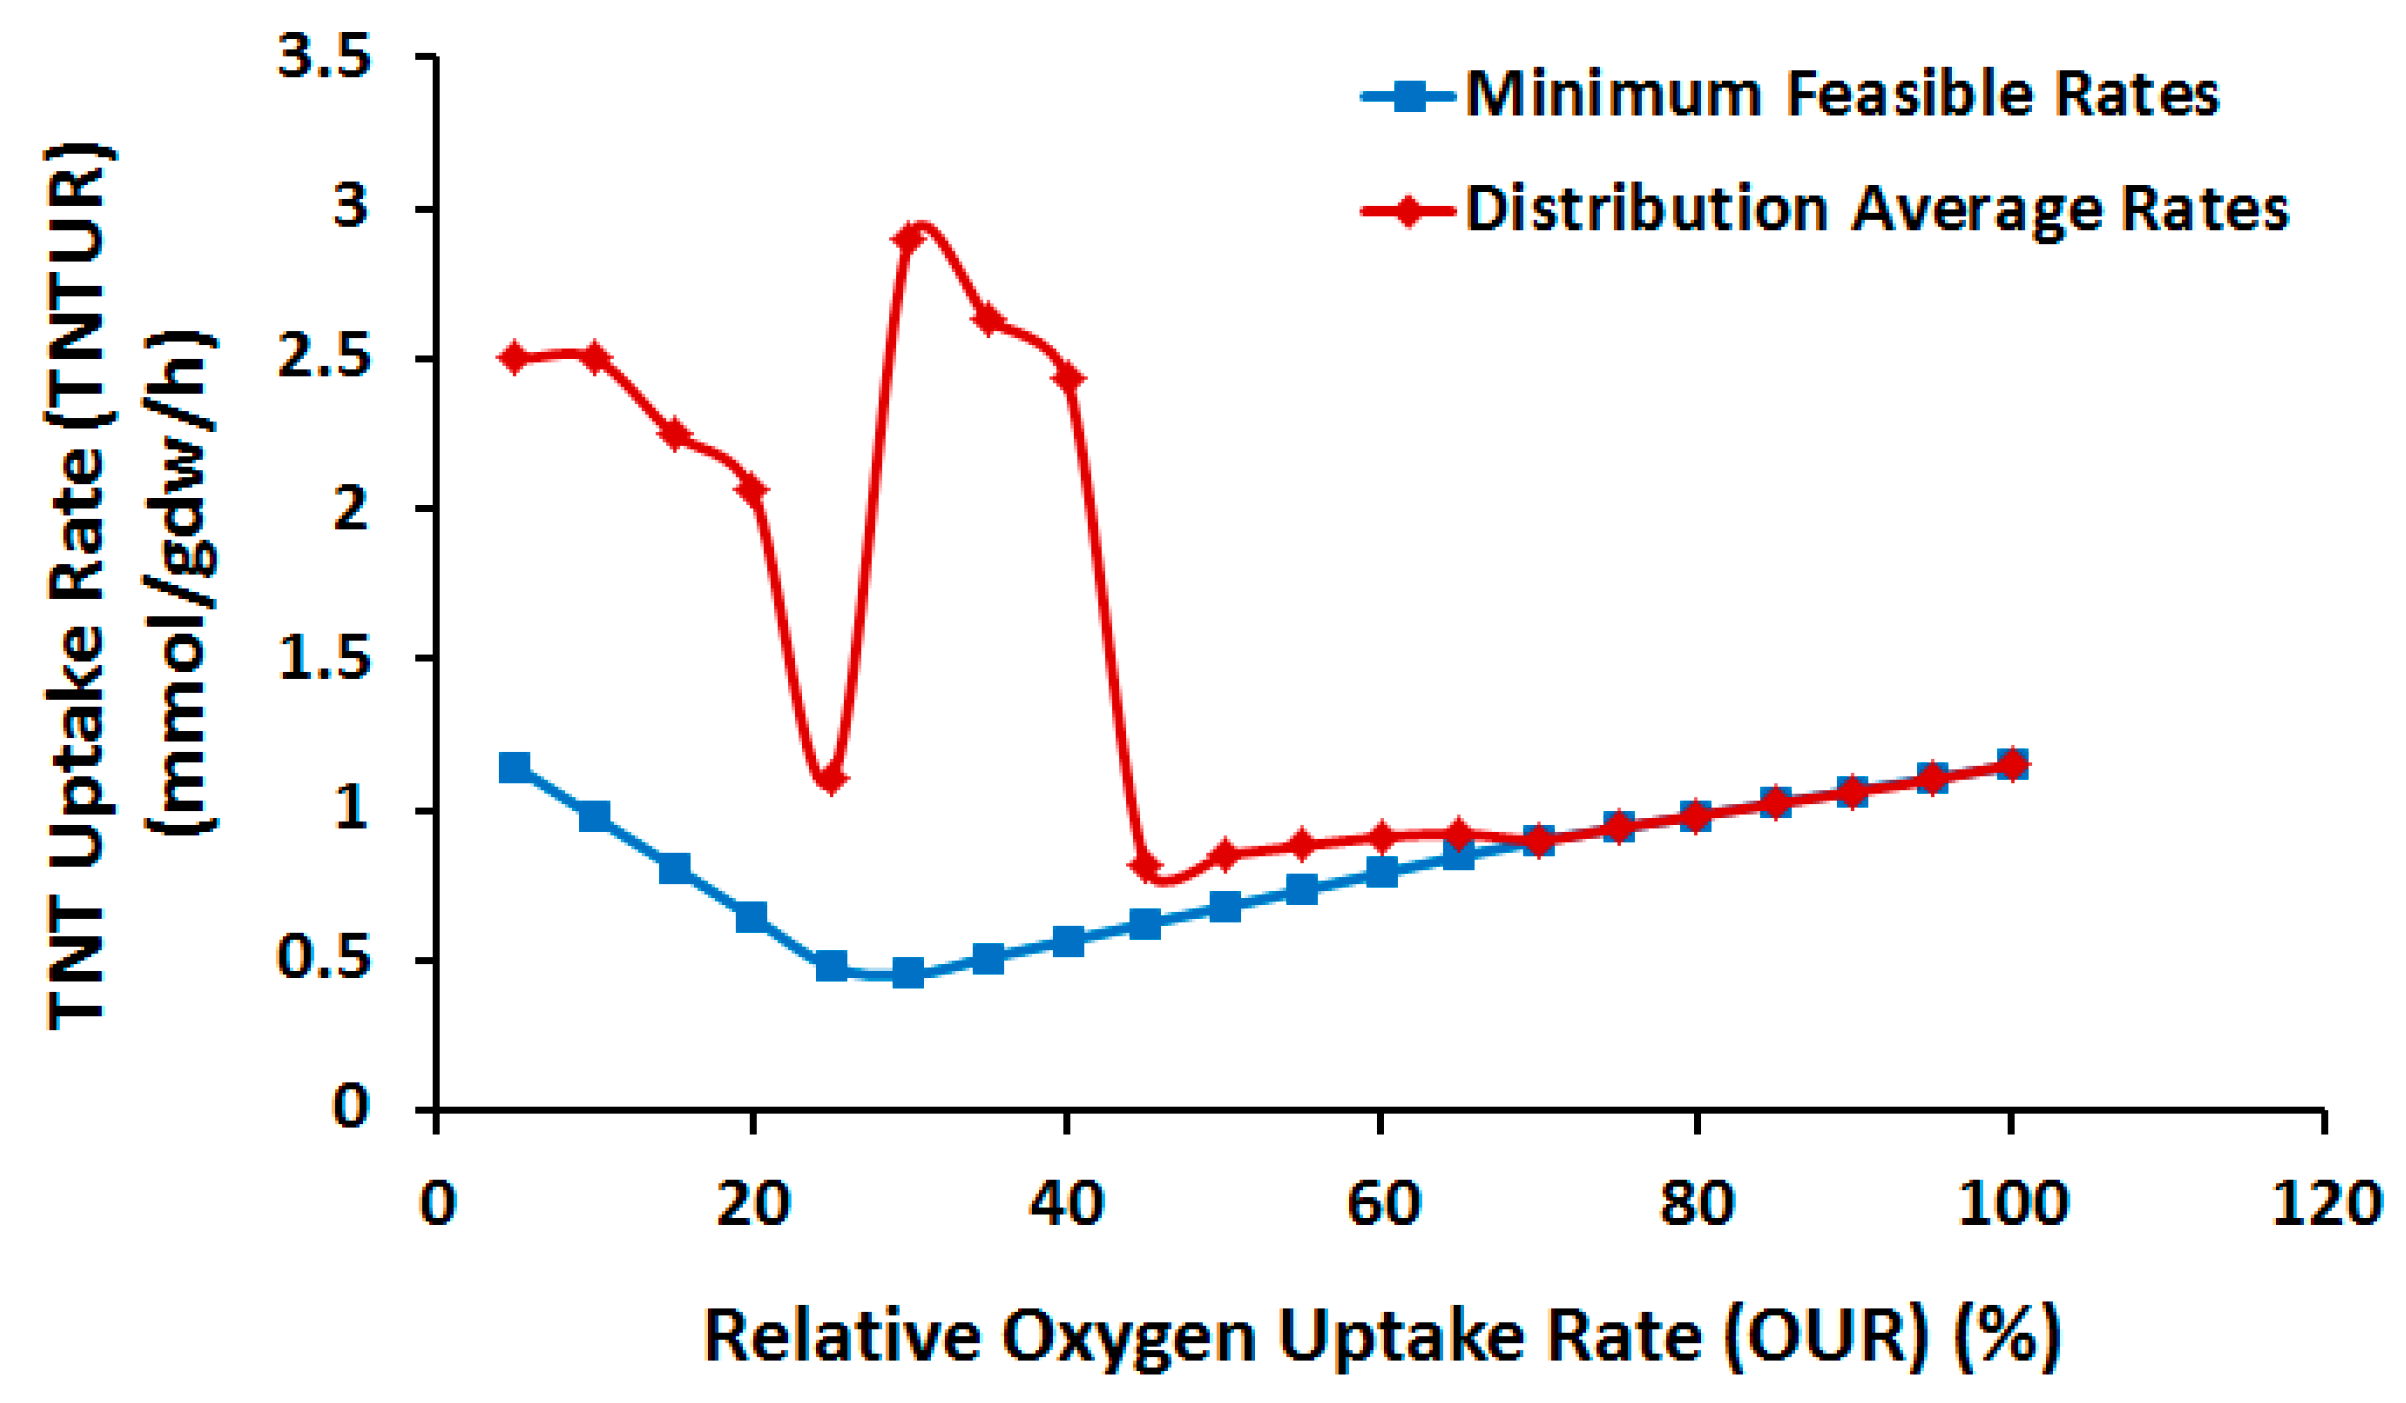
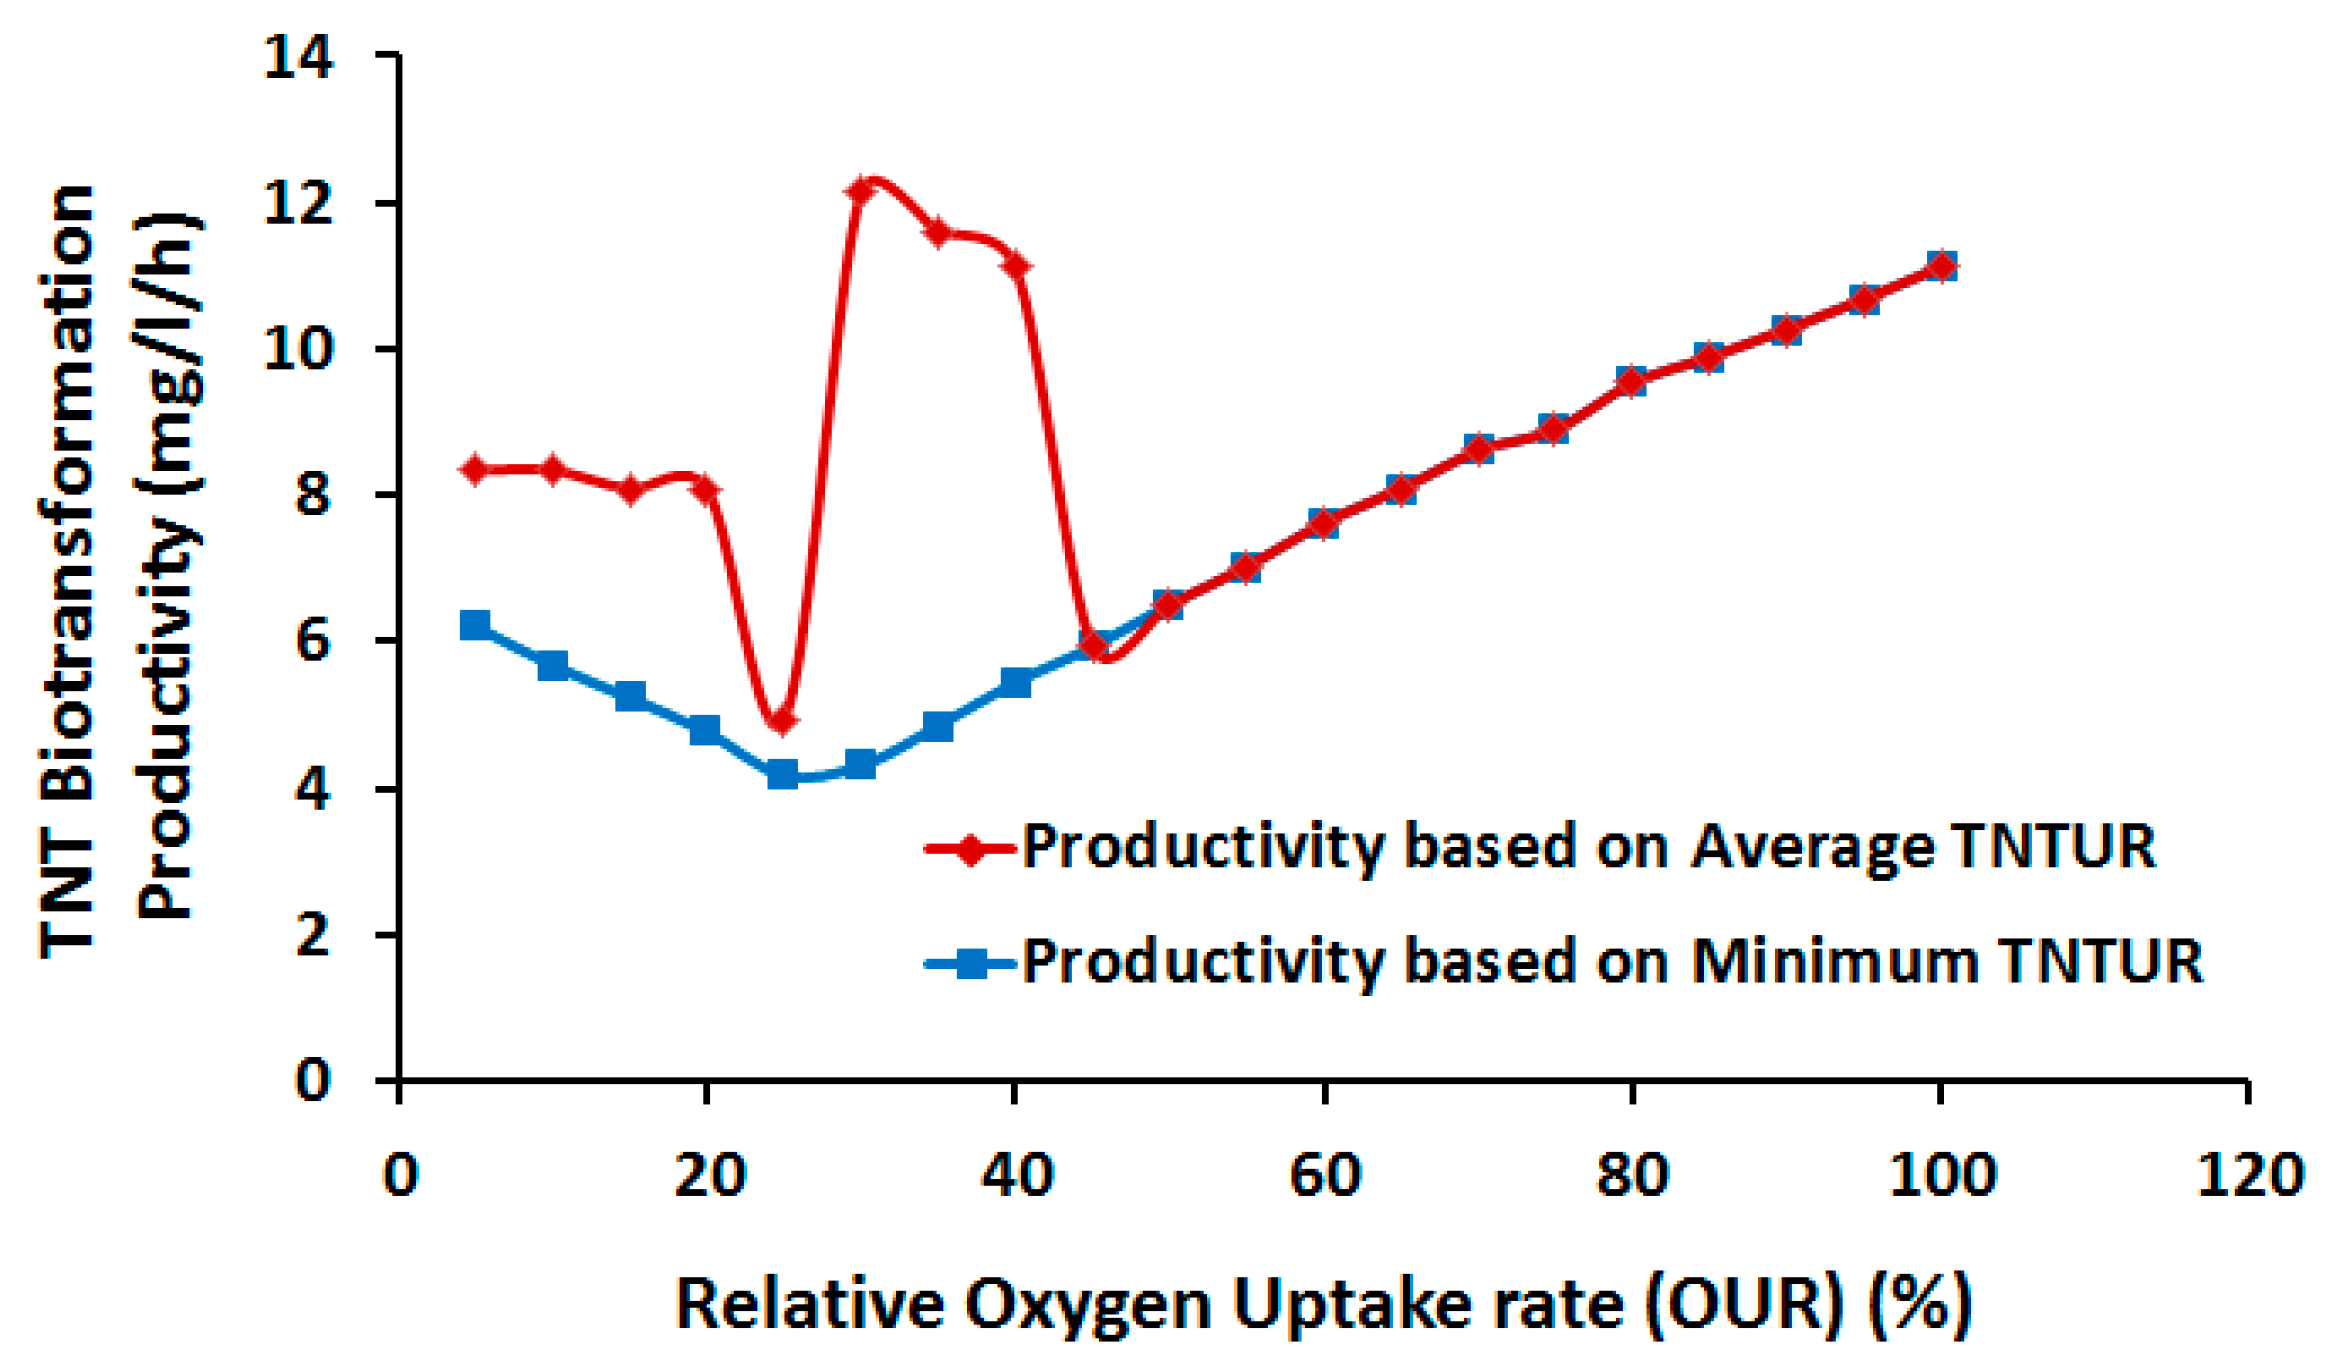
2.3.1. Effect of Oxygen Uptake
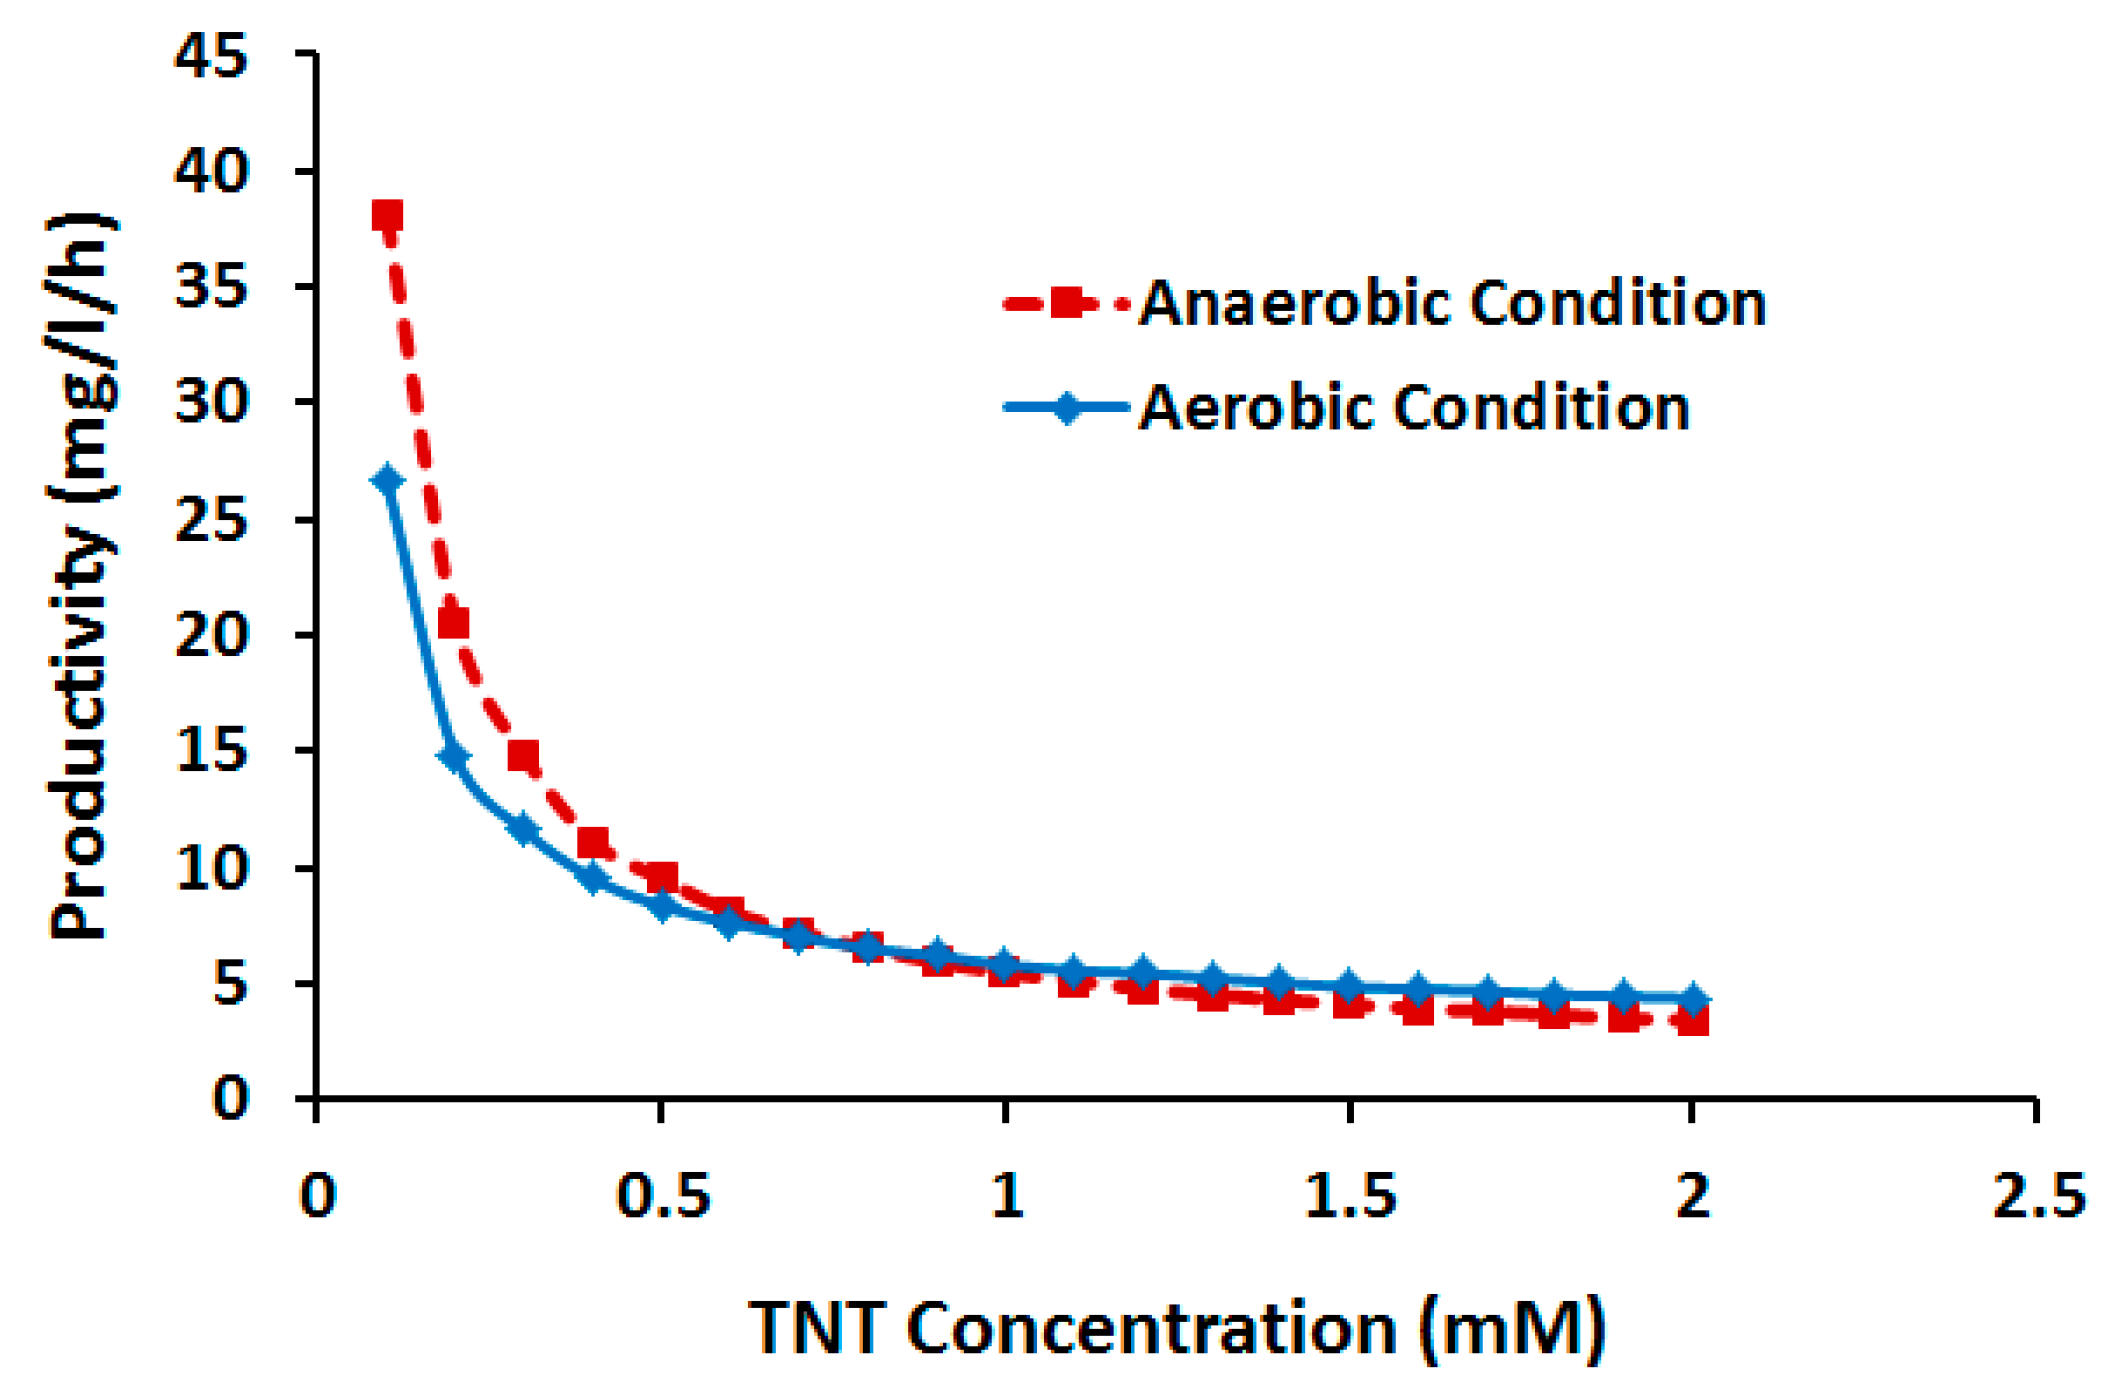
2.3.2. Effect of TNT Concentration
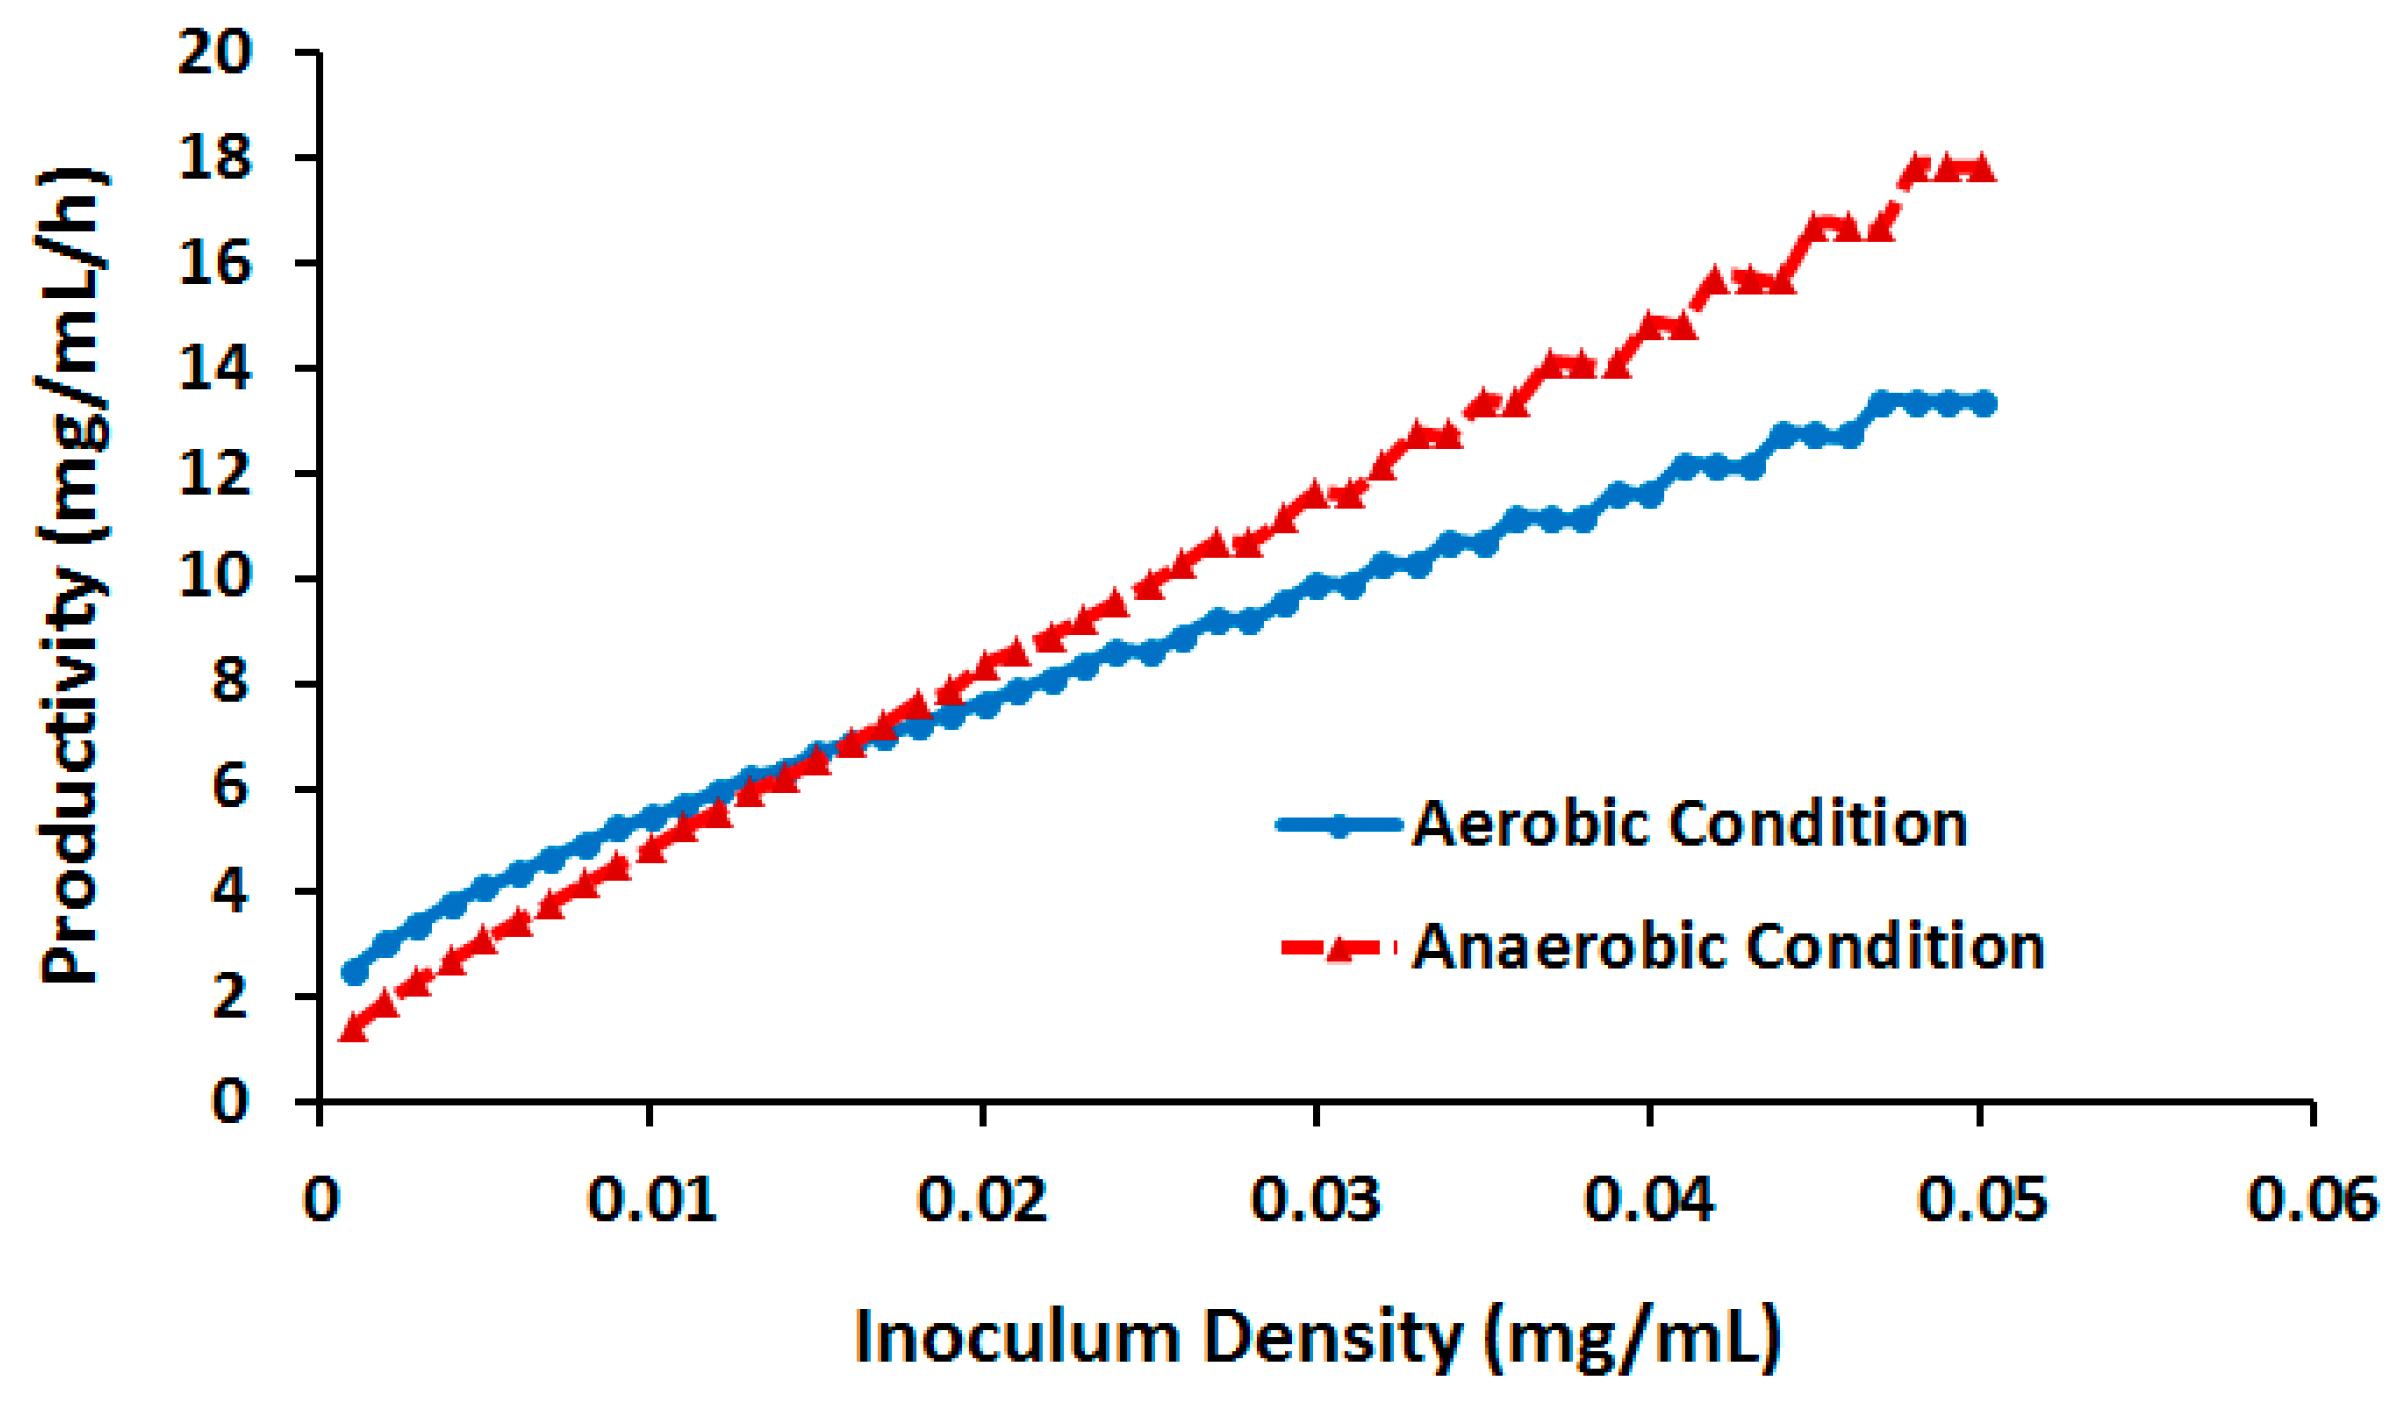
2.3.3. Effect of Cell Density
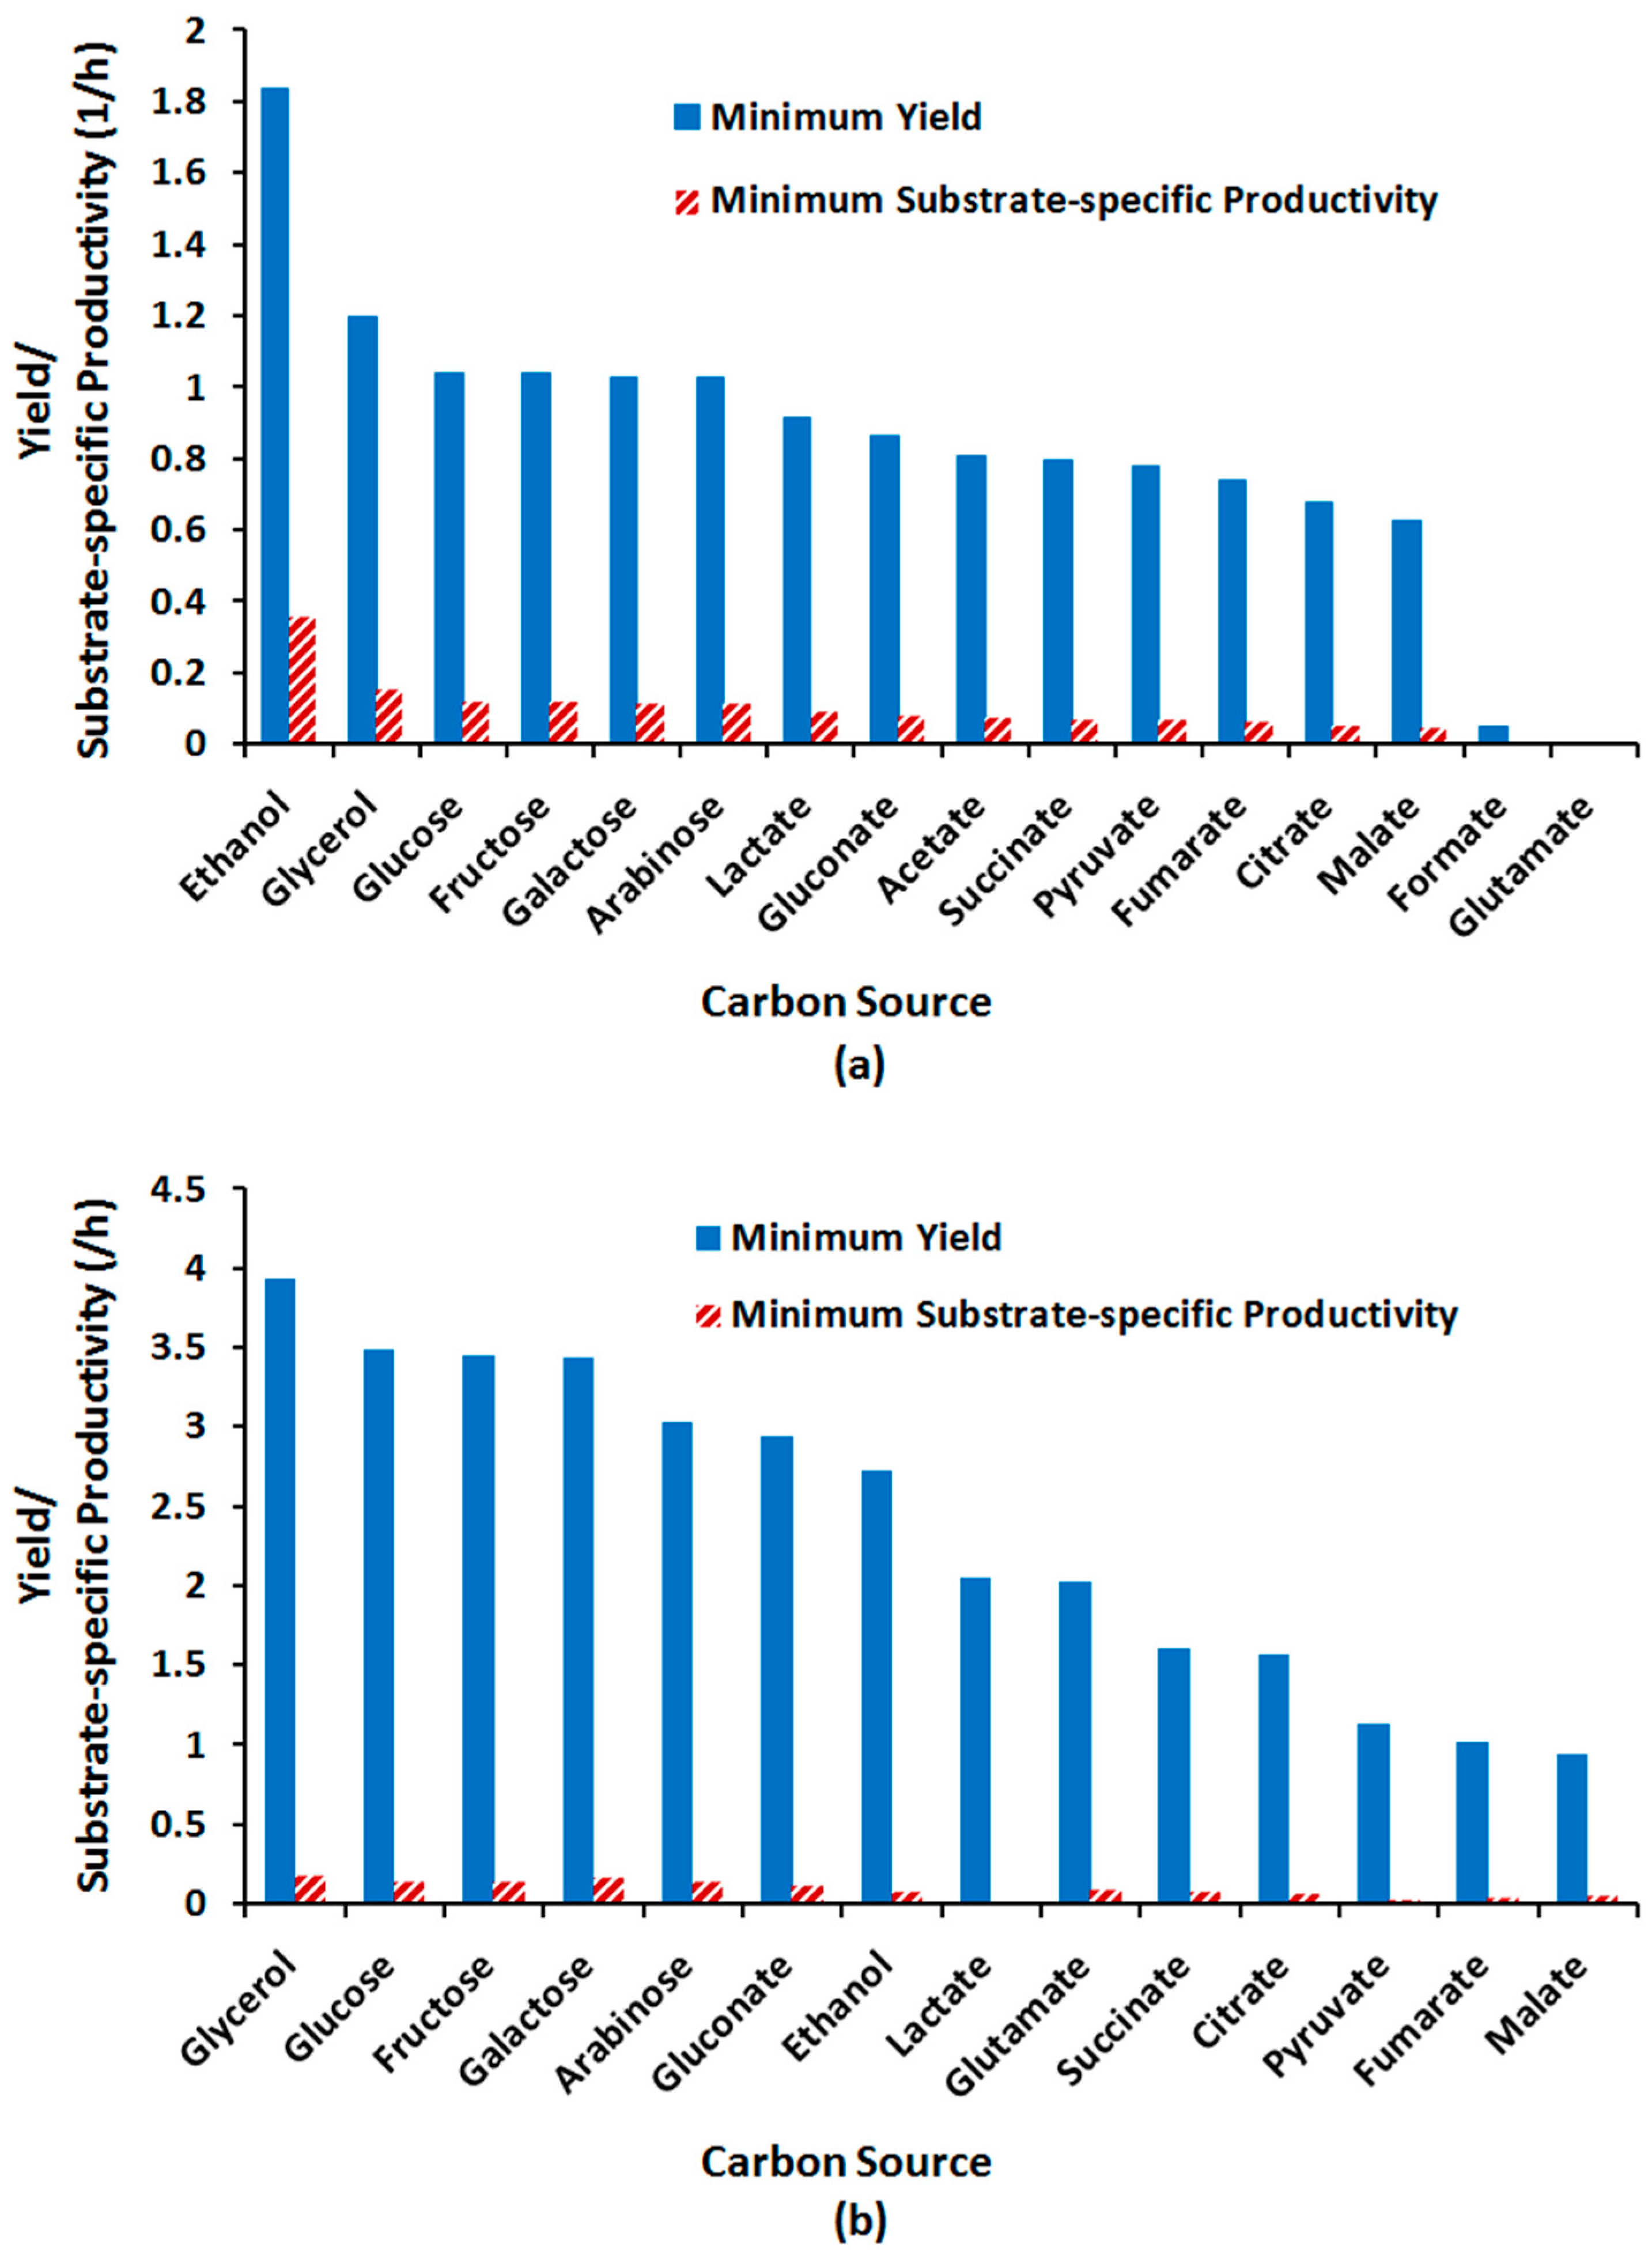
2.3.4. Effect of Alternative Carbon Sources
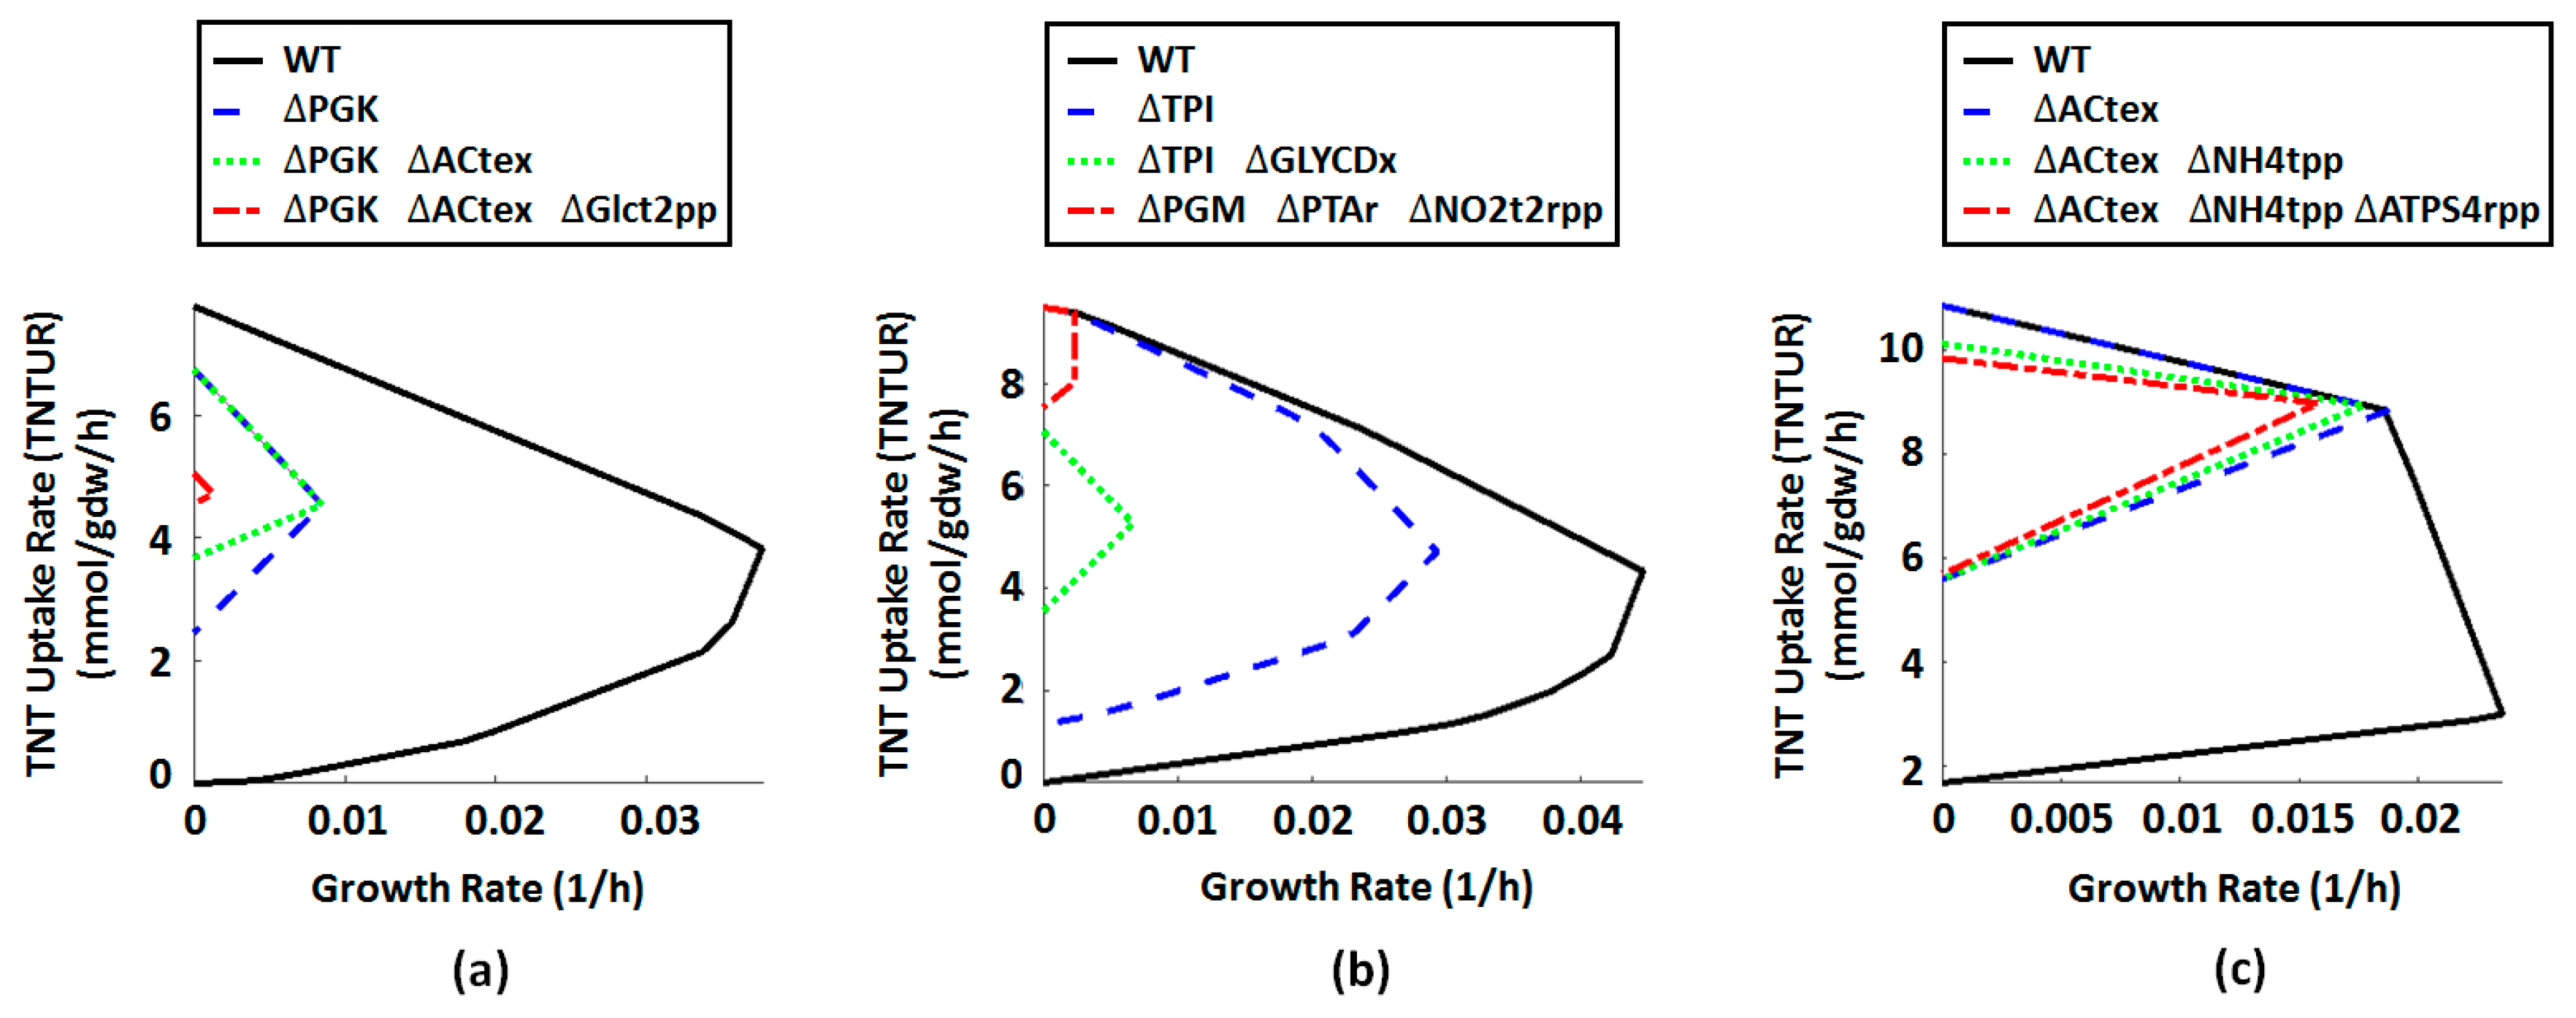
2.4. Metabolic Engineering Targets for Improved Biotransformation of TNT
4. Materials and Methods
4.1. Model Preparation
4.2. Constraint-Based Analysis
4.2.1. Flux Balance Analysis
4.2.2. Dynamic Flux Balance Analysis
4.2.3. Flux Variability Analysis
4.2.4. Sampling of Solution Space
4.2.5. Robustness Analysis
4.2.6. Phenotype Phase Plane Analysis
4.3. In Silico Strain Design
5. Conclusions
Supplementary Materials
Author Contributions
Conflicts of Interest
Abbreviations
| CBA | constraint-based analysis |
| GSMM | genome-scale metabolic model |
| CBM | constraint-based model |
| FBA | flux balance analysis |
| DFBA | dynamic flux balance analysis |
| FVA | flux variability analysis |
| RA | robustness analysis |
| PhPP | phenotype phase plane |
| NACs | nitroaromatic compounds |
| TNT | 2,4,6,-trinitrotoluene |
| NDTs | nitrosodinitrotoluenes |
| ADNTs | aminodinitrotoluens |
| HADNTs | hydroxylaminodinitrotoluenes |
| DANTs | diaminonitrotoluenes |
| NODNT | 2-nitroso-4,6-dinitrotoluene |
| HADNT | 2-hydroxylamino-4,6-dinitrotoluene |
| ADNT | 2-amino-4,6-dinitrotoluene |
| ANONT | 2-amino-4-nitroso-6-nitrotoluene |
| HANT | 2-amino-4-hydroxylamino-6-nitrotoluene |
| DANT | 2,4-diamino-6-nitrotoluene |
| NOAT | 6-nitroso-2,4-diaminotoluene |
| HTAT | 6-hydroxylamino-2,4-diaminotoluene |
| TAT | 2,4,6-triaminotoluene |
| DHDNT | 2,5-dihydroxy-4,6-dinitrotoluene |
| AHDNT | 2-amino-5hydroxyl-4,6-dinitrotoluene |
| 3h-tnt | TNT-monohydride complex [(3-H-)-TNT] |
| 3,5,2h-tnt-h | TNT-dihydride complex [(3,5-2H-)-TNT.H+] |
| N,N(3,5-DNT)amine | N,N-bis(3,5-dinitrotolyl) amine |
| NRP | nitroreduction pathway |
| DAP | deamination pathway |
| DNP | denitration pathway |
| GR | growth rate |
| GUR | glucose uptake rate |
| IGC | initial glucose concentration |
| OUR | oxygen uptake rate |
| TNTUR | TNT uptake rate |
| ITNTC | initial TNT concentration |
| CD | cell density |
| ID | inoculum density |
| CS | carbon source |
| OF | objective function |
| KO | knockout |
| WT | wild-type |
| ME | metabolic engineering |
References
- Ju, K.-S.; Parales, R.E. Nitroaromatic compounds, from synthesis to biodegradation. Microbiol. Mol. Biol. Rev. 2010, 74, 250–272. [Google Scholar] [CrossRef] [PubMed]
- Symons, Z.C.; Bruce, N.C. Bacterial pathways for degradation of nitroaromatics. Nat. Prod. Rep. 2006, 23, 845–850. [Google Scholar] [CrossRef] [PubMed]
- Kulkarni, M.; Chaudhari, A. Microbial remediation of nitro-aromatic compounds: An overview. J. Environ. Manag. 2007, 85, 496–512. [Google Scholar] [CrossRef] [PubMed]
- Ding, Y.-L.; Lyu, Y.-C.; Leong, M.K. In silico prediction of the mutagenicity of nitroaromatic compounds using a novel two-qsar approach. Toxicol. In Vitro 2017, 40, 102–114. [Google Scholar] [CrossRef] [PubMed]
- Kovacic, P.; Somanathan, R. Nitroaromatic compounds: Environmental toxicity, carcinogenicity, mutagenicity, therapy and mechanism. J. Appl. Toxicol. 2014, 34, 810–824. [Google Scholar] [CrossRef] [PubMed]
- Singh, B.; Kaur, J.; Singh, K. Microbial remediation of explosive waste. Crit. Rev. Microbiol. 2012, 38, 152–167. [Google Scholar] [CrossRef] [PubMed]
- USEPA. Available online: https://www.epa.gov/sites/production/files/2015–09/documents/priority-pollutant-list-epa.pdf. (accessed on 15 May 2017).
- Nath Singh, S. Biological Remediation of Explosive Residues; Springer: Cham, Switzerland, 2014. [Google Scholar]
- Stenuit, B.A.; Agathos, S.N. Microbial 2,4,6-trinitrotoluene degradation: Could we learn from (bio)chemistry for bioremediation and vice versa? Appl. Microbiol. Biot. 2010, 88, 1043–1064. [Google Scholar] [CrossRef] [PubMed]
- Tan, E.L.; Ho, C.H.; Griest, W.H.; Tyndall, R.L. Mutagenicity of trinitrotoluene and its metabolites formed during composting. J. Toxicol. Environ. Health 1992, 36, 165–175. [Google Scholar] [CrossRef] [PubMed]
- Kanekar, P.; Dautpure, P.; Sarnaik, S. Biodegradation of nitro-explosives. J. Exp. Biol. 2003, 41, 991–1001. [Google Scholar]
- Ayoub, K.; van Hullebusch, E.D.; Cassir, M.; Bermond, A. Application of advanced oxidation processes for tnt removal: A review. J. Hazard. Mater. 2010, 178, 10–28. [Google Scholar] [CrossRef] [PubMed]
- Esteve-Núñez, A.; Caballero, A.; Ramos, J.L. Biological degradation of 2,4,6-trinitrotoluene. Microbiol. Mol. Biol. Rev. 2001, 65, 335–352. [Google Scholar] [CrossRef] [PubMed]
- Mercimek, H.A.; Dincer, S.; Guzeldag, G.; Ozsavli, A.; Matyar, F.; Arkut, A.; Kayis, F.; Ozdenefe, M.S. Degradation of 2,4,6-trinitrotoluene by p. Aeruginosa and characterization of some metabolites. Braz. J. Microbiol. 2015, 46, 103–111. [Google Scholar] [CrossRef] [PubMed]
- Kivisaar, M. Evolution of catabolic pathways and their regulatory systems in synthetic nitroaromatic compounds degrading bacteria. Mol. Microbiol. 2011, 82, 265–268. [Google Scholar] [CrossRef] [PubMed]
- Fernández, M.; Duque, E.; Pizarro-Tobías, P.; Van Dillewijn, P.; Wittich, R.M.; Ramos, J.L. Microbial responses to xenobiotic compounds. Identification of genes that allow pseudomonas putida kt2440 to cope with 2,4,6-trinitrotoluene. Microb. Biotechnol. 2009, 2, 287–294. [Google Scholar] [CrossRef] [PubMed]
- Choi, J.-W.; Lee, J.; Nishi, K.; Kim, Y.-S.; Jung, C.-H.; Kim, J.-S. Crystal structure of a minimal nitroreductase, ydja, from Escherichia coli k12 with and without fmn cofactor. J. Mol. Biol. 2008, 377, 258–267. [Google Scholar] [CrossRef] [PubMed]
- Van Dillewijn, P.; Wittich, R.-M.; Caballero, A.; Ramos, J.-L. Subfunctionality of hydride transferases of the old yellow enzyme family of flavoproteins of pseudomonas putida. Appl. Environ. Microb. 2008, 74, 6703–6708. [Google Scholar] [CrossRef] [PubMed]
- Roldán, M.D.; Pérez-Reinado, E.; Castillo, F.; Moreno-Vivián, C. Reduction of polynitroaromatic compounds: The bacterial nitroreductases. FEMS Microbiol. Rev. 2008, 32, 474–500. [Google Scholar] [CrossRef] [PubMed]
- Smets, B.F.; Yin, H.; Esteve-Nuñez, A. TNT biotransformation: When chemistry confronts mineralization. Appl. Microbiol. Biot. 2007, 76, 267–277. [Google Scholar] [CrossRef] [PubMed]
- Boopathy, R. Biodegradation of 2,4,6-trinitrotoluene (tnt) under sulfate and nitrate reducing conditions. Biologia 2014, 69, 1264–1270. [Google Scholar] [CrossRef]
- Muter, O.; Potapova, K.; Limane, B.; Sproge, K.; Jakobsone, I.; Cepurnieks, G.; Bartkevics, V. The role of nutrients in the biodegradation of 2,4,6-trinitrotoluene in liquid and soil. J. Environ. Manag. 2012, 98, 51–55. [Google Scholar] [CrossRef] [PubMed]
- Park, C.; Kim, T.-H.; Kim, S.; Kim, S.-W.; Lee, J.; Kim, S.-H. Optimization for biodegradation of 2,4,6-trinitrotoluene (TNT) by pseudomonas putida. J. Biosci. Bioeng. 2003, 95, 567–571. [Google Scholar] [CrossRef]
- Park, C.; Kim, T.H.; Kim, S.; Kim, S.W.; Lee, J. Enhanced biodegradation of 2, 4, 6-trinitrotoluene (TNT) with various supplemental energy sources. J. Microbiol. Biotech. 2002, 12, 695–698. [Google Scholar]
- Boopathy, R.; Manning, J.; Kulpa, C. Optimization of environmental factors for the biological treatment of trinitrotoluene-contaminated soil. Arch. Environ. Contam. Toxicol. 1997, 32, 94–98. [Google Scholar] [CrossRef] [PubMed]
- De Lorme, M.; Craig, M. Biotransformation of 2,4,6-trinitrotoluene by pure culture ruminal bacteria. Curr. Microbiol. 2009, 58, 81–86. [Google Scholar] [CrossRef] [PubMed]
- Stenuit, B.; Eyers, L.; Rozenberg, R.; Habib-Jiwan, J.-L.; Agathos, S.N. Aerobic growth of Escherichia coli with 2,4,6-trinitrotoluene (tnt) as the sole nitrogen source and evidence of TNT denitration by whole cells and cell-free extracts. Appl. Environ. Microb. 2006, 72, 7945–7948. [Google Scholar] [CrossRef] [PubMed]
- González-Pérez, M.; Van Dillewijn, P.; Wittich, R.M.; Ramos, J.L. Escherichia coli has multiple enzymes that attack tnt and release nitrogen for growth. Appl. Environ. Microb. 2007, 9, 1535–1540. [Google Scholar] [CrossRef] [PubMed]
- Yin, H.; Wood, T.K.; Smets, B.F. Reductive transformation of TNT by Escherichia coli: Pathway description. Appl. Microbiol. Biot. 2005, 67, 397–404. [Google Scholar] [CrossRef] [PubMed]
- Yin, H.; Wood, T.K.; Smets, B.F. Reductive transformation of TNT by Escherichia coli resting cells: Kinetic analysis. Appl. Microbiol. Biot. 2005, 69, 326–334. [Google Scholar] [CrossRef] [PubMed]
- Kurinenko, B.M.; Denivarova, N.A.; Yakovleva, G.Y. Sensitivity of various Escherichia coli strains to 2,4,6-trinitrotoluene. Appl. Biochem. Microbiol. 2005, 41, 47–50. [Google Scholar] [CrossRef]
- Fuller, M.E.; Manning, J.; John, F. Aerobic gram-positive and gram-negative bacteria exhibit differential sensitivity to and transformation of 2,4,6-trinitrotoluene (TNT). Curr. Microbiol. 1997, 35, 77–83. [Google Scholar] [CrossRef] [PubMed]
- Gustavsson, M.; Lee, S.Y. Prospects of microbial cell factories developed through systems metabolic engineering. J. Microbiol. Biotech. 2016, 9, 610–617. [Google Scholar] [CrossRef] [PubMed]
- Choi, K.; Shin, J.; Cho, J.; Yang, D.; Lee, S. Systems metabolic engineering of Escherichia coli. EcoSal Plus 2016. [Google Scholar] [CrossRef] [PubMed]
- Edwards, L.M. Metabolic systems biology: A brief primer. J. Physiol. 2017, 595, 2849–2855. [Google Scholar] [CrossRef] [PubMed]
- Wang, Y.; Chu, J.; Zhuang, Y.; Wang, Y.; Xia, J.; Zhang, S. Industrial bioprocess control and optimization in the context of systems biotechnology. Biotechnol. Adv. 2009, 27, 989–995. [Google Scholar] [CrossRef] [PubMed]
- Schellenberger, J.; Que, R.; Fleming, R.M.T.; Thiele, I.; Orth, J.D.; Feist, A.M.; Zielinski, D.C.; Bordbar, A.; Lewis, N.E.; Rahmanian, S.; et al. Quantitative prediction of cellular metabolism with constraint-based models: The cobra toolbox v2.0. Nat. Protoc. 2011, 6, 1290–1307. [Google Scholar] [CrossRef] [PubMed]
- Lewis, N.E.; Nagarajan, H.; Palsson, B.O. Constraining the metabolic genotype-phenotype relationship using a phylogeny of in silico methods. Nat. Rev. Microbiol. 2012, 10, 291–305. [Google Scholar] [CrossRef] [PubMed]
- Sohn, S.B.; Kim, T.Y.; Park, J.M.; Lee, S.Y. In silico genome-scale metabolic analysis of pseudomonas putida kt2440 for polyhydroxyalkanoate synthesis, degradation of aromatics and anaerobic survival. J. Biotechnol. 2010, 5, 739–750. [Google Scholar] [CrossRef] [PubMed]
- Ahsanul Islam, M.; Edwards, E.A.; Mahadevan, R. Characterizing the metabolism of dehalococcoides with a constraint-based model. PLoS Comput. Biol. 2010, 6, e1000887. [Google Scholar] [CrossRef] [PubMed]
- Sun, J.; Sayyar, B.; Butler, J.E.; Pharkya, P.; Fahland, T.R.; Famili, I.; Schilling, C.H.; Lovley, D.R.; Mahadevan, R. Genome-scale constraint-based modeling of geobacter metallireducens. BMC Syst. Biol. 2009, 3, 15. [Google Scholar] [CrossRef] [PubMed]
- Aggarwal, S.; Karimi, I.A.; Lee, D.Y. Reconstruction of a genome-scale metabolic network of rhodococcus erythropolis for desulfurization studies. Mol. Biosyst. 2011, 7, 3122–3131. [Google Scholar] [CrossRef] [PubMed]
- Orth, J.D.; Conrad, T.M.; Na, J.; Lerman, J.A.; Nam, H.; Feist, A.M.; Palsson, B.Ø. A comprehensive genome-scale reconstruction of Escherichia coli metabolism—2011. Mol. Syst. Biol. 2011, 7, 535. [Google Scholar] [CrossRef] [PubMed]
- Kalafut, T.; Wales, M.E.; Rastogi, V.K.; Naumova, R.P.; Zaripova, S.K.; Wild, J.R. Biotransformation patterns of 2,4,6-trinitrotoluene by aerobic bacteria. Curr. Microbiol. 1998, 36, 45–54. [Google Scholar] [CrossRef] [PubMed]
- Wittich, R.-M.; Ramos, J.L.; Dillewijn, P.V. Microorganisms and explosives: Mechanisms of nitrogen release from TNT for use as an n-source for growth. Environ. Sci. Technol. 2009, 43, 2773–2776. [Google Scholar] [CrossRef] [PubMed]
- Schellenberger, J.; Palsson, B.Ø. Use of randomized sampling for analysis of metabolic networks. J. Biol. Chem. 2009, 284, 5457–5461. [Google Scholar] [CrossRef] [PubMed]
- McCormick, N.G.; Feeherry, F.E.; Levinson, H.S. Microbial transformation of 2,4,6-trinitrotoluene and other nitroaromatic compounds. Appl. Environ. Microbiol. 1976, 31, 949–958. [Google Scholar] [PubMed]
- Ederer, M.M.; Lewis, T.A.; Crawford, R.L. 2,4,6-trinitrotoluene (TNT) transformation by clostridia isolated from a munition-fed bioreactor: Comparison with non-adapted bacteria. J. Ind. Microbiol. Biot. 1997, 18, 82–88. [Google Scholar] [CrossRef]
- Gilcrease, P.C.; Murphy, V.G. Bioconversion of 2,4-diamino-6-nitrotoluene to a novel metabolite under anoxic and aerobic conditions. Appl. Environ. Microb. 1995, 61, 4209–4214. [Google Scholar]
- Edwards, J.S.; Palsson, B.O. Robustness analysis of the escherichiacoli metabolic network. Biotechnol. Prog. 2000, 16, 927–939. [Google Scholar] [CrossRef] [PubMed]
- Oh, B.-T.; Shea, P.J.; Drijber, R.A.; Vasilyeva, G.K.; Sarath, G. Tnt biotransformation and detoxification by a pseudomonas aeruginosa strain. Biodegradation 2003, 14, 309–319. [Google Scholar] [CrossRef] [PubMed]
- Kubota, A.; Maeda, T.; Nagafuchi, N.; Kadokami, K.; Ogawa, H.I. Tnt biodegradation and production of dihydroxylaminonitrotoluene by aerobic tnt degrader pseudomonas sp. Strain tm15 in an anoxic environment. Biodegradation 2008, 19, 795–805. [Google Scholar] [CrossRef] [PubMed]
- Nadeau, L.J.; He, Z.; Spain, J.C. Bacterial conversion of hydroxylamino aromatic compounds by both lyase and mutase enzymes involves intramolecular transfer of hydroxyl groups. Appl. Environ. Microbiol. 2003, 69, 2786–2793. [Google Scholar] [CrossRef] [PubMed]
- Huang, S.; Lindahl, P.A.; Wang, C.; Bennett, G.N.; Rudolph, F.B.; Hughes, J.B. 2,4,6-trinitrotoluene reduction by carbon monoxide dehydrogenase from clostridium thermoaceticum. Appl. Environ. Microbiol. 2000, 66, 1474–1478. [Google Scholar] [CrossRef] [PubMed]
- Moreno-Vivián, C.; Cabello, P.; Martínez-Luque, M.; Blasco, R.; Castillo, F. Prokaryotic nitrate reduction: Molecular properties and functional distinction among bacterial nitrate reductases. J. Bacteriol. 1999, 181, 6573–6584. [Google Scholar] [PubMed]
- Na, D.; Kim, T.Y.; Lee, S.Y. Construction and optimization of synthetic pathways in metabolic engineering. Curr. Opin. Microbiol. 2010, 13, 363–370. [Google Scholar] [CrossRef] [PubMed]
- Anesiadis, N.; Cluett, W.R.; Mahadevan, R. Dynamic metabolic engineering for increasing bioprocess productivity. Metab. Eng. 2008, 10, 255–266. [Google Scholar] [CrossRef] [PubMed]
- Peter, C.S.J.; Crowley, M.F.; Bomble, Y.J. Efficient estimation of the maximum metabolic productivity of batch systems. Biotechnol. Biofuels 2017, 10, 28. [Google Scholar]
- Hjersted, J.L.; Henson, M.A. Optimization of fed-batch saccharomyces cerevisiae fermentation using dynamic flux balance models. Biotechnol. Prog. 2006, 22, 1239–1248. [Google Scholar] [CrossRef] [PubMed]
- Park, J.M.; Song, H.; Lee, H.J.; Seung, D. Genome-scale reconstruction and in silico analysis of klebsiella oxytoca for 2,3-butanediol production. Microb. Cell Fact. 2013, 12, 20. [Google Scholar] [CrossRef] [PubMed]
- Garcia-Ochoa, F.; Gomez, E.; Santos, V.E.; Merchuk, J.C. Oxygen uptake rate in microbial processes: An overview. Biochem. Eng. J. 2010, 49, 289–307. [Google Scholar] [CrossRef]
- Garcia-Ochoa, F.; Gomez, E. Bioreactor scale-up and oxygen transfer rate in microbial processes: An overview. Biotechnol. Adv. 2009, 27, 153–176. [Google Scholar] [CrossRef] [PubMed]
- Nogales, J.; Palsson, B.Ø.; Thiele, I. A genome-scale metabolic reconstruction of pseudomonas putida kt2440: I jn746 as a cell factory. BMC Syst. Biol. 2008, 2, 79. [Google Scholar] [CrossRef] [PubMed]
- Dasu, K.; Lee, L.S. Aerobic biodegradation of toluene-2,4-di(8:2 fluorotelomer urethane) and hexamethylene-1,6-di(8:2 fluorotelomer urethane) monomers in soils. Chemosphere 2016, 144, 2482–2488. [Google Scholar] [CrossRef] [PubMed]
- Kirui, W.K.; Wu, S.; Kizito, S.; Carvalho, P.N.; Dong, R. Pathways of nitrobenzene degradation in horizontal subsurface flow constructed wetlands: Effect of intermittent aeration and glucose addition. J. Environ. Manag. 2016, 166, 38–44. [Google Scholar] [CrossRef] [PubMed]
- Shinfuku, Y.; Sorpitiporn, N.; Sono, M.; Furusawa, C.; Hirasawa, T.; Shimizu, H. Development and experimental verification of a genome-scale metabolic model for corynebacterium glutamicum. Microb. Cell Fact. 2009, 8, 43. [Google Scholar] [CrossRef] [PubMed]
- Liu, T.; Zou, W.; Liu, L.; Chen, J. A constraint-based model of scheffersomyces stipitis for improved ethanol production. Biotechnol. Biofuels 2012, 5, 72. [Google Scholar] [CrossRef] [PubMed]
- Varma, A.; Palsson, B.O. Stoichiometric flux balance models quantitatively predict growth and metabolic by-product secretion in wild-type Escherichia coli w3110. Appl. Environ. Microbiol. 1994, 60, 3724–3731. [Google Scholar] [PubMed]
- Soini, J.; Ukkonen, K.; Neubauer, P. High cell density media for Escherichia coli are generally designed for aerobic cultivations—Consequences for large-scale bioprocesses and shake flask cultures. Microb. Cell Fact. 2008, 7, 26. [Google Scholar] [CrossRef] [PubMed]
- Fahrenfeld, N.; Pruden, A.; Widdowson, M. Kinetic and pathway modeling of reductive 2, 4, 6-trinitrotoluene biodegradation with different electron donors. J. Environ. Eng. 2015, 141, 04015014. [Google Scholar] [CrossRef]
- Nambou, K.; Jian, X.; Zhang, X.; Wei, L.; Lou, J.; Madzak, C.; Hua, Q. Flux balance analysis inspired bioprocess upgrading for lycopene production by a metabolically engineered strain of yarrowia lipolytica. Metabolites 2015, 5, 794–813. [Google Scholar] [CrossRef] [PubMed]
- Auger, C.; Han, S.; Appanna, V.P.; Thomas, S.C.; Ulibarri, G.; Appanna, V.D. Metabolic reengineering invoked by microbial systems to decontaminate aluminum: Implications for bioremediation technologies. Biotechnol. Adv. 2013, 31, 266–273. [Google Scholar] [CrossRef] [PubMed]
- Cao, B.; Nagarajan, K.; Loh, K.-C. Biodegradation of aromatic compounds: Current status and opportunities for biomolecular approaches. Appl. Microbiol. Biot. 2009, 85, 207–228. [Google Scholar] [CrossRef] [PubMed]
- Wood, T.K. Molecular approaches in bioremediation. Curr. Opin. Biotechnol. 2008, 19, 572–578. [Google Scholar] [CrossRef] [PubMed]
- Villas-Bôas, S.G.; Bruheim, P. The potential of metabolomics tools in bioremediation studies. OMICS 2007, 11, 305–313. [Google Scholar] [CrossRef] [PubMed]
- Tin Leung, K.; Campbell, S.; Gan, Y.; White, D.C.; Lee, H.; Trevors, J.T. The role of the sphingomonas species ug30 pentachlorophenol-4-monooxygenase in p-nitrophenol degradation. FEMS Microbiol. Lett. 1999, 173, 247–253. [Google Scholar] [CrossRef]
- Kadiyala, V.; Nadeau, L.J.; Spain, J.C. Construction of Escherichia coli strains for conversion of nitroacetophenones to ortho-aminophenols. Appl. Environ. Microbiol. 2003, 69, 6520–6526. [Google Scholar] [CrossRef] [PubMed]
- Xu, C.; Liu, L.; Zhang, Z.; Jin, D.; Qiu, J.; Chen, M. Genome-scale metabolic model in guiding metabolic engineering of microbial improvement. Appl. Microbiol. Biot. 2013, 97, 519–539. [Google Scholar] [CrossRef] [PubMed]
- Sun, J.; Haveman, S.A.; Bui, O.; Fahland, T.R.; Lovley, D.R. Constraint-based modeling analysis of the metabolism of two pelobacter species. BMC Syst. Biol. 2010, 4, 174. [Google Scholar] [CrossRef] [PubMed]
- Perez-Garcia, O.; Lear, G.; Singhal, N. Metabolic network modeling of microbial interactions in natural and engineered environmental systems. Front. Microbiol. 2016, 7. [Google Scholar] [CrossRef] [PubMed]
- Orth, J.D.; Thiele, I.; Palsson, B. What is flux balance analysis? Nat. Biotechnol. 2010, 28, 245–248. [Google Scholar] [CrossRef] [PubMed]
- Feist, A.M.; Palsson, B.O. What do cells actually want? Genome Biol. 2016, 17, 110. [Google Scholar] [CrossRef] [PubMed]
- Antoniewicz, M.R. Dynamic metabolic flux analysis—Tools for probing transient states of metabolic networks. Curr. Opin. Microbiol. 2013, 24, 973–978. [Google Scholar] [CrossRef] [PubMed]
- Mahadevan, R.; Schilling, C.H. The effects of alternate optimal solutions in constraint-based genome-scale metabolic models. Metab. Eng. 2003, 5, 264–276. [Google Scholar] [CrossRef] [PubMed]
- Becker, S.A.; Feist, A.M.; Mo, M.L.; Hannum, G.; Palsson, B.O.; Herrgard, M.J. Quantitative prediction of cellular metabolism with constraint-based models: The cobra toolbox. Nat. Protoc. 2007, 2, 727–738. [Google Scholar] [CrossRef] [PubMed]
- Schilling, C.H.; Edwards, J.S.; Letscher, D.; Palsson, B.O. Combining pathway analysis with flux balance analysis for the comprehensive study of metabolic systems. Biotechnol. Bioeng. 2000, 71, 286–306. [Google Scholar] [CrossRef]
- Kim, B.; Kim, W.J.; Kim, D.I.; Lee, S.Y. Applications of genome-scale metabolic network model in metabolic engineering. J. Ind. Microbiol. Biot. 2015, 42, 339–348. [Google Scholar] [CrossRef] [PubMed]
- Long, M.R.; Ong, W.K.; Reed, J.L. Computational methods in metabolic engineering for strain design. Curr. Opin. Microbiol. 2015, 34, 135–141. [Google Scholar] [CrossRef] [PubMed]
- Burgard, A.P.; Pharkya, P.; Maranas, C.D. Optknock: A bilevel programming framework for identifying gene knockout strategies for microbial strain optimization. Biotechnol. Bioeng. 2003, 84, 647–657. [Google Scholar] [CrossRef] [PubMed]
- Tepper, N.; Shlomi, T. Predicting metabolic engineering knockout strategies for chemical production: Accounting for competing pathways. Bioinformatics 2010, 26, 536–543. [Google Scholar] [CrossRef] [PubMed]
Sample Availability: Samples of the compounds are available from the authors. |


| Compound | Aerobic Conditions | Anaerobic Conditions | ||||
|---|---|---|---|---|---|---|
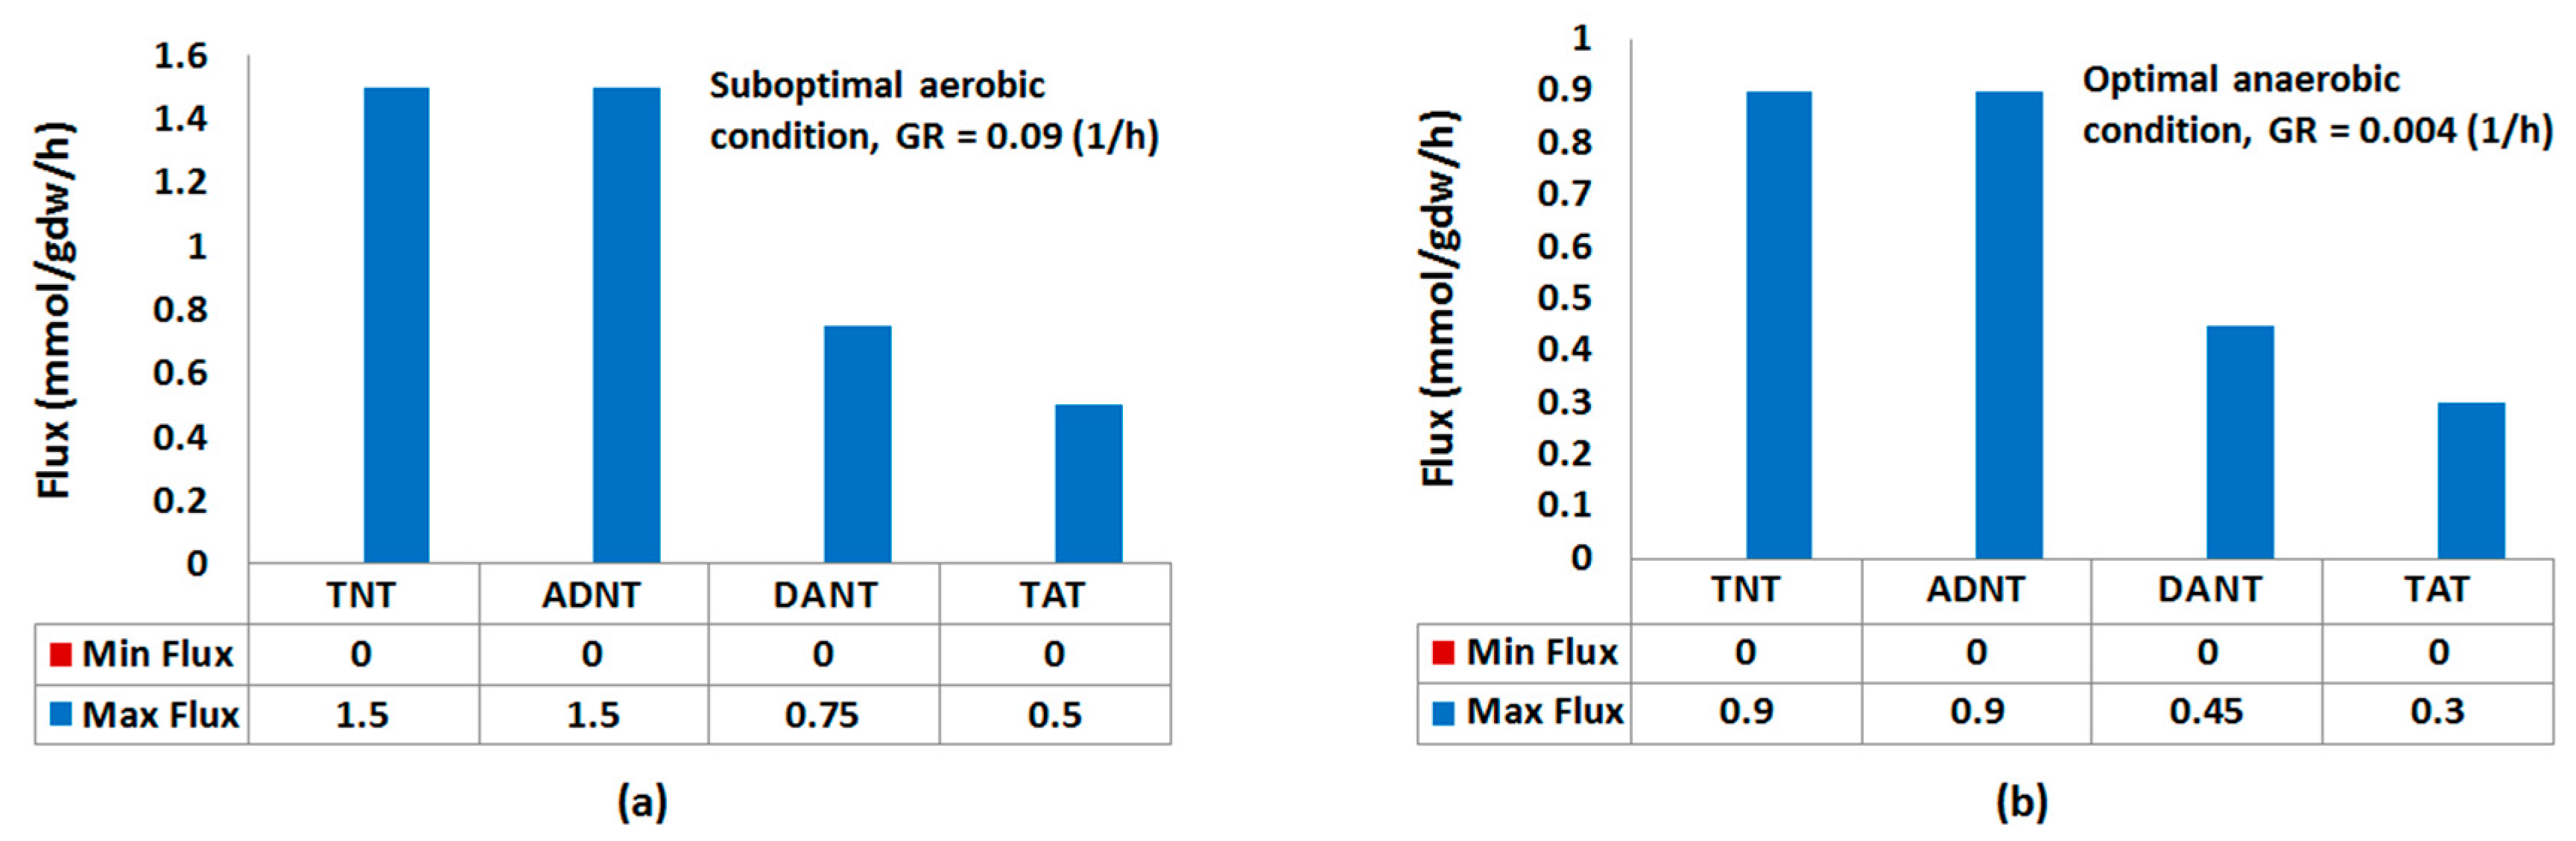
| Variability (mmol/gdw/h) | Mean (SD) (mmol/gdw/h) | Median (mmol/gdw/h) | Variability (mmol/gdw/h) | Mean (SD) (mmol/gdw/h) | Median (mmol/gdw/h) | |
| TNT | [0, 1.5] | 0.01 (0.048) | 0.004 | [0, 0.9] | 0.45 (0.41) | 0.45 |
| ADNT | [0, 1.5] | 0.008 (0.036) | 0.002 | [0, 0.9] | 0.41 (0.039) | 0.42 |
| DANT | [0, 75] | 0.003 (0.017) | 0 | [0, 0.45] | 0.033 (0.043) | 0.022 |
| TAT | [0, 0.5] | 0.002 (0.012) | 0 | [0, 0.3] | 0.004 (0.011) | 0.001 |
| Cultivation Condition | Growth Rate | TNT Uptake Rate | NH4 Production Rate | NO2 Production Rate | ADNT Production Rate |
|---|---|---|---|---|---|
| Aerobic | 0.11 | [1.15, 1.15] | [0, 0] | [0, 0] | [0, 0] |
| Suboptimal Aerobic | 0.076 | [0.8, 3.36] | [0, 2.56] | [0, 1.12] | [0, 1.5] |
| Anaerobic | 0.038 | [3.84, 3.84] | [1.52, 1.52] | [0, 0] | [0, 0] |
| Suboptimal Anaerobic | 0.026 | [1.46, 5.11] | [0.18, 3.44] | [0, 0.64] | [0, 0.85] |
| ID | Name | Formula | Gene Association |
|---|---|---|---|
| PGK | Phosphoglycerate kinase | 3pg[c] + atp[c] <=> 13dpg[c] + adp[c] | b2926 |
| Actex | Acetate transport via diffusion (extracellular to periplasm) | ac[e] <=> ac[p] | (b0241 or b0929 or b1377 or b2215) |
| GLCt2pp | D-glucose transport in via proton symport (periplasm) | glc-D[p] + h[p] -> glc-D[c] + h[c] | b2943 |
| NH4tpp | Ammonia reversible transport (periplasm) | nh4[p] <=> nh4[c] | (b0451 or s0001) |
| TPI | Triose-phosphate isomerase | dhap[c] <=> g3p[c] | b3919 |
| GLYCDx | Glycerol dehydrogenase | glyc[c] + nad[c] -> dha[c] + h[c] + nadh[c] | b3945 |
| NO2t2rpp | Nitrite transport in via proton symport, reversible (periplasm) | h[p] + no2[p] <=> h[c] + no2[c] | (b3367 or b1223) |
| PGM | Phosphoglycerate mutase | 2pg[c] <=> 3pg[c] | (b3612 or b4395 or b0755) |
| PTAr | Phosphotransacetylase | accoa[c] + pi[c] <=> actp[c] + coa[c] | (b2297 or b2458) |
| PPS | Phosphoenolpyruvate synthase | atp[c] + h2o[c] + pyr[c] -> amp[c] + 2 h[c] + pep[c] + pi[c] | b1702 |
| ATPS4rpp | ATP synthase (four protons for one ATP) (periplasm) | adp[c] + pi[c] + 4 h[p] <=> atp[c] + 3 h[c] + h2o[c] | (((b3736 and b3737 and b3738) and (b3731 and b3732 and b3733 and b3734 and b3735) and b3739) or ((b3736 and b3737 and b3738) and (b3731 and b3732 and b3733 and b3734 and b3735))) |
© 2017 by the authors. Licensee MDPI, Basel, Switzerland. This article is an open access article distributed under the terms and conditions of the Creative Commons Attribution (CC BY) license (http://creativecommons.org/licenses/by/4.0/).
Share and Cite
Iman, M.; Sobati, T.; Panahi, Y.; Mobasheri, M. Systems Biology Approach to Bioremediation of Nitroaromatics: Constraint-Based Analysis of 2,4,6-Trinitrotoluene Biotransformation by Escherichia coli. Molecules 2017, 22, 1242. https://doi.org/10.3390/molecules22081242
Iman M, Sobati T, Panahi Y, Mobasheri M. Systems Biology Approach to Bioremediation of Nitroaromatics: Constraint-Based Analysis of 2,4,6-Trinitrotoluene Biotransformation by Escherichia coli. Molecules. 2017; 22(8):1242. https://doi.org/10.3390/molecules22081242
Chicago/Turabian StyleIman, Maryam, Tabassom Sobati, Yunes Panahi, and Meysam Mobasheri. 2017. "Systems Biology Approach to Bioremediation of Nitroaromatics: Constraint-Based Analysis of 2,4,6-Trinitrotoluene Biotransformation by Escherichia coli" Molecules 22, no. 8: 1242. https://doi.org/10.3390/molecules22081242