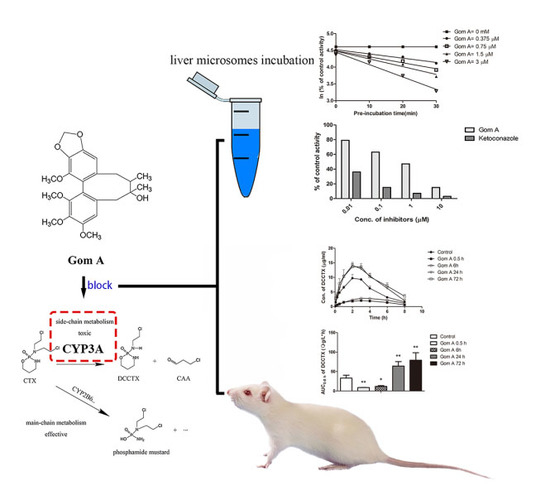
Time- and NADPH-Dependent Inhibition on CYP3A by Gomisin A and the Pharmacokinetic Interactions between Gomisin A and Cyclophosphamide in Rats

Abstract
:
1. Introduction
2. Results
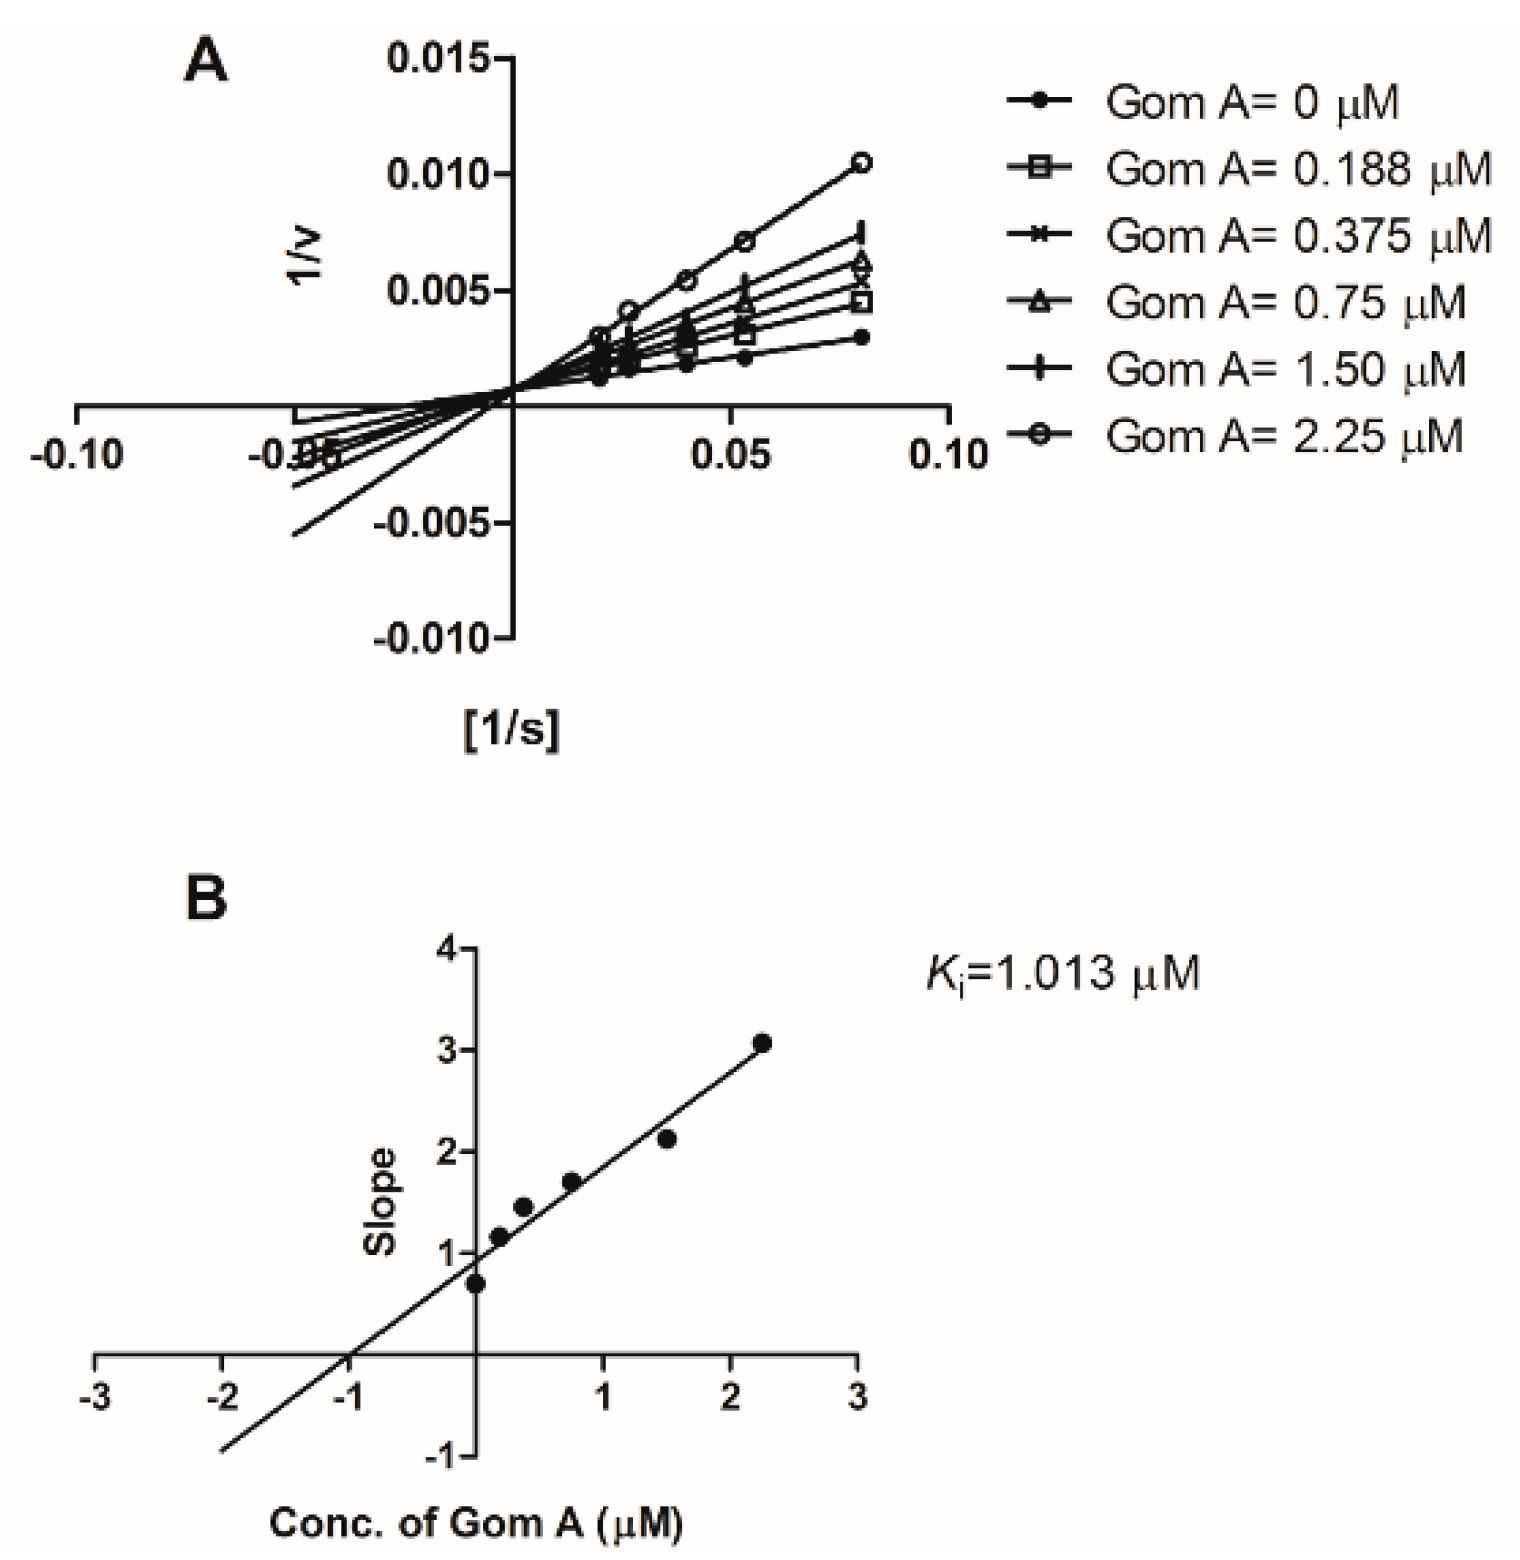
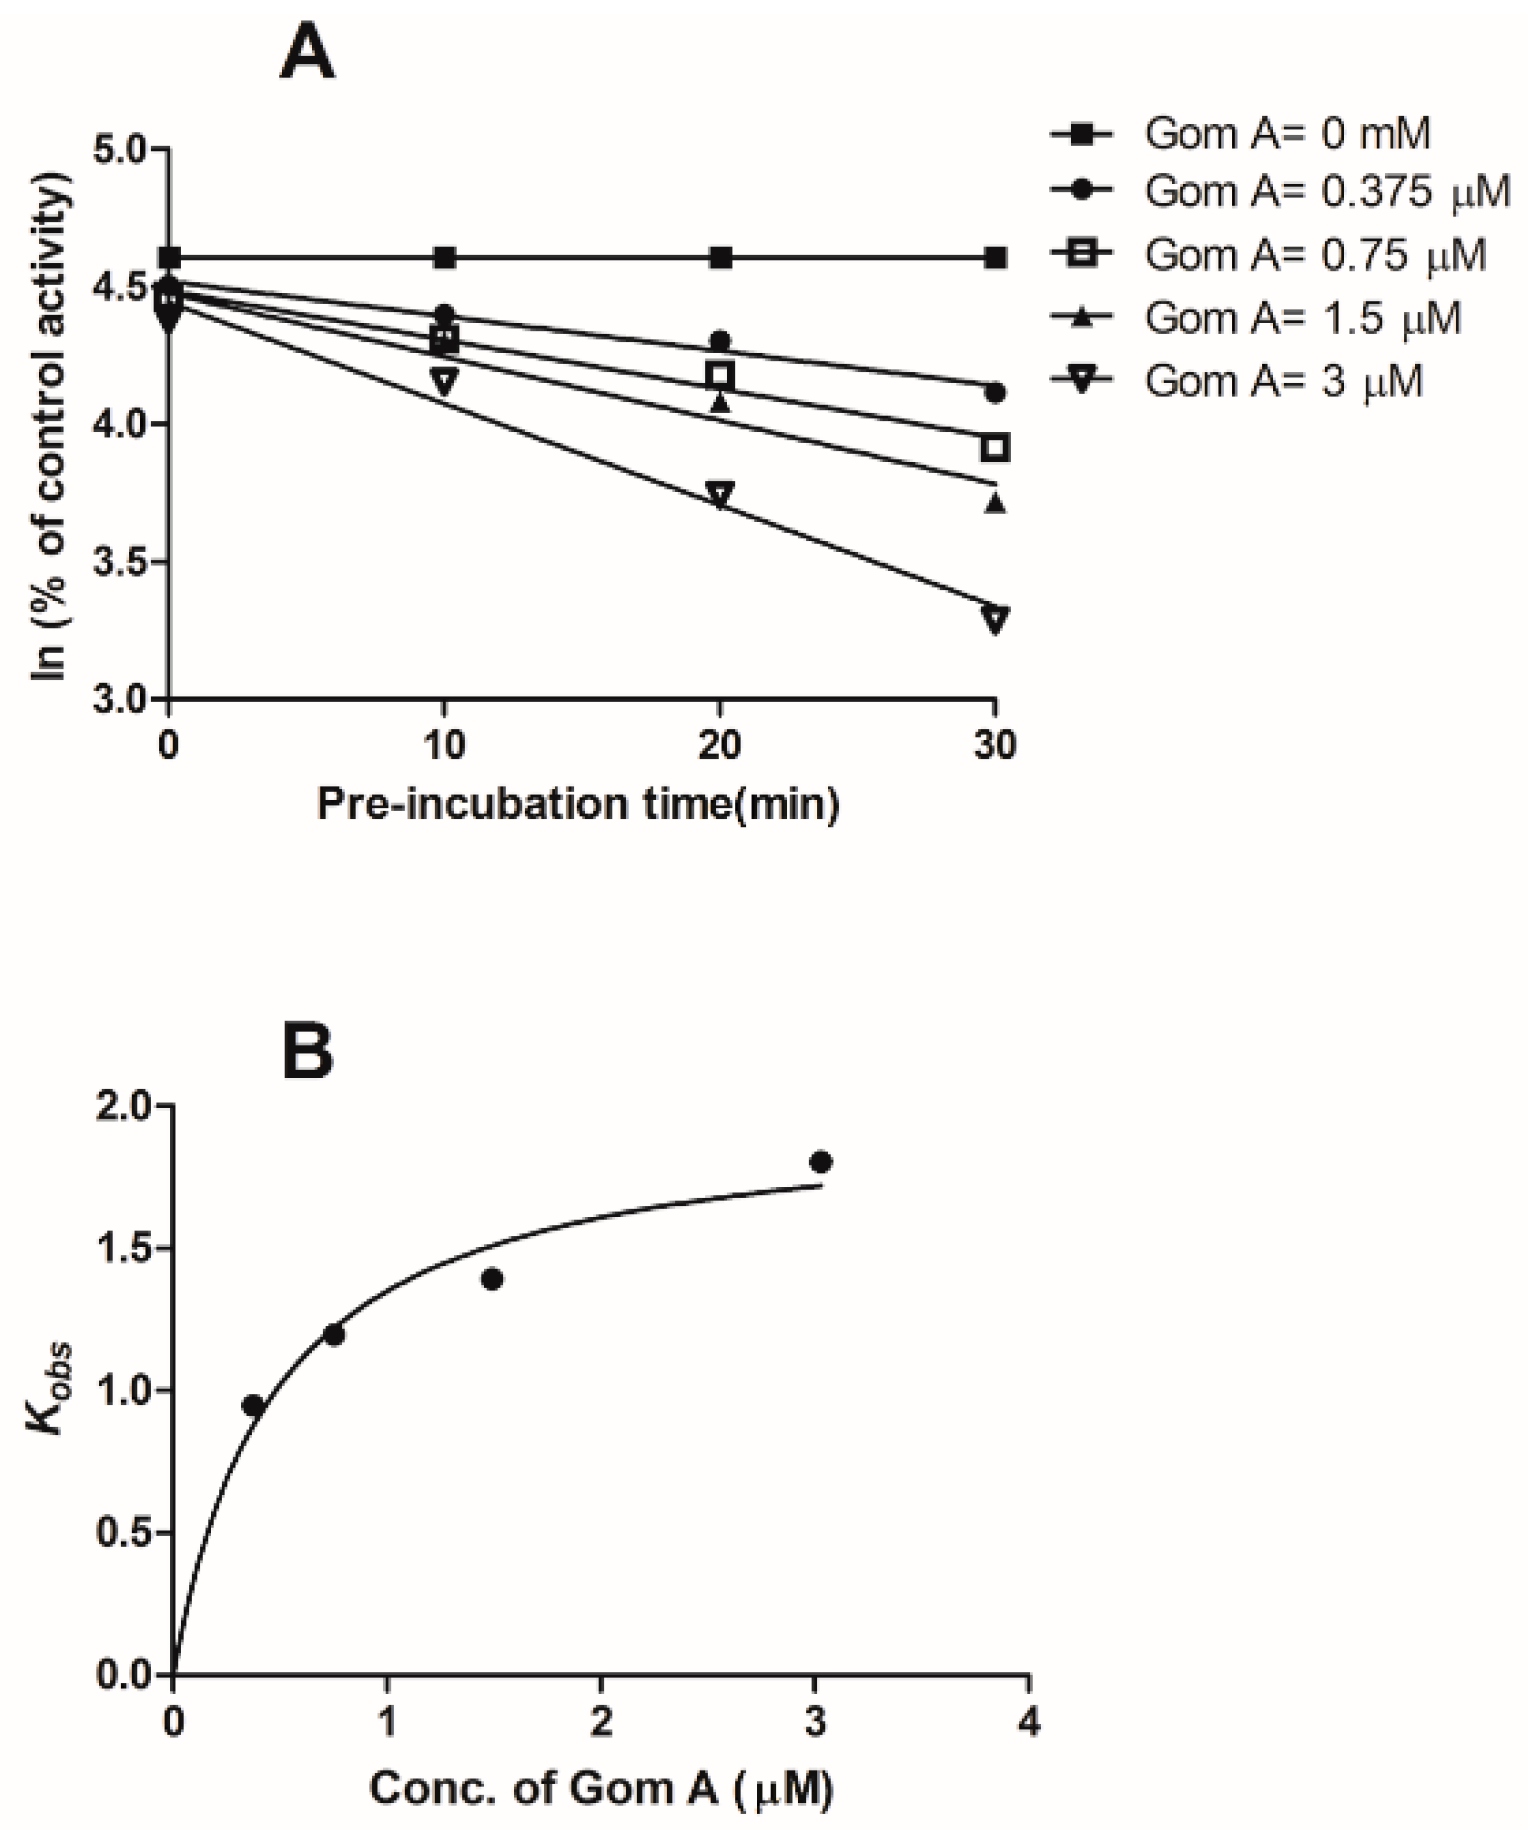
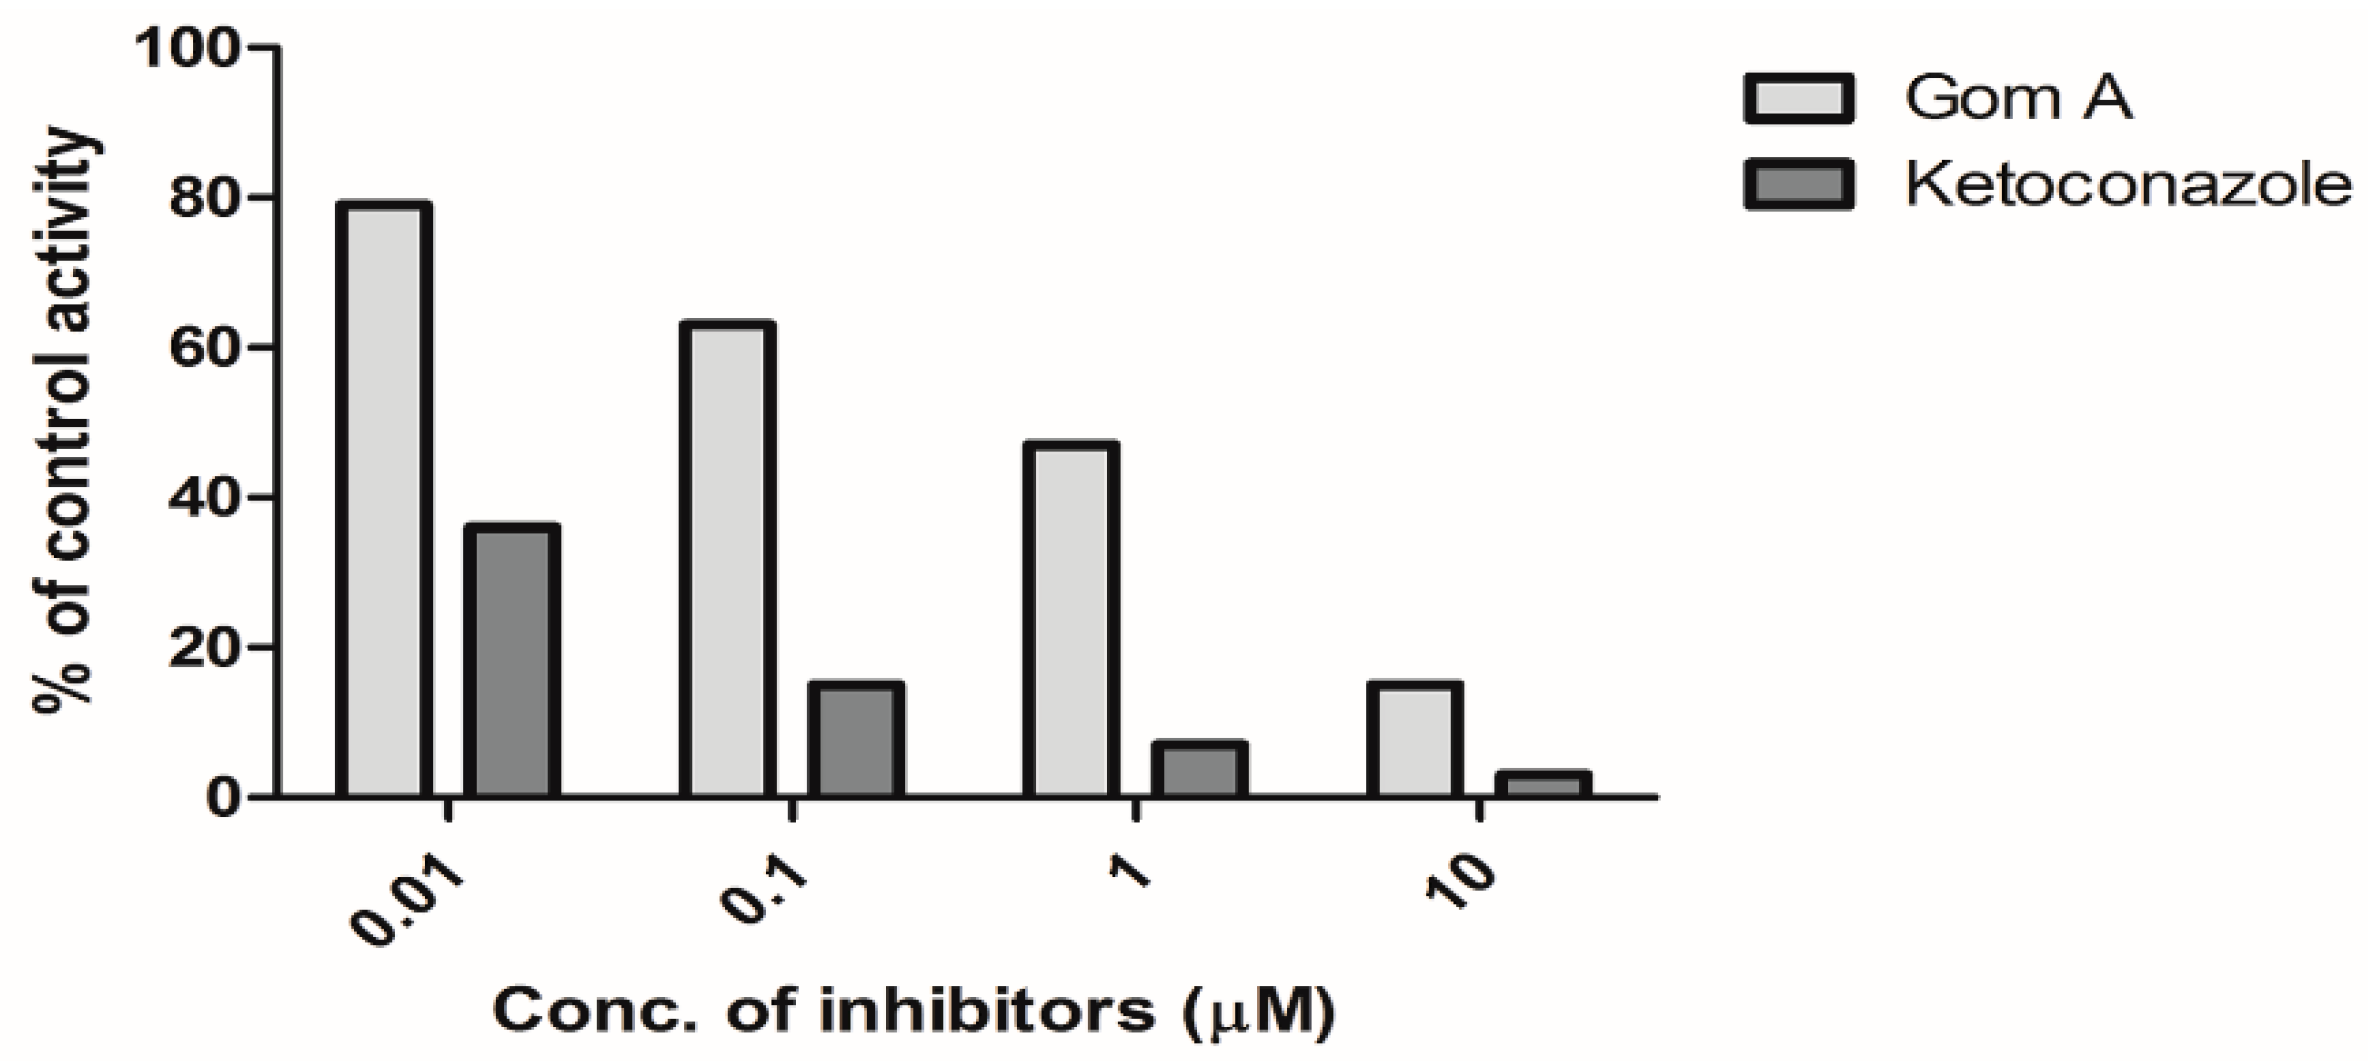
2.1. In Vitro CYP3A Inhibition Study
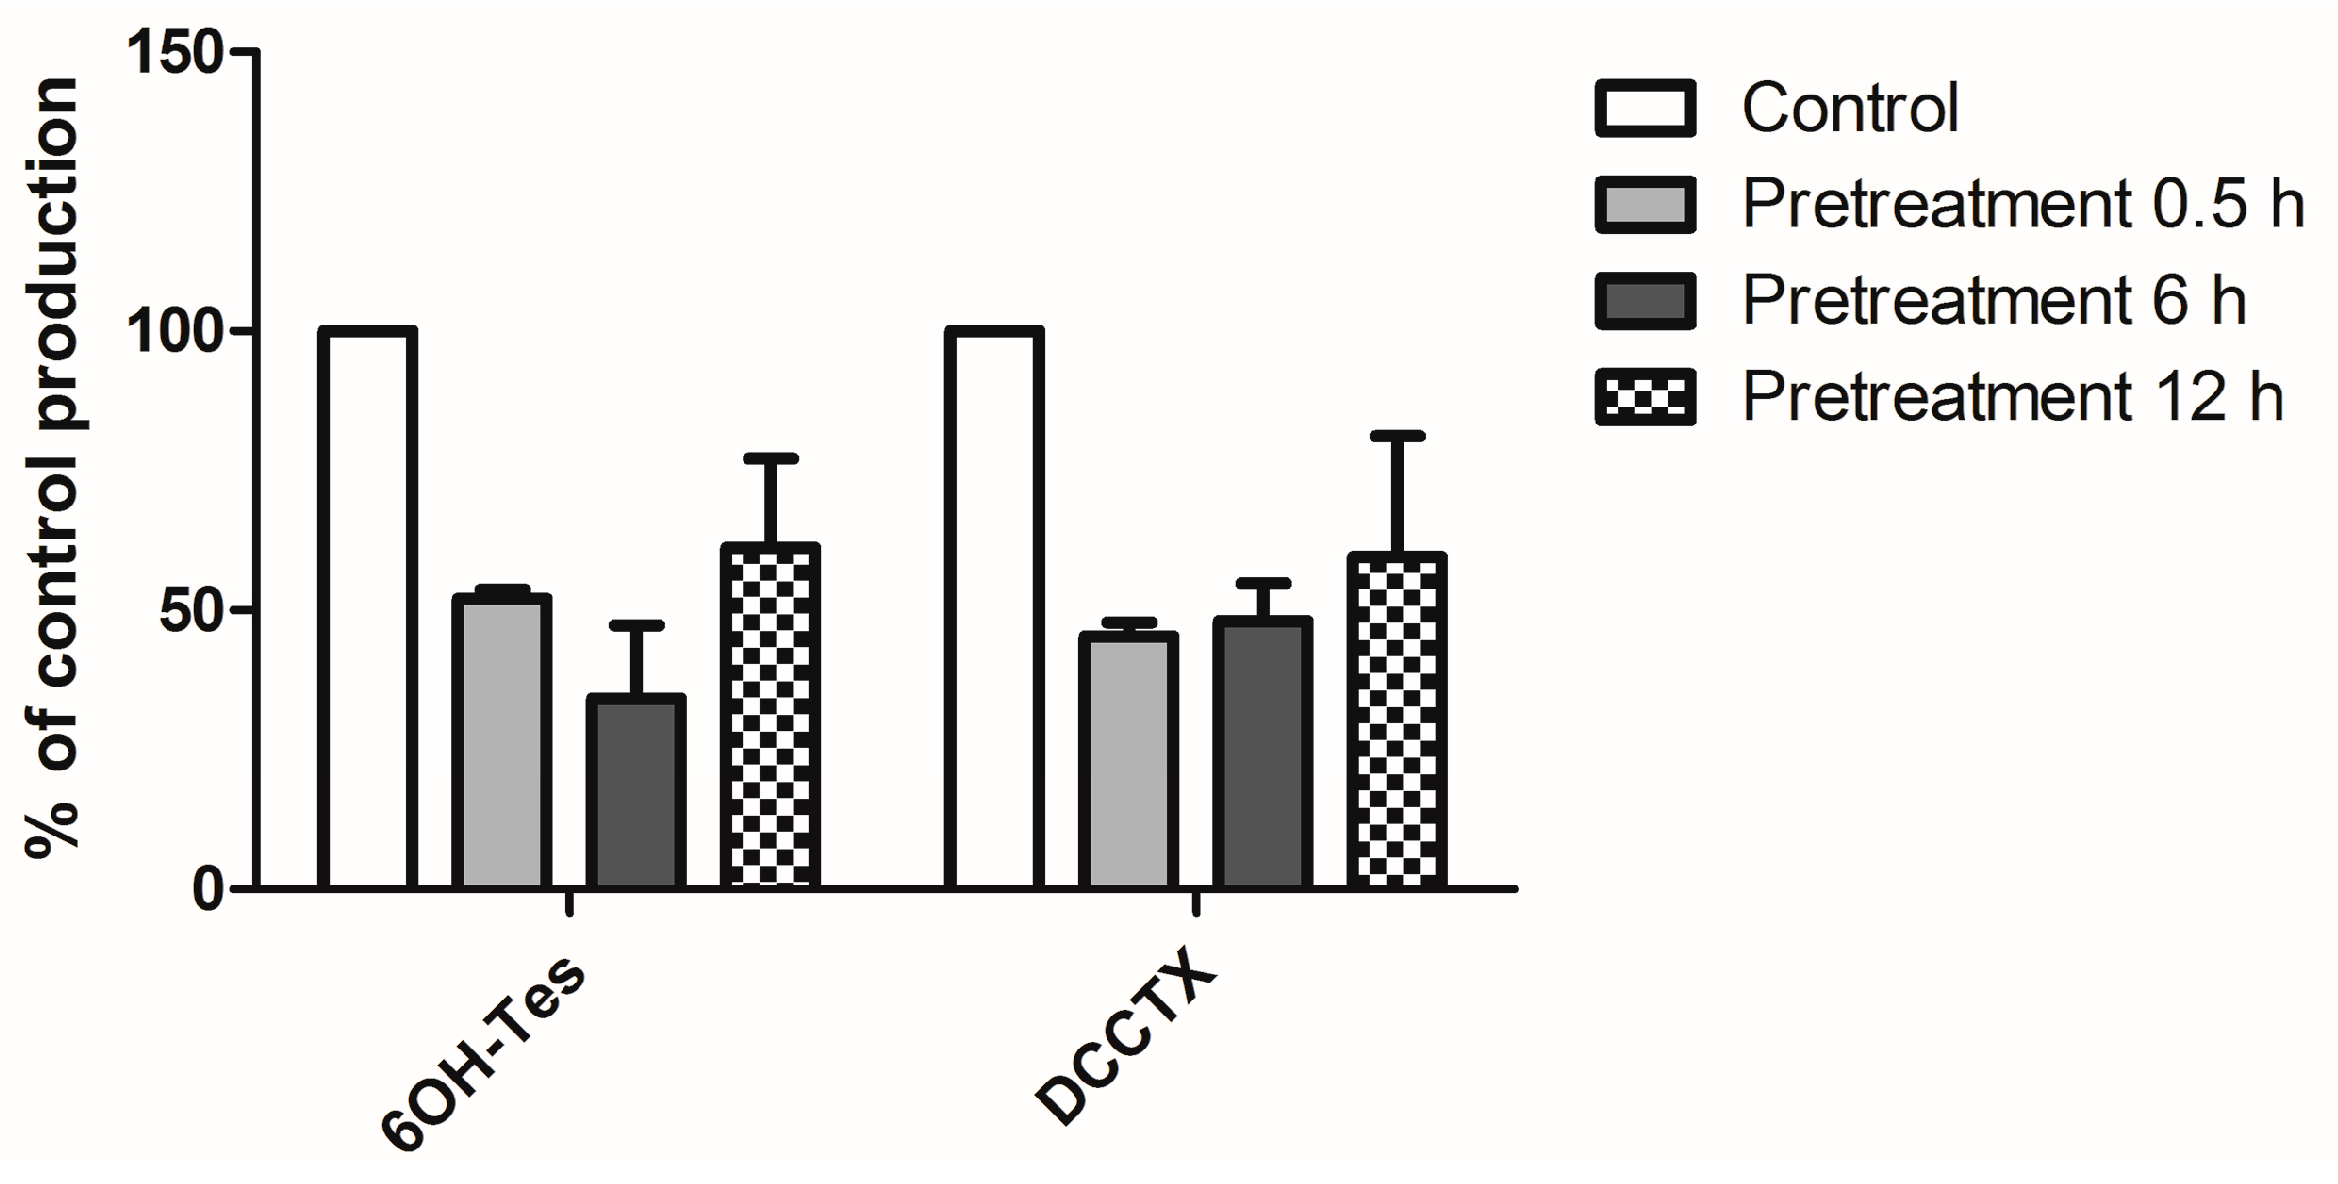
2.2. The Effect of Gom A Pretreatment on Rat Hepatic CYP3A Activity
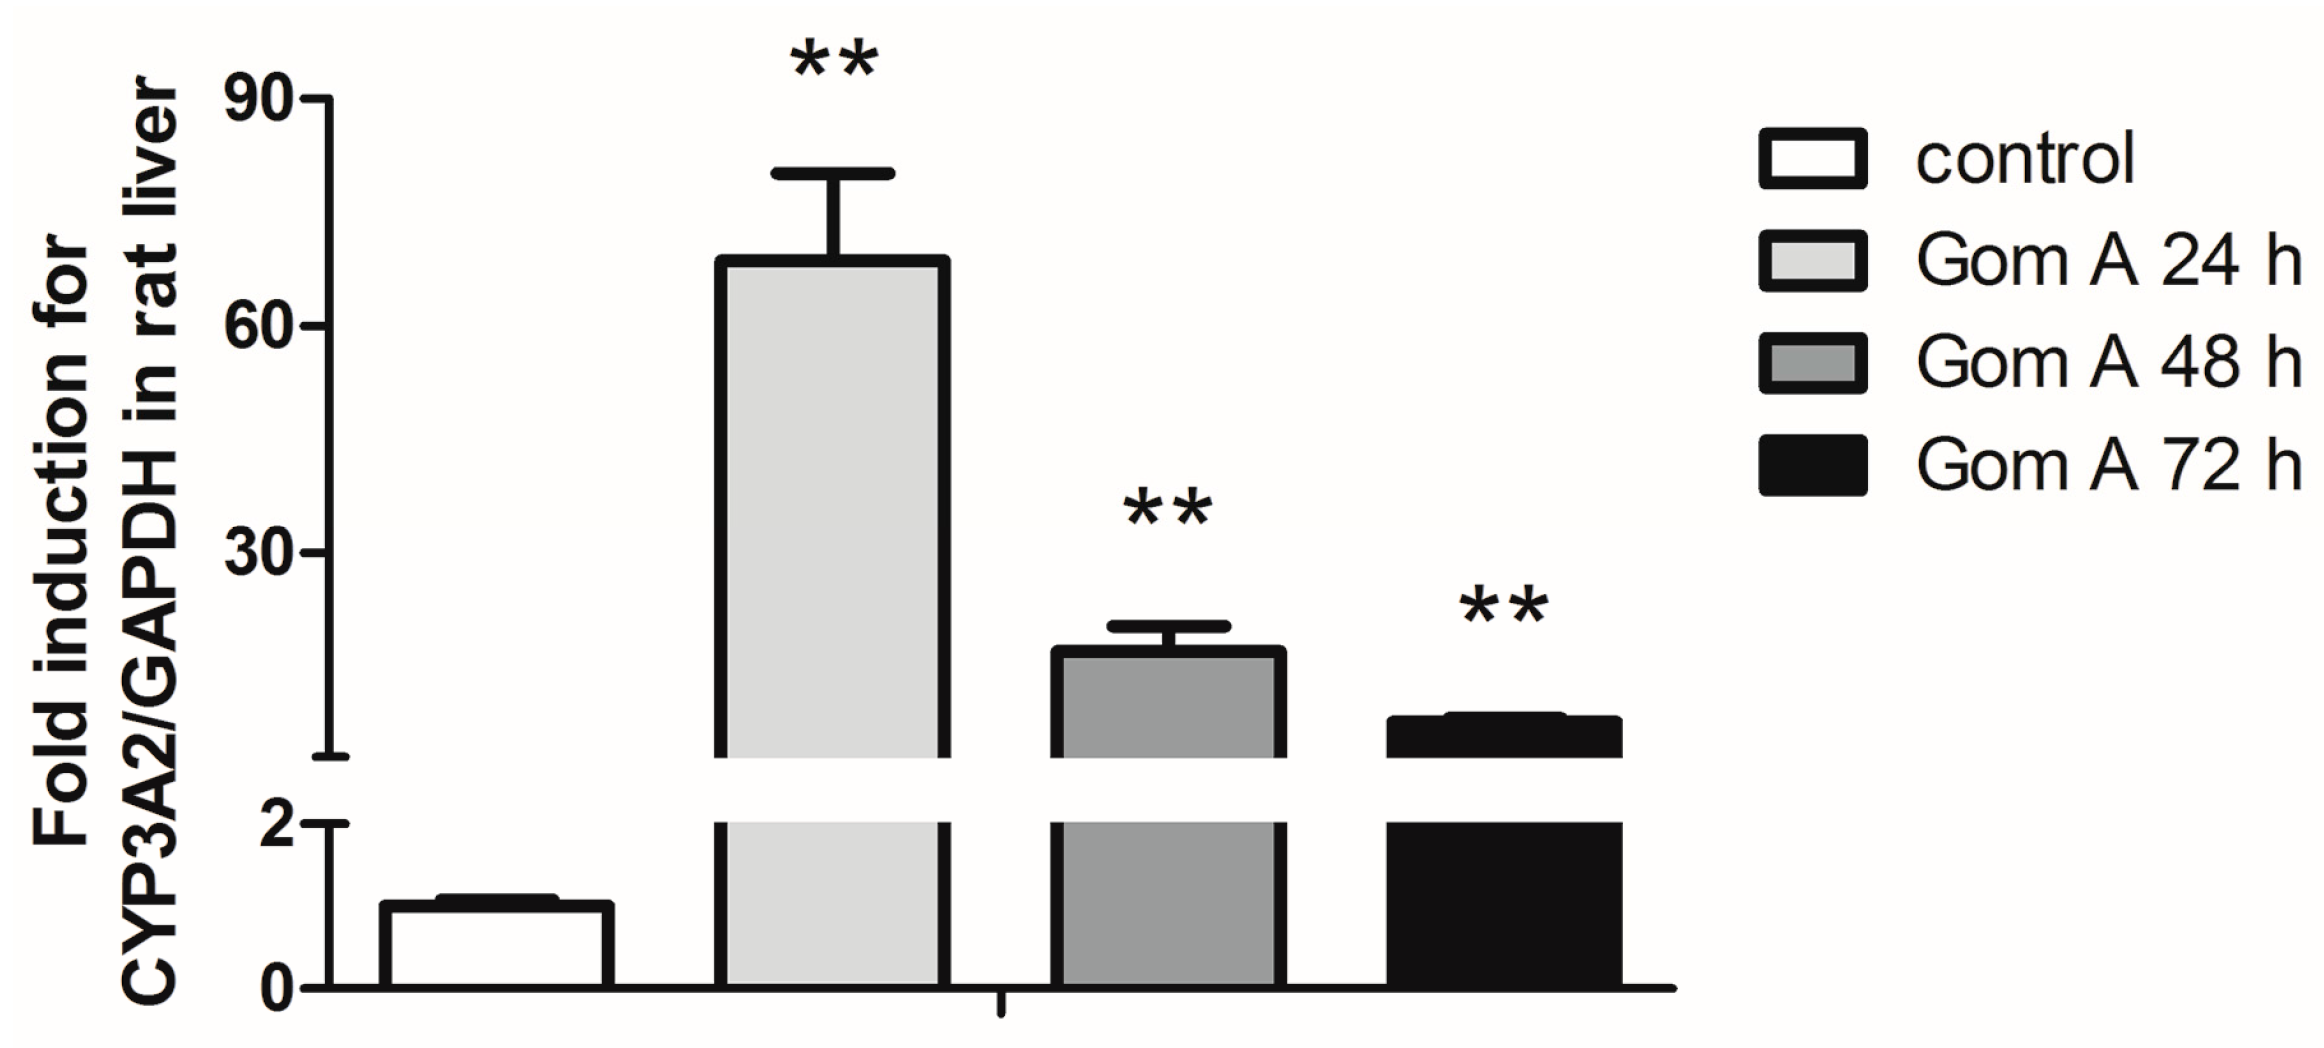
2.3. CYP3A Expression Assay
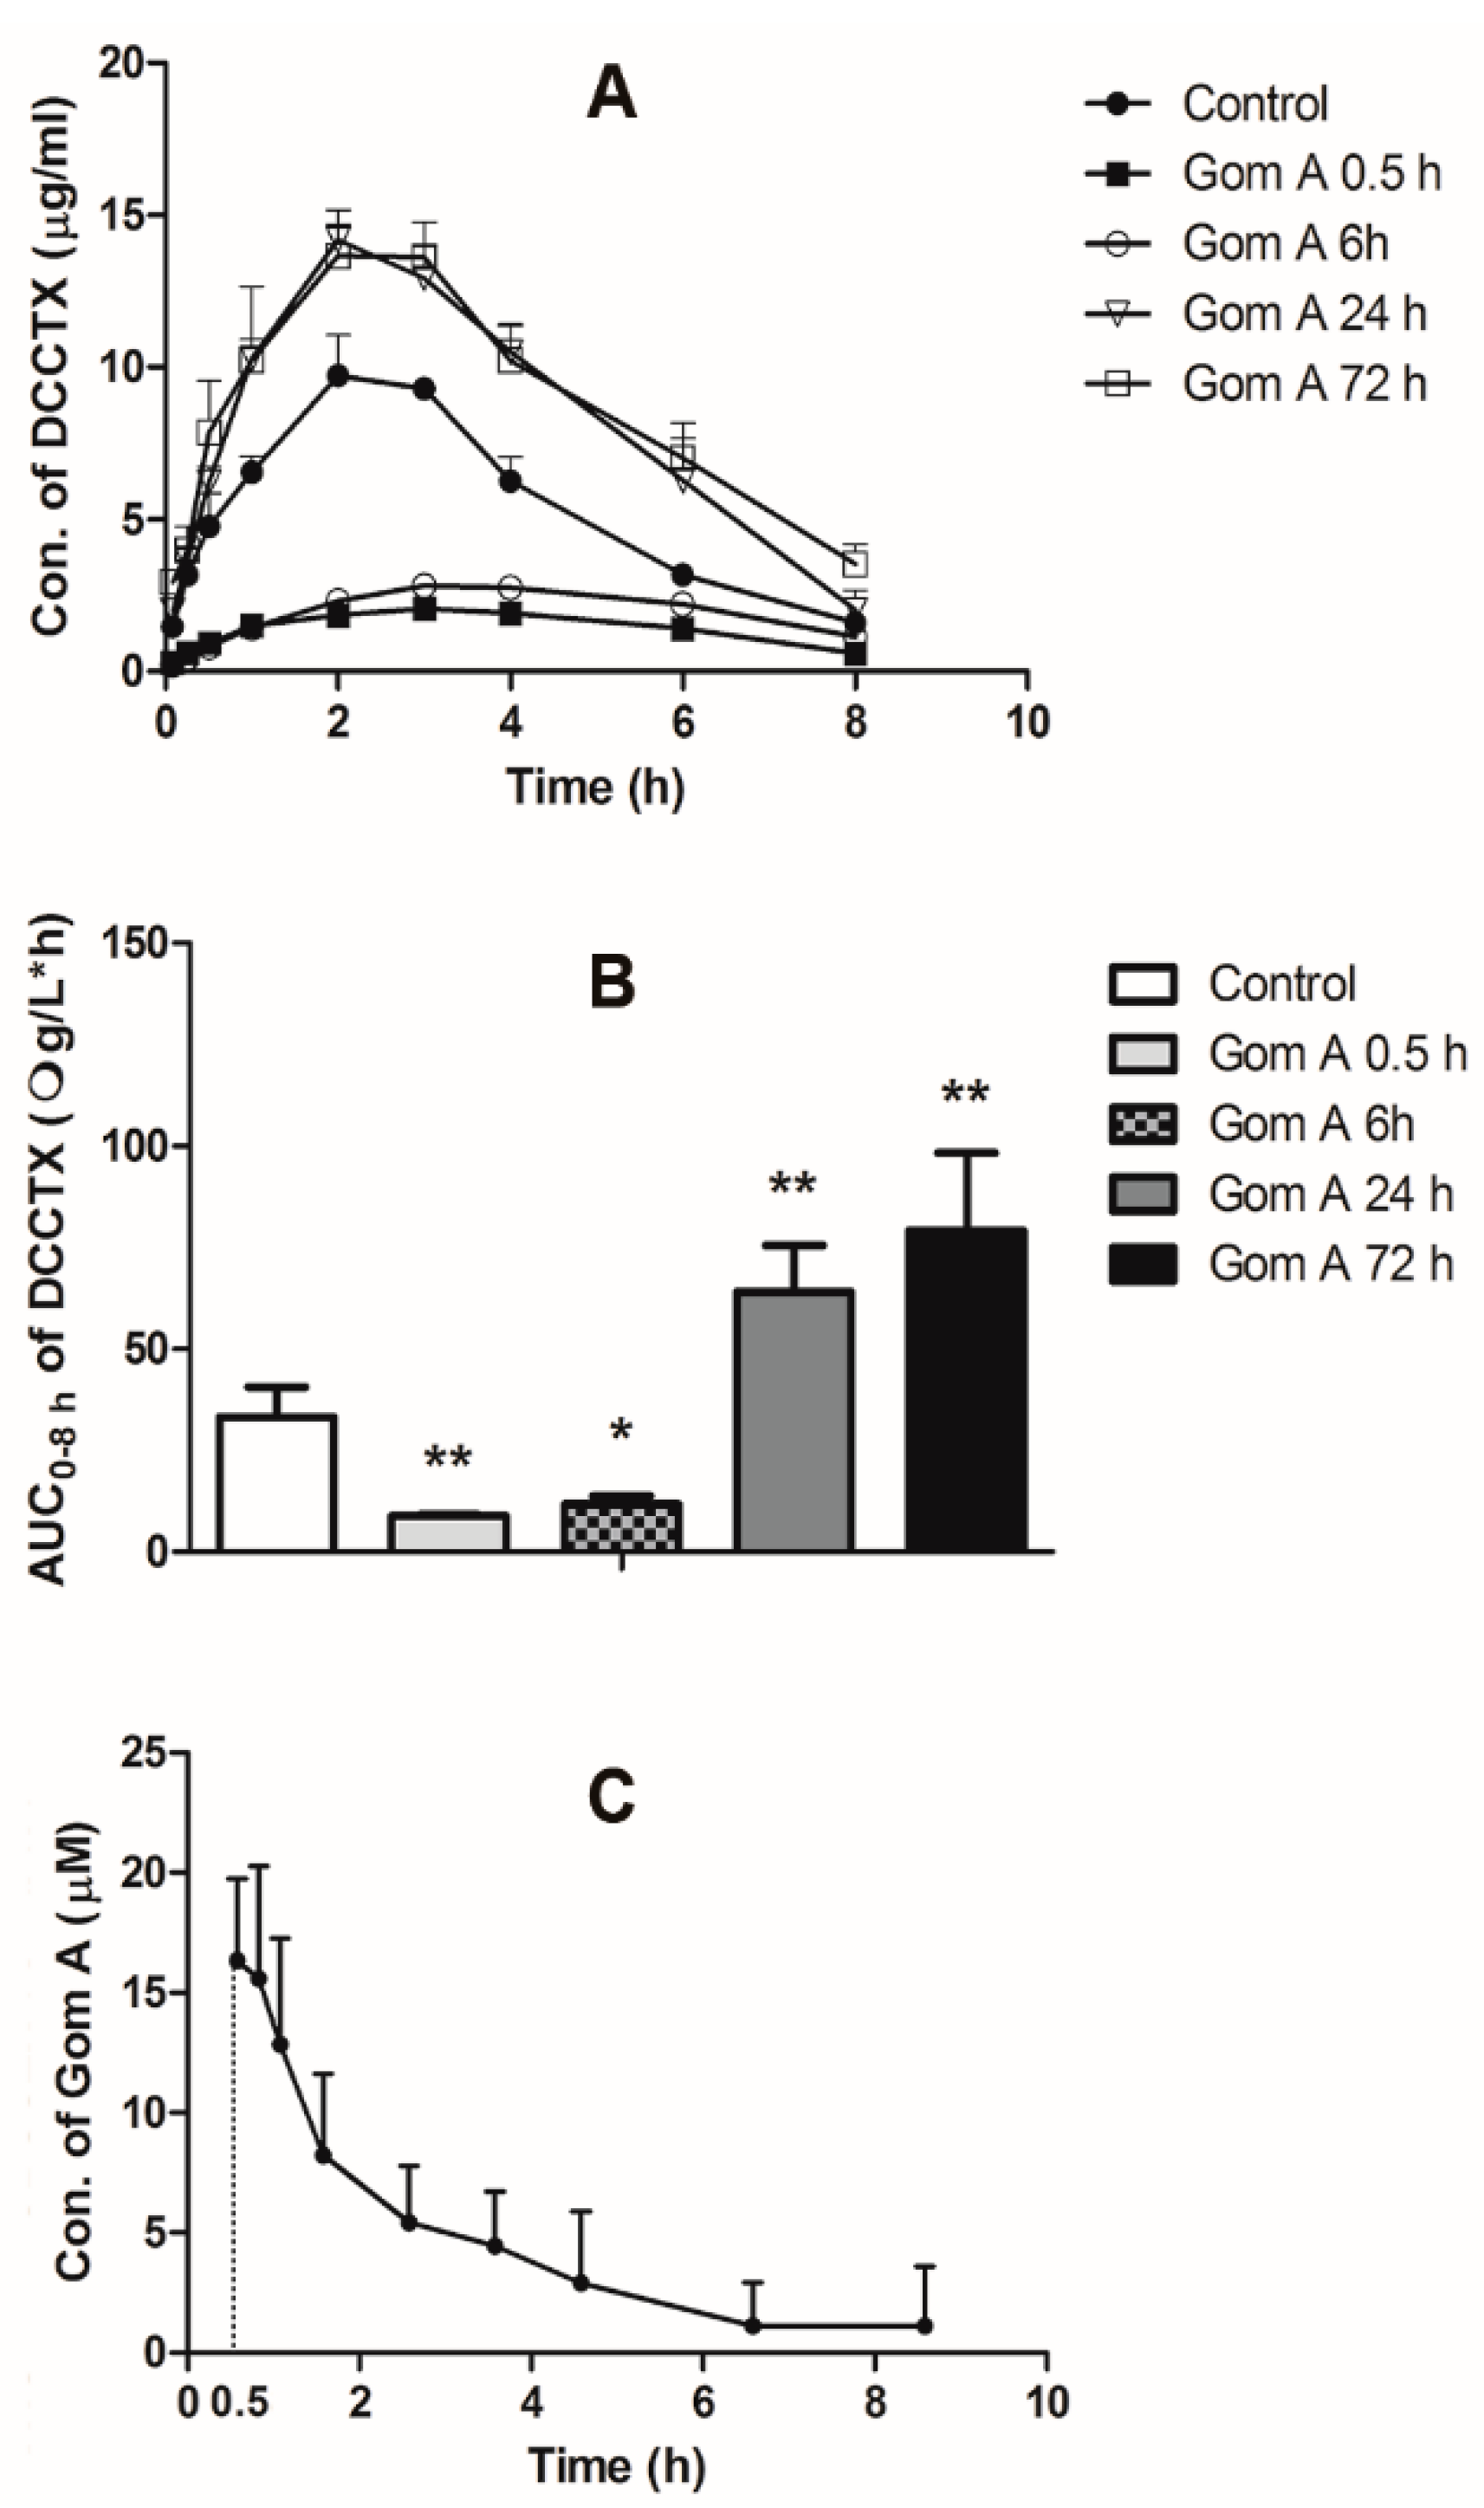
2.4. In Vivo Pharmacokinetic Study
3. Discussion
4. Materials and Methods
4.1. Chemicals and Reagents
4.2. Animals
4.3. In Vitro CYP3A Inhibition Study
4.3.1. CYP3A Inhibition Assays
4.3.2. IC50 Shift Assays
4.3.3. KI and kinact Assays
4.3.4. Effect of Gom A and Ketoconazole on DCCTX Production in HLMs
4.4. The Effect of Gom A Pretreatment on Rat Hepatic CYP3A Activity
4.5. CYP3A Expression Assay
4.5.1. Drug Administration
4.5.2. Quantitative Reverse Transcriptase PCR (Real-Time PCR)
4.6. In Vivo Pharmacokinetic Study
4.6.1. Drug Administration
4.6.2. Sample Collection
4.7. UHPLC-MS/MS Analysis
4.8. Data Analysis
5. Conclusions
Supplementary Materials
Acknowledgments
Author Contributions
Conflicts of Interest
Abbreviations
| ANOVA | analysis of variance |
| AUC | area under concentration-time curve |
| Cmax | peak plasma concentration |
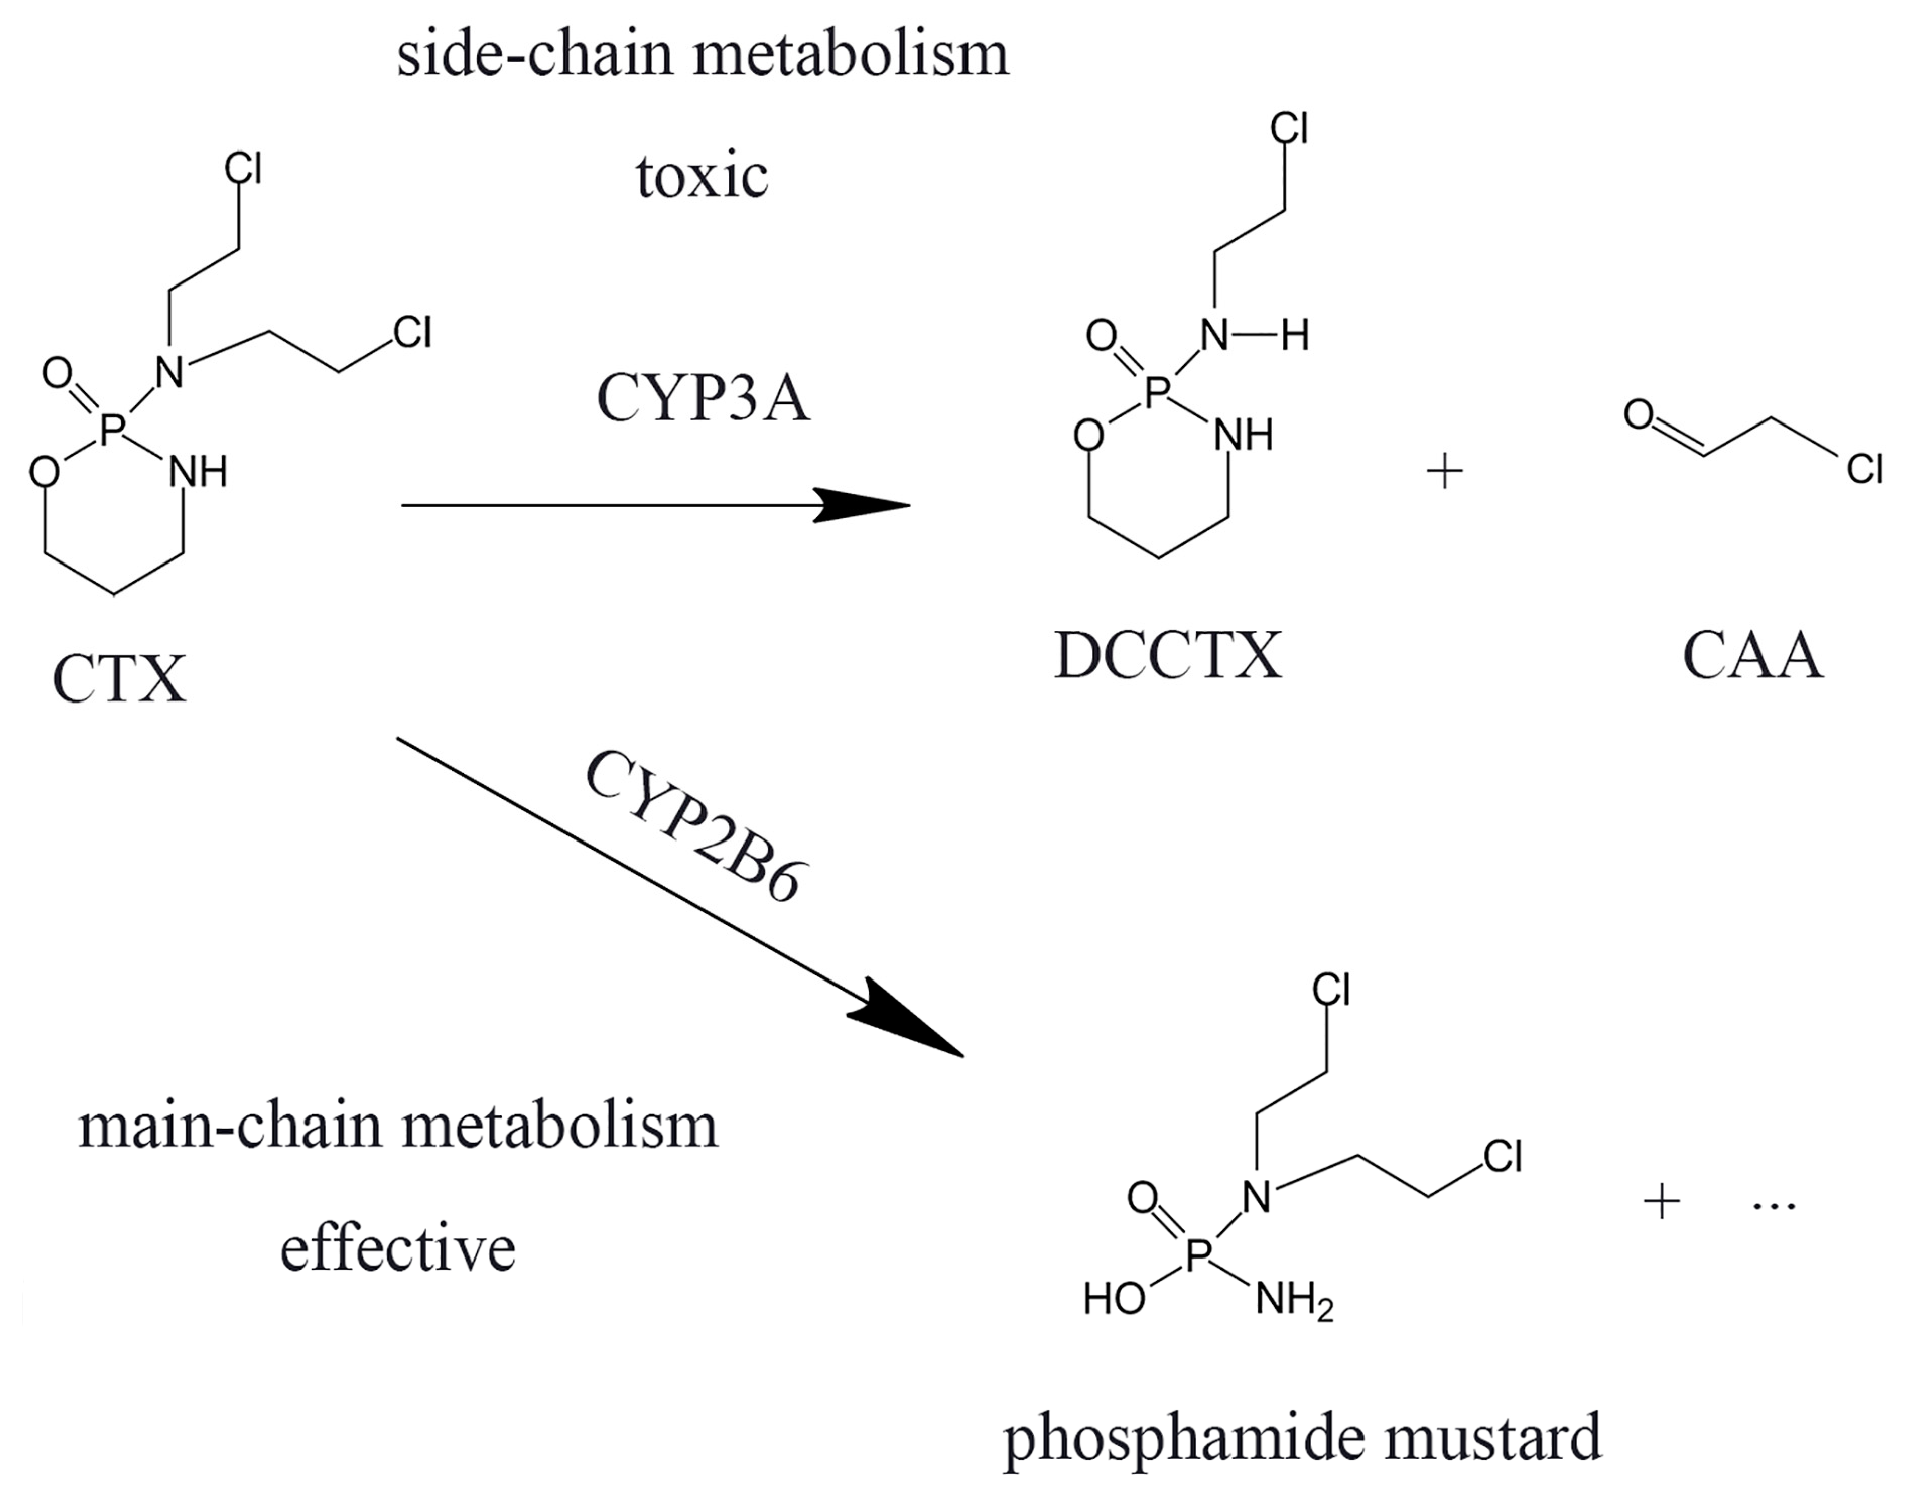
| CAA | chloroacetaldehyde |
| CL | clearance |
| CTX | cyclophosphamide |
| DCCTX | 2-dechloroethylcyclophosphamide |
| CYP450 | cytochrome P450 |
| DDIs | drug-drug interactions |
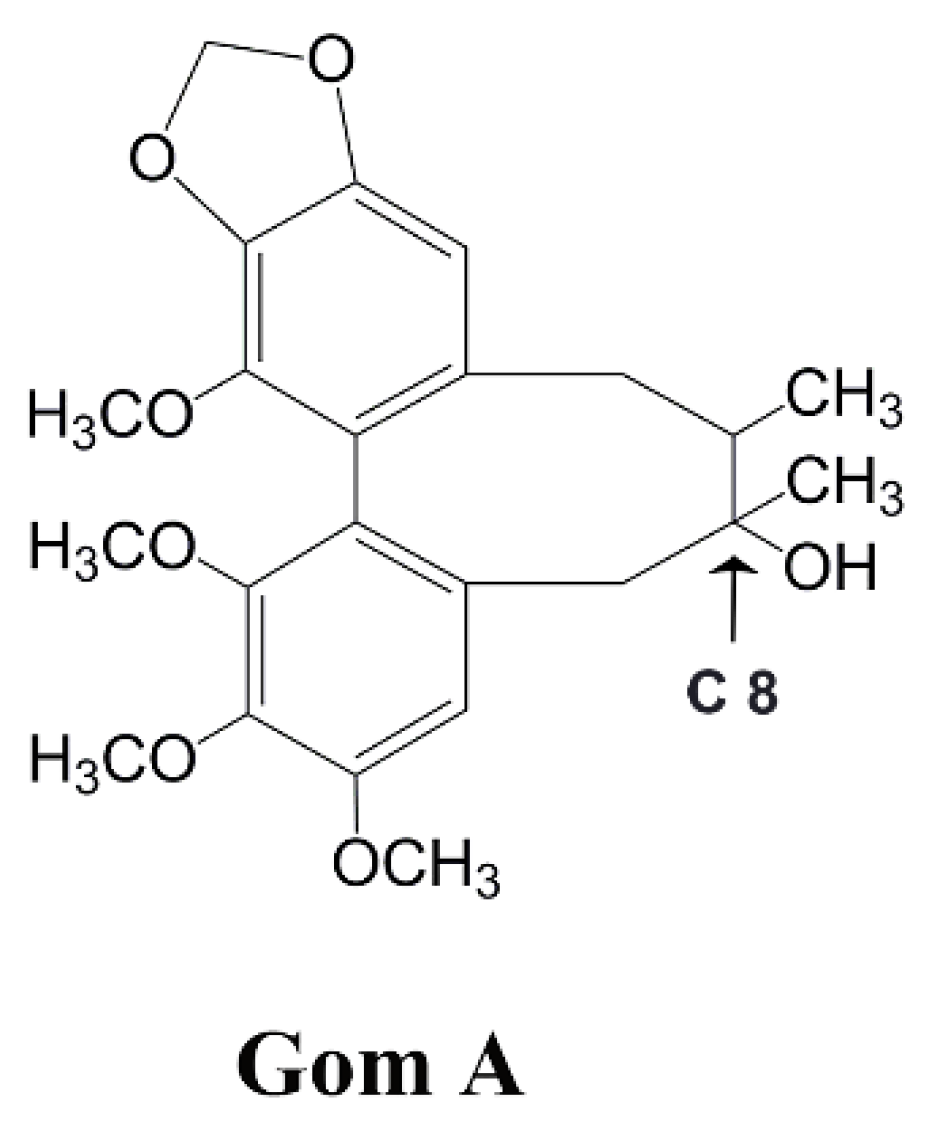
| Gom A | gomisin A |
| Gom C | gomisin C |
| HLMs | human liver microsomes |
| IC50 | half maximal inhibitory concentration |
| IS | internal standard |
| Keto | ketoconazole |
| Ki | dissociation constant for reversible inhibition |
| kobs | initial inactivation rate constant |
| kinact | the maximal inactivation rate constant |
| KI | half maximal inhibitory concentration for MBI |
| LLOQ | lower limit of quantification |
| LSD | least significant difference |
| MBI | mechanism-based inhibition |
| MI | metabolite-intermediate |
| MRT | mean residence time |
| NADPH | dihydronicotinamide adenine dinucleotide phosphate |
| NADPH-gs | NADPH regenerating system |
| PBS | potassium phosphate buffer |
| SCE | Schisandra chinensis extract |
| SD | standard deviation |
| t1/2 | terminal half-life |
| Tes | testosterone |
| TDI | time-dependent inhibition |
| Tmax | time of plasma concentration reach a maximum |
| TNZ | tinidazole |
| Vmax | maximum reaction rate |
| Vd | apparent volume of distribution |
| 6OH-Tes | 6β-hydroxytestosterone. |
References
- Wang, S.; Penchala, S.; Prabhu, S.; Wang, J.; Huang, Y. Molecular basis of traditional Chinese medicine in cancer chemoprevention. Curr. Drug Discov. Technol. 2010, 7, 67–75. [Google Scholar] [CrossRef] [PubMed]
- Ip, S.-P.; Che, C.-T.; Kong, Y.-C.; Ko, K.-M. Effects of schisandrin B pretreatment on tumor necrosis factor-α induced apoptosis and Hsp70 expression in mouse liver. Cell Stress Chaperones 2001, 6, 44. [Google Scholar] [CrossRef]
- Kim, S.R.; Lee, M.K.; Koo, K.A.; Kim, S.H.; Sung, S.H.; Lee, N.G.; Markelonis, G.J.; Oh, T.H.; Yang, J.H.; Kim, Y.C. Dibenzocyclooctadiene lignans from Schisandra chinensis protect primary cultures of rat cortical cells from glutamate-induced toxicity. J. Neurosci. Res. 2004, 76, 397–405. [Google Scholar] [CrossRef] [PubMed]
- Hwang, I.S.; Kim, J.E.; Lee, Y.J.; Kwak, M.H.; Choi, Y.H.; Kang, B.C.; Hong, J.T.; Hwang, D.Y. Protective effects of gomisin A isolated from Schisandra chinensis against CCl4-induced hepatic and renal injury. Int. J. Mol. Med. 2013, 31, 888–898. [Google Scholar] [CrossRef] [PubMed]
- Jiang, B.; Li, S.; Liu, W.; Yang, Y.; Chen, W.; He, D.; Cheng, X.; Wang, Z.; Chen, W.; Wang, C. Inhibitive activities detection of monoamine oxidases (MAO) A and B inhibitors in human liver MAO incubations by UPLC-ESI-MS/MS. J. Pharm. Biomed. Anal. 2015, 115, 283–291. [Google Scholar] [CrossRef] [PubMed]
- Jiang, Y.; Fan, X.; Wang, Y.; Tan, H.; Chen, P.; Zeng, H.; Huang, M.; Bi, H. Hepato-protective effects of six schisandra lignans on acetaminophen-induced liver injury are partially associated with the inhibition of CYP-mediated bioactivation. Chem.-Biol. Interact. 2015, 231, 83–89. [Google Scholar] [CrossRef] [PubMed]
- Kim, D.H.; Hung, T.M.; Bae, K.H.; Jung, J.W.; Lee, S.; Yoon, B.H.; Cheong, J.H.; Ko, K.H.; Ryu, J.H. Gomisin A improves scopolamine-induced memory impairment in mice. Eur. J. Pharmacol. 2006, 542, 129–135. [Google Scholar] [CrossRef] [PubMed]
- Feng, G.; Zhai, J.; Chen, W.; Xiong, X.; Gao, S.; Xia, T.; Zhang, F. The effects of Schisandra sphenathera and Schisandra chinensis extract on the metabolism of cyclophosphamide in rats. China J. Hosp. Pharm. 2017. Accepted. [Google Scholar]
- Lai, L.; Hao, H.; Wang, Q.; Zheng, C.; Zhou, F.; Liu, Y.; Wang, Y.; Yu, G.; Kang, A.; Peng, Y.; et al. Effects of short-term and long-term pretreatment of Schisandra lignans on regulating hepatic and intestinal CYP3A in rats. Drug Metab. Dispos. Biol. Fate Chem. 2009, 37, 2399–2407. [Google Scholar] [CrossRef] [PubMed]
- Binotto, G.; Trentin, L.; Semenzato, G. Ifosfamide and cyclophosphamide: Effects on immunosurveillance. Oncology 2003, 65, 17–20. [Google Scholar] [CrossRef] [PubMed]
- De Jonge, M.E.; Huitema, A.D.; Rodenhuis, S.; Beijnen, J.H. Clinical pharmacokinetics of cyclophosphamide. Clin. Pharmacokinet. 2005, 44, 1135–1164. [Google Scholar] [CrossRef] [PubMed]
- McDonald, G.B.; Slattery, J.T.; Bouvier, M.E.; Ren, S.; Batchelder, A.L.; Kalhorn, T.F.; Schoch, H.G.; Anasetti, C.; Gooley, T. Cyclophosphamide metabolism, liver toxicity, and mortality following hematopoietic stem cell transplantation. Blood 2003, 101, 2043–2048. [Google Scholar] [CrossRef] [PubMed]
- Rzeski, W.; Pruskil, S.; Macke, A.; Felderhoff-Mueser, U.; Reiher, A.K.; Hoerster, F.; Jansma, C.; Jarosz, B.; Stefovska, V.; Bittigau, P.; et al. Anticancer agents are potent neurotoxins and in vivo. Ann. Neurol. 2004, 56, 351–360. [Google Scholar] [CrossRef] [PubMed]
- Lu, Y.; Chen, D.F. Analysis of Schisandra chinensis and Schisandra sphenanthera. J. Chromatogr. A 2009, 1216, 1980–1990. [Google Scholar] [CrossRef] [PubMed]
- Iwata, H.; Tezuka, Y.; Kadota, S.; Hiratsuka, A.; Watabe, T. Identification and characterization of potent CYP3A4 inhibitors in Schisandra fruit extract. Drug Metab. Dispos. 2004, 32, 1351–1358. [Google Scholar] [CrossRef] [PubMed]
- Wan, C.K.; Tse, A.K.; Yu, Z.L.; Zhu, G.Y.; Wang, H.; Fong, D.W. Inhibition of cytochrome P450 3A4 activity by schisandrol A and gomisin A isolated from Fructus Schisandrae chinensis. Phytomedicine 2010, 17, 702–705. [Google Scholar] [CrossRef] [PubMed]
- Grimm, S.W.; Einolf, H.J.; Hall, S.D.; He, K.; Lim, H.K.; Ling, K.H.; Lu, C.; Nomeir, A.A.; Seibert, E.; Skordos, K.W.; et al. The conduct of in vitro studies to address time-dependent inhibition of drug-metabolizing enzymes: A perspective of the pharmaceutical research and manufacturers of America. Drug Metab. Dispos. 2009, 37, 1355–1370. [Google Scholar] [CrossRef] [PubMed]
- Atkinson, A.; Kenny, J.R.; Grime, K. Automated assessment of time-dependent inhibition of human cytochrome P450 enzymes using liquid chromatography-tandem mass spectrometry analysis. Drug Metab. Dispos. 2005, 33, 1637–1647. [Google Scholar] [CrossRef] [PubMed]
- Kalgutkar, A.S.; Obach, R.S.; Maurer, T.S. Mechanism-based inactivation of cytochrome P450 enzymes: chemical mechanisms, structure-activity relationships and relationship to clinical drug-drug interactions and idiosyncratic adverse drug reactions. Curr. Drug Metab. 2007, 8, 407–447. [Google Scholar] [CrossRef] [PubMed]
- Qin, X.L.; Chen, X.; Wang, Y.; Xue, X.P.; Wang, Y.; Li, J.L.; Wang, X.D.; Zhong, G.P.; Wang, C.X.; Yang, H.; et al. In vivo to in vitro effects of six bioactive lignans of Wuzhi tablet (Schisandra sphenanthera extract) on the CYP3A/P-glycoprotein-mediated absorption and metabolism of tacrolimus. Drug Metab. Dispos. 2014, 42, 193–199. [Google Scholar] [CrossRef] [PubMed]
- Medeiros, M.; Valverde, S.; Del Moral, I.; Velásquez-Jones, L.; Hernández, A.M.; Castañeda-Hernández, G.; Reyes, H.; Filler, G. Are Tacrolimus Pharmacokinetics Affected by Nephrotic Stage? Ther. Drug Monit. 2016, 38, 288–292. [Google Scholar] [CrossRef] [PubMed]
- Wang, L.H.; Lee, C.S.; Majeske, B.L.; Marbury, T.C. Clearance and recovery calculations in hemodialysis: Application to plasma, red blood cell, and dialysate measurements for cyclophosphamide. Clin. Pharmacol. Ther. 1981, 29, 365–372. [Google Scholar] [CrossRef] [PubMed]
- Juma, F.; Rogers, H.; Trounce, J. First pass hepatic metabolism of cyclophosphamide [proceedings]. Br. J. Clin. Pharmacol. 1979, 7, 422P. [Google Scholar] [CrossRef] [PubMed]
- Möller, A.; Iwasaki, K.; Kawamura, A.; Teramura, Y.; Shiraga, T.; Hata, T.; Schäfer, A.; Undre, N. The disposition of 14C-labeled tacrolimus after intravenous and oral administration in healthy human subjects. Drug Metab. Dispos. 1999, 27, 633–636. [Google Scholar] [PubMed]
- Verbeeck, R.K. Pharmacokinetics and dosage adjustment in patients with hepatic dysfunction. Eur. J. Clin. Pharmacol. 2008, 64, 1147–1161. [Google Scholar] [CrossRef] [PubMed]
- Mu, Y.; Zhang, J.; Zhang, S.; Zhou, H.H.; Toma, D.; Ren, S.; Huang, L.; Yaramus, M.; Baum, A.; Venkataramanan, R.; et al. Traditional Chinese medicines Wu Wei Zi (Schisandra chinensis Baill) and Gan Cao (Glycyrrhiza uralensis Fisch) activate pregnane X receptor and increase warfarin clearance in rats. J. Pharmacol. Exp. Ther. 2006, 316, 1369–1377. [Google Scholar] [CrossRef] [PubMed]
- Dubourg, L.; Tanière, P.; Cochat, P.; Baverel, G.; Michoudet, C. Toxicity of chloroacetaldehyde is similar in adult and pediatric kidney tubules. Pediatr. Nephrol. 2002, 17, 97–103. [Google Scholar] [CrossRef] [PubMed]
- Dubourg, L.; Michoudet, C.; Cochat, P.; Baverel, G. Human kidney tubules detoxify chloroacetaldehyde, a presumed nephrotoxic metabolite of ifosfamide. J. Am. Soc. Nephrol. 2001, 12, 1615–1623. [Google Scholar] [PubMed]
- Goren, M.; Wright, R.; Pratt, C.; Pell, F. Dechloroethylation of ifosfamide and neurotoxicity. Lancet 1986, 328, 1219–1220. [Google Scholar] [CrossRef]
- MacAllister, S.L.; Martin-Brisac, N.; Lau, V.; Yang, K.; O’Brien, P.J. Acrolein and chloroacetaldehyde: An examination of the cell and cell-free biomarkers of toxicity. Chem.-Biol. Interact. 2013, 202, 259–266. [Google Scholar] [CrossRef] [PubMed]
- Singh, M.; Dang, T.N.; Arseneault, M.; Ramassamy, C. Role of by-products of lipid oxidation in Alzheimer’s disease brain: A focus on acrolein. J. Alzheimer’s Dis. 2010, 21, 741–756. [Google Scholar] [CrossRef] [PubMed]
- Jiang, Y.M.; Wang, Y.; Tan, H.S.; Yu, T.; Fan, X.M.; Chen, P.; Zeng, H.; Huang, M.; Bi, H.C. Schisandrol B protects against acetaminophen-induced acute hepatotoxicity in mice via activation of the NRF2/ARE signaling pathway. Acta Pharmacol. Sin. 2016, 37, 382–389. [Google Scholar] [CrossRef] [PubMed]
- Fukuto, J.M.; Kumagai, Y.; Cho, A.K. Determination of the mechanism of demethylenation of (methylenedioxy) phenyl compounds by cytochrome P450 using deuterium isotope effects. J. Med. Chem. 1991, 34, 2871–2876. [Google Scholar] [CrossRef] [PubMed]
- Aitio, A.; Vainio, H. UDPglucuronosyltransferase and mixed function oxidase activity in microsomes prepared by differential centrifugation and calcium aggregation. Basic Clin. Pharmacol. Toxicol. 1976, 39, 555–561. [Google Scholar] [CrossRef]
- Myers, A.L.; Hassan, H.E.; Lee, I.J.; Eddington, N.D. Repeated administration of oxycodone modifies the gene expression of several drug metabolising enzymes in the hepatic tissue of male Sprague-Dawley rats, including glutathione S-transferase A-5 (rGSTA5) and CYP3A2. J. Pharm. Pharmacol. 2010, 62, 189–196. [Google Scholar] [CrossRef] [PubMed]
- Tolonen, A.; Petsalo, A.; Turpeinen, M.; Uusitalo, J.; Pelkonen, O. In vitro interaction cocktail assay for nine major cytochrome P450 enzymes with 13 probe reactions and a single LC/MSMS run: Analytical validation and testing with monoclonal anti-CYP antibodies. J. Mass Spectrom. 2007, 42, 960–966. [Google Scholar] [CrossRef] [PubMed]
- Chen, L.; Xiong, X.; Gao, S.; Zhai, J.; Chen, W.; Liu, Z.; Huang, H.; Zhang, F. UHPLC-MS/MS in simultaneous determination of cyclophosphamide and its metabolites in rat plasma. Acad. J. Second Mil. Med. Univ. 2016, 37, 1063–1069. [Google Scholar]
- Wei, H.; Miao, H.; Yun, Y.; Li, J.; Qian, X.; Wu, R.; Chen, W. Validation of an LC–MS/MS method for quantitative analysis of the 5 bioactive components of Wuzhi capsule in human plasma samples. Ther. Drug Monit. 2014, 36, 781–788. [Google Scholar] [CrossRef] [PubMed]
Sample Availability: Samples of the compounds (purity > 98%): DCCTX, testosterone, 6β-hydroxytestosterone, phenacetin, tinidazole, bifendate and Gom A are available from the authors. |

| DCCTX in Group 1−5 a | Cmax | Tmax | t1/2 | MRT0–8h | AUC0–8h |
|---|---|---|---|---|---|
| µg/mL | h | h | h | µg *h/mL | |
| Group 1 | 8.6 ± 1.3 | 2.0 ± 0.1 | 2.2 ± 0.5 | 3.3 ± 0.2 | 32.5 ± 8.4 |
| Group 2 | 1.9 ± 0.2 ** | 2.9 ± 0.6 * | 3.1 ± 0.9 | 3.8 ± 0.2 ** | 8.9 ± 0.3 ** |
| Group 3 | 2.6 ± 0.5 ** | 3.7 ± 0.8 ** | 3.2 ± 0.8 | 4.2 ± 0.1 ** | 11.8 ± 2.5 * |
| Group 4 | 16.2 ± 1.2 ** | 2.0 ± 0.1 | 2.0 ± 0.4 | 3.3 ± 0.2 | 65.9 ± 12.4 ** |
| Group 5 | 20.0 ± 3.1 ** | 3.3 ± 0.5 ** | 3.8 ± 1.2 * | 3.7 ± 0.2 ** | 79.2 ± 19.1 ** |
| Gene | Forward Primer (5′−3′) | Reverse Primer (5′−3′) | Reference |
|---|---|---|---|
| CYP3A2 | GAA TGC TTT TCTGTC TTC ACA AAC C | TTT ACC AAA ATG TCT CCA TAC TGT TCA | [35] |
| GAPDH | CCC ATC ACC ATC TTC CAG GAG | GTT GTC ATG GAT GAC CTT GGC |
© 2017 by the authors. Licensee MDPI, Basel, Switzerland. This article is an open access article distributed under the terms and conditions of the Creative Commons Attribution (CC BY) license (http://creativecommons.org/licenses/by/4.0/).
Share and Cite
Zhai, J.; Zhang, F.; Gao, S.; Chen, L.; Feng, G.; Yin, J.; Chen, W. Time- and NADPH-Dependent Inhibition on CYP3A by Gomisin A and the Pharmacokinetic Interactions between Gomisin A and Cyclophosphamide in Rats. Molecules 2017, 22, 1298. https://doi.org/10.3390/molecules22081298
Zhai J, Zhang F, Gao S, Chen L, Feng G, Yin J, Chen W. Time- and NADPH-Dependent Inhibition on CYP3A by Gomisin A and the Pharmacokinetic Interactions between Gomisin A and Cyclophosphamide in Rats. Molecules. 2017; 22(8):1298. https://doi.org/10.3390/molecules22081298
Chicago/Turabian StyleZhai, Jianxiu, Feng Zhang, Shouhong Gao, Li Chen, Ge Feng, Jun Yin, and Wansheng Chen. 2017. "Time- and NADPH-Dependent Inhibition on CYP3A by Gomisin A and the Pharmacokinetic Interactions between Gomisin A and Cyclophosphamide in Rats" Molecules 22, no. 8: 1298. https://doi.org/10.3390/molecules22081298