Interactions Controlling the Slow Dynamic Conformational Motions of Ubiquitin

1
College of Pharmaceutical Sciences, Ritsumeikan University, Noji-higashi 1-1-1, Kusatsu 525-8577, Japan
2
Okazaki Institute for Integrative Bioscience and Institute for Molecular Science, National Institutes of Natural Sciences, Myodaiji-cho, Aza-higashiyama 5-1, Okazaki 444-8787, Japan
3
Graduate School of Pharmaceutical Sciences, Nagoya City University, Tanabedouri 3-1, Mizuho-ku, Nagoya 467-8603, Japan
*
Author to whom correspondence should be addressed.
Molecules 2017, 22(9), 1414; https://doi.org/10.3390/molecules22091414
Submission received: 11 August 2017
/
Revised: 20 August 2017
/
Accepted: 20 August 2017
/
Published: 28 August 2017
(This article belongs to the Special Issue Recent Advances in Biomolecular NMR Spectroscopy)
Abstract
:Rational mutation of proteins based on their structural and dynamic characteristics is a useful strategy for amplifying specific fluctuations in proteins. Here, we show the effects of mutation on the conformational fluctuations and thermodynamic stability of ubiquitin. In particular, we focus on the salt bridge between K11 and E34 and the hydrogen bond between I36 and Q41, which are predicted to control the fluctuation between the basic folded state, N1, and the alternatively folded state, N2, of the protein, using high-pressure NMR spectroscopy. The E34A mutation, which disrupts the salt bridge, did not alter picosecond–to–nanosecond, microsecond–to–millisecond dynamic motions, and stability of the protein, while the Q41N mutation, which destabilizes the hydrogen bond, specifically amplified the N1–N2 conformational fluctuation and decreased stability. Based on the observed thermodynamic stabilities of the various conformational states, we showed that in the Q41N mutant, the N1 state is more significantly destabilized than the N2 state, resulting in an increase in the relative population of N2. Identifying the interactions controlling specific motions of a protein will facilitate molecular design to achieve functional dynamics beyond native state dynamics.
1. Introduction
Proteins in solution exist in thermodynamic equilibrium and fluctuate between multiple conformational states, from folded to unfolded. Increasing evidence shows that conformations with higher Gibbs free energy than the basic folded state (the native state) are important for functions such as enzymatic reactions [1,2] and signal transduction [3]. However, the structure, dynamics, and stability of high-energy states of proteins are not as well understood as those of the basic folded state. In fact, little is known about how functional motions are regulated in protein molecules.
Ubiquitin, which consists of 76 amino acid residues, is conjugated to target proteins by a specific E1–E2–E3 cascade reaction and plays essential roles in multiple cellular functions in eukaryotes [4,5]. The three-dimensional structure of ubiquitin has been studied in crystal structures by X-ray diffraction [6] and in solution by nuclear magnetic resonance (NMR) spectroscopy [7], both of which have revealed an essentially identical structure of the protein. Based on studies of the structure of ubiquitin in complex with other proteins, such as E1 and E2 enzymes and ubiquitin-associated proteins [8,9,10,11], ubiquitin uses different interaction modes for specific protein targets. Moreover, NMR studies have revealed that, in solution, ubiquitin undergoes a variety of conformational fluctuations within and beyond the native state ensemble [10,12,13,14,15,16].
The previous high-pressure NMR studies have revealed the presence of two high-energy states of wild-type ubiquitin, between the basic folded and totally unfolded states, namely the alternatively folded state, N2, and the locally disordered state, I [17,18,19]. Nuclear Overhauser Effect (NOE)-based structural determination by high-pressure NMR spectroscopy showed reorientation of the α-helix and β5-strand at 3 kbar, where 78% of the protein molecules were in the N2 state, and corresponding changes in several intra-molecular interactions [18]. The structural changes were also supported by residual dipolar coupling (RDC) experiments [20] and molecular dynamics (MD) simulations [21] of the protein under high pressure.
Based on the structural characteristics of N2, we constructed ubiquitin mutants, which, we hypothesized, would stabilize the N2 state [22]. In particular, we focused on two interactions that are predicted to control the N1–N2 fluctuation by high-pressure NMR studies. The first is the salt bridge between K11 and E34, which joins the α-helix and the β2-strand; the second is the hydrogen bond between I36 and Q41, which is widely conserved in ubiquitin-family proteins, such as ubiquitin and NEDD8 [11]. For instance, in the Q41N mutant, N2 was 70% populated at atmospheric pressure [22] and 97% populated at 2.5 kbar [23]. Surprisingly, in the Q41N mutant at 2.5 kbar, N2 has a very similar conformation to that of ubiquitin in complex with ubiquitin-activating enzyme E1 [23]. Moreover, the high-energy states, N2 and I, are conserved in ubiquitin–like modifiers, such as the NEDD8 [24] and SUMO-2 [25] proteins, and NEDD8 shows a similar reorientation of the β5-strand when it binds to NEDD8-activating enzyme E1 [24]. Based on these results, we hypothesized that the N1–N2 fluctuation is a common molecular phenomenon for the E1 recognition of ubiquitin-like modifiers [23].
In the present study, we further investigated the effects of mutations in the residues involved in the hydrogen bond and salt-bridge on backbone dynamics and stability, and reveal how the N2 state is stabilized in each mutant.
2. Results and Discussion
2.1. Chemical Shift Changes Induced by Mutations
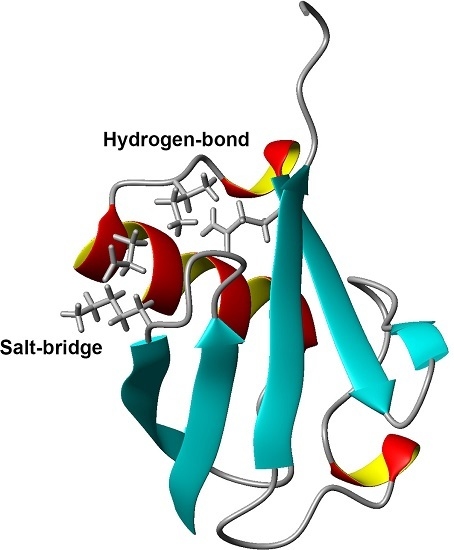
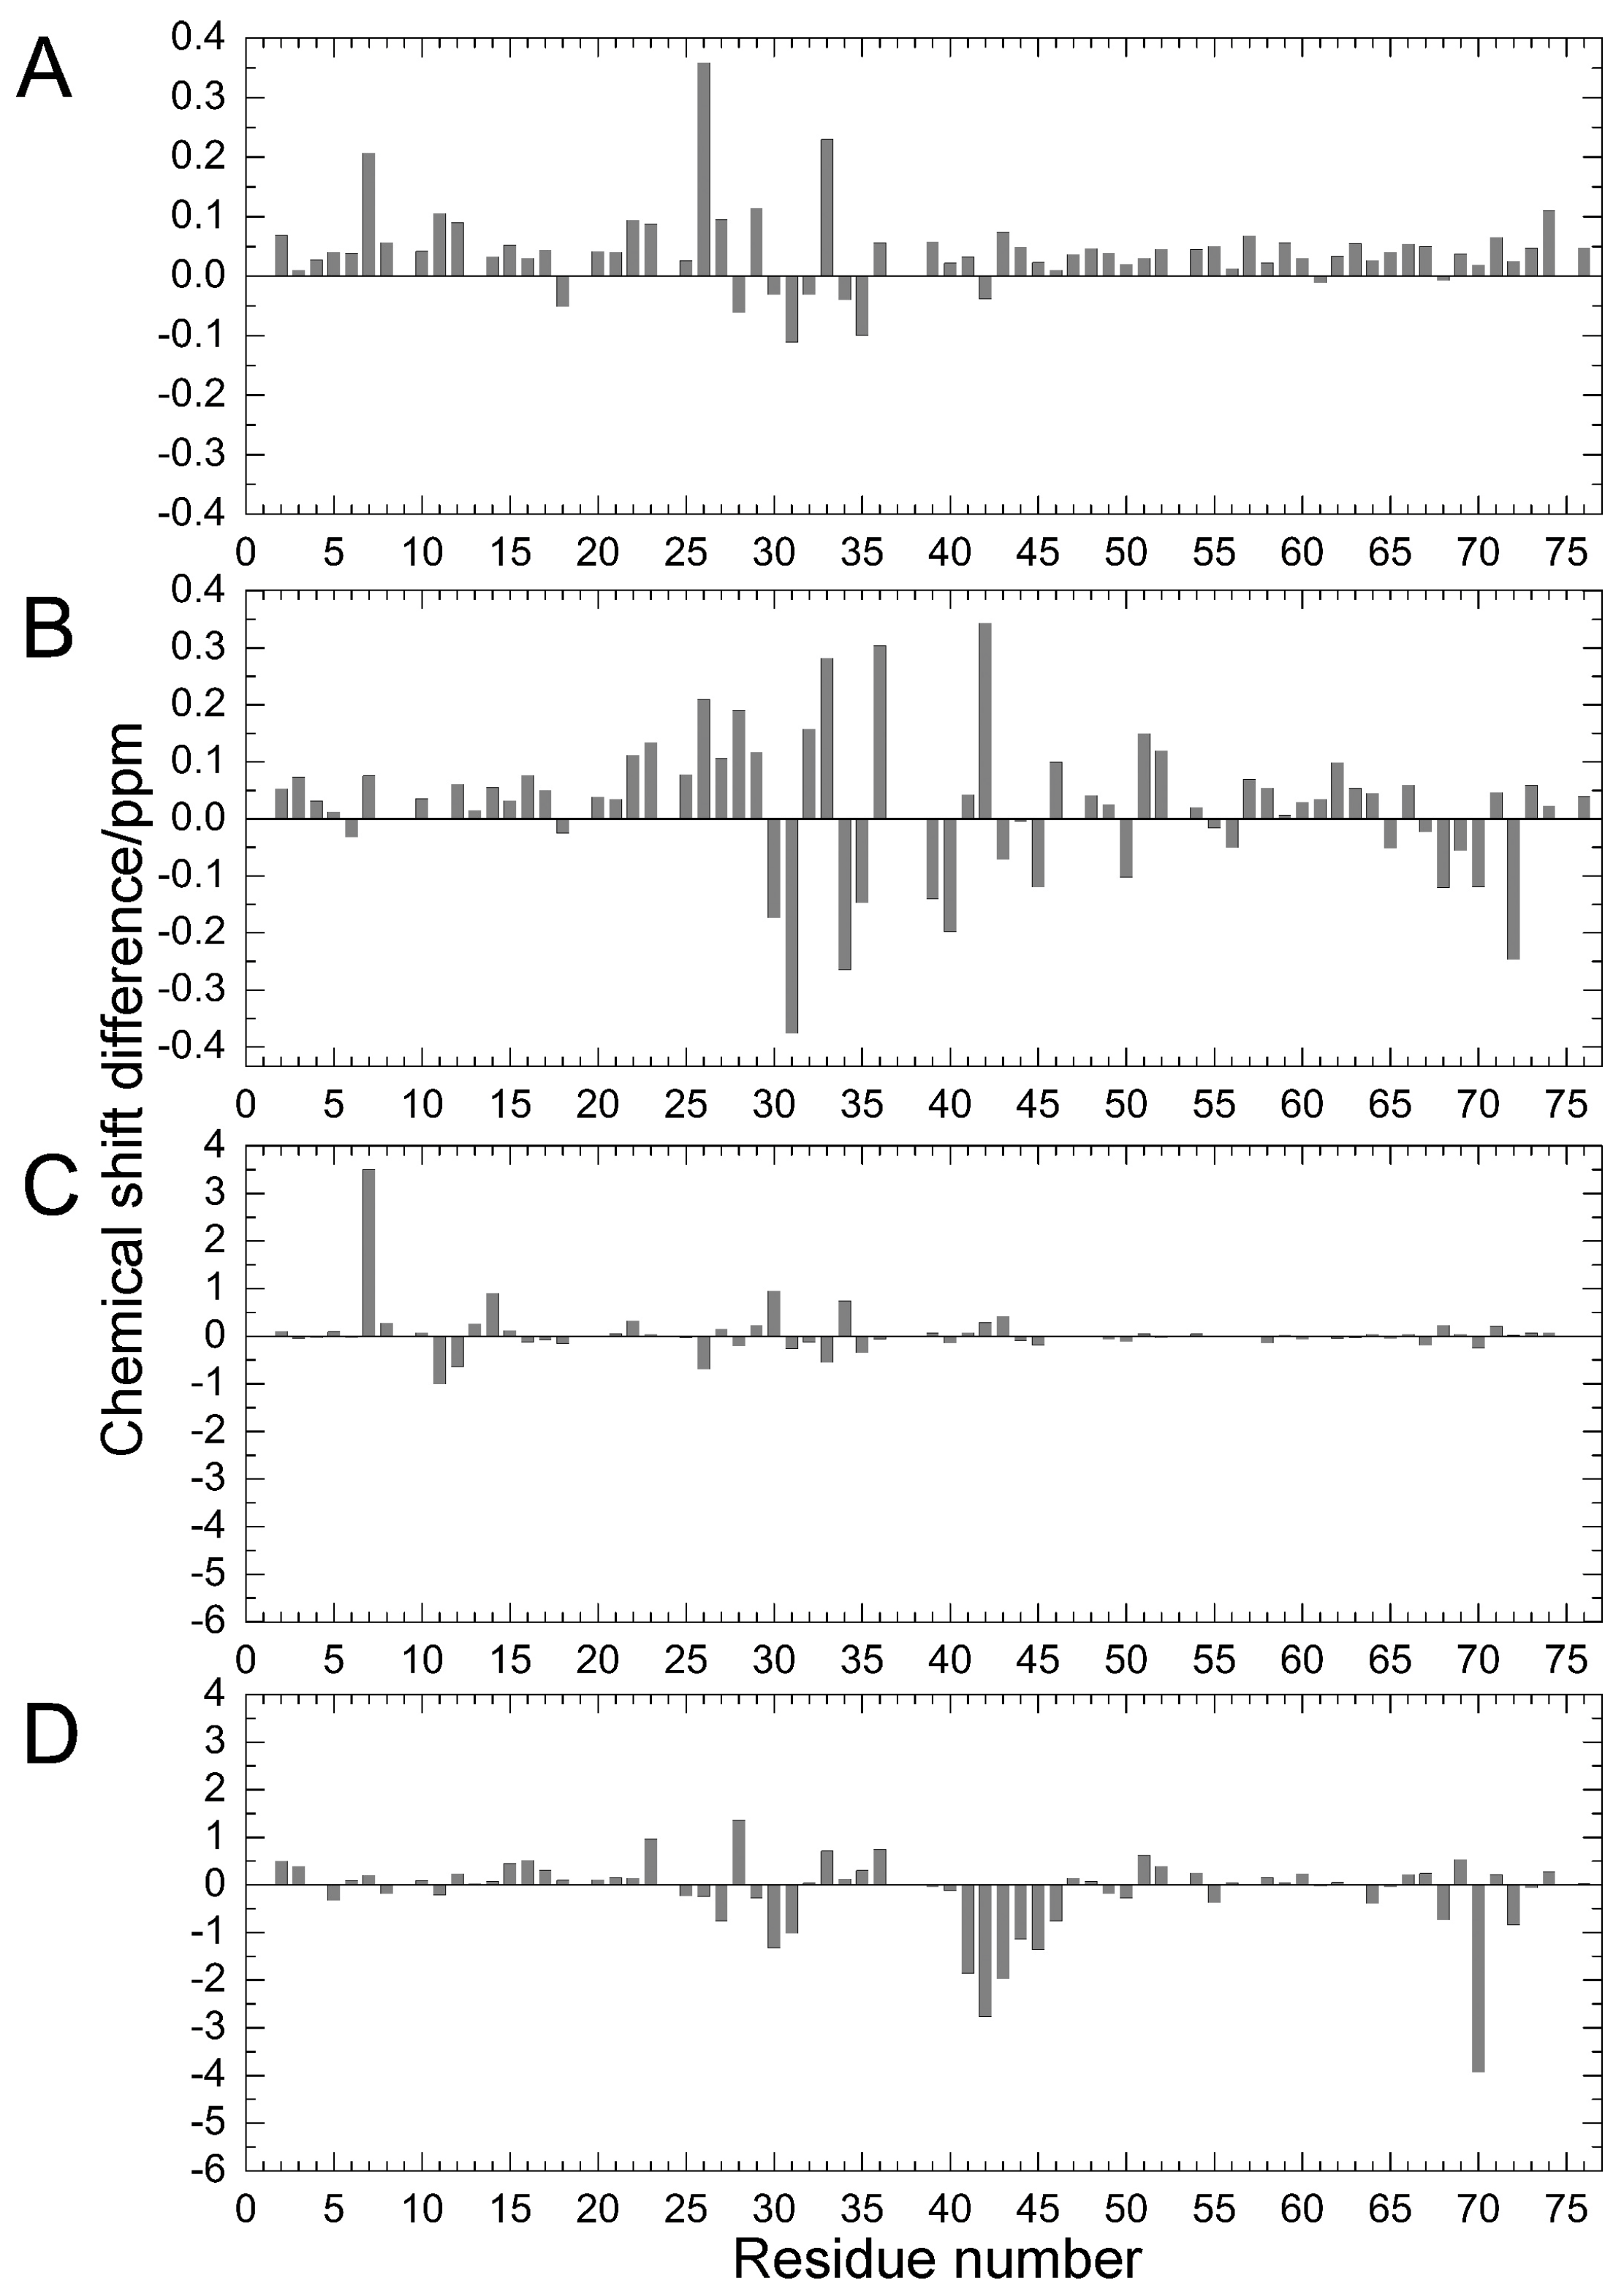
Comparing the structural characteristics of N1 and N2, we focused on the interactions of the salt bridge between K11 and E34, which ties the α–helix to the β2-strand, and the hydrogen bond between I36 and Q41, which ties the loop (residues 35–40) to the β3-strand (Figure 1). It is noteworthy that this hydrogen bond is highly conserved among proteins in the ubiquitin family [11]. We previously created K11A, E34A, Q41A, and Q41N mutants to disrupt or reduce these interactions and collected 1H/15N HSQC spectra (Figure 1 in [22]). Figure 2 shows 1H and 15N chemical shifts of the backbone amide groups in the E34A and Q41N mutants alongside the residue number. The changes in the 1H and 15N chemical shifts for Q41N were much larger than those for E34A. In the case of Q41N, large chemical shift changes were observed not only near the substituted site but also at residues 25–45 and 68–72, which match the residues at which changes are observed when the WT protein is under high pressure [18]. As previously noted, the chemical shift changes observed in the Q41N mutant, which showed the greatest chemical shift changes among the mutants, were significantly correlated with those induced by pressure perturbation [22]. This indicated that the N2 state is stabilized by the Q41N mutation, similar to the WT protein under pressure. Because the magnitude of the chemical shift changes was much larger in the Q41A and Q41N mutants than in the K11A and E34A mutants, the hydrogen bond between I36 and Q41 appears to be more important for controlling the N1–N2 conformational fluctuations of the protein (Figure 1 in [22]).
2.2. Stability of WT and Mutant Proteins
To investigate stability changes induced by the mutations, the effects of guanidine hydrochloride (GdmCl) on the denaturation of ubiquitin WT, E34A, and Q41N were examined at 298 K. Circular dichroism (CD) spectra, namely the molar ellipticity, θobs, calculated from the CD absorbance at 215–245 nm, of the proteins at various concentrations of GdmCl were shown in panels A–C of Figure 3. With increasing a concentration of GdmCl, θobs at 215–235 nm wavelength of the proteins were slightly increased (downside) up to 2 M and then sharply decreased (upside).
Figure 3D shows changes in the molar ellipticity at a wavelength of 222 nm, θ222, which is a major index of the secondary structure of proteins, as a function of GdmCl concentration. The curves represent averaged transitions from the folded states (N1 and N2) to the unfolded state (U). θobs can be expressed by Equation (1) (see Material and Methods). The ΔG values for unfolding obtained by curve fitting were 33 ± 8 kJ/mol for WT, 27 ± 7 kJ/mol for E34A, and 17 ± 5 kJ/mol for Q41N. The m-values for unfolding were 8 ± 2 kJ/(mol M) for WT, 7 ± 2 kJ/(mol M) for E34A, and 6 ± 2 kJ/(mol M) for Q41N. Unlike E34A, Q41N showed significantly lower thermodynamic stability than the WT protein. These results indicate that, although the K11 and E34 side chains are located at positions that enable them to form a salt bridge in the crystals [6], the contribution of the salt bridge between K11 and E34 to protein stability in solution is not as significant as that of the hydrogen bond between I36 and Q41. In addition, the smaller m-value for Q41N than that for WT also may indicate that the folded conformation of Q41N has more open and hydrated surfaces, than that of WT.
2.3. pKa Values for Side Chains of Aspartate and Glutamate
To investigate the stability of the salt bridges in solution, we determined the pKa values for the aspartate and glutamate side chains using NMR spectroscopy. We performed two-dimensional H (C) CO and HC (CO) experiments for the WT protein at 18 different pH values from 1.98 to 6.88. The H (C) CO experiment revealed correlations between Hβ/Hγ and C′ in these side chains, and the HC (CO) experiment revealed a similar correlation between Hβ/Hγ and Cβ/Cγ; thus, they provided chemical shift values for the nuclei [26]. Figure 4 shows the H (C) CO spectra (panel A) and the HC (CO) spectra (panel B) at the different pHs. Figure 5 shows the pH titration curves for Hβ/Hγ (panels A and D), Cβ/Cγ (panels B and E), and C′ (panels C and F) for aspartate (panels A–C) and glutamate (panels D–F). Table 1 lists the pKa values for the aspartate and glutamate side chains determined by the global fitting of the observed chemical shift data to a Henderson–Hasselbalch equation [27,28]. Most of the transition curves with single pKa values could be satisfactorily fitted to the NMR data. The pKa values of the residues, except E34 and E64, were in accord with published data that had been estimated using 1H chemical shifts only, in a range of ±0.2 pH units [27]. With the exception of the D21 and E51 side chains, most of the side chains of aspartate and glutamate showed pKa values similar to those of model compounds for side-chain carboxyl groups in oligopeptides (3.8–4.1 for aspartate and 4.1–4.6 for glutamate) [28]. Although the relationships between carboxyl pKa values and protein structure are not very precise [28], the present results suggest that the carboxyl groups, including those of E34, are exposed to the solvent and do not significantly interact with their counterparts under the conditions of the solution in our study (i.e., 20 mM d–Tris HCl buffer at pH 7.2). This is consistent with the fact that the salt bridge between K11 and E34 does not significantly contribute to protein stability. It should be noted that the presence of ions in buffer agents and fluctuations of polypeptide chains, however, may reduce the stability of salt bridges in solution.
In contrast, the pKa values of the D21 and E51 carboxyl groups were much lower than those of the model compounds. Considering the three-dimensional structure of the protein, the D21 and E51 carboxyl groups are expected to interact with the K29 and R54 side chains, respectively. However, because these residues are not involved in the N1–N2 conformational fluctuation, these interactions were not investigated further.
2.4. Backbone Dynamics and Hydration
We previously performed 15N–spin relaxation experiments (15N-R1, R2, and NOE) on WT protein and Q41N mutant [22]. Here, we performed these experiments on E34A mutant and compared the dynamic backbone motions of the mutants (Q41N and E34A) with those of WT protein. Figure 6 shows 15N-R1 (A & B), R2 (C & D), and NOE (E & F) values for E34A (A, C, E) and Q41N (B, D, F) at 278 K. 15N-R1 and NOE are sensitive probes of the picosecond-to-nanosecond motions of proteins, whereas 15N-R2 is sensitive to the microsecond-to-millisecond motions. For both mutants, the 15N-NOE values were almost identical to those of WT protein.
The 15N-R1 values showed a similar tendency. The similarity of these values between WT and mutants indicates that the picosecond–to–nanosecond motion was not significantly altered by the mutations. In contrast, the remarkable increase in the R2 values observed at residues 28–45 and 69–72 of Q41N (Figure 6D) shows that the microsecond–to–millisecond motion was amplified at these residue sites in the mutant.
As we previously reported, an increase in R2 values can be attributed to an increase in exchange contribution to R2 caused by an increase in the N2 population and a decrease in the rate of conformational exchange between N1 and N2 [18,22]. At 298 K, we observed similar tendencies for 15N-R1, R2, and NOE (data not shown).We have previously characterized the water-amide proton exchange of the mutants using phase-modulated clean chemical exchange (CLEANEX-PM) experiments. In these experiments, the magnetization transfers from water molecules to amide protons were monitored. Compared to the exchange rates of WT, the Q41N exchange rate was more than 10-times greater at some residues in the α-helix, loop, and β3-strand regions [22]. Many of the residues in these regions are involved in the N1–N2 conformational transition in WT protein. Thus, the observed increases in water-amide proton exchange rates in Q41N strongly supported the reorientation of the α-helix, loop, β3-strand, and β5-strand regions and the concomitant penetration of water into the hydrophobic cavity, as predicted by high-pressure NMR spectroscopy [18] and high-pressure MD simulations [21] for WT protein. In contrast, in K11A and E34A mutants, no increase in the exchange rates at the corresponding residues was observed, except for residues near the substituted site [22]. Therefore, disruption of the salt bridge between K11 and E34 does not seem to amplify the N1–N2 fluctuation significantly. The results of 15N spin relaxation experiments on the E34A mutant reported here support this hypothesis.
2.5. The Free-Energy Landscape
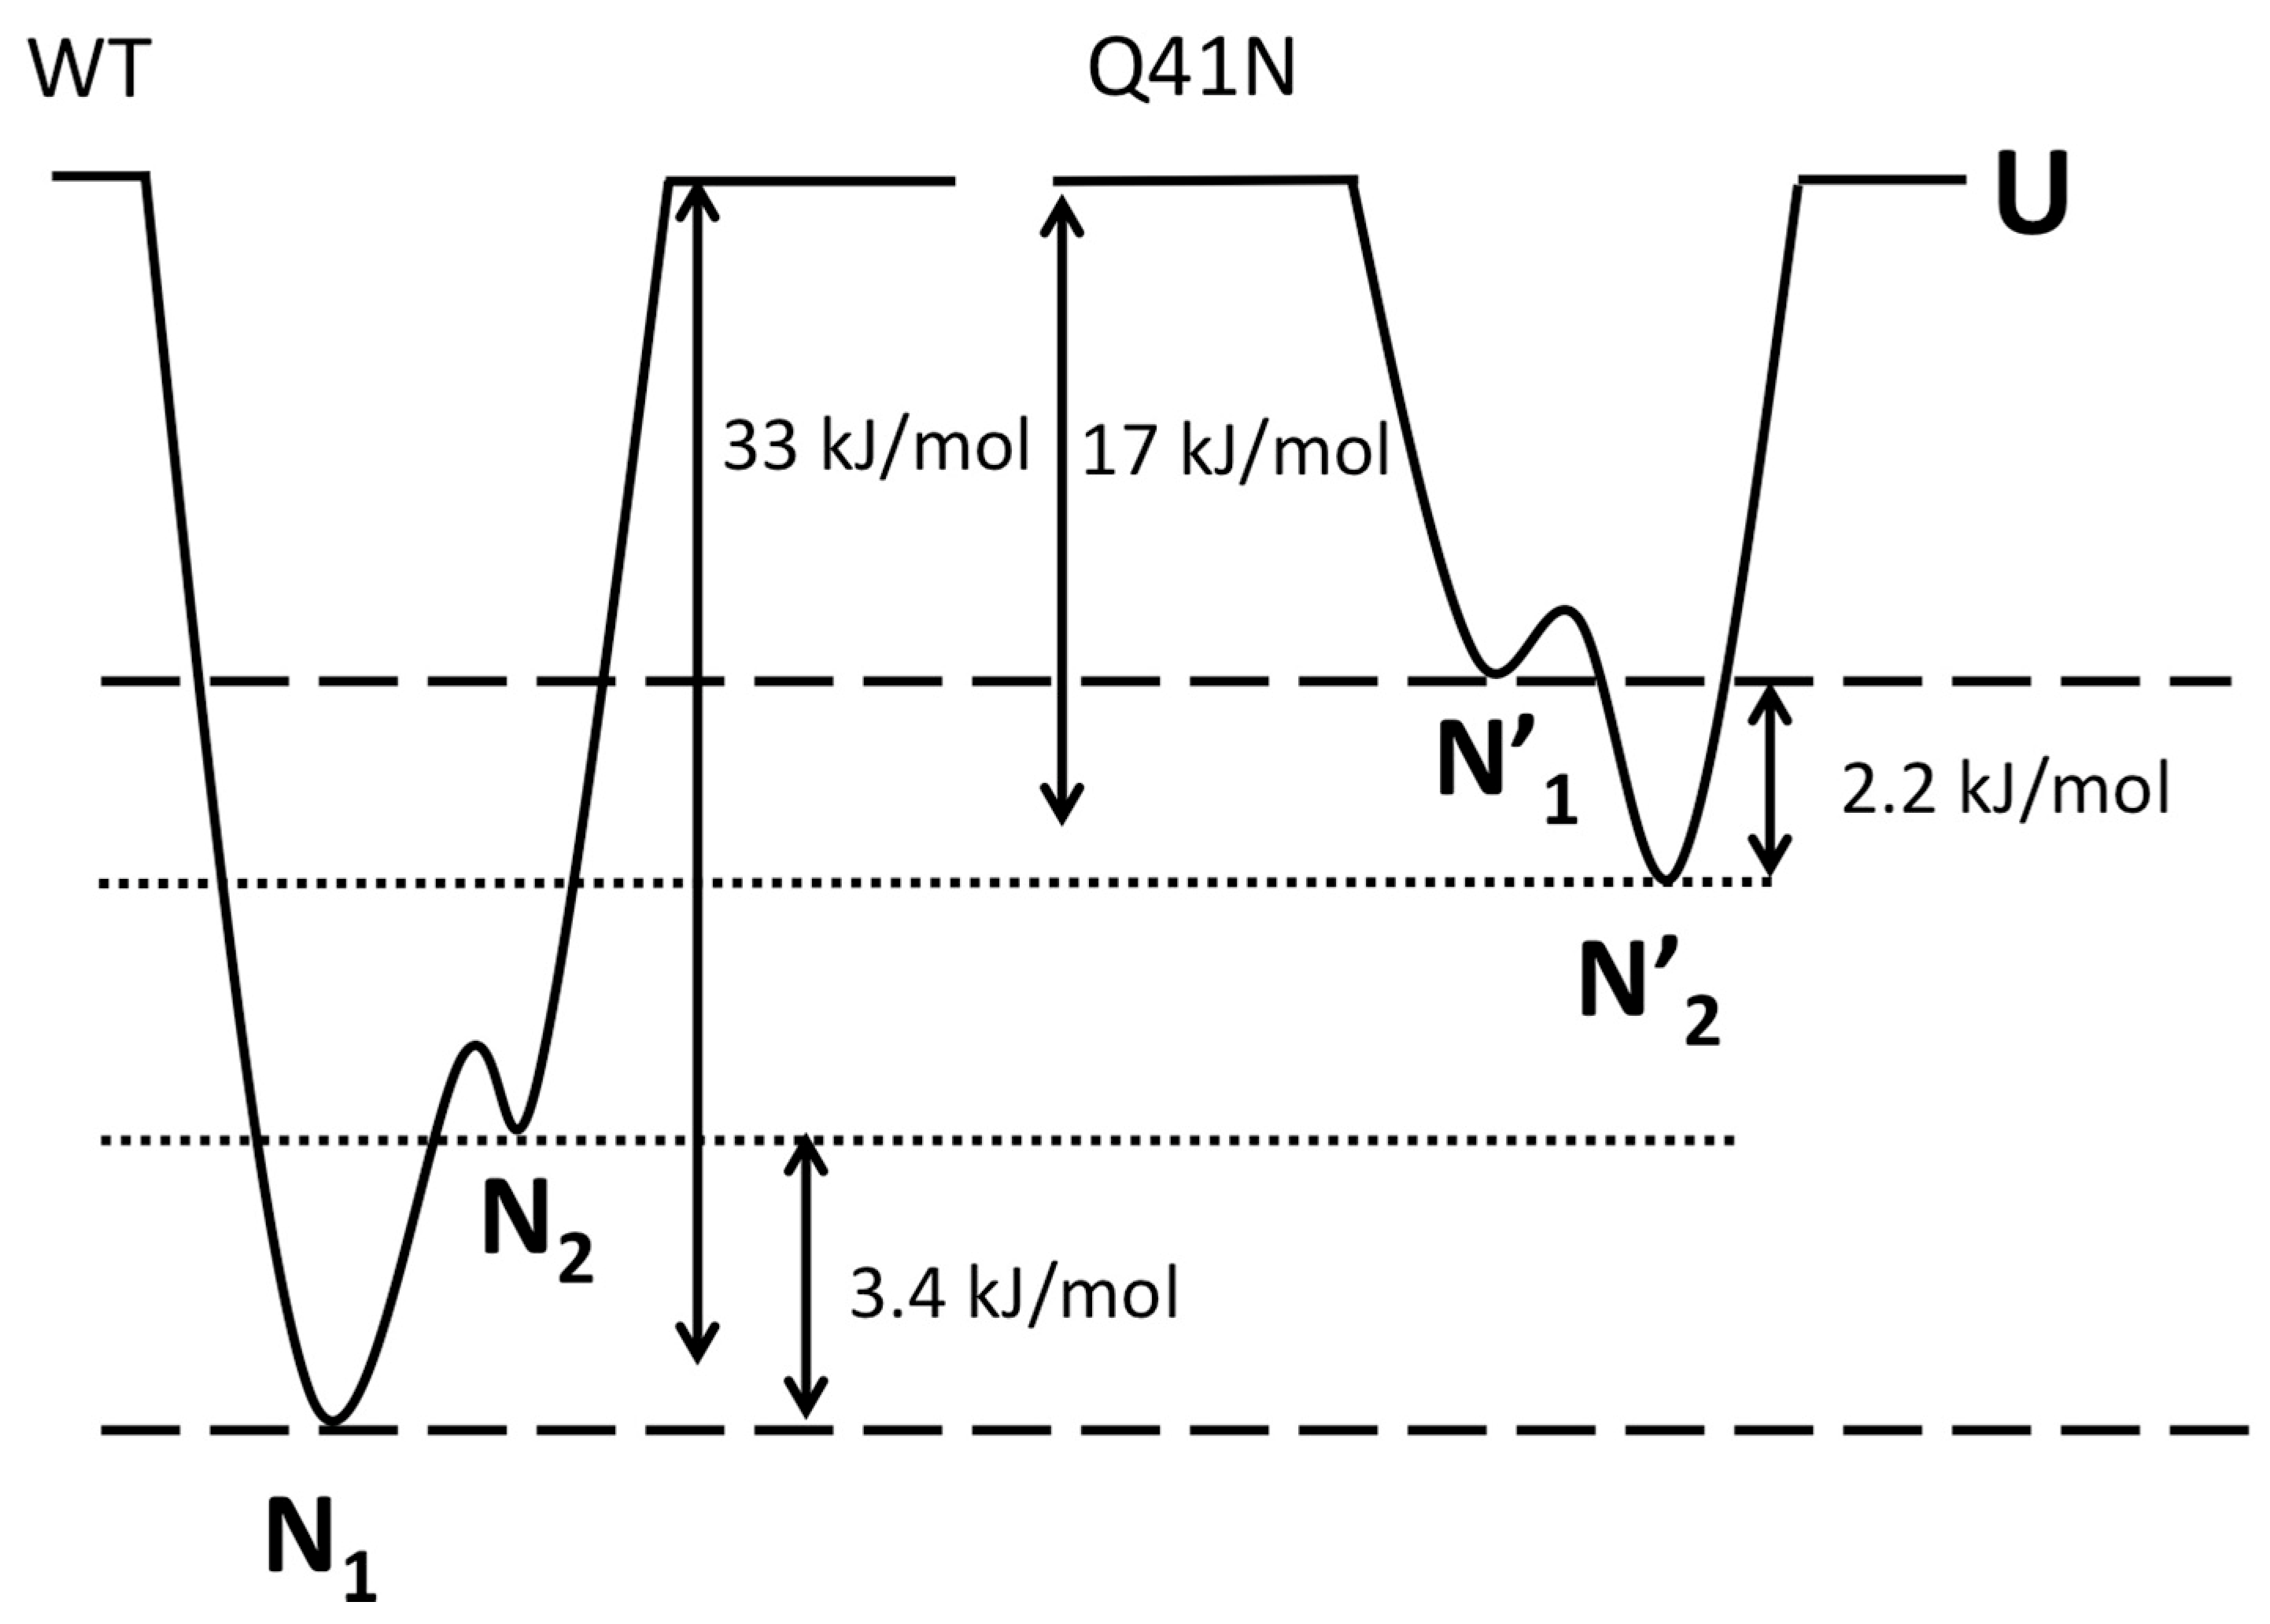
Finally, we discuss the effects of mutations on the relative free-energy levels of the N1 and N2 states. In the present study, the CD experiments showed that the ΔG value for the transition from the folded states (N1 and N2) to the unfolded state was 33 ± 8 kJ/mol for WT and 17 ± 5 kJ/mol for Q41N, at 298 K. We previously estimated that ΔG between N1 and N2 is 3.4 ± 0.1 kJ/mol for WT and −2.2 ± 0.3 kJ/mol for Q41N, at 298 K [22]. Given these ΔG values for WT and Q41N mutants, we estimated the relative energy levels among the N1, N2, and U states of the proteins. Here, we assumed that the totally unfolded states of both WT and Q41N have the same free energy.
Figure 7 shows a sketch of the energy landscape for WT and Q41N. Comparing these free energy diagrams, we found that the Q41N mutation destabilizes the N1 state (N1→N1’) more strongly than N2 state (N2→N2’). Because the N2 conformer contains more open and hydrated surfaces at the C-terminal side than the N1 conformer [23], we speculate that the enthalpic gains from the hydrogen bond between I36 and N41 in Q41N (N2 model) were outweighed by the entropic gains from the hydration of the C-terminal side of the protein. Indeed, CLEANEX-PM experiments on Q41N showed that the hydrated region was expanded at residues 31–41 [23]. These hydration may bring conformational heterogeneity of residues 31–41, namely the gains of conformational entropy. Interestingly, similar hydration-induced conformational changes were observed in the L69S mutant of ubiquitin [29], in which hydrophobic interactions and van der Waals interactions at the C-terminal side of the protein were reduced. In this case, a reduction in noncovalent interactions at this region, caused by mutation, could increase the N2 population.
3. Materials and Methods
3.1. Sample Preparation
Wild-type ubiquitin uniformly labeled with 13C/15N and 15N-labeled ubiquitin mutants (E34A and Q41N) were produced by conventional Escherichia coli expression and purified by ion exchange and gel column chromatography. The protein concentration was adjusted to 1–1.5 mM for NMR experiments and to 0.1 mM for circular dichroism experiments, in 20 mM d–Tris-HCl (or Tris-HCl) buffer solution at pH 7.2 and 298 K. For NMR samples, 7% 2H2O was included in the solution.
3.2. Circular Dichroism Measurements
CD spectra of ubiquitin and its mutants (E34A and Q41N) were measured at 215–245 nm wavelength at various concentrations of GdmCl using a J-805 spectropolarimeter (JASCO Co., Tokyo, Japan) at 298 K. CD absorption values at a wavelength of 222 nm were separately measured as an average of 100 scans. Error-bars show root-mean-square-deviation from the average, which were estimated from 100 scans. A quartz cuvette with a path length of 1 mm was used for all measurements. Molar ellipticity, θ222 per residue at different GdmCl concentrations was calculated from the absorption at 222 nm. θobs can be expressed by Equation (1):
where is the Gibbs free energy change for unfolding, m is the m-value, c is the concentration of GdmCl, R is the gas constant, and T is the absolute temperature. θF and θU are the molar ellipticities of the folded and unfolded species, respectively. Assuming that θF and θU were constants (baseline values), θobs was fit to Equation (1) with four variables, ΔG0, m, θF and θU.
3.3. NMR Measurements and Analysis
All NMR experiments were performed on a DRX-600 spectrometer (Bruker BioSpin Co., Fällanden, Switzerland) at a 1H frequency of 600.13 MHz. Signal assignments for Q41N were obtained by triple-resonance NMR experiments, as reported previously [22,23]. All HSQC cross-peaks for other mutants were assigned to individual amide groups using 15N-edited TOCSY and NOESY measurements, with reference to the assignments of the WT and Q41N proteins. 1H chemical shifts were referenced to the methyl signal of DSS, and 15N chemical shifts were indirectly referenced to DSS (0 ppm for 1H). Data were processed using the software Topspin 1.1 (Bruker BioSpin Co, Fällanden, Switzerland) and NMRPipe [30] and analyzed using the software NMR view [31] and KUJIRA [32].
Two-dimensional H(C)CO and HC(CO) experiments were performed on WT protein at 298 K between pH 1.98 and pH 6.88, at intervals of approximately 0.25 pH (18 different pH values), based on the Bruker HCACO pulse sequence with offsets altered to fit to the Cβ/Cγ shifts [26]. Assuming two extreme chemical shifts corresponding to protonated and unprotonated species, we determined the pKa values for aspartate and glutamate by the global fitting of the observed chemical shift data from H (C) CO and HC (CO) spectra to a Henderson-Hasselbalch equation. The details have previously been described [27,28].
15N spin-relaxation parameters, 15N-R1, R2, and NOE were obtained for all mutants at 278 K and 298 K, using previously described pulse sequences [33]. Spin-lattice relaxation measurements and spin-spin relaxation measurements were performed with 10 mixing times (10, 20, 40, 70, 100, 200, 400, 600, 900, and 1200 ms for R1 and 20, 35, 50, 70, 100, 130, 160, 200, 250, and 280 ms for R2). Relaxation rates were obtained by fitting the cross-peak intensities to a single-exponential function. 15N-NOE measurements were performed with 3-second intervals. Spectra were recorded with and without pre-saturation of the amide proton signals during the 3-second interval. The 15N-NOE value represents a ratio of cross-peak intensities with/without pre-saturation, and the value was obtained using the average of two experiments.
4. Conclusions
We have determined the pKa values for the aspartate and glutamate side chains based on pH-dependent chemical shift changes of Hβ/Hγ, Cβ/Cγ, and C′; these data suggest that most of the salt bridges in the protein do not significantly influence protein stability and structure in solution. In particular, the salt bridge between K11 and E34 does not substantially contribute to the N1–N2 fluctuations or protein stability. In contrast, the hydrogen bond between I36 and Q41, which is conserved among ubiquitin-family proteins, is crucial for the N1–N2 fluctuations. Thermodynamic analysis revealed that the larger population of N2 in Q41N can be attributed to the relatively greater destabilization of N1 than N2. A suitable point mutation based on the structure and dynamics of high-energy protein states enabled us to determine the specific interactions controlling a particular motion of ubiquitin. The present strategy is generally applicable to any protein and shows potential for facilitating molecular design for functional dynamics beyond the native state.
Acknowledgments
This work was supported by Grant–in–Aid for Scientific Research on Innovative Areas to R.K. (JP23107729) and K.K. (JP25102008) and Grant–in–Aid for Young Scientists (B) to R.K (JP25840025) from MEXT/JSPS of Japan.
Author Contributions
Ryo Kitahara designed the experiments and wrote the paper. Soichiro Kitazawa, Maho Yagi-Utsumi, and Koichi Kato performed the experiments. All authors approved the final manuscript.
Conflicts of Interest
The authors declare no conflict of interest.
References
- Boehr, D.D.; Dyson, H.J.; Wright, P.E. An NMR perspective on enzyme dynamics. Chem. Rev. 2006, 106, 3055–3079. [Google Scholar] [CrossRef] [PubMed]
- Eisenmesser, E.Z.; Millet, O.; Labeikovsky, W.; Korzhnev, D.M.; Wolf-Watz, M.; Bosco, D.A.; Skalicky, J.J.; Kay, L.E.; Kern, D. Intrinsic dynamics of an enzyme underlies catalysis. Nature 2005, 438, 117–121. [Google Scholar] [CrossRef] [PubMed]
- Inoue, K.; Yamada, H.; Akasaka, K.; Herrmann, C.; Kremer, W.; Maurer, T.; Doker, R.; Kalbitzer, H.R. Pressure-induced local unfolding of the ras binding domain of RalGDS. Nat. Struct. Biol. 2000, 7, 547–550. [Google Scholar] [CrossRef] [PubMed]
- Hershko, A. The ubiquitin system for protein degradation and some of its roles in the control of the cell-division cycle (Nobel lecture). Angew. Chem. Int. Ed. 2005, 44, 5932–5943. [Google Scholar] [CrossRef] [PubMed]
- Hershko, A.; Ciechanover, A. The ubiquitin system. Ann. Rev. Biochem. 1998, 67, 425–479. [Google Scholar] [CrossRef] [PubMed]
- Vijay-Kumar, S.; Bugg, C.E.; Cook, W.J. Structure of ubiquitin refined at 1.8 A resolution. J. Mol. Biol. 1987, 194, 531–544. [Google Scholar] [CrossRef]
- Cornilescu, G.; Marquardt, J.L.; Ottiger, M.; Bax, A. Validation of protein structure from anisotropic carbonyl chemical shifts in a dilute liquid crystalline phase. J. Am. Chem. Soc. 1998, 120, 6836–6837. [Google Scholar] [CrossRef]
- Sakata, E.; Satoh, T.; Yamamoto, S.; Yamaguchi, Y.; Yagi-Utsumi, M.; Kurimoto, E.; Tanaka, K.; Wakatsuki, S.; Kato, K. Crystal structure of UbcH5b~ubiquitin intermediate: Insight into the formation of the self-assembled E2~Ub conjugates. Structure 2010, 18, 138–147. [Google Scholar] [CrossRef] [PubMed]
- Page, R.C.; Pruneda, J.N.; Amick, J.; Klevit, R.E.; Misra, S. Structural insights into the conformation and oligomerization of E2~ubiquitin conjugates. Biochemistry 2012, 51, 4175–4187. [Google Scholar] [CrossRef] [PubMed]
- Fenwick, R.B.; Esteban-Martin, S.; Richter, B.; Lee, D.; Walter, K.F.; Milovanovic, D.; Becker, S.; Lakomek, N.A.; Griesinger, C.; Salvatella, X. Weak long-range correlated motions in a surface patch of ubiquitin involved in molecular recognition. J. Am. Chem. Soc. 2011, 133, 10336–10339. [Google Scholar] [CrossRef] [PubMed]
- Kiel, C.; Serrano, L. The ubiquitin domain superfold: Structure-based sequence alignments and characterization of binding epitopes. J. Mol. Biol. 2006, 355, 821–844. [Google Scholar] [CrossRef] [PubMed]
- Fu, Y.; Kasinath, V.; Moorman, V.R.; Nucci, N.V.; Hilser, V.J.; Wand, A.J. Coupled motion in proteins revealed by pressure perturbation. J. Am. Chem. Soc. 2012, 134, 8543–8550. [Google Scholar] [CrossRef] [PubMed]
- Babu, C.R.; Hilser, V.J.; Wand, A.J. Direct access to the cooperative substructure of proteins and the protein ensemble via cold denaturation. Nat. Struct. Mol. Biol. 2004, 11, 352–357. [Google Scholar] [CrossRef] [PubMed]
- Lange, O.F.; Lakomek, N.A.; Fares, C.; Schroder, G.F.; Walter, K.F.; Becker, S.; Meiler, J.; Grubmuller, H.; Griesinger, C.; de Groot, B.L. Recognition dynamics up to microseconds revealed from an RDC-derived ubiquitin ensemble in solution. Science 2008, 320, 1471–1475. [Google Scholar] [CrossRef] [PubMed]
- Salvi, N.; Ulzega, S.; Ferrage, F.; Bodenhausen, G. Time scales of slow motions in ubiquitin explored by heteronuclear double resonance. J. Am. Chem. Soc. 2012, 134, 2481–2484. [Google Scholar] [CrossRef] [PubMed] [Green Version]
- Massi, F.; Grey, M.J.; Palmer, A.G., 3rd. Microsecond timescale backbone conformational dynamics in ubiquitin studied with NMR R1rho relaxation experiments. Protein Sci. 2005, 14, 735–742. [Google Scholar] [CrossRef] [PubMed]
- Kitahara, R.; Yamada, H.; Akasaka, K. Two folded conformers of ubiquitin revealed by high-pressure NMR. Biochemistry 2001, 40, 13556–13563. [Google Scholar] [CrossRef] [PubMed]
- Kitahara, R.; Yokoyama, S.; Akasaka, K. NMR snapshots of a fluctuating protein structure: Ubiquitin at 30 bar-3 kbar. J. Mol. Biol. 2005, 347, 277–285. [Google Scholar] [CrossRef] [PubMed]
- Kitahara, R.; Akasaka, K. Close identity of a pressure-stabilized intermediate with a kinetic intermediate in protein folding. Proc. Natl. Acad. Sci. USA 2003, 100, 3167–3172. [Google Scholar] [CrossRef] [PubMed]
- Fu, Y.; Wand, A.J. Partial alignment and measurement of residual dipolar couplings of proteins under high hydrostatic pressure. J. Biomol. NMR 2013, 56, 353–357. [Google Scholar] [CrossRef] [PubMed]
- Imai, T.; Sugita, Y. Dynamic Correlation between Pressure-Induced Protein Structural Transition and Water Penetration. J. Phys. Chem. B 2010, 114, 2281–2286. [Google Scholar] [CrossRef] [PubMed]
- Kitazawa, S.; Kameda, T.; Yagi-Utsumi, M.; Sugase, K.; Baxter, N.J.; Kato, K.; Williamson, M.P.; Kitahara, R. Solution structure of the Q41N variant of ubiquitin as a model for the alternatively folded N2 state of ubiquitin. Biochemistry 2013, 52, 1874–1885. [Google Scholar] [CrossRef] [PubMed]
- Kitazawa, S.; Kameda, T.; Kumo, A.; Yagi-Utsumi, M.; Baxter, N.J.; Kato, K.; Williamson, M.P.; Kitahara, R. Close Identity between Alternatively Folded State N2 of Ubiquitin and the Conformation of the Protein Bound to the Ubiquitin-Activating Enzyme. Biochemistry 2014, 53, 447–449. [Google Scholar] [CrossRef] [PubMed]
- Kitahara, R.; Yamaguchi, Y.; Sakata, E.; Kasuya, T.; Tanaka, K.; Kato, K.; Yokoyama, S.; Akasaka, K. Evolutionally conserved intermediates between ubiquitin and NEDD8. J. Mol. Biol. 2006, 363, 395–404. [Google Scholar] [CrossRef] [PubMed]
- Kitahara, R.; Zhao, C.; Saito, K.; Koshiba, S.; Inoue, M.; Kigawa, T.; Yokoyama, S.; Akasaka, K. Basic folded and low-populated locally disordered conformers of SUMO-2 characterized by NMR spectroscopy at varying pressures. Biochemistry 2008, 47, 30–39. [Google Scholar] [CrossRef] [PubMed]
- Tomlinson, J.H.; Ullah, S.; Hansen, P.E.; Williamson, M.P. Characterization of Salt Bridges to Lysines in the Protein G B1 Domain. J. Am. Chem. Soc. 2009, 131, 4674–4684. [Google Scholar] [CrossRef] [PubMed]
- Sundd, M.; Iverson, N.; Ibarra-Molero, B.; Sanchez-Ruiz, J.M.; Robertson, A.D. Electrostatic interactions in ubiquitin: Stabilization of carboxylates by lysine amino groups. Biochemistry 2002, 41, 7586–7596. [Google Scholar] [CrossRef] [PubMed]
- Forsyth, W.R.; Antosiewicz, J.M.; Robertson, A.D. Empirical relationships between protein structure and carboxyl pK(a) values in proteins. Proteins 2002, 48, 388–403. [Google Scholar] [CrossRef] [PubMed]
- Haririnia, A.; Verma, R.; Purohit, N.; Twarog, M.Z.; Deshaies, R.J.; Bolon, D.; Fushman, D. Mutations in the hydrophobic core of ubiquitin differentially affect its recognition by receptor proteins. J. Mol. Biol. 2008, 375, 979–996. [Google Scholar] [CrossRef] [PubMed]
- Delaglio, F.; Grzesiek, S.; Vuister, G.W.; Zhu, G.; Pfeifer, J.; Bax, A. NMRPipe: A multidimensional spectral processing system based on UNIX pipes. J. Biomol. NMR 1995, 6, 277–293. [Google Scholar] [CrossRef] [PubMed]
- Johnson, B.A.; Blevins, R.A. NMR View: A computer program for the visualization and analysis of NMR data. J. Biomol. NMR 1994, 4, 603–614. [Google Scholar] [CrossRef] [PubMed]
- Kobayashi, N.; Iwahara, J.; Koshiba, S.; Tomizawa, T.; Tochio, N.; Guntert, P.; Kigawa, T.; Yokoyama, S. KUJIRA, a package of integrated modules for systematic and interactive analysis of NMR data directed to high-throughput NMR structure studies. J. Biomol. NMR 2007, 39, 31–52. [Google Scholar] [CrossRef] [PubMed]
- Farrow, N.A.; Muhandiram, R.; Singer, A.U.; Pascal, S.M.; Kay, C.M.; Gish, G.; Shoelson, S.E.; Pawson, T.; Formankay, J.D.; Kay, L.E. Backbone Dynamics of a Free and a Phosphopeptide-Complexed Src Homology-2 Domain Studied by N-15 Nmr Relaxation. Biochemistry 1994, 33, 5984–6003. [Google Scholar] [CrossRef] [PubMed]
Sample Availability: Samples of the compounds are not available from the authors. |
Figure 1.
Three-dimensional structure of ubiquitin (PDB ID: 1D3Z). Sidechains of K11, E34, I36, and Q41 are shown as stick models. α-helices are marked by red and yellow, β-sheets are marked by cyan.
Figure 1.
Three-dimensional structure of ubiquitin (PDB ID: 1D3Z). Sidechains of K11, E34, I36, and Q41 are shown as stick models. α-helices are marked by red and yellow, β-sheets are marked by cyan.
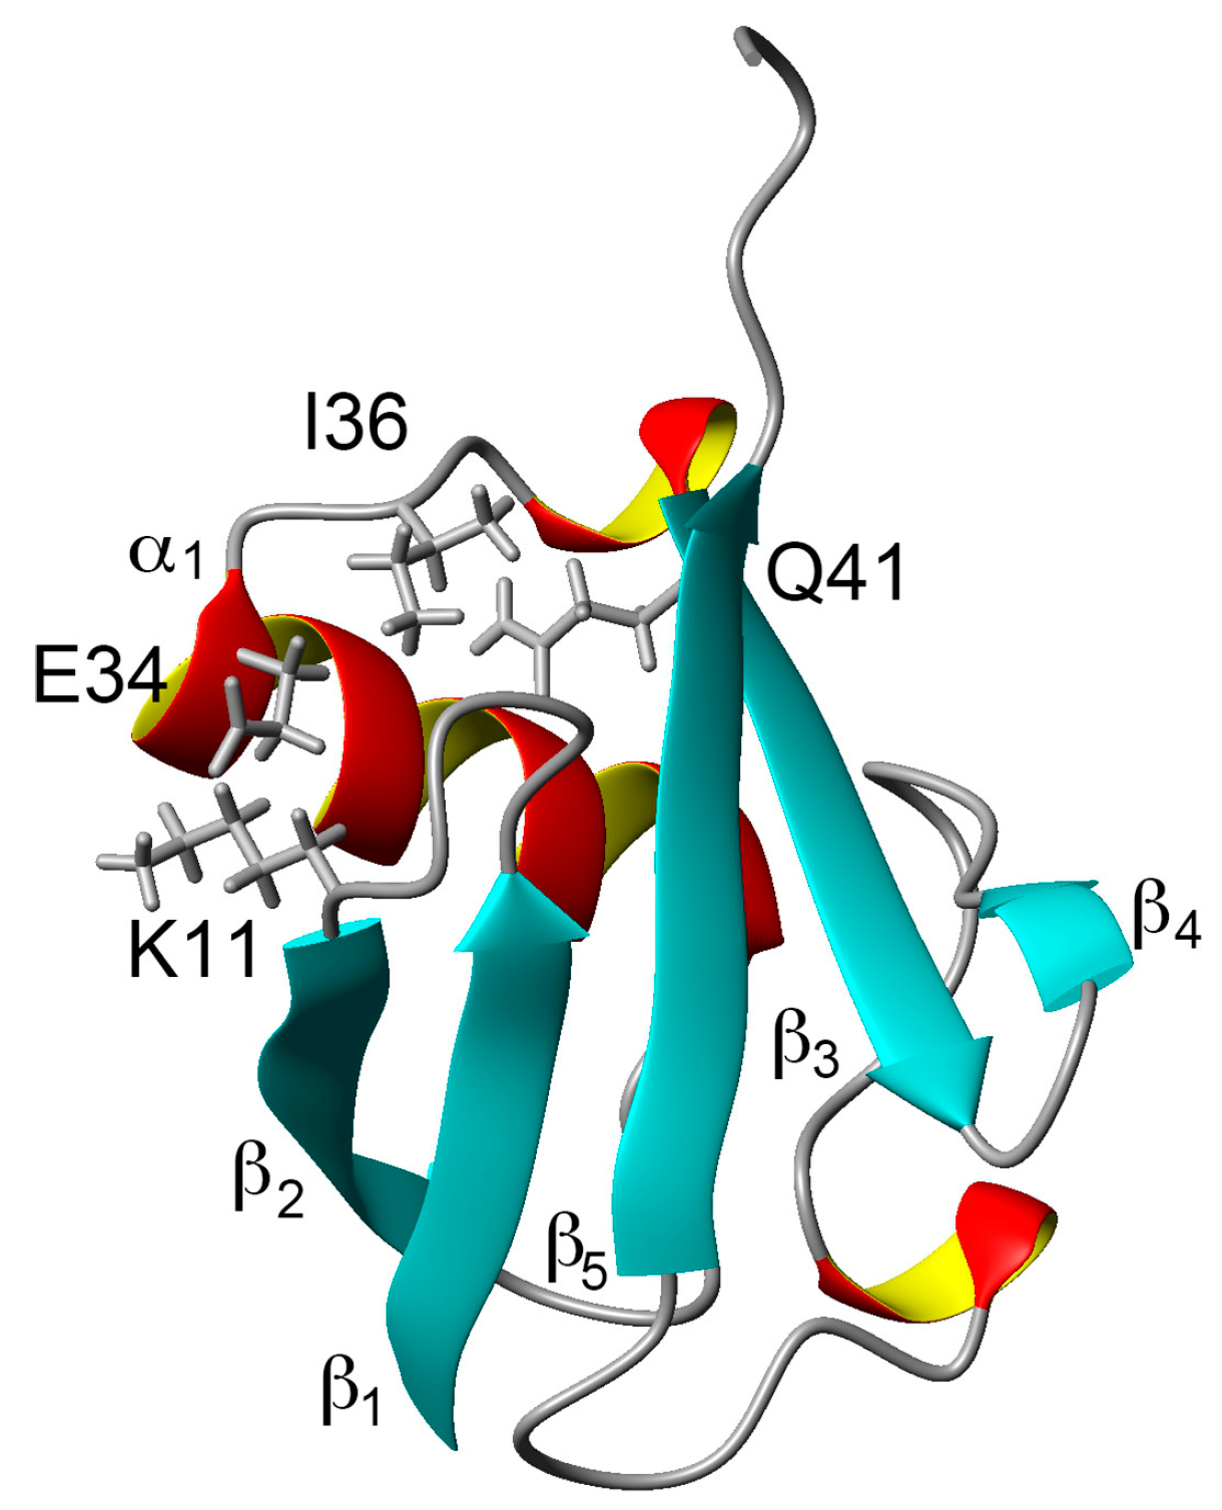
Figure 2.
Chemical shift differences (Δδ/ppm) between mutants and WT proteins: (A) amide 1H for E34A; (B) amide 1H for Q41N; (C) amide 15N for E34A; and (D) amide 15N for Q41N. Data for Q41N (panels B and D) were obtained from the literature [22] for comparison (Reproduced with permission from American Chemical Society).

Figure 3.
(A–C) CD spectra (A; WT; B; E34A, C; Q41N) and (D) molar ellipticity, θ222 of WT (closed circles) and mutant (E34A; open triangles and Q41N; open circles) ubiquitin as a function of guanidine hydrochloride concentration. CD spectral changes by increasing a concentration of GdmCl are indicated by arrows (⇧). Molar ellipticity was calculated from CD absorption at 222 nm (see Materials and Methods). Error-bars show root mean square deviation from the average.
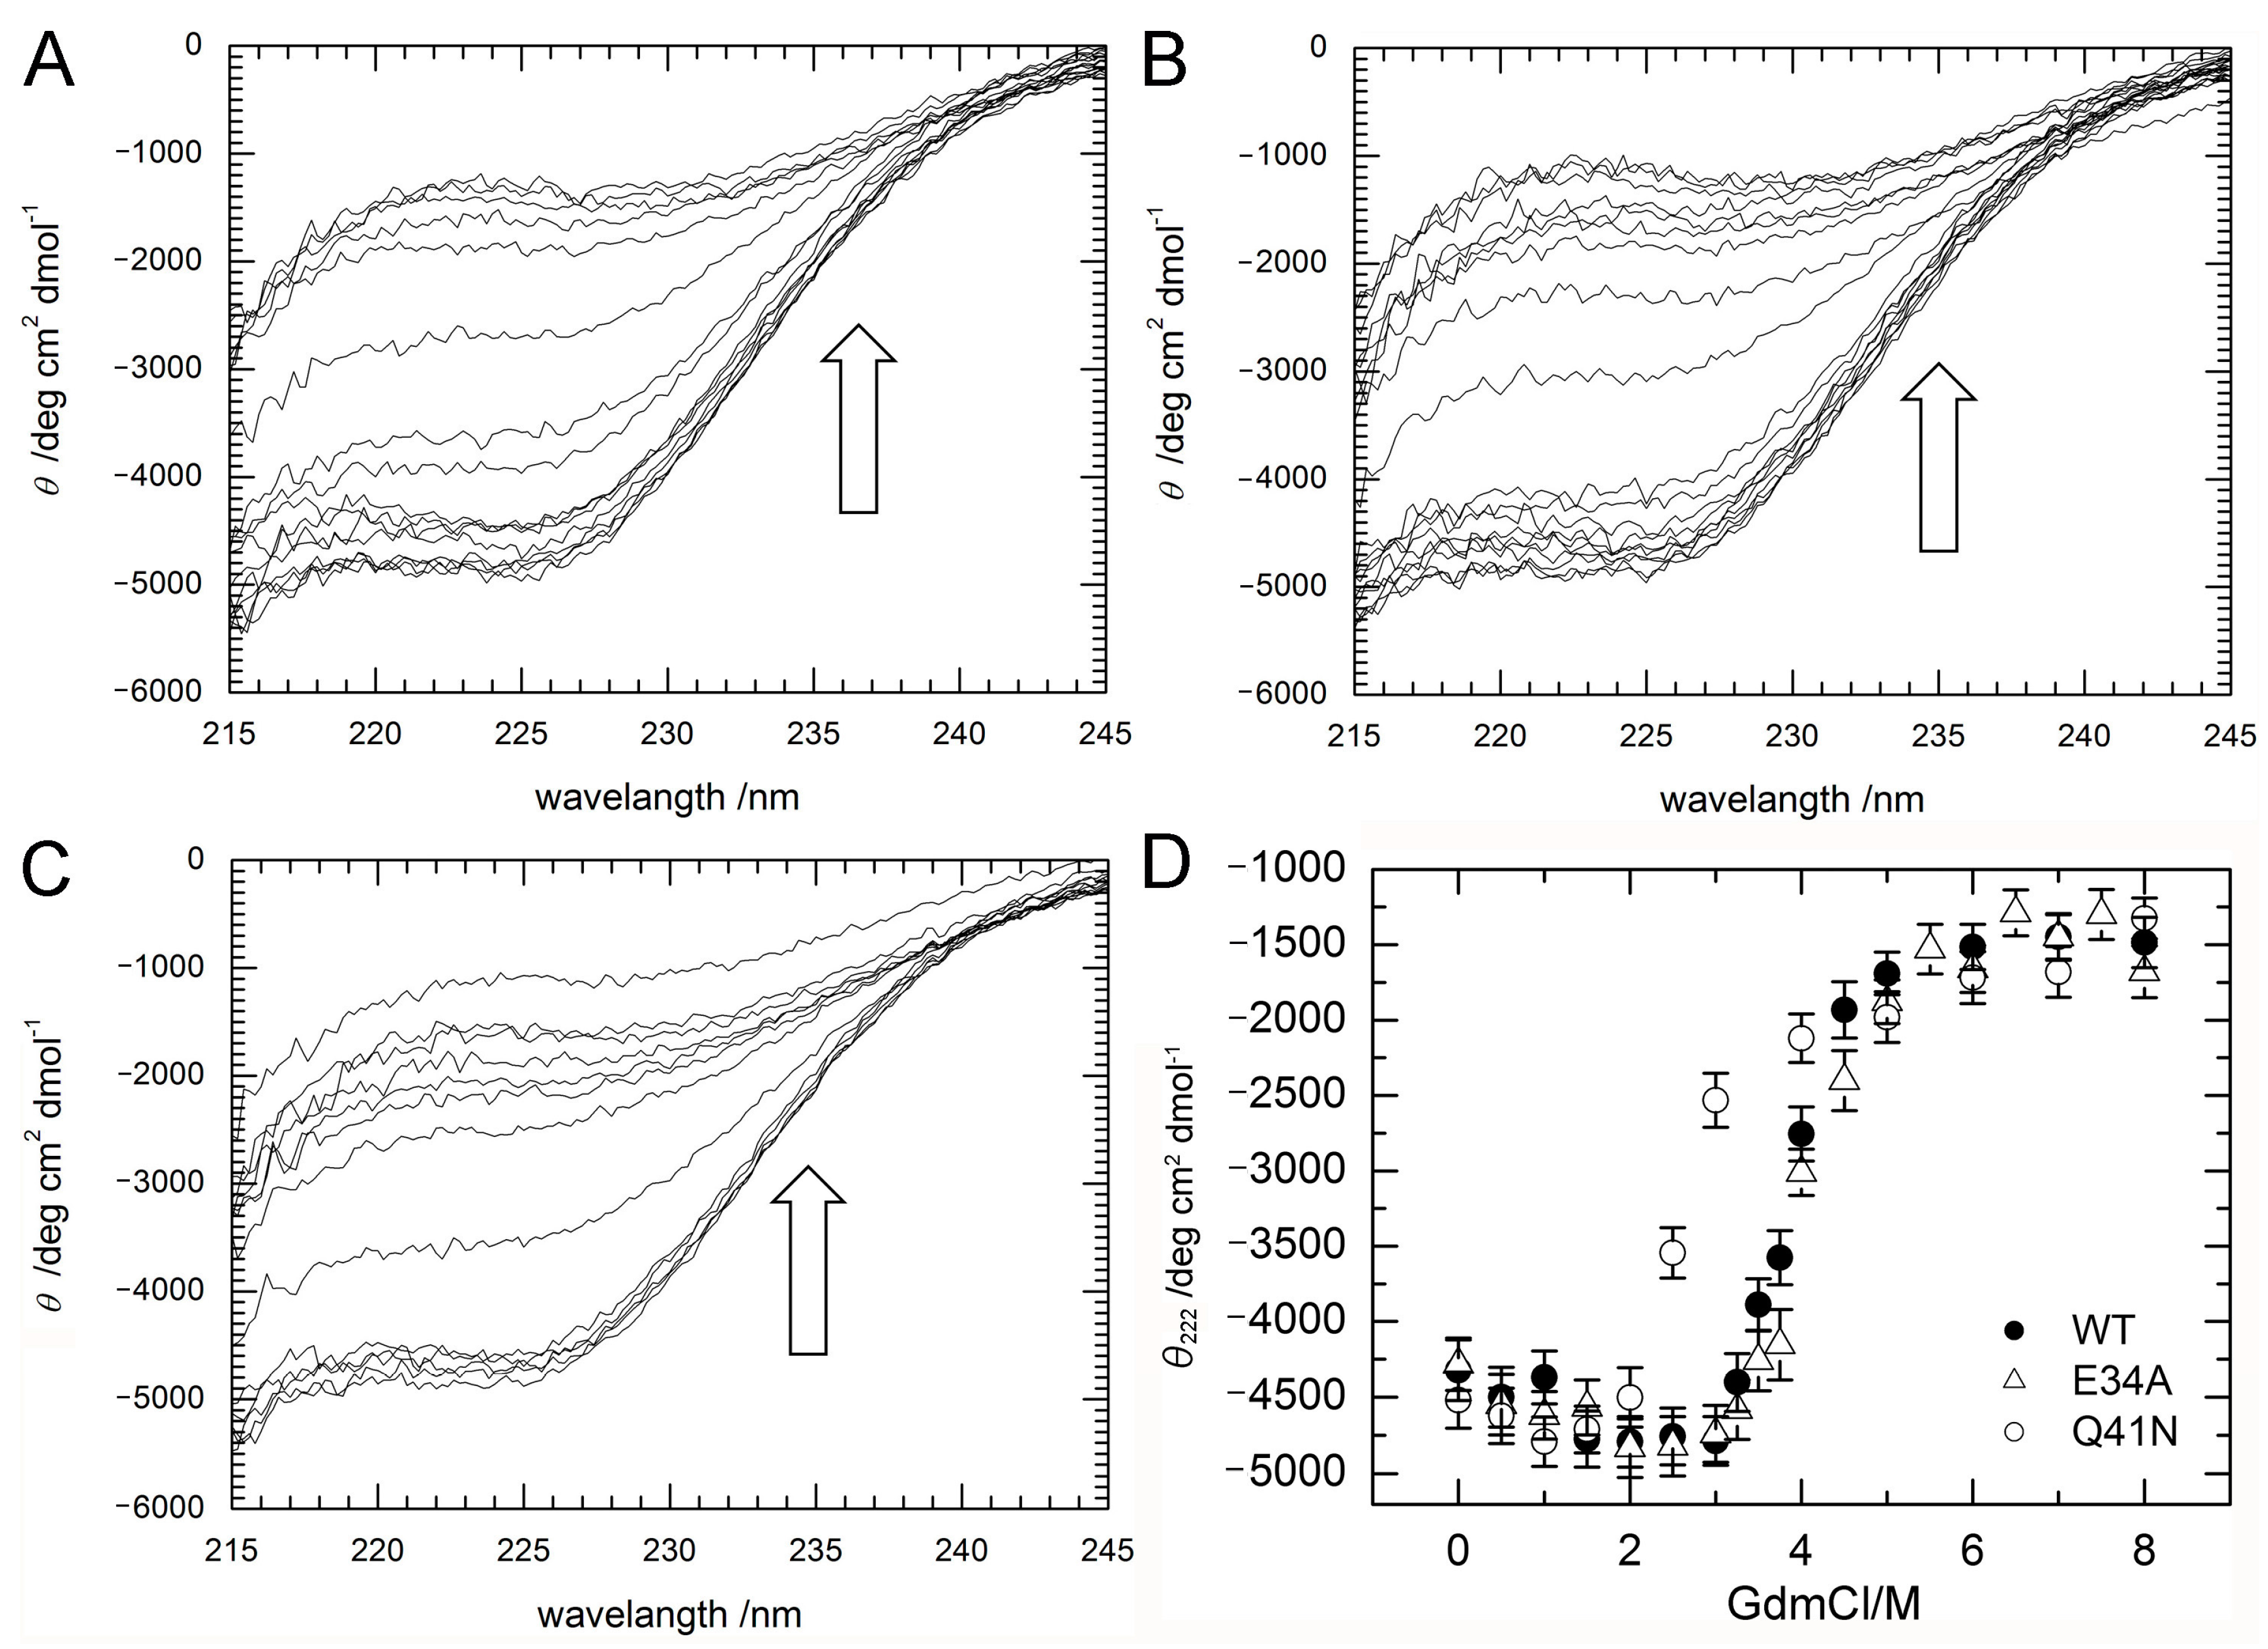
Figure 4.
(A) Two-dimensional H (C) CO and (B) HC (CO) spectra of WT ubiquitin at representative pH conditions from 6.88 (black) to 1.98 (red) at 298 K. All peaks move up the top, when pH decreases.
Figure 4.
(A) Two-dimensional H (C) CO and (B) HC (CO) spectra of WT ubiquitin at representative pH conditions from 6.88 (black) to 1.98 (red) at 298 K. All peaks move up the top, when pH decreases.
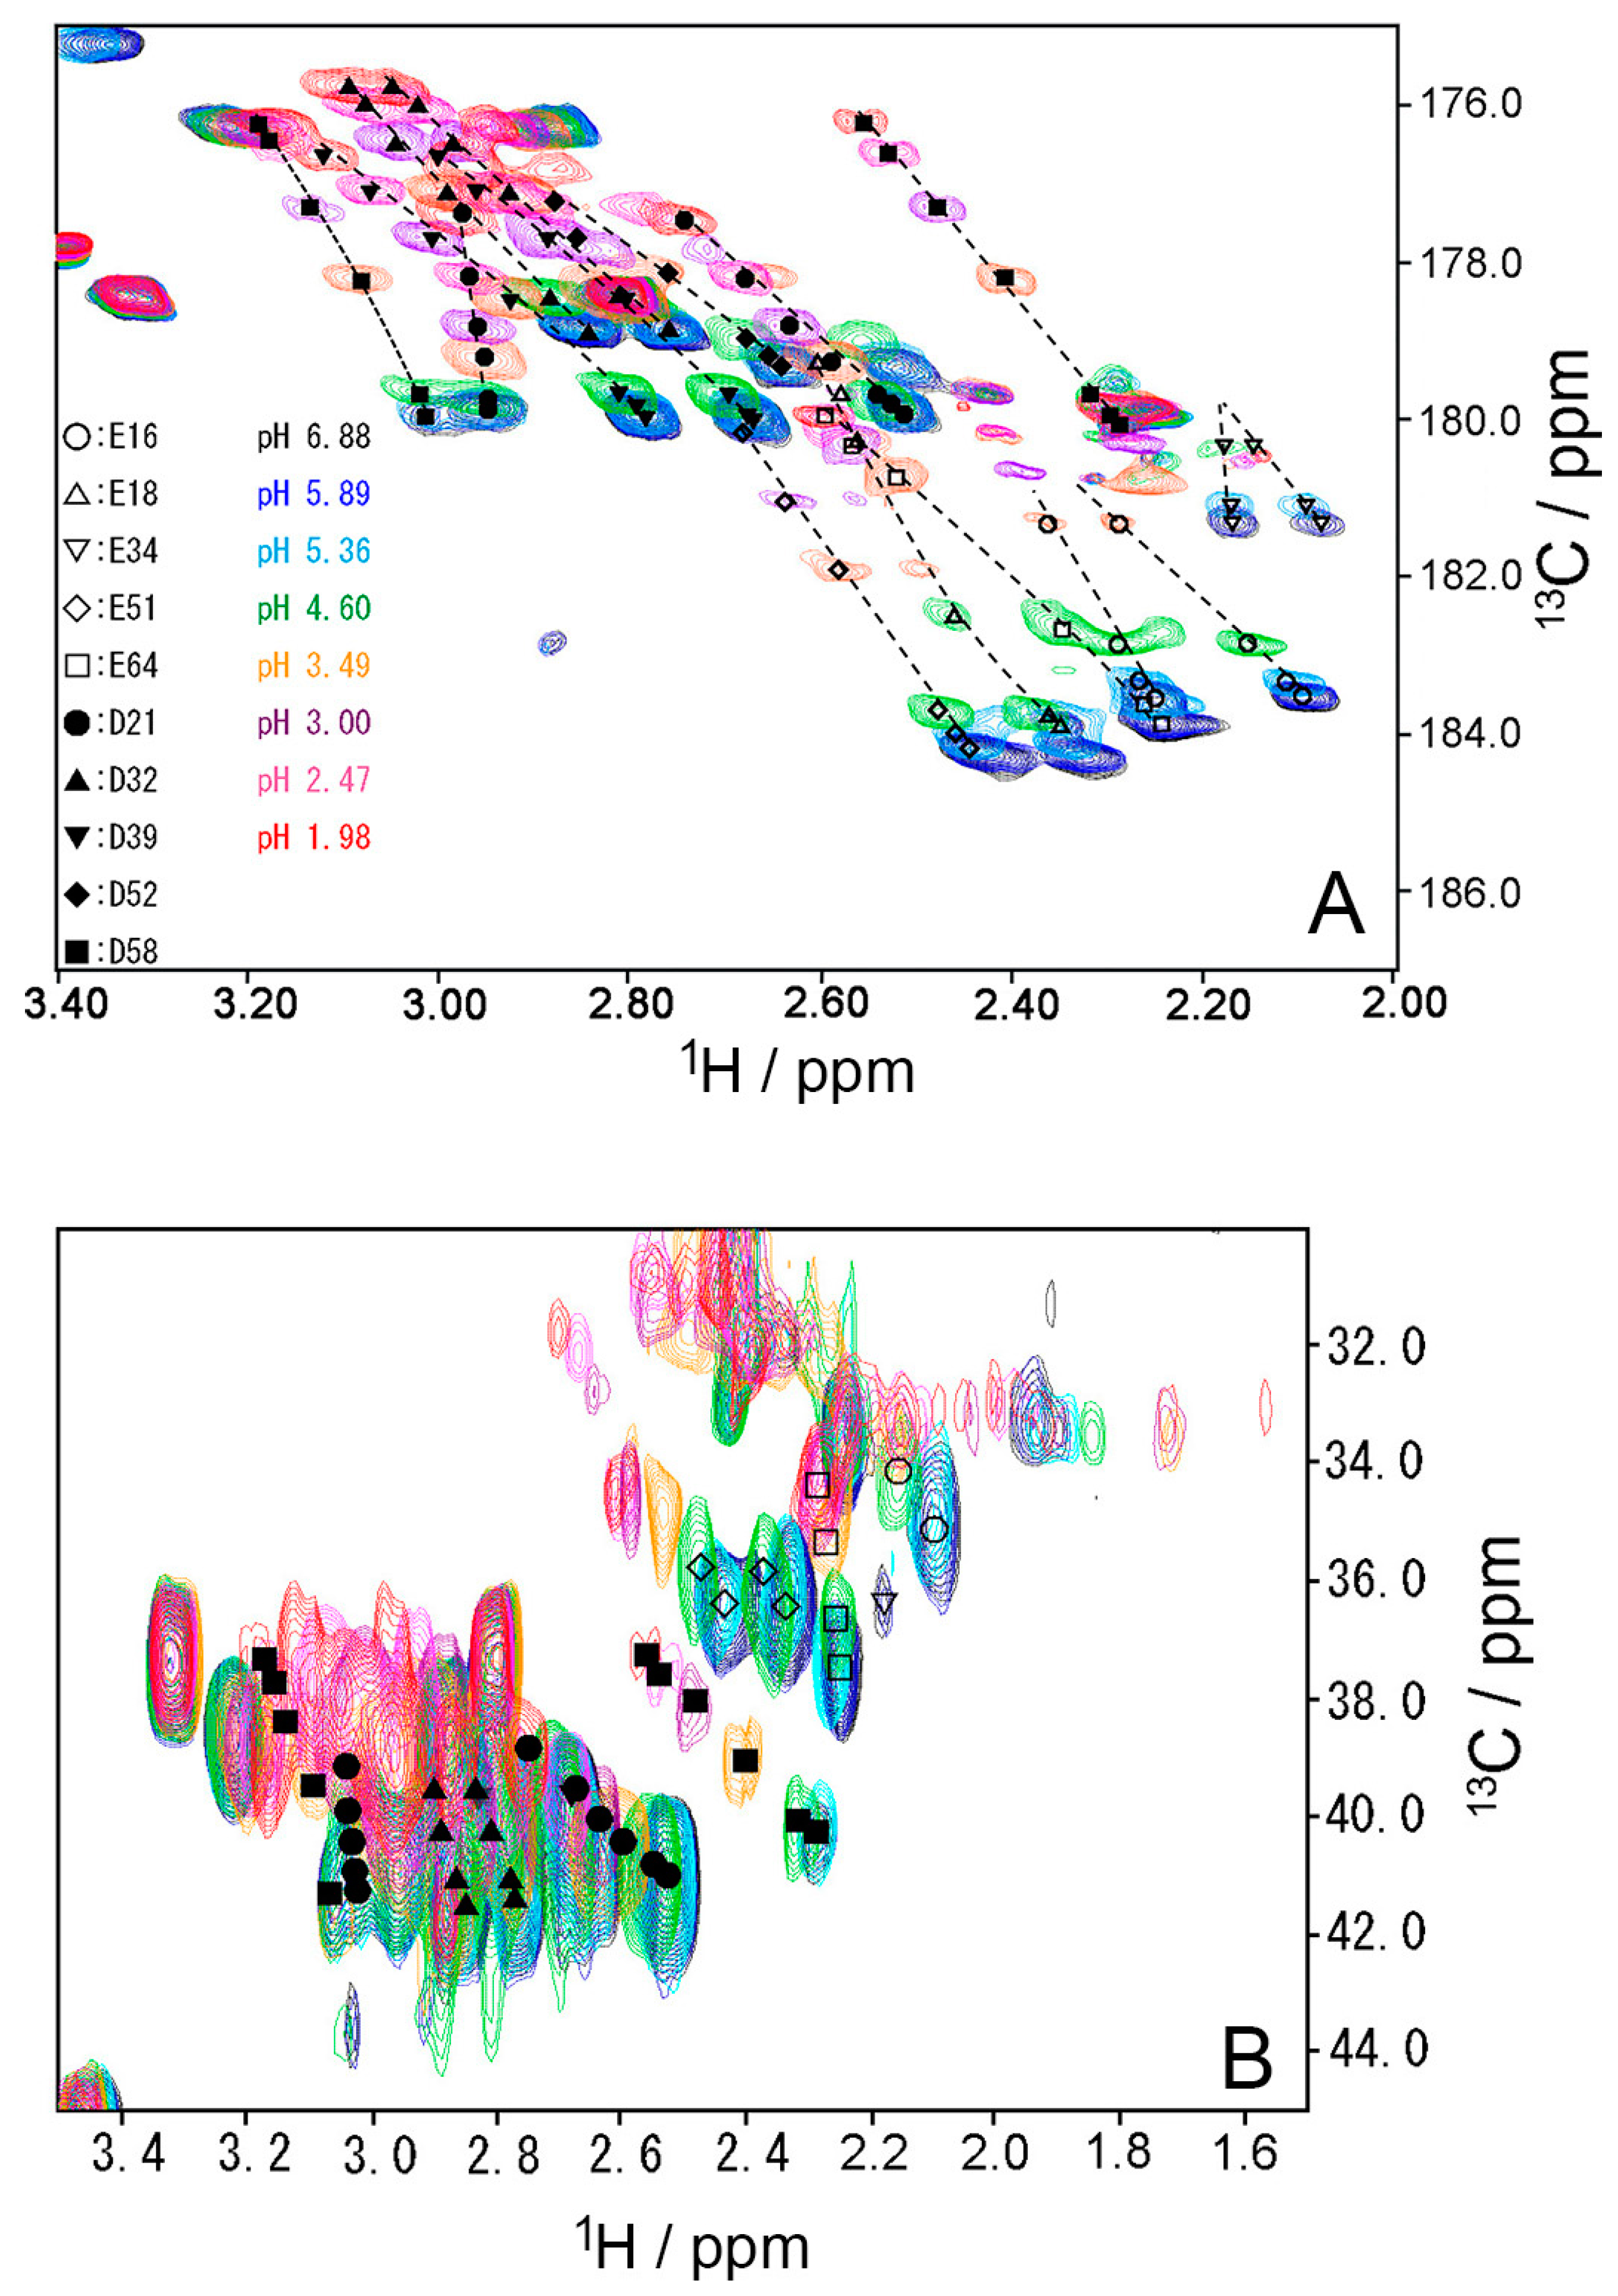
Figure 5.
Changes in aspartate (A–C) and glutamate (D–F) chemical shifts of WT ubiquitin by pH titration from pH 6.88 to pH 1.98 at 298 K. (A) Hβ of aspartate; (B) Cβ of aspartate; (C) C′ of aspartate, (D) Hβ of glutamate; (E) Cγ of glutamate; (F) C′ of glutamate.
Figure 5.
Changes in aspartate (A–C) and glutamate (D–F) chemical shifts of WT ubiquitin by pH titration from pH 6.88 to pH 1.98 at 298 K. (A) Hβ of aspartate; (B) Cβ of aspartate; (C) C′ of aspartate, (D) Hβ of glutamate; (E) Cγ of glutamate; (F) C′ of glutamate.
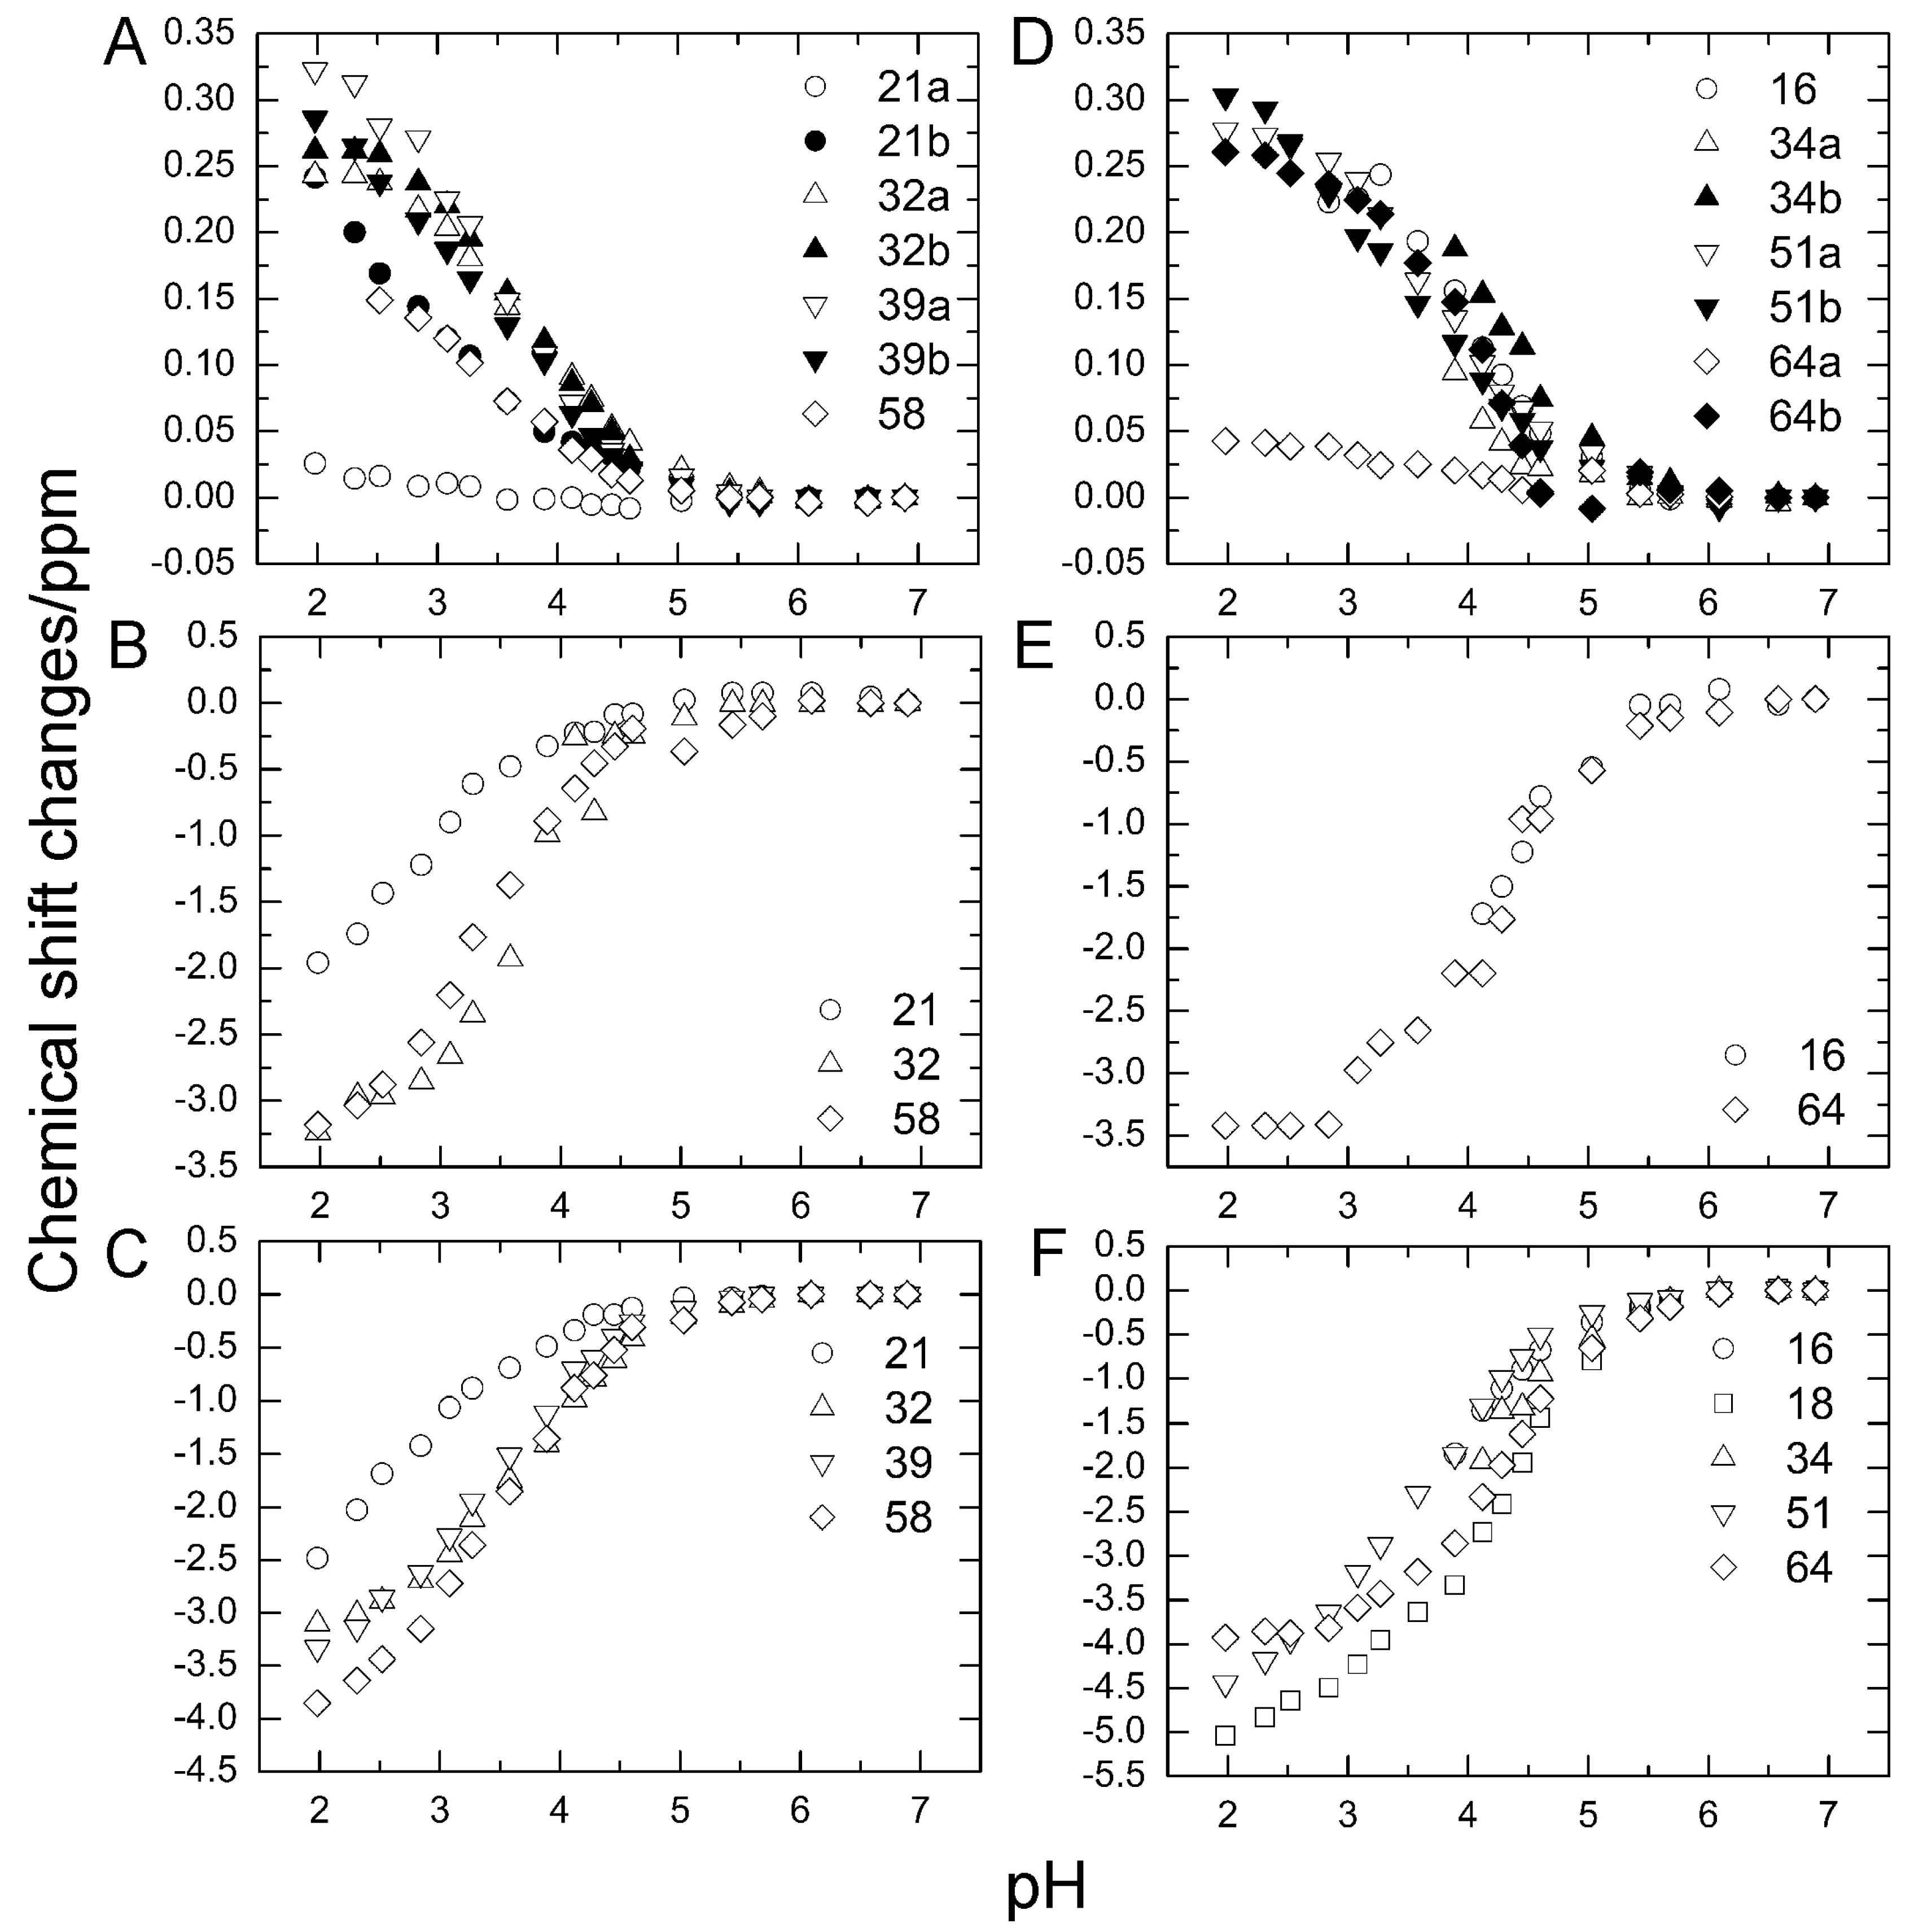
Figure 6.
15N-spin relaxation dynamics of ubiquitin mutants (E34A and Q41N) (histograms) at 278 K. (A) 15N-longitudinal relaxation rates, R1 for E34A; (B) 15N-longitudinal relaxation rates, R1 for Q41N; (C) 15N-transverse relaxation rates, R2 for E34A; (D) 15N-transverse relaxation rates, R2 for Q41N; (E) Heteronuclear Overhauser effects, 15N-NOE for E34A; (F) Heteronuclear Overhauser effects; 15N-NOE for Q41N. Data for WT protein are represented by closed circles in each panel. Data for WT and Q41N were obtained from the literature [22] for comparison (Reproduced with permission from American Chemical Society).
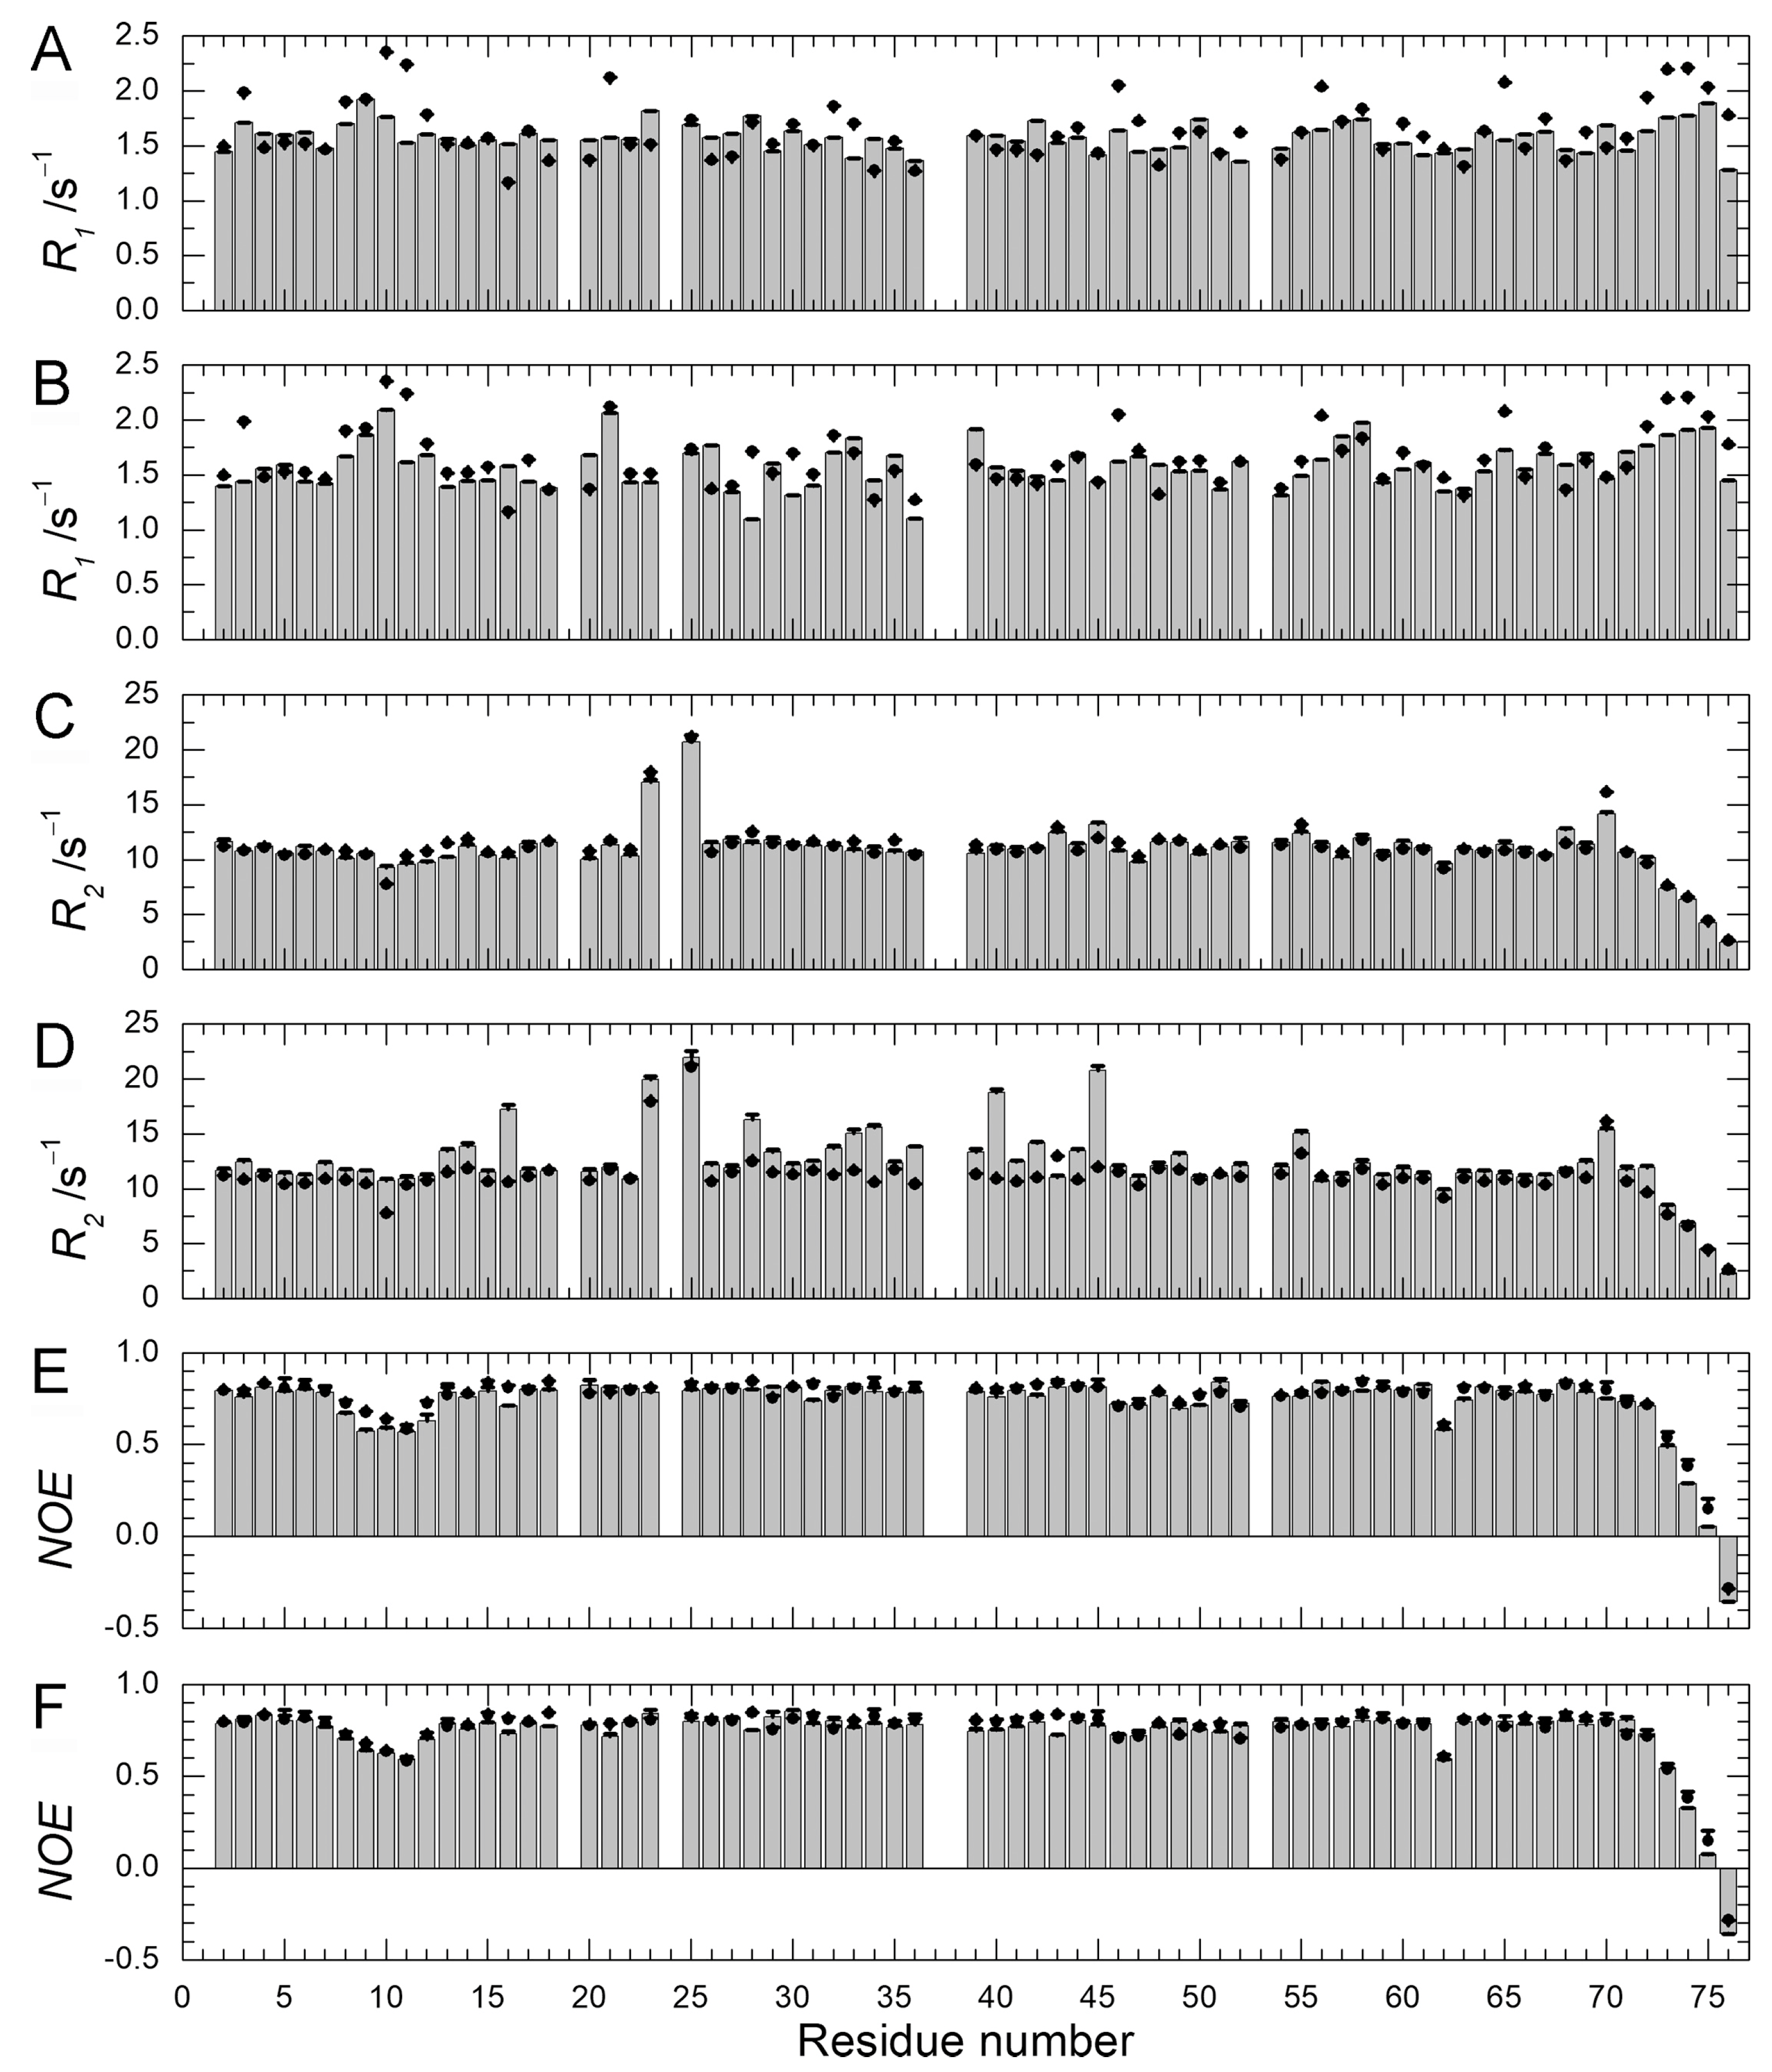
Figure 7.
The Gibbs free energy diagrams for the N1, N2, and unfolded (U) states of WT (left) and Q41N (right) ubiquitin at 298 K. ΔG between N1 and N2 for WT and Q41N at 298 K were obtained from the literature [22].
Figure 7.
The Gibbs free energy diagrams for the N1, N2, and unfolded (U) states of WT (left) and Q41N (right) ubiquitin at 298 K. ΔG between N1 and N2 for WT and Q41N at 298 K were obtained from the literature [22].


Table 1.
Carboxyl pKa values for wild-type ubiquitin.
| Residue | pKa a | pKa b |
|---|---|---|
| D21 | 2.98 ± 0.03 | 3.1 |
| D32 | 3.68 ± 0.03 | 3.8 |
| D39 | 3.52 ± 0.02 | 3.6 |
| D58 | 3.47 ± 0.02 | 3.7 |
| E34 | 4.16 ± 0.03 | 4.5 |
| E16 | 4.07 ± 0.02 | 3.9 |
| E18 | 4.26 ± 0.03 | 4.3 |
| E51 | 3.69 ± 0.02 | 3.8 |
| E64 | 4.26 ± 0.02 | 4.5 |
a 20 mM d–Tris HCl buffer at 298 K (7% D2O). b 100 mM KCl at 303 K (10% D2O) [27] (Reproduced with permission from American Chemical Society).
© 2017 by the authors. Licensee MDPI, Basel, Switzerland. This article is an open access article distributed under the terms and conditions of the Creative Commons Attribution (CC BY) license (http://creativecommons.org/licenses/by/4.0/).
Share and Cite
MDPI and ACS Style
Kitazawa, S.; Yagi-Utsumi, M.; Kato, K.; Kitahara, R. Interactions Controlling the Slow Dynamic Conformational Motions of Ubiquitin. Molecules 2017, 22, 1414. https://doi.org/10.3390/molecules22091414
AMA Style
Kitazawa S, Yagi-Utsumi M, Kato K, Kitahara R. Interactions Controlling the Slow Dynamic Conformational Motions of Ubiquitin. Molecules. 2017; 22(9):1414. https://doi.org/10.3390/molecules22091414
Chicago/Turabian StyleKitazawa, Soichiro, Maho Yagi-Utsumi, Koichi Kato, and Ryo Kitahara. 2017. "Interactions Controlling the Slow Dynamic Conformational Motions of Ubiquitin" Molecules 22, no. 9: 1414. https://doi.org/10.3390/molecules22091414