Article

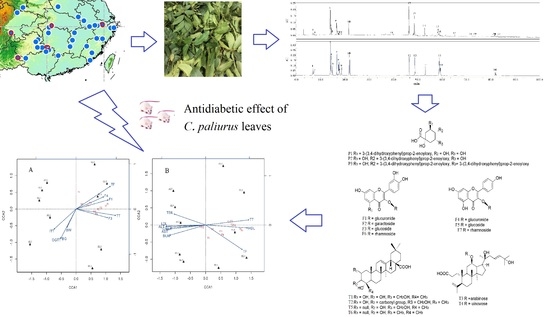
Antidiabetic Effect of Cyclocarya paliurus Leaves Depends on the Contents of Antihyperglycemic Flavonoids and Antihyperlipidemic Triterpenoids

1
College of Forestry, Nanjing Forestry University, Nanjing 210037, China
2
Co-Innovation Center for Sustainable Forestry in Southern China, Nanjing Forestry University, Nanjing 210037, China
3
Department of Forest and Conservation Sciences, University of British Columbia, 3041- 2424 Main Mall, Vancouver, BC V6T 1Z4, Canada
4
Department of Natural Medicinal Chemistry, China Pharmaceutical University, Nanjing 10009, China
*
Author to whom correspondence should be addressed.
Molecules 2018, 23(5), 1042; https://doi.org/10.3390/molecules23051042
Submission received: 16 April 2018 / Revised: 24 April 2018 / Accepted: 29 April 2018 / Published: 29 April 2018
(This article belongs to the Special Issue Medicinal Plants and Diabetes)

Abstract

:
Cyclocarya paliurus has been used commonly to treat diabetes in China. However, the effective components and the effect of plant origin remain unclear. In this study, C. paliurus leaves with different chemical compositions were selected from five geographical locations, and their effects on streptozotocin (STZ)-induced diabetic mice were evaluated with both ethanol and aqueous extracts. Glucose levels, lipid levels, and biomarkers of liver and kidney function were measured. The principal components of both C. paliurus ethanol and aqueous extracts from different geographical locations differed quantitatively and qualitatively. Results showed that C. paliurus extracts with better antihyperglycemic effects were characterized by higher contents of total flavonoids, especially quercetin-3-O-glucuronide and kaempferol-3-O-glucuronide. Furthermore, significantly negative correlations were found between triterpenoids contents and lipid levels. These results revealed the potential antihyperglycemic capacity of C. paliurus flavonoids and the antihyperlipidemic effect of C. paliurus triterpenoids. Thus, we suggest that the composition of C. paliurus compounds might help to design therapeutic alternatives for the treatment of diabetes mellitus. However, geographic origins and the extraction solvents can also affect the effectiveness of the treatment as these factors influence the chemical compositions and thereby the biological activities.

Graphical Abstract

1. Introduction

Diabetes mellitus (DM) is a serious chronic metabolic disease characterized by a high blood glucose level and changes in protein and lipid metabolism [1]. DM occurs worldwide and is one of the major causes of nontraumatic limb amputation, renal disease, and blindness, and the population of DM patients is increasing [2]. According to World Health Organization projections, more than 300 million people will be affected by DM in 2025 [3]. The current therapies for DM include oral anti-diabetic drugs, such as biguanides, sulfonylureas, thiazolidinediones, a-glucosidase inhibitors, dipeptidyl peptidase-4 inhibitors, etc., which are mainly used as monotherapy or in combination. However, these drugs present many undesired side effects, such as lactic acid intoxication and hypoglycemia, and ultimately cannot control the glycemic level [4]. Therefore, the search for safer and more effective phytochemical constituents from natural products for counteracting DM remains an active area. Nowadays, many antidiabetic components have been obtained from plants, including polysaccharides, flavonoids, terpenoids, saponins, unsaturated fatty acids, and alkaloids [5,6,7].
Cyclocarya paliurus (Batal) Iljinskaja belongs to the Juglandaceae family and is widely distributed in mountainous regions of sub-tropical China [8]. Leaves of this plant are traditionally used in China as an ingredient in nutraceutical tea or drug formulations for the treatment of hypertension, diabetes mellitus, and hyperliposis [9,10,11,12]. Previous studies have reported that C. paliurus leaves contain abundant bioactive components including polysaccharides, triterpenoids, flavonoids, and phenolic compounds [13,14,15]. Thus, chemical identification and the anti-diabetic effect of C. paliurus extracts have attracted the attention of many scholars, however the constituents responsible for anti-diabetic effect still remains controversial. For example, previous studies have revealed that the water extract of C. paliurus could reduce postprandial triglyceride level in hyperlipidemic mice, and predicted polysaccharides to be the active components [16,17]. Polysaccharides of C. paliurus are also found to exhibit a lipid-lowering effect on high-fat-diet-induced rats [18,19]. However, it is demonstrated that polysaccharides did not appear to be the active anti-diabetic constituent, based on the comparison of anti-diabetic effects of C. paliurus ethanol extract (without polysaccharides) and aqueous extract in streptozotocin (STZ)-induced diabetic rats [20]. In addition, several studies have shown that triterpenic acid-enriched C. paliurus fraction or extracts possess better antihyperlipidemic activities in mice fed with high-fat-diet [21,22,23]. Thus, further investigation of the anti-diabetic activities of C. paliurus extracts with detailed component information is required.
To fill the knowledge gap mentioned above, in this study, C. paliurus leaves with different chemical compositions were selected from five geographical locations and their effects on streptozotocin (STZ)-induced diabetic mice were evaluated with both ethanol and aqueous extracts. Principal components analysis (PCA) and canonical correspondence analysis (CCA) were used to analyze the chemical variability and its relationship with anti-diabetic activities. The potential antihyperglycemic capacity of C. paliurus flavonoids and the antihyperlipidemic effect of C. paliurus triterpenoids were revealed. Taken together, this study provides essential information supporting the use of C. paliurus extract as a natural medicine for diabetic patients.

2. Results and Discussion

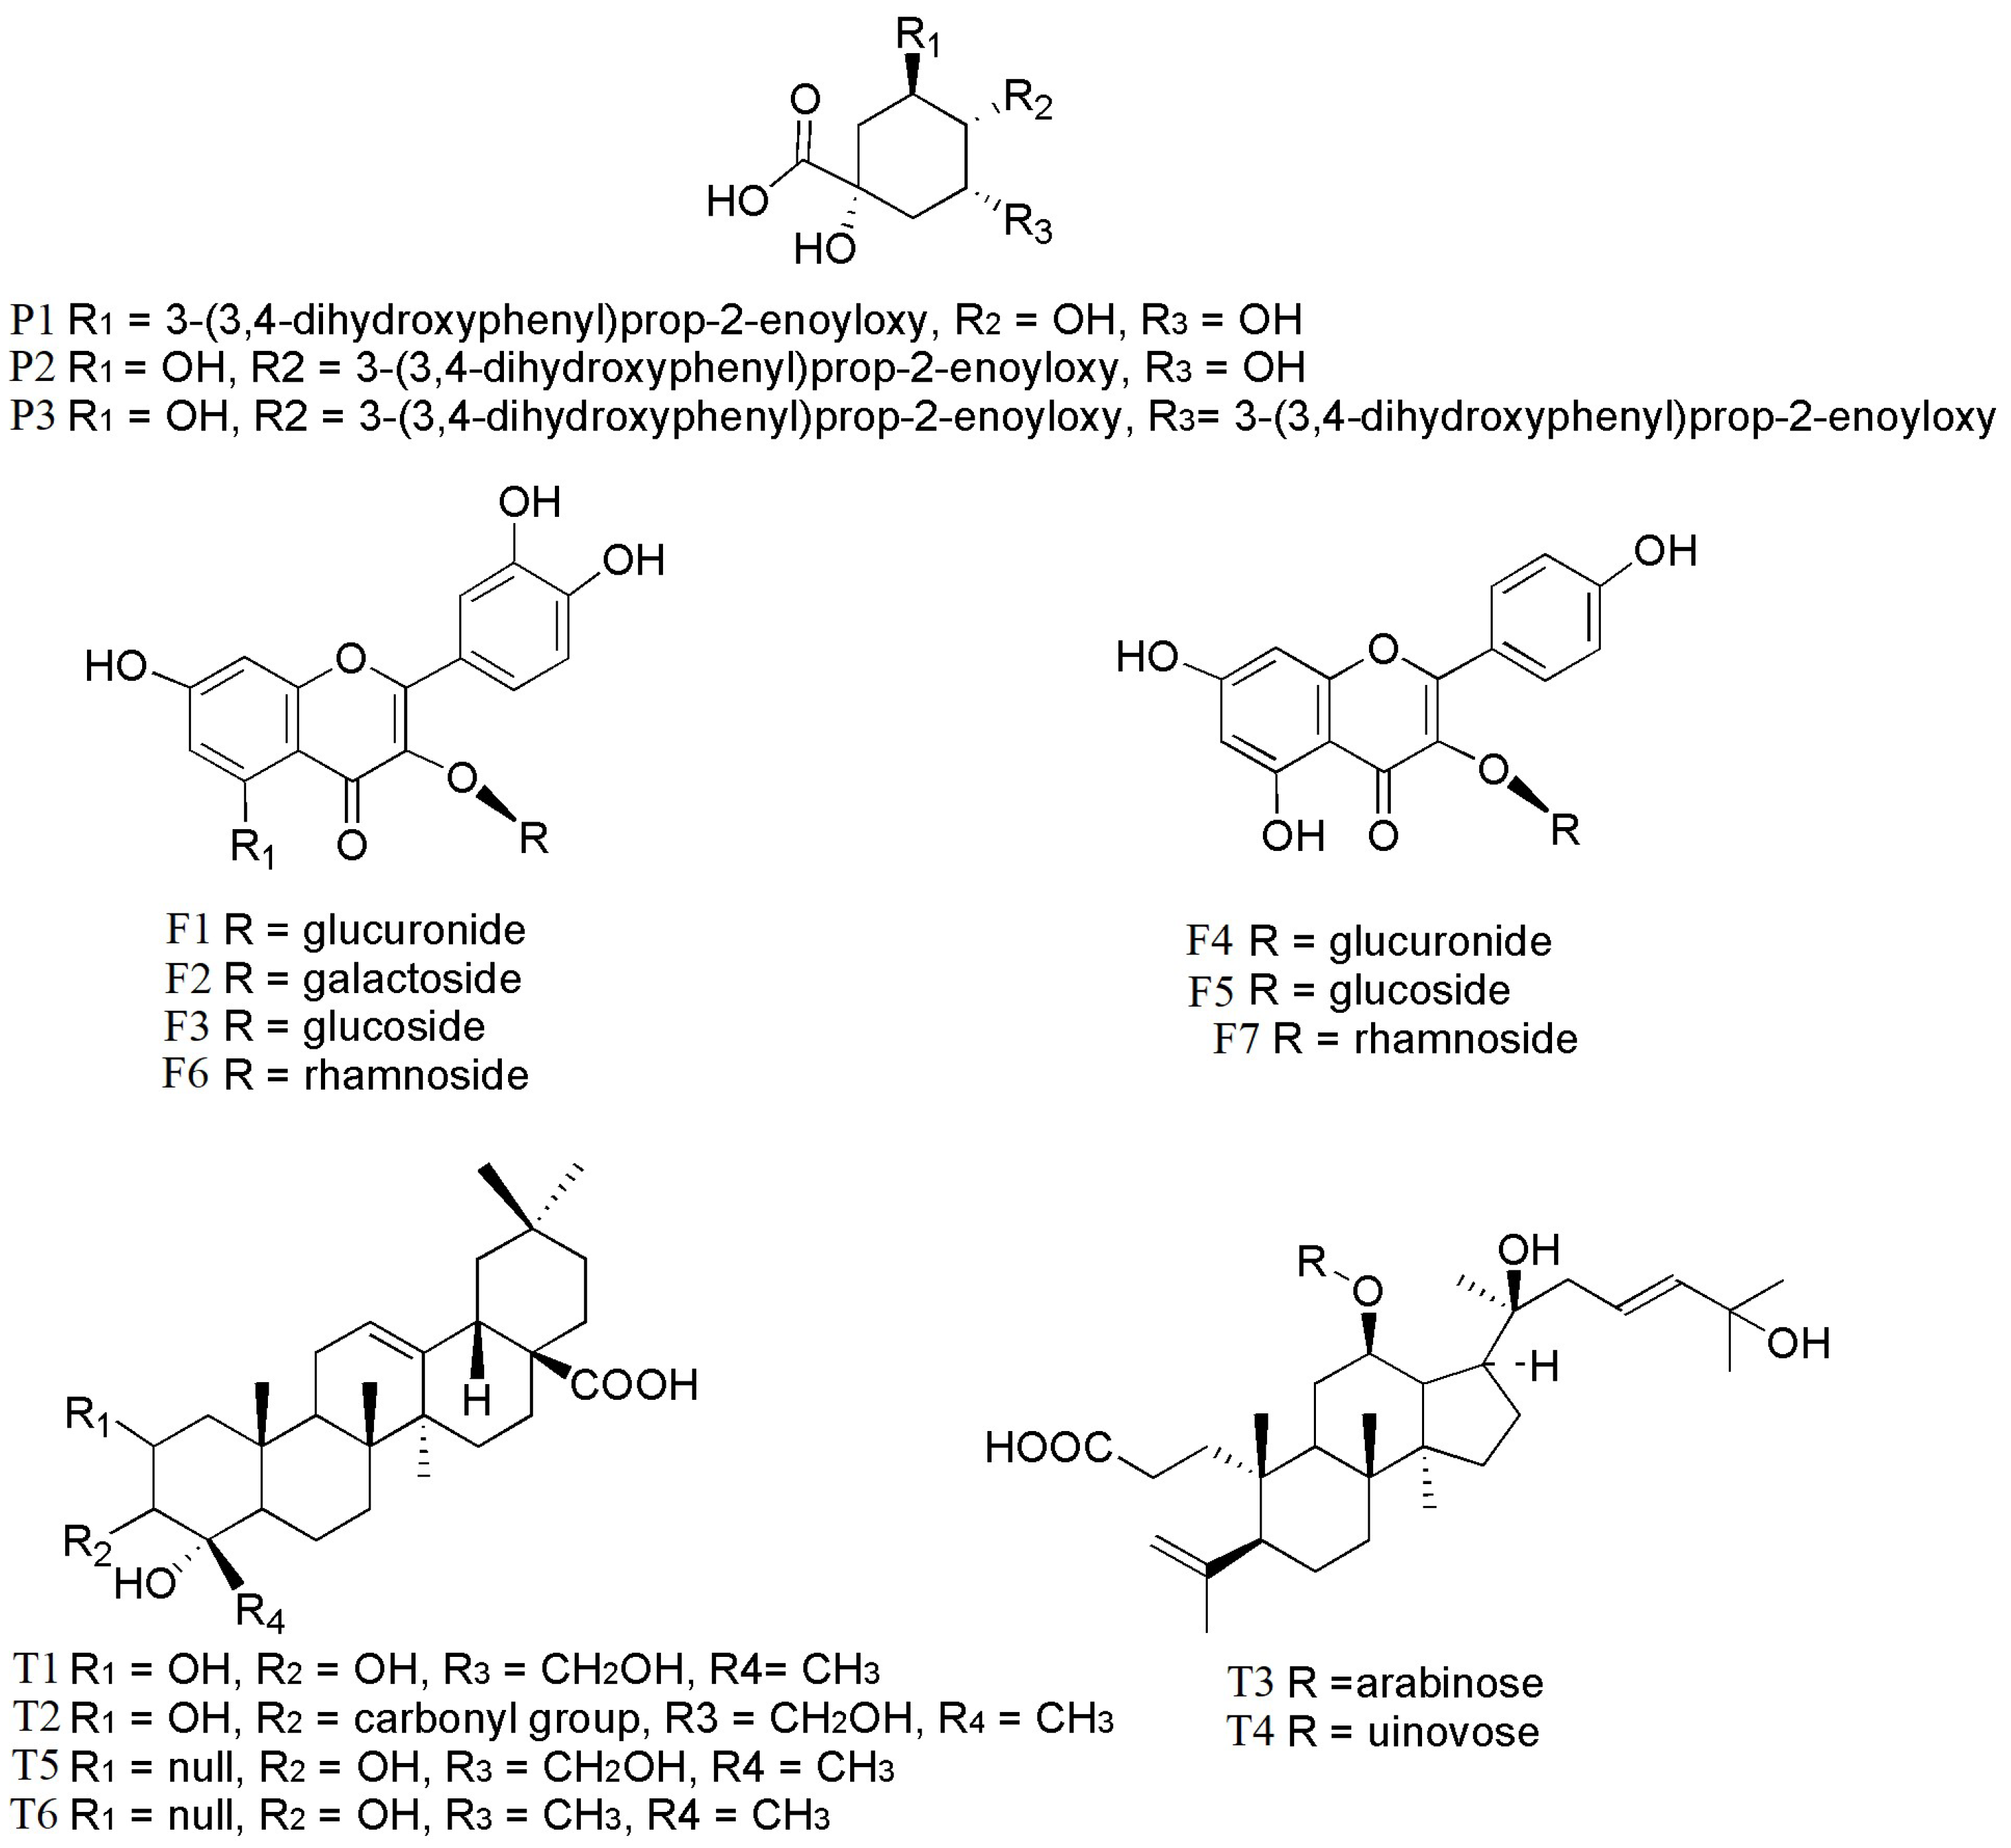
2.1. Chemical Compositions

In order to have an idea about the compounds responsible for the anti-diabetic activities, phytochemical compositions of the extracts studied were clarified by using both qualitative and quantitative analyses. In total, 17 components, including polysaccharides, three phenolic acids, seven flavonoids, and six triterpenoids, were identified in ethanol and aqueous extracts of C. paliurus leaves from different geographical locations (Table 1; Figure 1). The major components were: 3-O-caffeoylquinic acid (P1, 0.04–1.38 mg/g), quercetin-3-O-glucuronide (F1, 0.30–2.38 mg/g), kaempferol-3-O-glucuronide (F4, 0.17–1.88 mg/g), kaempferol-3-O-rhamnoside (F7, 0.05–2.30 mg/g), arjunolic acid (T1, 0.02–2.70 mg/g), cyclocaric acid B (T2, 0.04–0.98 mg/g), pterocaryoside B (T3, 0.01–2.46 mg/g), and pterocaryoside A (T4, 1.07–2.48 mg/g). These results were comparable to those reported in our previous study [24]. The ethanol extracts from different locations were abundant in phenolic acids, flavonoids, and triterpenoids, but absent in polysaccharides. In contrast, aqueous extracts from different locations were observed abundant in polysaccharides, but absent in 4,5-di-O-Caffeoylquinic acid, pterocaryoside B, pterocaryoside A, and hederagenin.
Results showed that chemical compositions of C. paliurus extracts varied significantly among the geographical locations (Table 1). The highest contents of total phenolic acids, total flavonoids, and total triterpenoids (1.57 mg/g, 6.88 mg/g, 8.15 mg/g) were observed from C. paliurus ethanol extract of Muchuan, Jinzhongshan, and Wufeng, respectively, while the lowest (0.06 mg/g, 0.52 mg/g, 0.05 mg/g) were all observed from C. paliurus aqueous extract of Anji. PCA results for the ethanol extracts indicated that the first principal component was corresponding to cyclocaric acid B (EL1), 3-O-caffeoylquinic acid (EL2), 4,5-di-O-caffeoylquinic acid, kaempferol-3-O-glucuronide, arjunolic acid, cyclocaric acid B, hederagenin, oleanolic acid (EL3), and pterocaryoside B, pterocaryoside A (EL5) (Figure 2A), while for the aqueous extracts, the first component was associated with isoquercitrin (AL2), and polysaccharides, 4-O-caffeoylquinic acid, kaempferol-3-O-glucuronide (AL3) (Figure 2B). PCA results in our study confirmed that geographic variation and extraction solvents influenced the bioactive components in both quantitative and qualitative extents [24,25].

2.2. Variation in Anti-Diabetic Properties

Streptozotocin (STZ) is a compound commonly used to induce diabetes in animal models, which could induce severe damage to the β-cells and then exhibit diabetes symptoms such as hyperglycemia and glucose intolerance [26]. In our experiment, the mice were injected intraperitoneally at a dose of 40 mg per kg per day STZ for five consecutive days (n = 6). Mice injected with STZ have been commonly used as models to study the antihyperglycemic and antihyperlipidemic effects of plant extracts on mammals, such as grape skin extract (n = 8), Boswellia serrata (n = 4), and peony seed oil (n = 7) [27,28,29]. In our study, the administration of C. paliurus extracts to STZ-induced diabetic mice was used to investigate the effects on various parameters, including body weight change, fasting blood glucose level (FBG), oral glucose tolerance test (OGTT), insulin tolerance test (ITT), lipid level, and liver and kidney function, compared with the diabetic control (DC) group, non-diabetic control (NC) group, and positive control (Metformin Hydrochloride Tablets, MHT; Xiaoke Pill, XKP) groups.

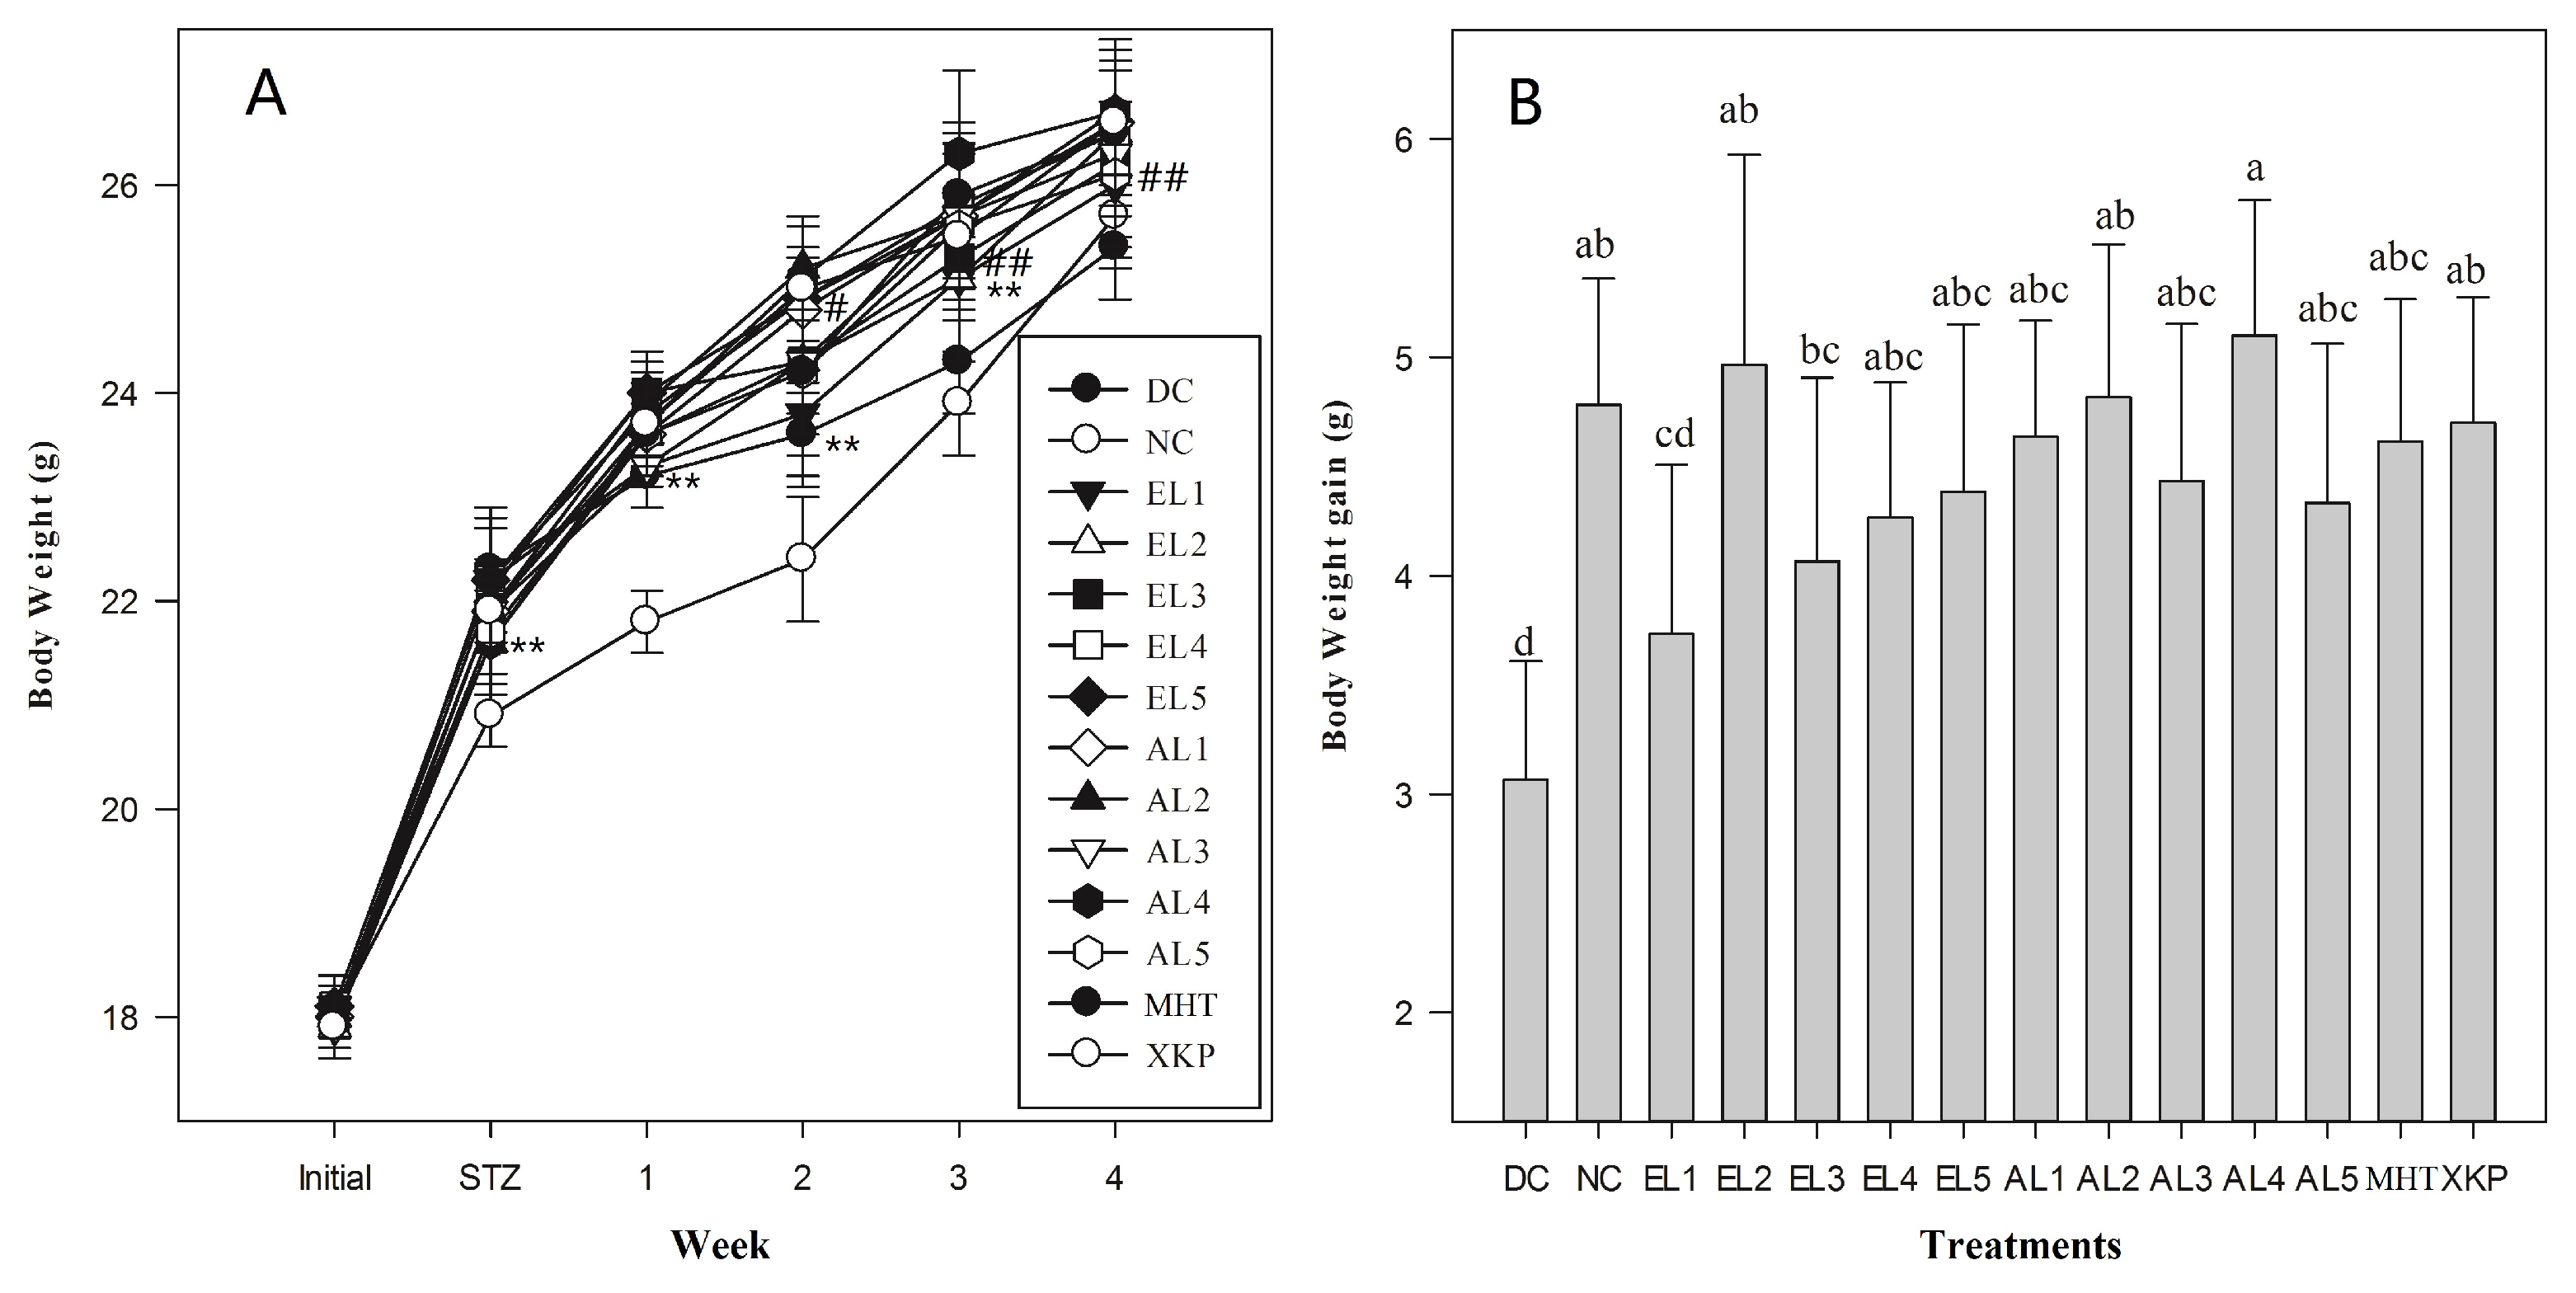
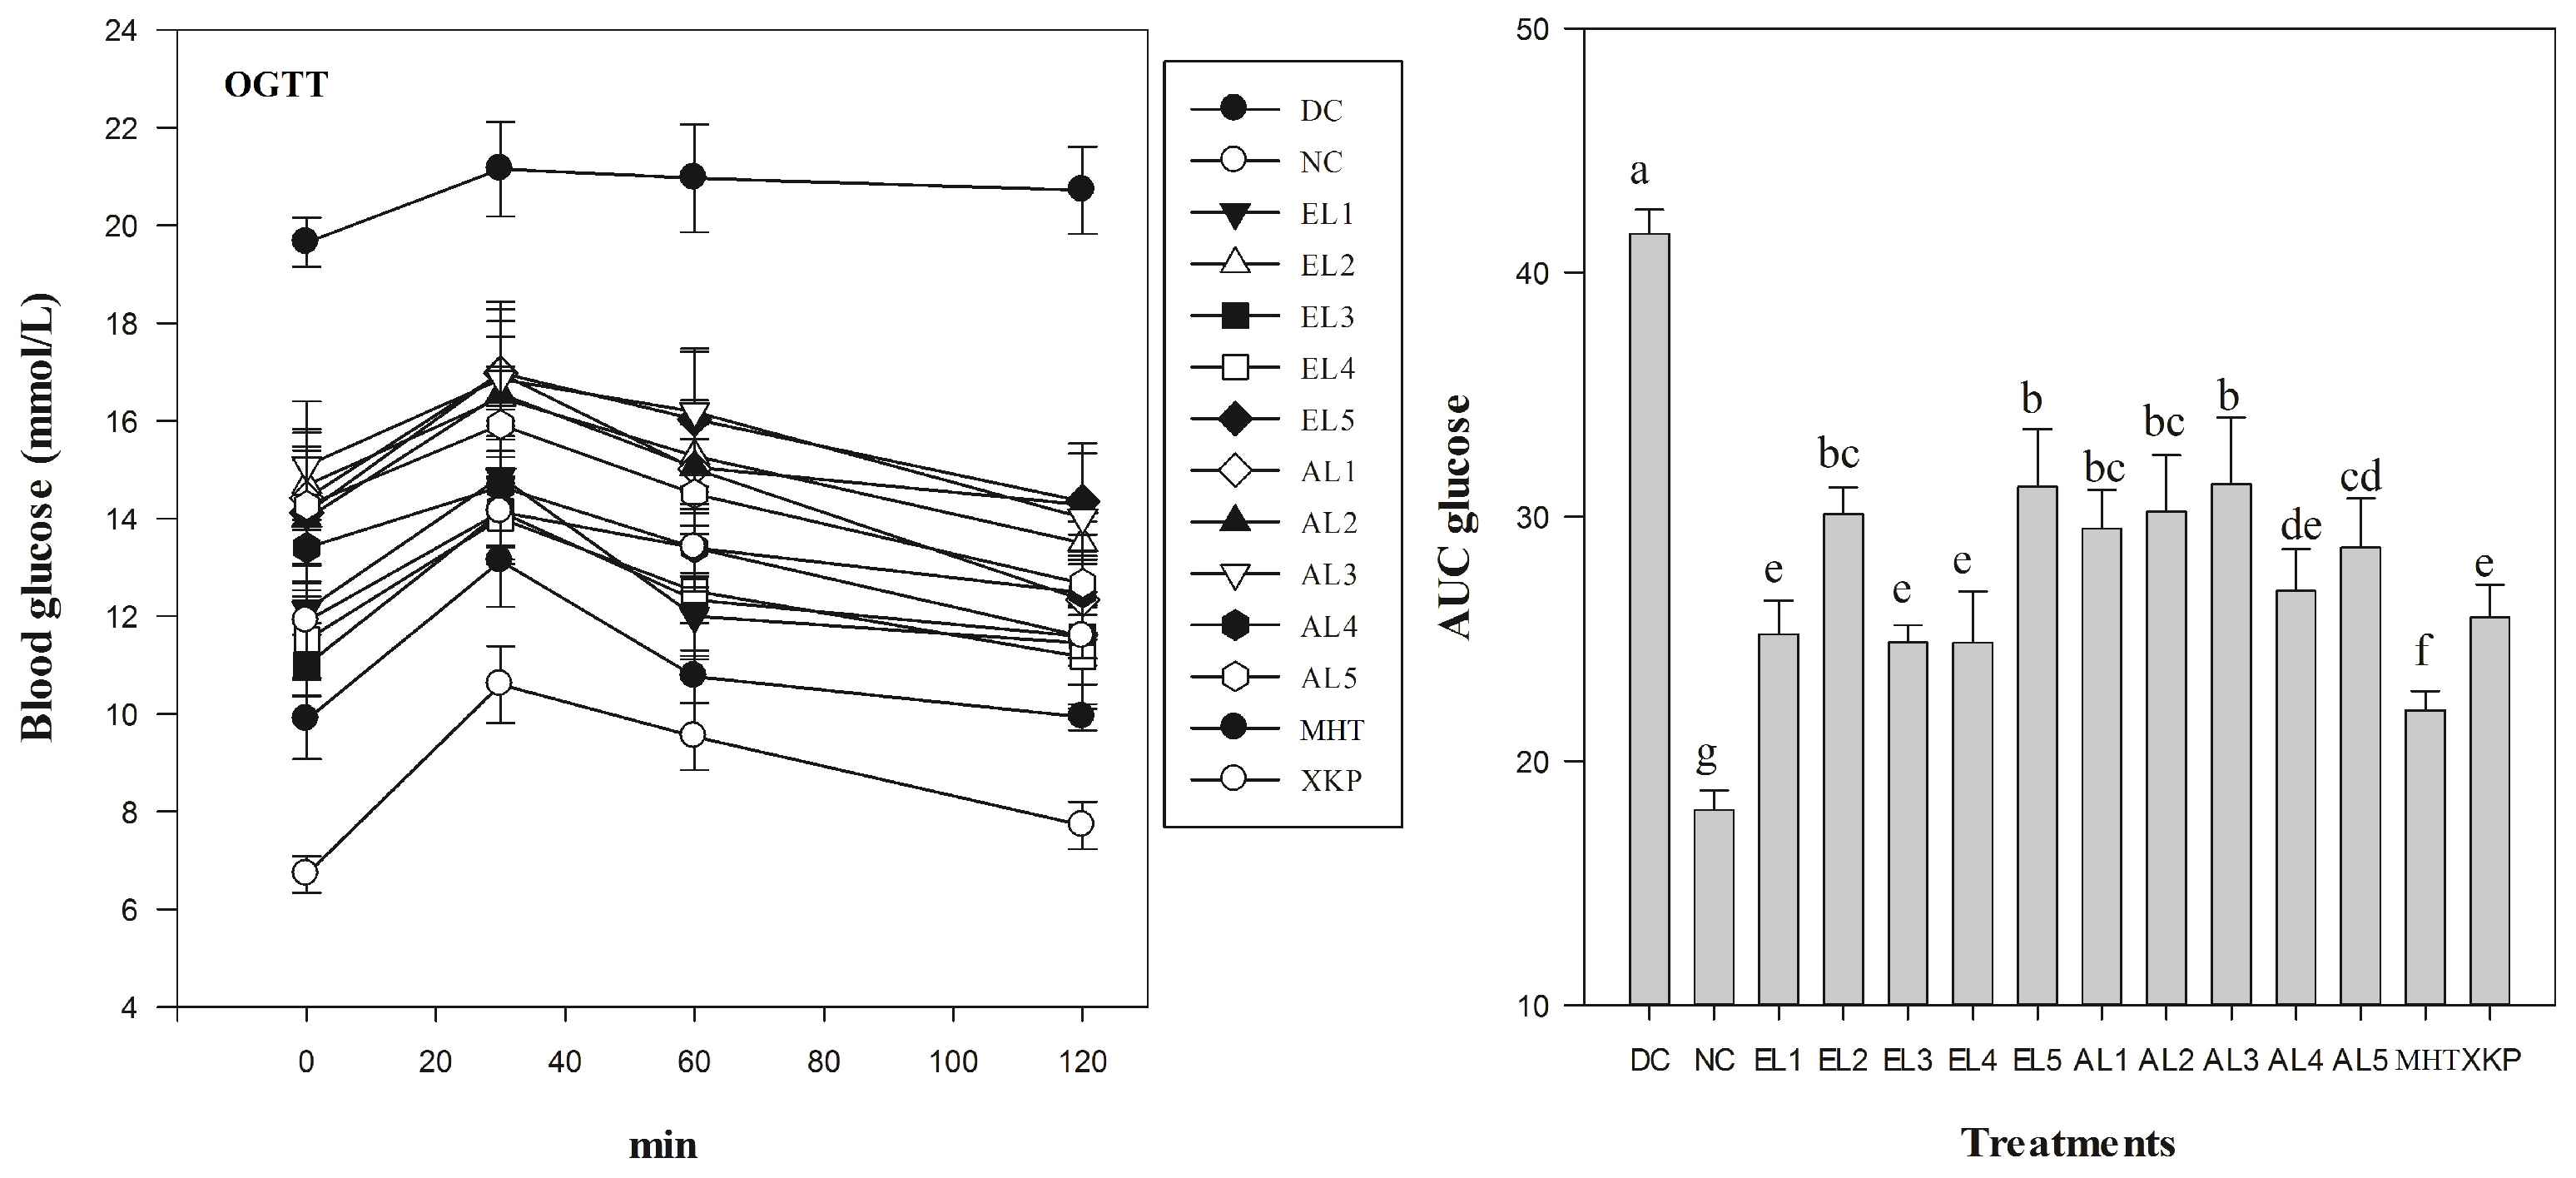
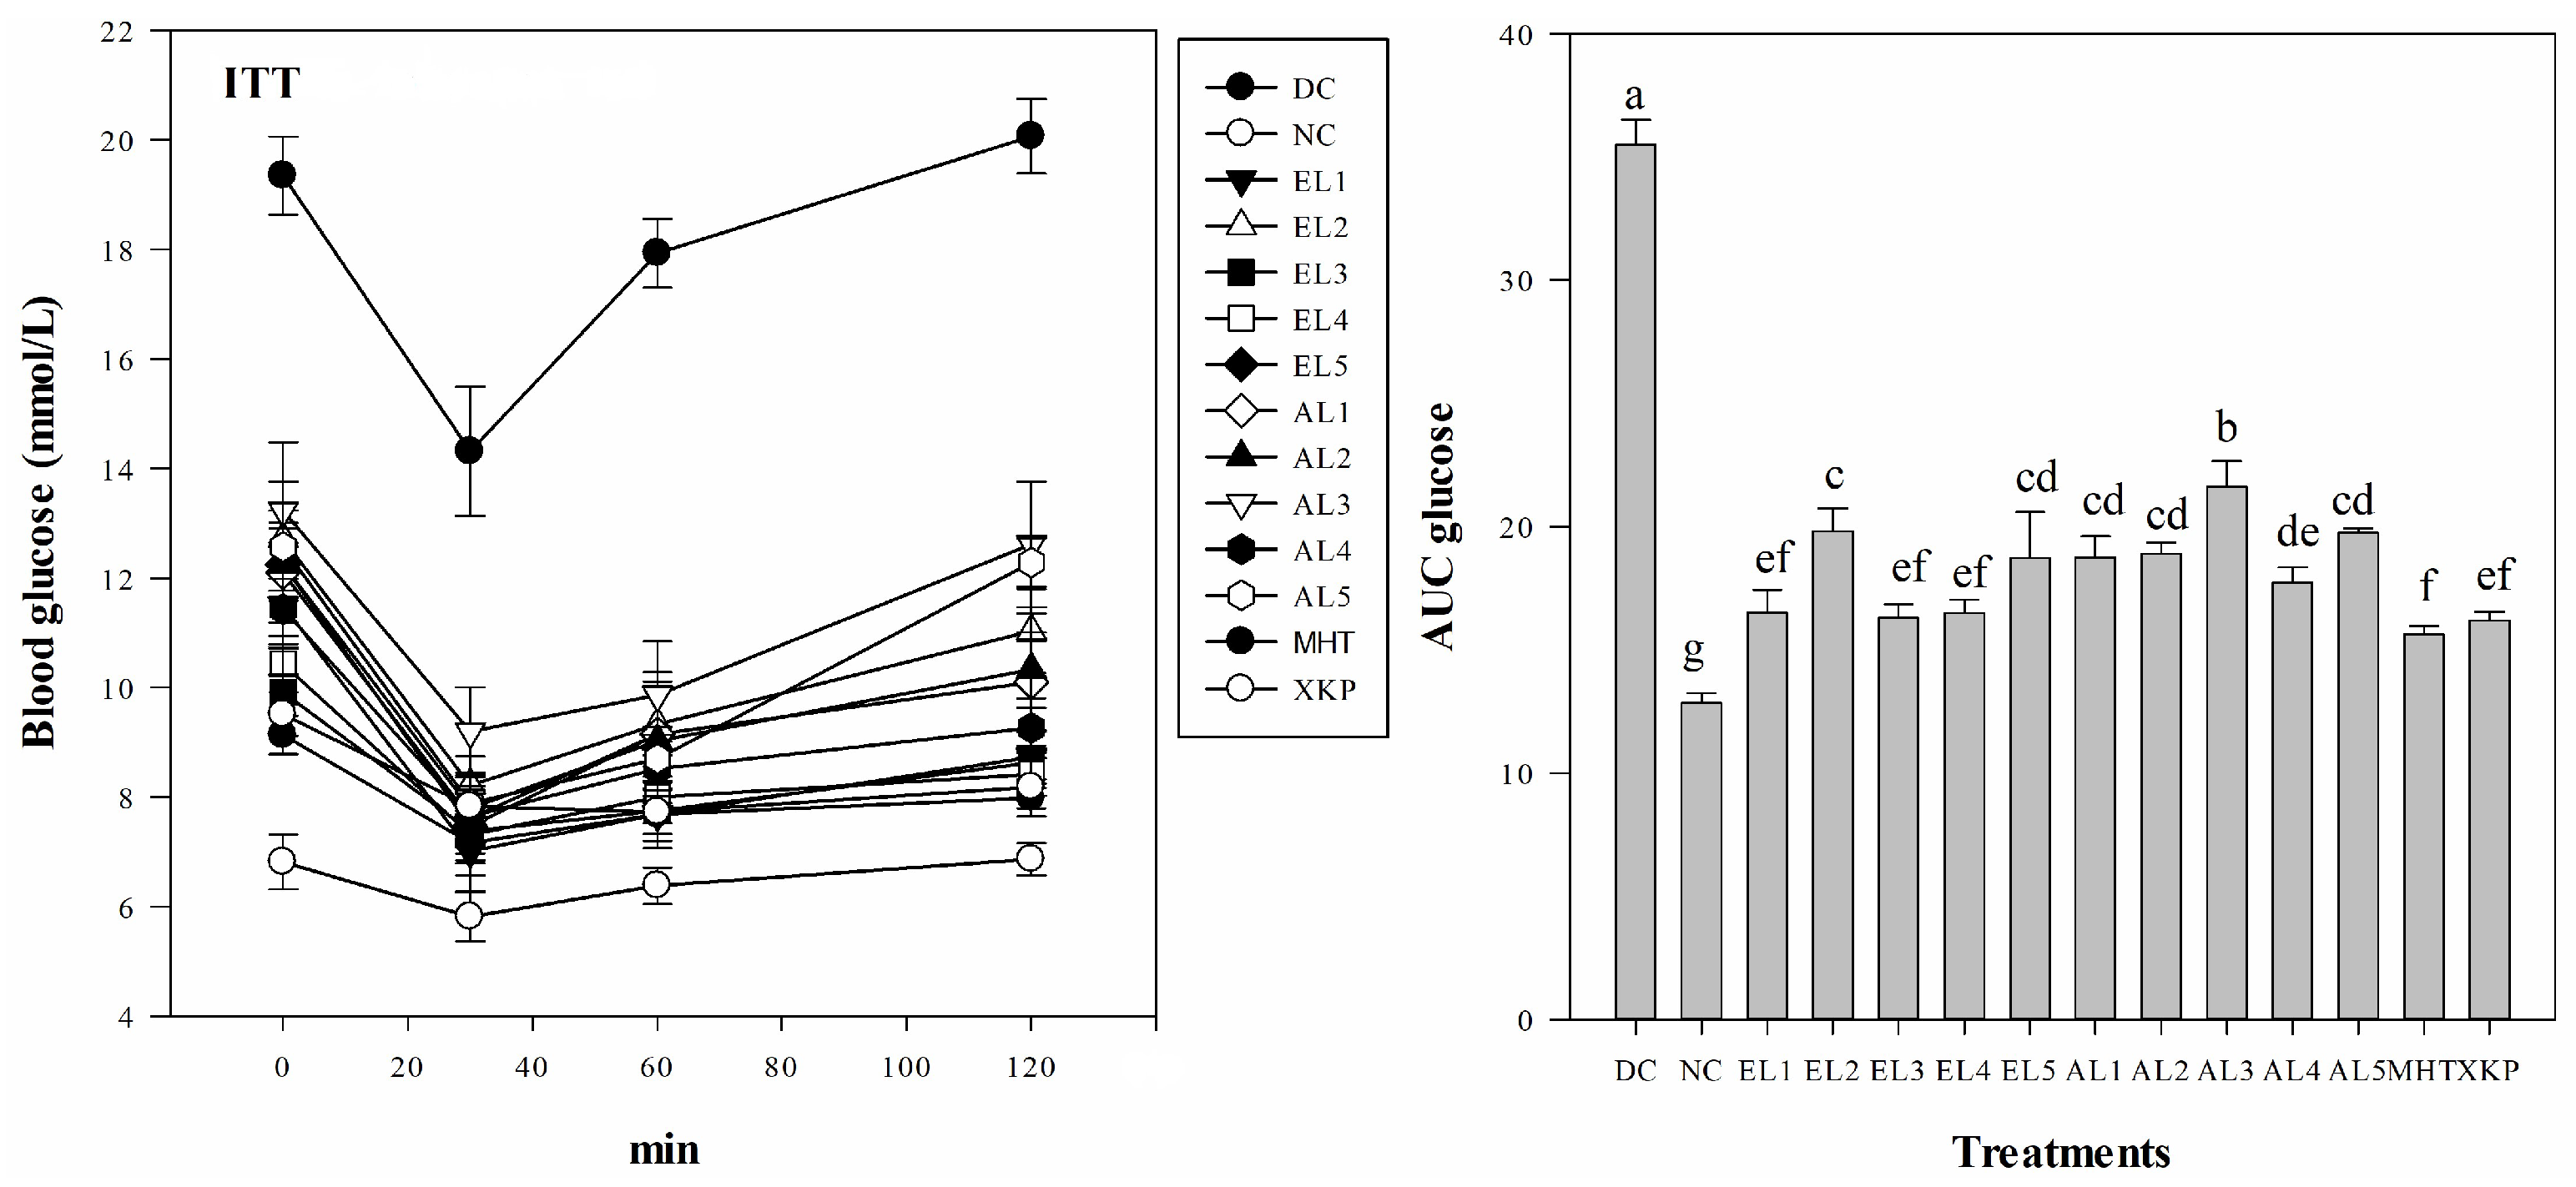
2.2.1. Variation in Body Weight, FBG, OGTT, and ITT

Results suggested that both C. paliurus ethanol and aqueous extracts were beneficial to reverse body weight loss and to reduce glucose levels in FBG, OGTT, and ITT tests of STZ-induced diabetic mice, however it differed significantly among different groups (Figure 3, Figure 4 and Figure 5). After five days of STZ injection, the blood glucose level of FBG in all treated groups were significantly increased in comparison to those in the NC group (p < 0.05), which is consistent with previous studies on STZ-induced diabetic model for other plant extracts [29]. After administration with C. paliurus extracts or MHT, XKP for one week, a positive effect on FBG in STZ-induced diabetic mice were observed (Table 2). FBG final values of different treatments differed significantly (p < 0.05), and the lowest value of FBG was observed at EL3 treatment (9.8 mmol /L) (Table 2). The blood glucose level of OGTT in the DC group was significantly higher than that of the NC group (p < 0.01) (Figure 4), indicating that the glucose tolerance of the STZ-induced diabetic mice was severely impaired. The area under the curve (AUC) for OGTT of C. paliurus extracts differed and was significantly less in the presence of EL1 (25.1), EL3, and EL4 (24.9), which was comparable with that of XKP positive group (p < 0.05) (Figure 4). AUC of ITT (Figure 5) showed a similar pattern with OGTT, which indicated that EL1, EL3, and EL4 treatments had better antihyperglycemic effects on STZ-induced diabetic mice.
These results may be due to the higher contents of total flavonoids (TF), especially quercetin-3-O-glucuronide (F1), and kaempferol-3-O-glucuronide (F4) found in the ethanol extract at these locations, which was confirmed by the significantly negative correlations between flavonoids contents and glucose levels (FBG, OGTT, and ITT) in the CCA test (Figure 6A). To our best knowledge, our study is the first to reveal the potential antihyperglycemic effects of flavonoid glycosides of this species. Antihyperglycemic effects of kaempferol and quercetin from other plants have been reported. For example, it was reported that supplementation of kaempferol and quercetin isolated from Euonymus alatus (Celastraceae) could prevent the development of diabetes mellitus in experimental animals [30]. Their results proved that kaempferol and quercetin significantly improved insulin-stimulated glucose uptake in mature 3T3-L1 adipocytes, and they also served as partial agonists in a peroxisome proliferator-activated receptor gamma (PPAR-g) reporter gene assay [30]. Quercetin has also been reported to accelerate the function of insulin receptor and glucose transporter 4 (GLUT 4) which in turn lead to elevated glucose uptake [31]. Thus, further analysis of the antihyperglycemic effect of kaempferol or quercetin glycosides from C. paliurus is needed.

2.2.2. Variation in Lipid Levels

The undesired elevation of the serum lipids observed in the DC mice of this study indicated that STZ could induce the lipid abnormalities. The protective effect of plant extracts on diabetes was related to their hypolipidemic effects [32]. The administration of EL1-EL5, AL1-AL5, and MHT, XKP reversed the level of lipids significantly (p < 0.05). The lowest values of total cholesterol (TC) and low-density lipoprotein cholesterol (LDL-c) for C. paliurus extracts were observed in the EL3 group, while the highest values were found in the AL4 group (Table 3). Our results confirmed that C. paliurus ethanol extracts with higher contents of total triterpenoids had a better effect on the lipid levels in STZ-induced diabetic mice (Table 3), which was in consistence with previous studies [21,22,23]. CCA results also indicated that C. paliurus ethanol extracts from L2, L3, and L4 with significantly lower lipid levels were characterized by total triterpenoids (TT), isoquercitrin (F3), cyclocaric acid B (T2), and oleanolic acid (T6) (Figure 6B). Thus, the cholesterol-lowering effect of C. paliurus extracts was possibly due to the ability of C. paliurus triterpenoids (cyclocaric acid B and oleanolic acid) to decrease the serum level of apolipoprotein B48 and the expression of tumour necrosis factor (TNF-a) [21,22,23]. Cyclocaric acid B, a unique constituent detected from C. paliurus leaves, has been reported to have the ability to decrease the apolipoprotein B48 oversecretion in Caco-2 cells [15,23]. In addition, oleanolic acid has been shown to increase the HDL-C level and decrease the atherogenic lipid level [33]. However, whether C. paliurus triterpenoids works alone or together with other compounds needs to be further studied in the hyperlipidaemic animal models.

2.2.3. Variation in Liver and Kidney Function

Liver and kidney are the key organs in the body involved in almost all biochemical pathways related to nutrient supply, growth, energy provision, fighting diseases, reproduction, and regulating homeostasis [34,35]. Reliable biomarkers to evaluate the liver and kidney function were shown in Table 4, including the activities of aspartate aminotransferase (AST) and alanine aminotransferase (ALT), serum blood urea nitrogen (BUN), creatinine (CREA), and total bilirubin (TBIL). Liver and kidney were found to be necrotized in STZ-induced diabetic mice, and a significant increase in the activities of AST and ALT, and TBIL, CREA, and BUN were observed (Table 4). However, treatments with EL1-EL5, AL1-AL5, and MHT, XKP resulted in a significant decrease in the activities of AST and ALT, serum TBIL, CREA, and BUN compared to the DC group (p < 0.05). Values of these biomarkers differed significantly among C. paliurus extracts studied (p < 0.05). The lowest values of AST (35.1 U/L), ALT (94.5 U/L), and CREA (18.2 μmol/L) for C. paliurus extracts were observed in the EL3 group, while the lowest values of TBIL (1.02 μmol/L) and BUN (11.0 mmol/L) were found in the EL2 and EL4 group, respectively (Table 4).
The development of diabetes often leads to the leakage of the circulatory system, and high levels of AST, ALT, TBIL, CREA, and BUN were often observed in STZ-induced diabetic mice [36,37], which is in agreement with our results (Table 4). Results indicated that C. paliurus extracts improved the liver and kidney function by decreasing the serum AST, ALT, and TBIL, CREA, and BUN levels in the diabetic mice. Moreover, significantly positive correlations were found between the values of AST, ALT, CREA, BUN, and lipid index (TC, TG, and LDL-c) (Figure 6B), which is in agreement with other reports in hyperlipidemic mice [38,39]. Overall, these results suggested that C. paliurus extracts could offer protection to liver and kidney by effectively lowering the lipid level. These findings, together with evidence collected from previous reports suggest that the composition of C. paliurus compounds might help for the design of therapeutic alternatives for the treatment of diabetes mellitus. However, geographic origins and the extraction solvents can also affect the effectiveness of the treatment as these factors influence the chemical compositions and their antihyperglycemic and antihyperlipidemic activities.

3. Materials and Methods

3.1. Plant Materials

Five geographical locations from five provinces in China for C. paliurus sampling were identified based on the major distribution of the species. Voucher specimens were deposited in Silviculture Lab of Nanjing Forestry University (Voucher code: 2011GX, 2011SC, 2011HB, 2011ZJ, 2011HN). The detailed geographic, climatic information, and soil index of the sample locations are listed in Table 5. Leaf samples were collected from each location in September 2014. At each location, 6–30 trees (generally dominant or co-dominant tree in the stand) were selected based on tree age (over 20 years-old), stem form, and growth vigor. Number of trees for collecting leaves for each location was determined according to quantity and stand area of C. paliurus which distributed on the area (about 10 % of the total). About 400 g fresh fully developed leaves were collected from the middle crown for each tree and then sealed up with silica gel for transportation. Leaves collected in each location were mixed together in the lab and then dried at 70 °C for 48 h to constant weight, and ground into fine powder before extraction. All samples were stored at room temperature prior to analysis.

3.2. Chemical Reagents and References

Streptozotocin (STZ) was purchased from Sigma Chemical Co. (St. Louis, MO, USA). Metformin Hydrochloride Tablets (MHT) was bought from Sino-American Shanghai Squibb Pharma (Shanghai, China), and Xiaoke Pill (XKP) from Guangzhou Zhongyi Pharmaceutical Enterprise (Guangdong, China). Commercial test kits used for measuring TG, TC, LDL-c, HDL-c, BUN, CREA, TBIL, AST, and ALT were purchased from Jiancheng Institute of Biotechnology (Nanjing, China). The reference standards of 3-O-caffeoylquinic acid, 4-O-caffeoylquinic acid, isoquercitrin, 4,5-di-O-caffeoylquinic acid, kaempferol-3-O-glucuronide, quercetin-3-O-glucuronide, arjunolic acid, quercetin-3-O-rhamnoside, quercetin-3-O-galactoside, and kaempferol-3-O-glucoside (purity >98%) were purchased from BioBioPha Co., Ltd. (Kunming, China), and arjunolic acid, oleanolic acid (purity >98%) were purchased from Shanghai Yuanye Biotechnology Co., Ltd. (Shanghai, China), whereas cyclocaric acid B, kaempferol-3-O-rhamnoside, and pterocaryoside A and pterocaryoside B (purity >98%) were isolated and purified from the laboratory of China Pharmaceutical University (Nanjing, China) [24].

3.3. Preparation of Ethanol and Aqueous Extracts

The leaf powder (about 75g) from each location was extracted with 80% ethanol (1 L) and distilled water (1 L), respectively, and then incubated in a water bath at 90 °C for 2 h. Bottles containing samples were shaken on a shaker at room temperature for 15 min. After centrifugation at 8000 g for 15 min, the supernatant was transferred into a new bottle. Supernatants were then concentrated at 40 °C to yield an 80% ethanol or aqueous extract. The samples (L1L5) extracted with 80% ethanol were named EL1 (36.5g, 48.7% yield), EL2 (37.6g, 50.1% yield), EL3 (36.8g, 49.1% yield), EL4 (36.1g, 48.1% yield), and EL5 (36.4g, 48.5% yield), while the samples (L1L5) extracted with distilled water were named AL1 (42.1g, 56.1% yield), AL2 (39.8g, 53.1% yield), AL3 (40.9g, 54.5% yield), AL4 (43.5g, 58.0% yield), and AL5 (40.2g, 53.6% yield), respectively. All extracts were stored at 4 °C before chemical analysis and animal test.

3.4. Determination of Chemical Compositions

Polysaccharide contents of the extracts were determined by the phenol-sulfuric acid method using d-glucose as a standard [40]. Phenolic acids, flavonoids, and triterpenoids profiles of the extracts were analyzed using an HPLC system, as described in our previous study [24]. Briefly, the extracts were filtered through a 0.22 μm polytetrafluoroethylene (PTFE) filter, then analyzed using a Waters e2695 Alliance (Waters Corp., Milford, MA, USA) equipped with Waters 2695 separation unit (an auto sampler, an online degasser, a quaternary pump solvent management system, a gasket cleaning system and a column heater), an Empower 3 data processing system and a Waters 2489 ultraviolet detector (UVD). Chromatographic separation was carried out on an X-Bridge C18 column of 250 × 4.6 mm packed with 5 μm particles by a stepwise elution with water containing 0.01% (v/v) formic acid (solution A) and acetonitrile containing 0.01% (v/v) formic acid (solution B). The gradient program was as follows: 0–13 min ratio of solution A to solution B 92:8 (v/v), 13-28 min 81:19, 28-42 min 79:21, 42–60 min 50:50, 60–64 min 55:45, 64–74 min 44:56, 74–90 min 34:66, 90–95 min 15:85, and 95–100 min 0:100. The flow rate was 1.0 mL/min, the injection volume was 10 μL, and the column temperature was 45 °C. The wavelength of monitor was set at 205 nm. Contents of individual phenolic acids, flavonoids, and triterpenoids were quantified on the basis of their external standards. Total phenolic acids (TP), total flavonoids (TF) and total triterpenoids (TT) were the sum of their individuals, respectively.

3.5. Animals and Experimental Design

C57BL/6 mice (male, weighing 17.9–18.1 g, certificate No. SCXK (HU) 2013-0018) were purchased from Shanghai Lingchang Biotechnology Corporation and housed under controlled temperature (22 ± 2 °C) and humidity (55% ± 5%). Animals were supplied with water and food in accordance with guidelines and policy set forth by the Chinese Experimental Animals Administration Legislation (Ethical Protocol# SL-008-01). Mice of non-diabetic control (NC) were fed with a basal control diet. While for the development of diabetes, mice were fed with high fat diet (HFD), consisting of 20% carbohydrate, 3% egg, 18% fat, and 59% basic diet (w/w) [41]. Six weeks later, mice fed with high fat diet (HFD) were injected intraperitoneally with a dose of 40 mg/kg streptozotocin (STZ) incitrate buffer (pH = 4.5) for five consecutive days. The blood samples were collected and mice with blood glucose > 14 mmol/L were used for anti-diabetic study. The samples were tested for anti-diabetic activity at a concentration of 8 g/kg/day with a basal control diet for four weeks, based on our previous study [20]. MHT and XKP were used as positive controls, while distilled water was used as a negative one.
Animals were divided in 14 groups of 6 mice each as follow:
Group 1: diabetic control (DC), STZ-induced diabetic mice treated with 10 mL distilled water per kg body weight once a day.
Group 2: non-diabetic control (NC), normal mice treated with 10 mL distilled water per kg body weight once a day.
Group 3, 4, 5, 6, 7: STZ-induced diabetic mice treated with 8 g per kg body weight of EL1–EL5 once a day, respectively.
Group 8, 9, 10, 11, 12: STZ-induced diabetic mice treated with 8 g per kg body weight of AL1–AL5 once a day, respectively.
Group 13: STZ-induced diabetic mice treated with 250 mg per kg body weight of Metformin Hydrochloride Tablets (MHT) once a day.
Group 14: STZ-induced diabetic mice treated with 1.73 g per kg body weight of Xiaoke Pill (XKP) once a day [20].

3.6. Body Weight and Fasting Blood Glucose Level (FBG)

Body weight and FBG level of all the animal groups were determined weekly after treatment. Body weight gain was calculated from the equation: Body weight gain = BW28day–BW0day, where BW28day is value of body weight after 28-days’ treatment and BW0day is the initial body weight after STZ injected. Tail vein blood was collected weekly and concentrations of glucose were determined with glucose kits.

3.7. Oral Glucose Tolerance Test (OGTT) and Insulin Tolerance Test (ITT)

OGTT of each group was performed on the 28th day of the treatment, according to the reported method [20]. Animals of each group were administered glucose (2.5 g/kg, i.g.) before test. The blood samples were collected from the orbital venous plexus just before glucose load (0 min) and at 30, 60, and 120 min after glucose administration. ITT of each group was performed on the third day after OGTT, according to the previous method [20]. Animals of each group were administered insulin (1.0 U/kg, subcutaneous injection) before test. The blood samples were collected from the orbital venous plexus just before insulin administration (0 min), and at 30, 60, and 120 min after insulin administration. AUC of glucose concentrations over time was calculated by the trapezoidal rule.

3.8. Biochemical Analyses of the Serum Samples

The blood samples were collected from abdominal aortic at the end of animal trial and centrifuged immediately for 5 min at 12,000 g at 4 °C to obtain serum for biochemical analysis. TG, TC, LDL-c, and HDL-c were measured using commercially available kits according to the manufacturer's directions.

3.9. Liver and Kidney Function

Upon the end of the animal trial, indexes of liver and kidney function were measured at the same time of biochemical analyses of the serum samples. BUN, TBIL, AST, and ALT were measured using commercially available kits according to the manufacturer's directions.

3.10. Statistical Analysis

Chemical variability and anti-diabetic activities of C. paliurus extracts among different treatments were compared with an analysis of variance (ANOVA, GLM procedure, p < 0.05) and Duncan multiple range tests, using SPSS software version 16.0 (SPSS, Chicago, IL, USA). To assess the chemical variability of extracts from different locations, we used PCA based on matrix linking contents of the major components from ethanol and aqueous extracts to different locations. The multivariate analysis was carried out using SPSS software (SPSS, Chicago, IL, USA). The impact of chemical variability on the antihyperglycemic and antihyperlipidemic properties in STZ-induced mouse model was assessed over CCA, using multi-variate statistical package (MVSP) V5.2.

4. Conclusions

In conclusion, based on the analysis of chemical variability and its relationship with anti-diabetic activities, our results revealed the potential antihyperglycemic capacity of C. paliurus flavonoids and the antihyperlipidemic effect of C. paliurus triterpenoids, while these potential capacities were closely related to their contents. Further studies on the antihyperglycemic effect of C. paliurus kaempferol or quercetin glycosides and the antihyperlipidemic mechanism of C. paliurus triterpenoids will be carried out in future research.

Author Contributions

Shengzuo Fang and Xiangxiang Fu conceived and designed the experiments; Xulan Shang and Wanxia Yang collected the leaf samples; Yang Liu performed the experiments, analyzed the data and wrote the manuscript. Yanni Cao and Zhiqi Yin contributed some authentic standards. Shengzuo Fang and Tongli Wang revised the manuscript.

Acknowledgments

This work was supported by the Jiangsu Province Science Foundation for Youths (No. BK20160926), the National Natural Science Foundation of China (Project numbers: 31270673, 31470637), the Priority Academic Program Development of Jiangsu Higher Education Institutions (PAPD), and the Doctorate Fellowship Foundation of Nanjing Forestry University.

Conflicts of Interest

The authors declare that there are no conflicts of interest.

References

  1. Jia, W.; Gao, W.; Tang, L. Antidiabetic herbal drugs officially approved in China. Phytother. Res. 2003, 17, 1127–1134. [Google Scholar] [CrossRef] [PubMed]
  2. Ahmad Aufa, Z.; Hassan, F.A.; Ismail, A.; Mohd Yusof, B.N.; Hamid, M. Chemical compositions and antioxidative and antidiabetic properties of underutilized vegetable palm hearts from Plectocomiopsis geminiflora and Eugeissona insignis. J. Agric. Food Chem. 2014, 62, 2077–2084. [Google Scholar] [CrossRef] [PubMed]
  3. Jung, M.; Park, M.; Lee, H.C.; Kang, Y.H.; Kang, E.S.; Kim, S.K. Antidiabetic agents from medicinal plants. Curr. Med. Chem. 2006, 13, 1203–1218. [Google Scholar] [CrossRef] [PubMed]
  4. Dehghan-Kooshkghazi, M.; Mathers, J.C. Starch digestion, large-bowel fermentation and intestinal mucosal cell proliferation in rats treated with the α-glucosidase inhibitor acarbose. Br. J. Nutr. 2004, 91, 357–365. [Google Scholar] [CrossRef] [PubMed]
  5. Umeno, A.; Horie, M.; Murotomi, K.; Nakajima, Y.; Yoshida, Y. Antioxidative and antidiabetic effects of natural polyphenols and isoflavones. Molecules 2016, 21, 708. [Google Scholar] [CrossRef] [PubMed]
  6. Phan, M.A.T.; Wang, J.; Tang, J.; Lee, Y.Z.; Ng, K. Evaluation of α-glucosidase inhibition potential of some flavonoids from Epimedium brevicornum. Food Sci. Technol. 2013, 53, 492–498. [Google Scholar] [CrossRef]
  7. Numonov, S.; Edirs, S.; Bobakulov, K.; Qureshi, M.N.; Bozorov, K.; Sharopov, F.; Aisa, H.A. Evaluation of the Antidiabetic Activity and Chemical Composition of Geranium collinum Root Extracts-Computational and Experimental Investigations. Molecules 2017, 22, 983. [Google Scholar] [CrossRef] [PubMed]
  8. Fang, S.; Wang, J.; Wei, Z.; Zhu, Z. Methods to break seed dormancy in Cyclocarya paliurus (Batal) Iljinskaja. Sci. Hortic. 2006, 110, 305–309. [Google Scholar] [CrossRef]
  9. Liu, Y.; Fang, S.; Yang, W.; Shang, X.; Fu, X. Light quality affects flavonoid production and related gene expression in Cyclocarya paliurus. J. Photoch. Photobio. B. 2018, 179, 66–73. [Google Scholar] [CrossRef] [PubMed]
  10. Xie, J.H.; Dong, C.J.; Nie, S.P.; Li, F.; Wang, Z.J.; Shen, M.Y.; Xie, M.Y. Extraction, chemical composition and antioxidant activity of flavonoids from Cyclocarya paliurus (Batal.) Iljinskaja leaves. Food Chem. 2015, 186, 97–105. [Google Scholar] [CrossRef] [PubMed]
  11. Kurihara, H.; Asami, S.; Shibata, H.; Fukami, H.; Tanaka, T. Hypolipemic effect of Cyclocarya paliurus (Batal) Iljinskaja in lipid-loaded mice. Biol. Pharm. Bull. 2003, 26, 383–385. [Google Scholar] [CrossRef] [PubMed]
  12. Xie, J.H.; Shen, M.Y.; Xie, M.Y.; Nie, S.P.; Chen, Y.; Li, C.; Wang, Y.X. Ultrasonic-assisted extraction, antimicrobial and antioxidant activities of Cyclocarya paliurus (Batal.) Iljinskaja polysaccharides. Carbohyd. Polym. 2012, 89, 177–184. [Google Scholar] [CrossRef] [PubMed]
  13. Liu, Y.; Qian, C.; Ding, S.; Shang, X.; Yang, W.; Fang, S. Effect of light regime and provenance on leaf characteristics, growth and flavonoid accumulation in Cyclocarya paliurus (Batal) Iljinskaja coppices. Bot. Stud. 2016, 57, 28. [Google Scholar] [CrossRef] [PubMed]
  14. Fang, S.; Yang, W.; Chu, X.; Shang, X.; She, C.; Fu, X. Provenance and temporal variations in selected flavonoids in leaves of Cyclocarya paliurus. Food Chem. 2011, 124, 1382–1386. [Google Scholar] [CrossRef]
  15. Wright, M.; Byrd, J.; Gao, Y.; Stubblefield, J.; Park, H.; Dunlap, N. Isolation and structural clarification of triterpenes from Cyclocarya paliurus: Cyclocaric acid A and B. Planta Med. 2014, 80, PD19. [Google Scholar] [CrossRef]
  16. Kurihara, H.; Fukami, H.; Kusumoto, A.; Toyoda, Y.; Shibata, H.; Matsui, Y.; Tanaka, T. Hypoglycemic action of Cyclocarya paliurus (Batal.) Iljinskaja in normal and diabetic mice. Biosci. Biotechnol. Biochem. 2013, 67, 877–880. [Google Scholar] [CrossRef] [PubMed]
  17. Li, S.; Li, J.; Guan, X.L.; Li, J.; Deng, S.P.; Li, L.Q.; Yang, R.Y. Hypoglycemic effects and constituents of the barks of Cyclocarya paliurus and their inhibiting activities to glucosidase and glycogen phosphorylase. Fitoterapia 2011, 82, 1081–1085. [Google Scholar] [CrossRef] [PubMed]
  18. Yang, Z.W.; Ouyang, K.H.; Zhao, J.; Chen, H.; Xiong, L.; Wang, W.J. Structural characterization and hypolipidemic effect of Cyclocarya paliurus polysaccharide in rat. Int. J. Biol. Macromol. 2016, 91, 1073–1080. [Google Scholar] [CrossRef] [PubMed]
  19. Hu, W.B.; Zhao, J.; Chen, H.; Xiong, L.; Wang, W.J. Polysaccharides from Cyclocarya paliurus: Chemical composition and lipid-lowering effect on rats challenged with high-fat diet. J. Funct. Foods 2017, 36, 262–273. [Google Scholar] [CrossRef]
  20. Wang, Q.; Jiang, C.; Fang, S.; Wang, J.; Ji, Y.; Shang, X.; Zhang, J. Antihyperglycemic, antihyperlipidemic and antioxidant effects of ethanol and aqueous extracts of Cyclocarya paliurus leaves in type 2 diabetic rats. J. Ethnopharmacol. 2013, 150, 1119–1127. [Google Scholar] [CrossRef] [PubMed]
  21. Jiang, C.; Wang, Q.; Wei, Y.; Yao, N.; Wu, Z.; Ma, Y.; Zhang, J. Cholesterol-lowering effects and potential mechanisms of different polar extracts from Cyclocarya paliurus leave in hyperlipidemic mice. J. Ethnopharmacol. 2015, 176, 17–26. [Google Scholar] [CrossRef] [PubMed]
  22. Ma, Y.; Jiang, C.; Yao, N.; Li, Y.; Wang, Q.; Fang, S.; Zhang, J. Antihyperlipidemic effect of Cyclocarya paliurus (Batal.) Iljinskaja extract and inhibition of apolipoprotein B48 overproduction in hyperlipidemic mice. J. Ethnopharmacol. 2015, 166, 286–296. [Google Scholar] [CrossRef] [PubMed]
  23. Wu, Z.F.; Meng, F.C.; Cao, L.J.; Jiang, C.H.; Zhao, M.G.; Shang, X.L.; Yin, Z.Q. Triterpenoids from Cyclocarya paliurus and their inhibitory effect on the secretion of apoliprotein B48 in Caco-2 cells. Phytochemistry 2017, 142, 76–84. [Google Scholar] [CrossRef] [PubMed]
  24. Cao, Y.; Fang, S.; Yin, Z.; Fu, X.; Shang, X.; Yang, W.; Yang, H. Chemical Fingerprint and Multicomponent Quantitative Analysis for the Quality Evaluation of Cyclocarya paliurus Leaves by HPLC-Q-TOF-MS. Molecules 2017, 22, 1927. [Google Scholar] [CrossRef] [PubMed]
  25. Yang, L.; Wen, K.S.; Ruan, X.; Zhao, Y.X.; Wei, F.; Wang, Q. Response of Plant Secondary Metabolites to Environmental Factors. Molecules 2018, 23, 762. [Google Scholar] [CrossRef] [PubMed]
  26. Zhang, L.; Hogan, S.; Li, J.; Sun, S.; Canning, C.; Zheng, S.J.; Zhou, K. Grape skin extract inhibits mammalian intestinal α-glucosidase activity and suppresses postprandial glycemic response in streptozocin-treated mice. Food Chem. 2011, 126, 466–471. [Google Scholar] [CrossRef]
  27. Shehata, A.M.; Quintanilla-Fend, L.; Bettio, S.; Singh, C.B.; Ammon, H.P.T. Prevention of multiple low-dose streptozotocin (MLD-STZ) diabetes in mice by an extract from gum resin of Boswellia serrata (BE). Phytomedicine 2011, 18, 1037–1044. [Google Scholar] [CrossRef] [PubMed]
  28. Zhang, M.; Du, N.; Wang, L.; Wang, X.; Xiao, Y.; Zhang, K.; Wang, P. Conjugated fatty acid-rich oil from Gynostrmma pentaphyllum seed can ameliorate lipid and glucose metabolism in type 2 diabetes mellitus mice. Food Funct. 2017, 8, 3696–3706. [Google Scholar] [CrossRef] [PubMed]
  29. Mensah-Brown, E.P.K.; Al Rabesi, Z.; Shahin, A.; Al Shamsi, M.; Arsenijevic, N.; Hsu, D.K.; Lukic, M.L. Targeted disruption of the galectin-3 gene results in decreased susceptibility to multiple low dose streptozotocin-induced diabetes in mice. Clin. Immunol. 2009, 130, 83–88. [Google Scholar] [CrossRef] [PubMed]
  30. Fang, X.K.; Gao, J.; Zhu, D.N. Kaempferol and quercetin isolated from Euonymus alatus improve glucose uptake of 3T3-L1 cells without adipogenesis activity. Life Sci. 2008, 82, 615–622. [Google Scholar] [CrossRef] [PubMed]
  31. Mukhopadhyay, P.; Prajapati, A.K. Quercetin in anti-diabetic research and strategies for improved quercetin bioavailability using polymer-based carriers-a review. RSC Advances 2015, 5, 97547–97562. [Google Scholar] [CrossRef]
  32. Yao, Y.; Chen, F.; Wang, M.; Wang, J.; Ren, G. Antidiabetic activity of Mung bean extracts in diabetic KK-Ay mice. J. Agric. Food Chem. 2008, 56, 8869–8873. [Google Scholar] [CrossRef] [PubMed]
  33. Somova, L.O.; Nadar, A.; Rammanan, P.; Shode, F.O. Cardiovascular, antihyperlipidemic and antioxidant effects of oleanolic and ursolic acids in experimental hypertension. Phytomedicine 2003, 10, 115–121. [Google Scholar] [CrossRef] [PubMed]
  34. Ejelonu, O.C.; Elekofehinti, O.O.; Adanlawo, I.G. Tithonia diversifolia saponin-blood lipid interaction and its influence on immune system of normal wistar rats. Biomed. Phar. 2017, 87, 589–595. [Google Scholar] [CrossRef] [PubMed]
  35. James, D.B.; Elebo, N.; Sanusi, A.M.; Odoemene, L. Some biochemical effect of intraperitoneal administration of Phyllanthus amarus aquoeus extacts on normaglycemic albino rats. Asian J. Med. Sci. 2010, 2, 7–10. [Google Scholar]
  36. Kew, M.C. Serum aminotransferase concentration as evidence of hepatocellular damage. Lancet 2000, 355, 591–592. [Google Scholar] [CrossRef]
  37. Ostfeld, R.; Spinelli, M.; Mookherjee, D.; Holtzman, D.; Shoyeb, A.; Schaefer, M.; Duc, Y. The association of blood urea nitrogen levels and coronary artery disease. Einstein J. Biol. Med. 2016, 25, 3–7. [Google Scholar] [CrossRef]
  38. Cao, J.; Wang, S.; Yao, C.; Xu, Z.; Xu, X. Hypolipidemic effect of porphyran extracted from Pyropia yezoensis in ICR mice with high fatty diet. J. Appl. Phycol. 2016, 28, 1315–1322. [Google Scholar] [CrossRef]
  39. Shi, F.; Li, J.; Yang, L.; Hou, G.; Ye, M. Hypolipidemic effect and protection ability of liver-kidney functions of melanin from Lachnum YM226 in high-fat diet fed mice. Food Funct. 2018, 9, 880–889. [Google Scholar] [CrossRef] [PubMed]
  40. Wu, C.; Wang, X.; Wang, H.; Shen, B.; He, X.; Gu, W.; Wu, Q. Extraction optimization, isolation, preliminary structural characterization and antioxidant activities of the cell wall polysaccharides in the petioles and pedicels of Chinese herbal medicine Qian (Euryale ferox Salisb.). Int. J. Biol. Macromol. 2014, 64, 458–467. [Google Scholar] [CrossRef] [PubMed]
  41. Srinivasan, K.; Viswanad, B.; Asrat, L.; Kaul, C.L.; Ramarao, P. Combination of high-fat diet-fed and low-dose streptozotocin-treated rat: a model for type 2 diabetes and pharmacological screening. Pharmacol. Res. 2005, 52, 313–320. [Google Scholar] [CrossRef] [PubMed]
Sample Availability: Samples of the compounds 4-O-caffeoylquinic acid, 3-O-caffeoylquinic acid, quercetin-3-O-glucuronide, isoquercitrin, quercetin-3-O-galactoside, kaempferol-3-O-glucuronide, kaempferol- 3-O-glucoside, kaempferol-3-O-rhamnoside, quercetin-3-O-rhamnoside, 4, 5-di-O-caffeoylquinic acid, arjunolic acid, cyclocaric acid B, pterocaryoside A, pterocaryoside B, hederagenin and oleanolic acid are available from the authors.
Figure 1. Chemical structures of identified compounds in extracts of C. paliurus: P1: 3-O-caffeoylquinic acid; P2: 4-O-caffeoylquinic acid; P3: 4,5-di-O-caffeoylquinic acid; F1: quercetin-3-O-glucuronide; F2: quercetin-3-O-galactoside; F3: isoquercitrin; F4: kaempferol-3-O-glucuronide; F5: kaempferol-3-O-glucoside; F6: quercetin-3-O-rhamnoside; F7: kaempferol-3-O-rhamnoside; T1: arjunolic acid; T2: cyclocaric acid B; T3: pterocaryoside B; T4: pterocaryoside A; T5: hederagenin; T6: oleanolic acid.
Molecules 23 01042 g001
Figure 2. Biplots of Principal Component Analysis (PCA) of ethanol (A) and aqueous (B) extracts of C. paliurus from different locations. L1: Jinzhongshan; L2: Muchuan; L3: Wufeng; L4: Anji; L5: Suining. P1: 3-O-caffeoylquinic acid; P2: 4-O-caffeoylquinic acid; P3: 4,5-di-O-caffeoylquinic acid; F1: quercetin-3-O-glucuronide; F2: quercetin-3-O-galactoside; F3: isoquercitrin; F4: kaempferol-3-O-glucuronide; F5: kaempferol-3-O-glucoside; F7: kaempferol-3-O-rhamnoside; T1: arjunolic acid; T2: cyclocaric acid B; T3: pterocaryoside B; T4: pterocaryoside A; T5: hederagenin; T6: oleanolic acid; Ps: polysaccharides.
Molecules 23 01042 g002
Figure 3. (A) Changes in body weight of different groups (n = 6). (B) Body weight gain. DC: diabetic control group; NC: normal control group; EL1-EL5: STZ-induced diabetic mice treated with ethanol extracts from different locations; AL1-AL5: STZ-induced diabetic mice treated with aqueous extracts from different locations; MHT, XKP: positive controls, STZ-induced diabetic mice treated with Metformin Hydrochloride Tablets (MHT) and Xiaoke Pill (XKP), respectively. Values with different letters significantly differ at p < 0.05 by Duncan’s test. # p < 0.05 and ## p < 0.01 significance against the normal control group (NC). **p < 0.01 significance against the model control group (DC).
Molecules 23 01042 g003
Figure 4. Levels of blood glucose in STZ-induced diabetic mice as revealed by oral glucose tolerance tests (OGTT) (n = 6). AUC glucose: area under the curve for glucose levels. DC: diabetic control group; NC: normal control group; EL1-EL5: STZ-induced diabetic mice treated with ethanol extracts from different locations; AL1-AL5: STZ-induced diabetic mice treated with aqueous extracts from different locations; MHT, XKP: positive controls, STZ-induced diabetic mice treated with Metformin Hydrochloride Tablets (MHT) and Xiaoke Pill (XKP), respectively. Values with different letters significantly differ at p < 0.05 by Duncan’s test.
Molecules 23 01042 g004
Figure 5. Levels of blood glucose in STZ-induced diabetic mice as revealed by insulin tolerance test (ITT) (n = 6). AUC glucose: area under the curve for glucose levels. DC: diabetic control group; NC: normal control group; EL1-EL5: STZ-induced diabetic mice treated with ethanol extracts from different locations; AL1-AL5: STZ-induced diabetic mice treated with aqueous extracts from different locations; MHT, XKP: positive controls, STZ-induced diabetic mice treated with Metformin Hydrochloride Tablets (MHT) and Xiaoke Pill (XKP), respectively. Values with different letters significantly differ at p < 0.05 by Duncan’s test.
Molecules 23 01042 g005
Figure 6. Biplots of Canonical Correspondence Analysis (CCA) of C. paliurus extracts. CCA were done based on matrix linking contents of the major components, geographical locations and their antihyperglycemic (A), antihyperlipidemic (B) activities in STZ-induced diabetic mice. BW, Body weight gain; BG, Final blood glucose level in fasting blood glucose test; OGTT, Oral glucose tolerance test; ITT, Insulin tolerance test; TG, Triglyceride; TC, Total cholesterol; LDL-c, Low density lipoprotein cholesterol; HDL-c, High-density lipoprotein cholesterol; BUN, Blood urea nitrogen; CREA, Creatinine; TBIL, Total bilirubin; AST, Aspartate aminotransferase; ALT, Alanine aminotransferase.
Molecules 23 01042 g006
Table 1. Chemical compositions of ethanol and aqueous extracts in C. paliurus from different geographical locations (mg/g, mean ± SD). Different letters indicate significant differences (p < 0.05 by Duncan’s test) between treatments (n = 3) (nd, not detected).
CompoundsLOD (ng/mL)LOQ (ng/mL)EL1EL2EL3EL4EL5AL1AL2AL3AL4AL5
3-O-caffeoylquinic acid (P1)64.25214.210.35 ± 0.011 cd1.38 ± 0.153 a0.39 ± 0.003 cd0.45 ± 0.028 bc0.31 ± 0.003 d0.09 ± 0.003 e1.30 ± 0.028 a0.55 ± 0.006 b0.04 ± 0.003 e0.09 ± 0.006 e
4-O-caffeoylquinic acid (P2)57.93197.580.03 ± 0.001 h0.08 ± 0.003 e0.28 ± 0.003 b0.11 ± 0.003 d0.08 ± 0.002 e0.04 ± 0.001 g0.23 ± 0.003 c0.35 ± 0.003 a0.01 ± 0.001 i0.05 ± 0.003 f
4,5-di-O-caffeoylquinic acid (P3)58.97201.220.05 ± 0.003 d0.10 ± 0.001 c0.42 ± 0.028 a0.16 ± 0.003 b0.08 ± 0.003 cdndndndndnd
quercetin-3-O-glucuronide (F1)40.28128.742.15 ± 0.010 b1.57 ± 0.006 d2.12 ± 0.003 c2.38 ± 0.005 a0.78 ± 0.003 g0.33 ± 0.003 h1.25 ± 0.028 e0.98 ± 0.003 f0.30 ± 0.009 i0.34 ± 0.009 h
quercetin-3-O-galactoside (F2)52.94174.170.47 ± 0.005 c0.24 ± 0.003 d0.52 ± 0.003 b0.57 ± 0.005 a0.20 ± 0.003 e0.02 ± 0.001 g0.01 ± 0.001 hndnd0.05 ± 0.001 f
isoquercitrin (F3)58.42192.520.22 ± 0.005 b0.32 ± 0.006 a0.18 ± 0.006 c0.21 ± 0.013 b0.08 ± 0.001 d0.01± 0.001 g0.05± 0.006 e0.02 ± 0.001 fg0.02 ± 0.003 fg0.03 ± 0.001 ef
kaempferol-3-O-glucuronide (F4)43.98153.141.33 ± 0.001 b0.86 ± 0.001 d1.88 ± 0.001 a0.95 ± 0.001 c0.51 ± 0.001 g0.18 ± 0.001 i0.61 ± 0.001 f0.74 ± 0.001 e0.20 ± 0.001 h0.17 ± 0.001 i
kaempferol-3-O-glucoside (F5)
glucoside (F5)
53.85187.370.18± 0.001 b0.20 ± 0.001 a0.12 ± 0.001 c0.08 ± 0.001 d0.05 ± 0.001 end0.02 ± 0.002 fndndnd
quercetin-3-O-rhamnoside (F6)
rhamnosiderhamnoside (F6)
62.48199.320.23 ± 0.001 a0.11 ± 0.001 d0.20 ± 0.001 b0.19 ± 0.001 cnd0.01 ± 0.001 g0.01 ± 0.001 f0.04 ± 0.001 endnd
kaempferol-3-O-rhamnoside (F7)64.13211.812.30 ± 0.001 a1.39 ± 0.001 d1.78 ± 0.001 b1.50 ± 0.006 c0.68 ± 0.001 end0.05 ± 0.001 g0.25 ± 0.001 fndnd
arjunolic acid (T1)78.13260.172.25 ± 0.001 b1.65 ± 0.0011 c2.70 ± 0.001 a1.60 ± 0.001 d1.47 ± 0.001 e0.02 ± 0.001 g0.07 ± 0.001 f0.07 ± 0.001 fnd0.02 ± 0.001 g
cyclocaric acid B (T2)90.16296.360.71 ± 0.001 c0.95 ± 0.001 b0.98 ± 0.001 a0.65 ± 0.001 d0.55 ± 0.001 e0.05± 0.004g h0.07 ± 0.001 f0.06 ± 0.001 g0.04 ± 0.002 h0.05 ± 0.001 gh
pterocaryoside B (T3)72.46210.270.24 ± 0.001 d0.01 ± 0.001 e1.61 ± 0.008 b1.42 ± 0.002 c2.46 ± 0.002 andndndndnd
pterocaryoside A (T4)86.39268.621.66 ± 0.007 d1.07 ± 0.004 e1.73 ± 0.003 c2.03 ± 0.002 b2.48 ± 0.006 andndndndnd
hederagenin (T5)72.82232.300.56 ± 0.002 c0.45 ± 0.002 e0.81 ± 0.004 a0.70 ± 0.001 b0.52 ± 0.003 dndndndndnd
oleanolic acid (T6)58.41185.720.26 ± 0.002 c0.25 ± 0.001 c0.31 ± 0.001 a0.30 ± 0.002 b0.22 ± 0.002 d0.003 ± 0.0001 fg0.009 ± 0.0001 e0.007 ± 0.0002 ef0.001 ± 0.0001 g0.003 ± 0.0001 fg
total phenolic acids (TP)--0.43 ± 0.014 e1.57 ± 0.154 a1.09 ± 0.023 b0.71 ± 0.034 d0.47 ± 0.007 e0.12 ± 0.003 f1.53 ± 0.026 a0.91 ± 0.003 c0.06 ± 0.003 f0.13 ± 0.009 f
total flavonoids (TF)--6.88 ± 0.011 a4.70 ± 0.002 d6.80 ± 0.006 b5.90 ± 0.008 c2.30 ± 0.001 e0.55 ± 0.003 i1.99 ± 0.021 g2.03 ± 0.001 f0.52± 0.003 j0.60 ± 0.010 h
total triterpenoids (TT)--5.69 ± 0.012 d4.39 ± 0.004 e8.15 ± 0.018 a6.70 ± 0.008 c7.70 ± 0.001 b0.08 ± 0.004 g0.15 ± 0.002 f0.13 ± 0.001 f0.05 ± 0.003 h0.07 ± 0.001 g
polysaccharides (Ps)--ndndndndnd34.5 ± 2.02 c44.0 ± 5.54 b53.6 ± 4.05 a28.8 ± 4.91 cd28.2 ± 3.07 d
Table 2. Levels of fasting blood glucose (FBG) in experimental mice of different groups over the 28-day trial (mean ± SD). Different letters indicate significant differences (p < 0.05 by Duncan’s test) between treatments (n = 6).
TreatmentFasting blood glucose level (mmol /L)
0 day7 day14 day21 day28 day
DC17.9 ± 0.54 a19.0 ± 0.46 a19.2 ± 0.75 a19.4 ± 0.82 a20.0 ± 0.73 a
NC6.6 ± 0.31 b6.2 ± 0.27 e6.3 ± 0.27 g6.1 ± 0.44 g6.1 ± 0.28 g
EL116.8 ± 0.43 a15.8 ± 0.69 cd14.9 ± 0.73 bcde12.0 ± 0.87 cde10.6 ± 0.48 de
EL216.8 ± 0.88 a15.5 ± 0.35 d14.2 ± 0.51 cdef14.3 ± 0.58 b12.8 ± 0.89 b
EL317.8 ± 0.40 a15.5 ± 0.42 d13.3 ± 0.95 ef10.7 ± 0.61 ef9.8 ± 0.45 ef
EL416.8 ± 1.10 a15.5 ± 0.82 d13.2 ± 0.93 ef10.9 ± 1.03 def10.4 ± 1.20 e
EL517.9 ± 1.02 a15.9 ± 0.71 cd14.1 ± 0.78 def13.2 ± 1.20 bc12.4 ± 1.06 b
AL117.4 ± 1.01 a16.6 ± 0.55b cd15.0 ± 1.10b cde13.7 ± 0.98 bc11.8 ± 1.10 bcd
AL217.5 ± 0.78 a16.3 ± 0.56b cd15.2 ± 0.87b cde12.7 ± 1.07 bcd11.8 ± 1.49 bcd
AL318.1 ± 0.60 a17.7 ± 1.63 ab15.6 ± 1.30 bcd13.5 ± 1.27 bc12.8 ± 1.35 b
AL417.4 ± 1.22 a18.4 ± 1.27 a16.5 ± 1.16 b12.4 ± 1.28 bcde10.8 ± 1.34 cde
AL517.1 ± 0.78 a17.3 ± 1.20 abc16.2 ± 0.70 bc13.1 ± 1.28 bc12.1 ± 1.42 bc
MHT17.4 ± 0.82 a15.0 ± 0.85 d12.6 ± 1.16 f9.2 ± 0.74 f8.5 ± 0.66 f
XKP17.8 ± 0.57 a15.7 ± 1.06 cd13.3 ± 1.74 ef10.8 ± 0.78 def9.5 ± 0.59 ef
Table 3. Levels of serum lipids in different groups of experimental mice at the end of the diabetic trial (mean ± SD). Different letters indicate significant differences (p < 0.05 by Duncan’s test) between treatments (n = 6).
TreatmentTC (mmol/L)TG (mmol/L)HDL-c (mmol/L)LDL-c (mmol/L)
DC3.76 ± 0.19 a3.09 ± 0.49 a1.57 ± 0.25 c0.31 ± 0.05 a
NC2.64 ± 0.23 bcd1.48 ± 0.30 c1.87 ± 0.24 abc0.20 ± 0.04 cd
EL12.39 ± 0.25 cd1.21 ± 0.21 c1.95 ± 0.24 abc0.24 ± 0.04 abcd
EL22.08 ± 0.38 d1.19 ± 0.23 c2.11 ± 0.21 abc0.21 ± 0.03 bcd
EL32.08 ± 0.15 d1.15 ± 0.24 c2.34 ± 0.39 a0.18 ± 0.02 d
EL42.38 ± 0.21 cd1.02 ± 0.13 c2.23 ± 0.34 ab0.23 ± 0.03 abcd
EL52.57 ± 0.49 bcd1.21 ± 0.04 c2.05 ± 0.31 abc0.24 ± 0.04 abcd
AL12.66 ± 0.42 bcd1.45 ± 0.37 c1.66 ± 0.11 c0.28 ± 0.03 abc
AL22.97 ± 0.32 bc1.41 ± 0.29 c1.78 ± 0.18 bc0.28 ± 0.04 abc
AL33.03± 0.12 b1.56 ± 0.16 c1.74 ± 0.21 bc0.29 ± 0.05 ab
AL43.10 ± 0.42 b1.24 ± 0.12 c1.58 ± 0.16 c0.31 ± 0.04 a
AL52.95 ± 0.25 bc1.29 ± 0.28 c1.59 ± 0.08 c0.25 ± 0.04 abcd
MHT3.00 ± 0.19 b2.35± 0.29 b1.70 ± 0.24 bc0.23 ± 0.02 abcd
XKP3.12 ± 0.23 b2.36 ± 0.34 b1.93 ± 0.18 abc0.27 ± 0.03 abcd
Table 4. Index of liver and kidney function in different groups of experimental mice at the end of the diabetic trial (mean ± SD). Different letters indicate significant differences (p < 0.05 by Duncan’s test) between treatments (n = 6).
TreatmentALT (U/L)AST (U/L)TBIL (μmol/L)CREA (μmol/L)BUN (mmol/L)
DC52.8± 2.17 a145.6 ± 3.08 a7.50 ± 0.89 a25.8 ± 1.17 a17.3 ± 0.99 a
NC28.0 ± 1.84 e99.8 ± 6.87 fg1.00 ± 0.18 g14.7 ± 1.36 e9.80 ± 0.18 d
EL136.1 ± 2.63 cd113.3 ± 8.10 def1.20 ± 0.15 fg20.8 ± 0.75 bcd13.4 ± 0.86 b
EL235.9 ± 1.80 cd94.8 ± 8.59 g1.02 ± 0.02 g19.2 ± 1.94 cd12.6± 1.08 bc
EL335.1 ± 3.36 d94.5 ± 4.45 g1.19 ± 0.18 fg18.2 ± 2.13 d13.1 ± 1.26 bc
EL436.9 ± 3.35 bcd95.8 ± 9.05 g1.46 ± 0.16 fg21.0 ± 0.89 bcd11.0 ± 1.17 cd
EL536.2 ± 3.38 cd114.0 ± 7.66 de1.38 ± 0.18 fg21.0 ± 1.26 bcd12.7 ± 0.26 bc
AL140.3 ± 4.51 bcd130.2 ± 4.56 b1.47 ± 0.18 fg21.7 ± 1.86 bc14.7 ± 0.81 b
AL243.4 ± 6.36 b128.9 ± 5.30 bc2.03 ± 0.10 ef22.3 ± 1.21 b14.2 ± 0.69 b
AL341.6 ± 1.36 bcd123.6 ± 6.69 bcd2.57 ± 0.28 e22.8 ± 0.98 b14.3 ± 0.92 b
AL443.1± 5.16 b125.8 ± 4.16 bcd4.87 ± 0.17 bc21.8 ± 1.17 bc14.2 ± 1.17 b
AL540.0 ± 3.19 bcd115.5 ± 6.08 cde3.63 ± 0.21 d21.2 ± 0.98 bc14.2 ± 1.32 b
MHT42.4 ± 2.06 bc121.1± 6.06 bcde5.60 ± 0.55 b21.0 ± 1.67 bcd14.3 ± 0.76 b
XKP43.5 ± 2.39 b108.2 ± 8.57 efg4.41 ± 0.22 cd22.0 ± 1.79 bc13.9 ± 0.82 b
Table 5. Geographical, climatic information and soil index of locations for C. paliurus sampling. T: Annual mean temperature; SH: Annual mean sunshine hours; P: Annual mean Precipitation; Soil C: organic matter content in soil; Soil N: total nitrogen content in soil.
Sample codeLocationLatitude
(N)
Longitude
(E)
T
(℃)
Altitude
(m)
SH
(h)
P
(mm)
Soil index
pHC (%)N (%)P (%)K (%)Ca (%)Mg (%)
L1Jinzhongshan24°36′36″104°57′00″17.1179814751200.03.975.150.440.350.550.060.33
L2Muchuan28°58′00″103°47′00″12.91200965.31533.23.813.580.270.080.980.190.22
L3Wufeng30°17'00″110°80'00″16.768815331893.94.384.180.270.121.440.390.41
L4Meiwu27°46'00″119°17'00″16.567818621600.04.486.460.450.222.030.180.22
L5Suining26°22'24″110°07'47″16.786213481320.04.613.170.380.131.280.220.22

