Strategy for Screening of Antioxidant Compounds from Two Ulmaceae Species Based on Liquid Chromatography-Mass Spectrometry

 ,
, 
Abstract
:
1. Introduction
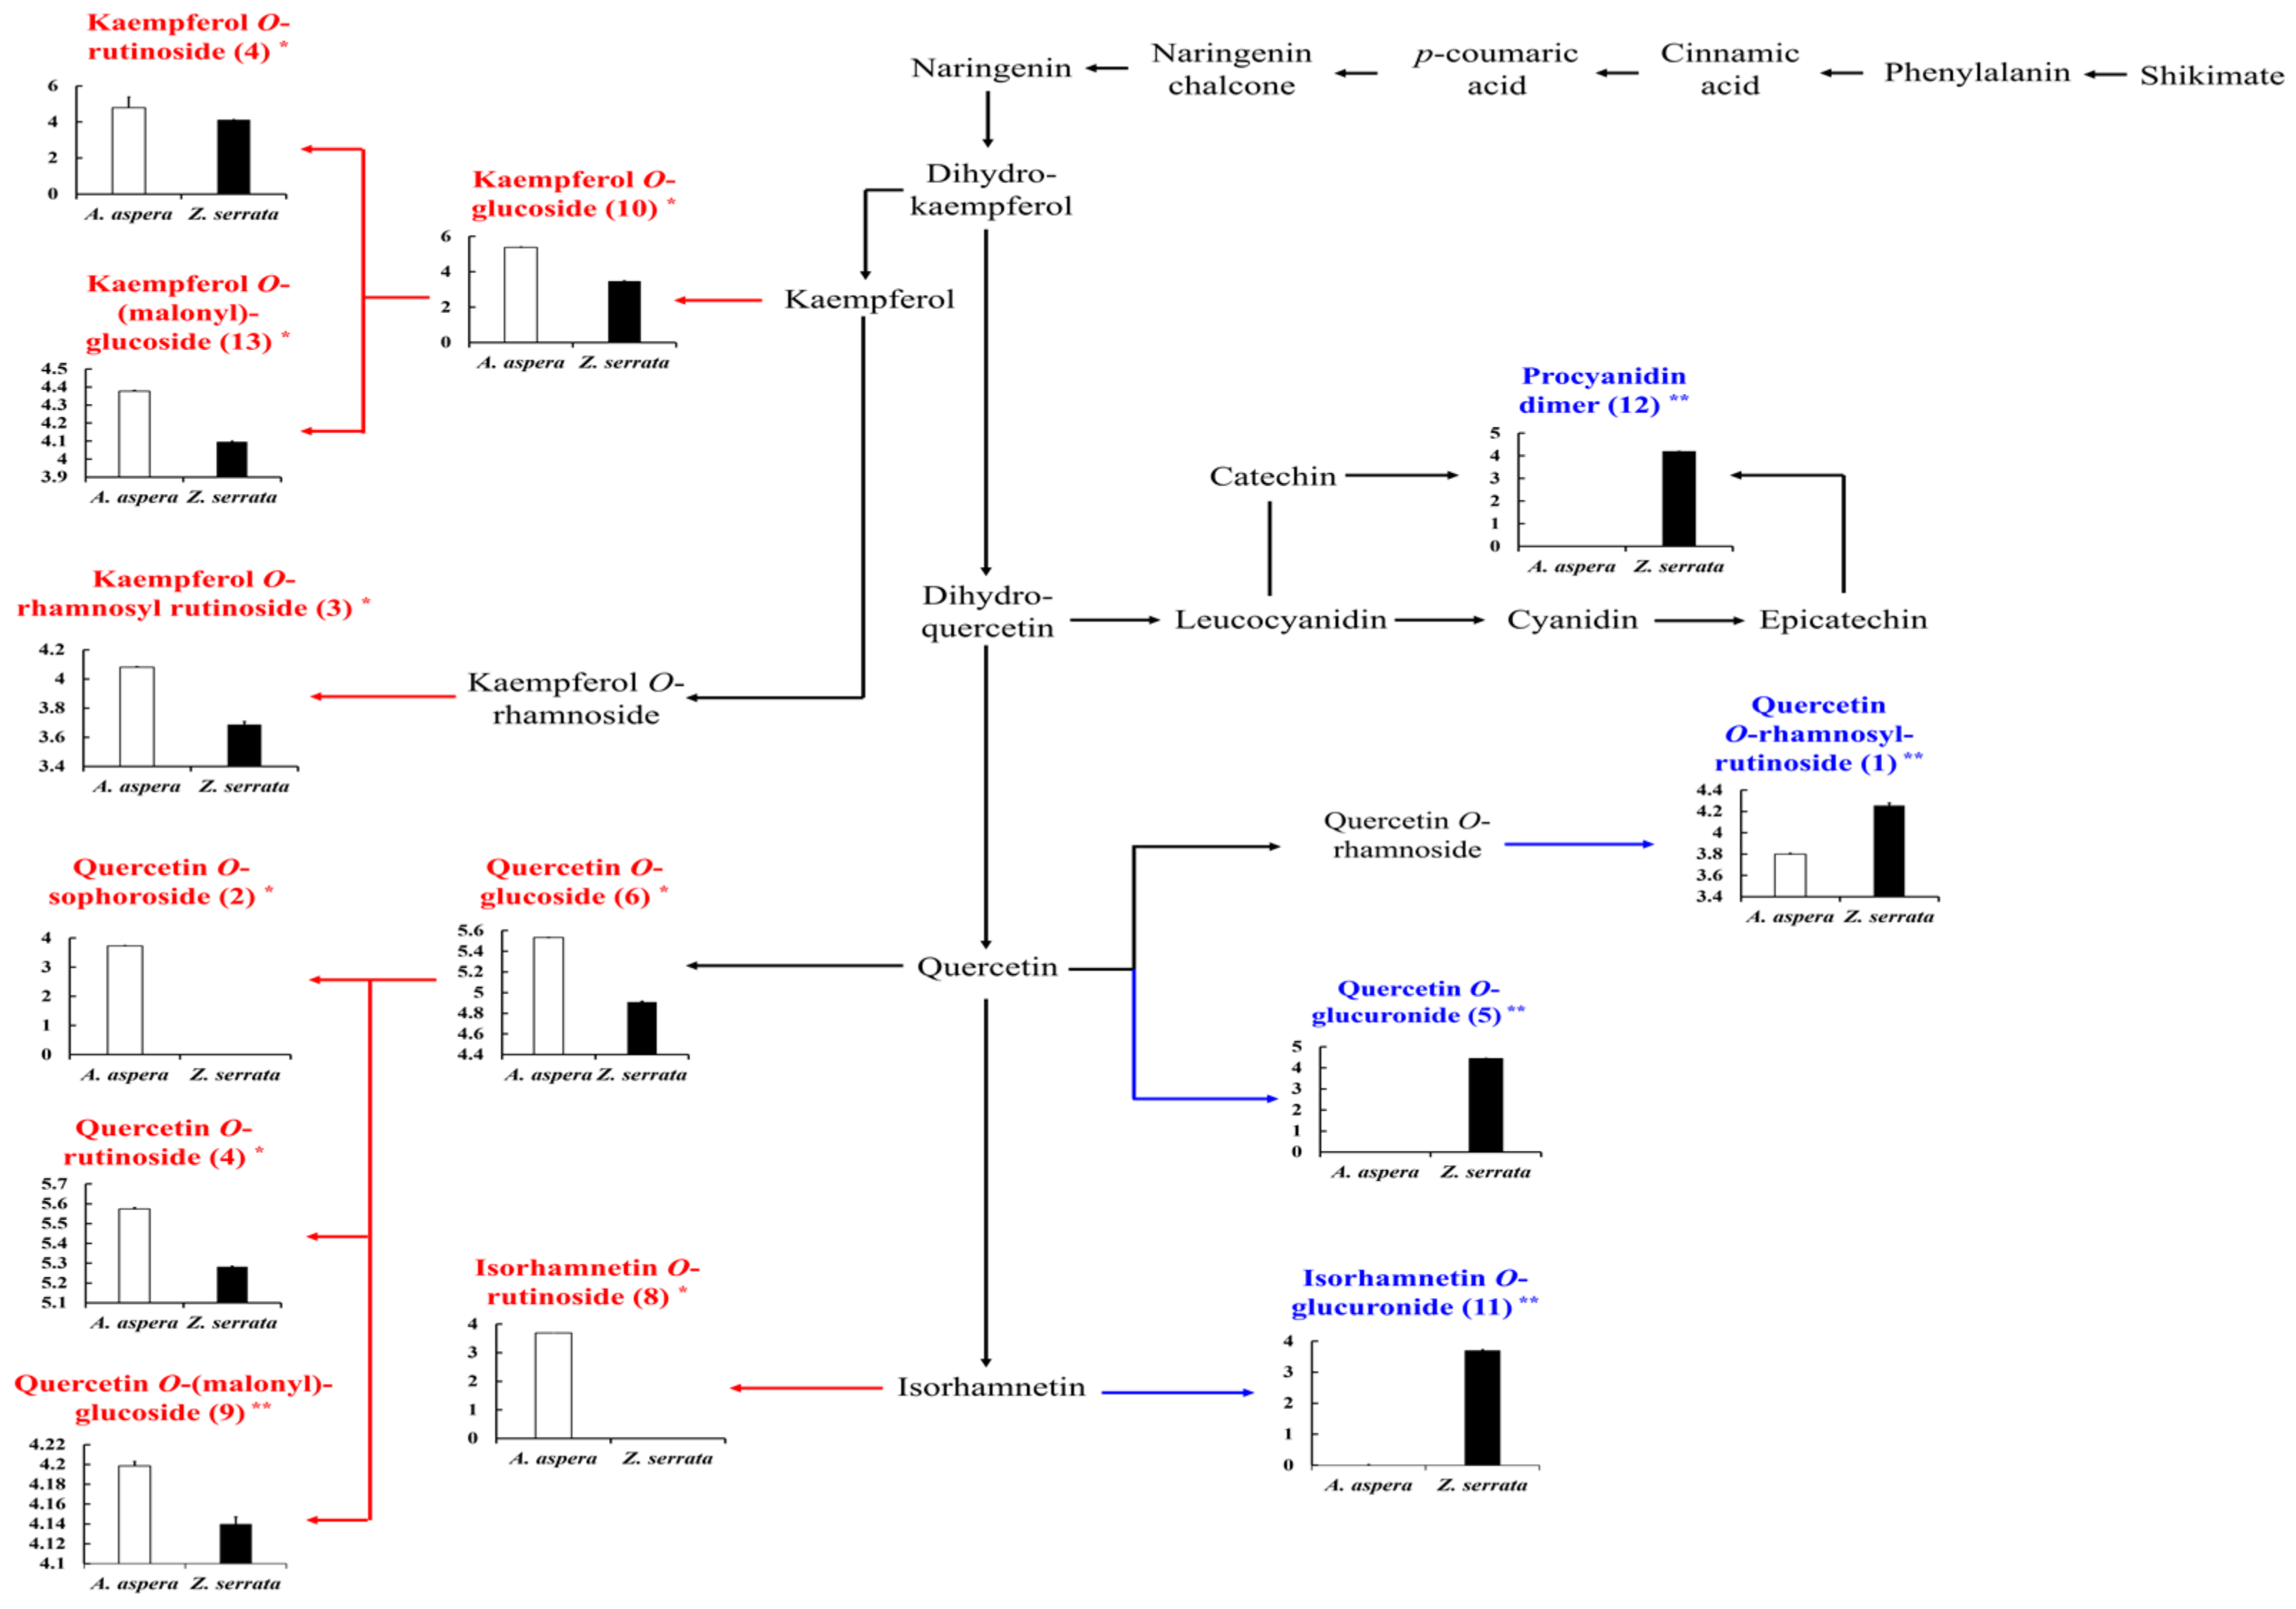
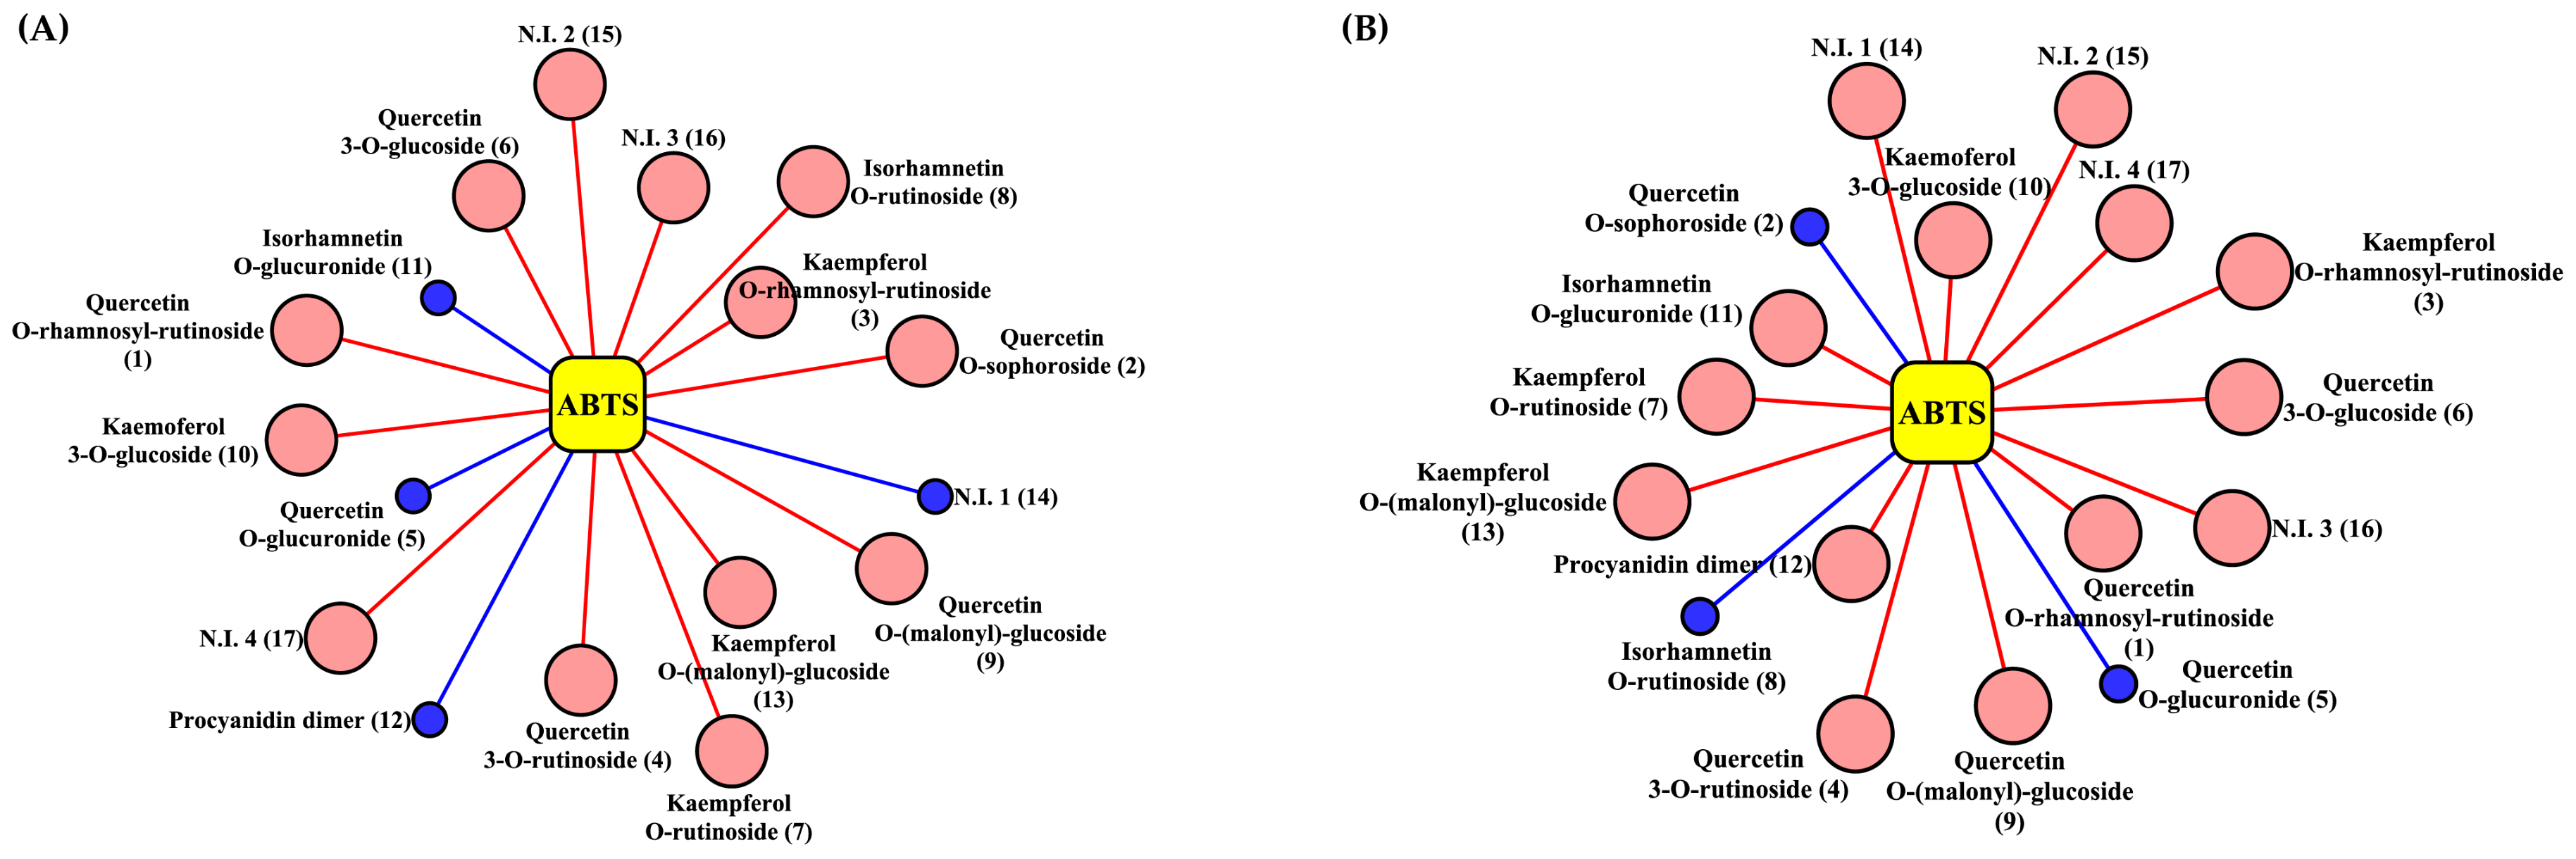
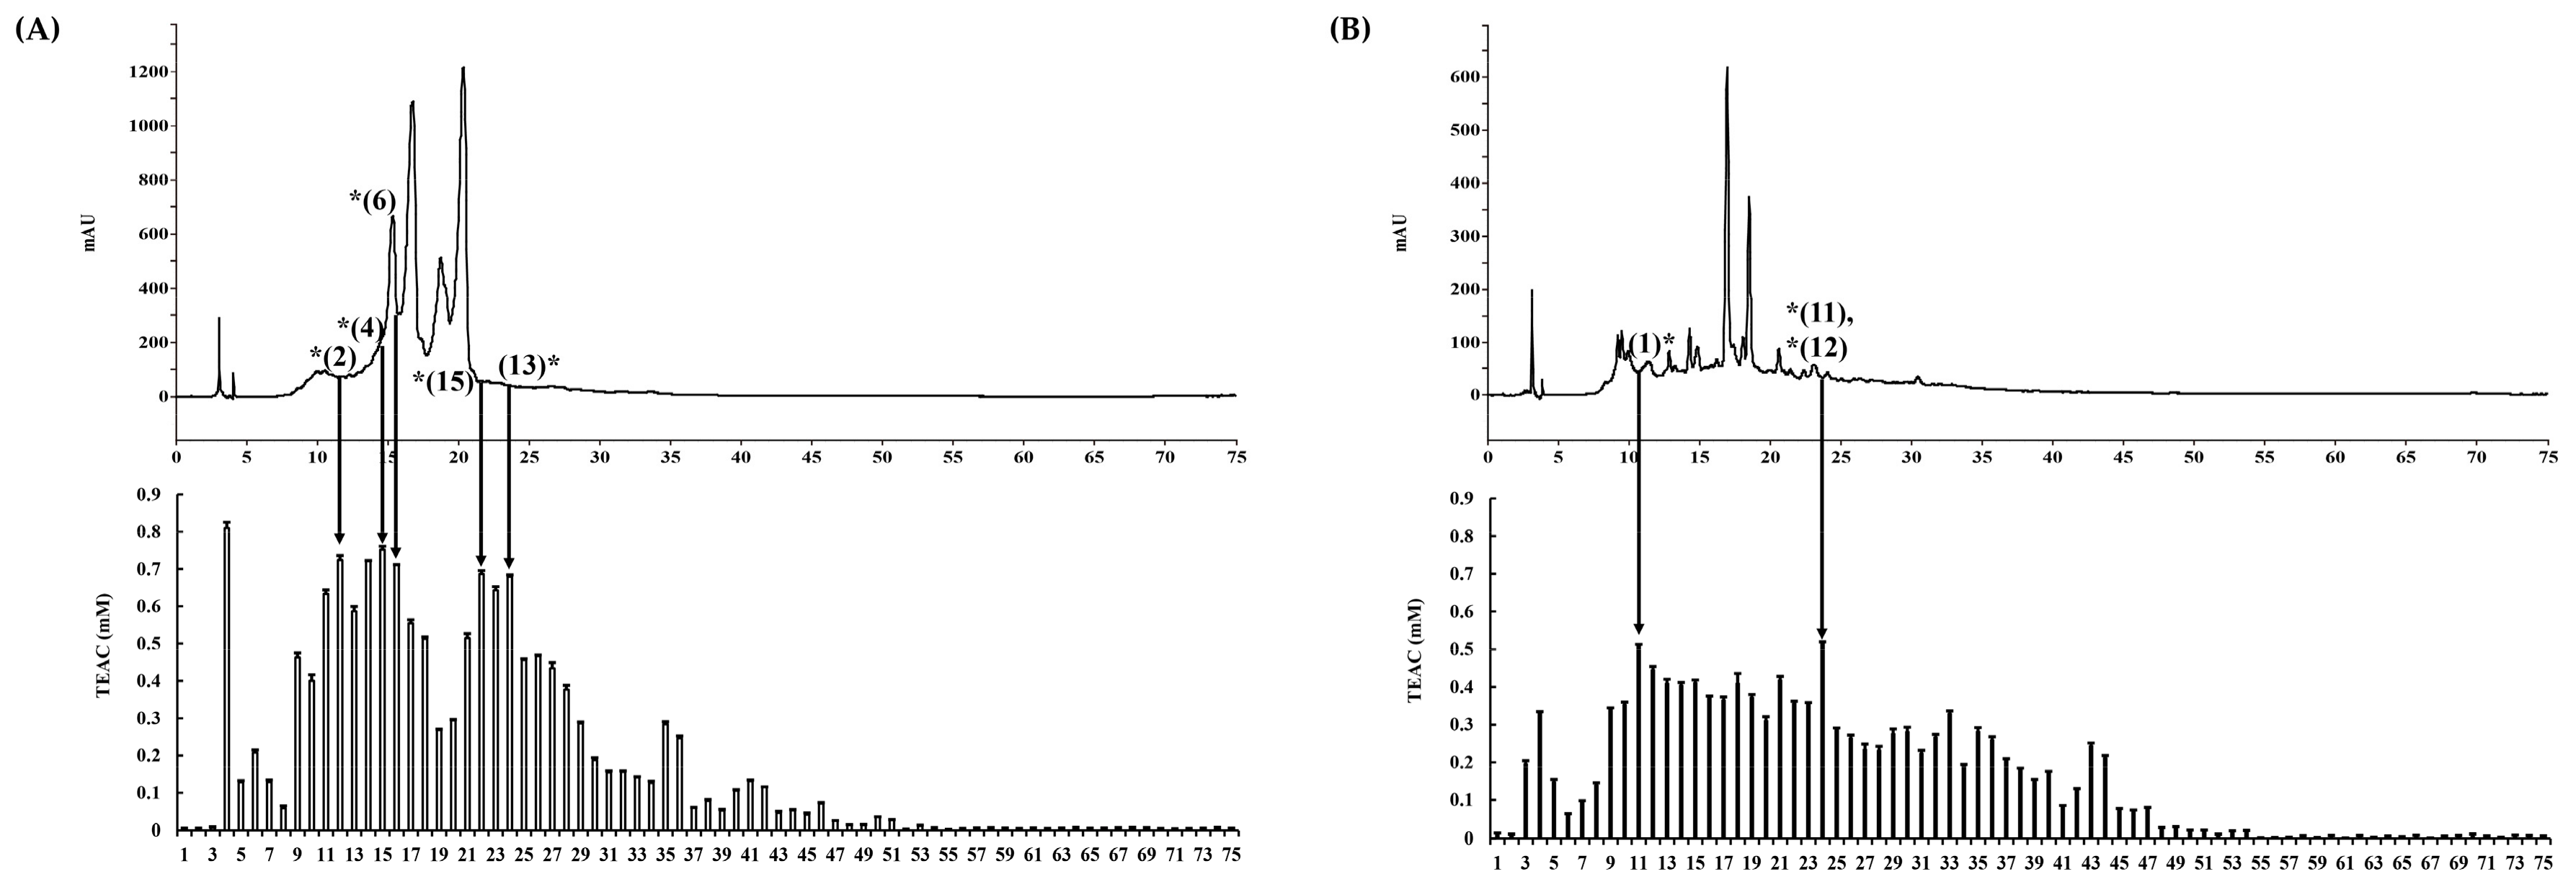
2. Results and Discussion
3. Materials and Methods
3.1. Chemicals and Reagents
3.2. Sample Information and Preparation
3.3. LC-MS Analysis
3.4. Solid Phase Extraction and Prep-HPLC Separation
3.5. Determination of Antioxidant Activity Using ABTS, DPPH, and FRAP Assays
3.6. Determination of TPC and TFC
3.7. Data Processing and Statistical Analysis
Supplementary Materials
Author Contributions
Funding
Conflicts of Interest
References
- Kim, Y.S. Conservation of plant diversity in Korea. Landsc. Ecol. Eng. 2006, 2, 163–170. [Google Scholar] [CrossRef]
- Lee, S.; Oh, D.G.; Lee, S.; Kim, G.R.; Lee, J.S.; Son, Y.K. Chemotaxonomic metabolite profiling of 62 indigenous plant species and its correlation with bioactivities. Molecules 2015, 20, 19719–19734. [Google Scholar] [CrossRef] [PubMed]
- Tohma, H.; Gülçin, İ.; Bursal, E.; Gören, A.C.; Alwasel, S.H.; Köksal, E. Antioxidant activity and phenolic compounds of ginger (Zingiber officinale Rosc.) determined by HPLC-MS/MS. J. Food Meas. Charact. 2017, 11, 556–566. [Google Scholar] [CrossRef]
- Raterink, R.J.; Lindenburg, P.W.; Vreeken, R.J.; Ramautar, R.; Hankemeier, T. Recent developments in sample-pretreatment techniques for mass spectrometry-based metabolomics. Trends Anal. Chem. 2014, 61, 157–167. [Google Scholar] [CrossRef]
- Lee, M.Y.; Singh, D.; Kim, S.H.; Lee, S.J.; Lee, C.H. Ultrahigh Pressure Processing Produces Alterations in the Metabolite Profiles of Panax ginseng. Molecules 2016, 21, 816. [Google Scholar] [CrossRef] [PubMed]
- Kumar, S.; Chandra, P.; Bajpai, V.; Singh, A.; Srivastava, M.; Mishra, D.K.; Kumar, B. Rapid qualitative and quantitative analysis of bioactive compounds from Phyllanthus amarus using LC/MS/MS techniques. Ind. Crop. Prod. 2015, 69, 143–152. [Google Scholar] [CrossRef]
- Lim, D.K.; Mo, C.; Lee, J.H.; Long, N.P.; Dong, Z.; Li, J. The integration of multi-platform MS-based metabolomics and multivariate analysis for the geographical origin discrimination of Oryza sativa L. J. Food Drug Anal. 2018, 26, 769–777. [Google Scholar] [CrossRef] [PubMed]
- Zuo, L.H.; Shang, A.Q.; Zhang, S.; Yu, X.Y.; Ren, Y.C.; Yang, M.S. The first complete chloroplast genome sequences of Ulmus species by de novo sequencing: Genome comparative and taxonomic position analysis. PLoS ONE 2017, 12, e0171264. [Google Scholar] [CrossRef] [PubMed]
- Lim, J.C.; Choi, B.K.; Kim, S.Y.; Eom, B.C.; Kim, J.W. Korean traditional village forest (Ma-Eul-Soop) and potential natural vegetation: A case study on the Sachon-Ri Garo-Soop in Gyeongsangbuk-do, South Korea. J. Plant Biol. 2016, 59, 515–524. [Google Scholar] [CrossRef]
- Yang, M.Q.; Li, D.Z.; Wen, J.; Yi, T.S. Phylogeny and biogeography of the amphi-Pacific genus Aphananthe. PLoS ONE 2017, 12, e0171405. [Google Scholar] [CrossRef] [PubMed]
- Ye, G.; Fan, M.; Huang, C. Ellagic acid glycosides from the stem bark of Aphananthe aspera. Chem. Nat. Comp. 2007, 43, 558–559. [Google Scholar] [CrossRef]
- Sun, J.; Gao, Q.; Li, X.B.; Tang, F.; Li, C.X. Antiproliferative constituents from Aphananthe aspera leaves. Phytochem. Lett. 2017, 21, 247–250. [Google Scholar] [CrossRef]
- Lee, H.Y.; Kwon, J.T.; Koh, M.; Cho, M.H.; Park, S.B. Enhanced efficacy of 7-hydroxy-3-methoxycadalene via glycosylation in in vivo xenograft study. Bioorg. Med. Chem. Lett. 2007, 17, 6335–6339. [Google Scholar] [CrossRef] [PubMed]
- Kang, H.J.; Jang, Y.J. Selective apoptotic effect of Zelkova serrata twig extract on mouth epidermoid carcinoma through p53 activation. J. Oral. Sci. 2012, 4, 78–84. [Google Scholar] [CrossRef] [PubMed]
- Farag, M.A.; Sakna, S.T.; El-fiky, N.M.; Shabana, M.M.; Wessjohann, L. Phytochemical, antioxidant and antidiabetic evaluation of eight Bauhinia, L. species from Egypt using UHPLC–PDA–qTOF-MS and chemometrics. Phytochemistry 2015, 119, 41–50. [Google Scholar] [CrossRef] [PubMed]
- Roldan, M.V.G.; Engel, B.; de Vos, R.C.; Vereijken, P.; Astola, L.; Groenenboom, M. Metabolomics reveals organ-specific metabolic rearrangements during early tomato seedling development. Metabolomics 2014, 10, 958–974. [Google Scholar] [CrossRef] [Green Version]
- Lin, L.Z.; Harnly, J.M. Phenolic compounds and chromatographic profiles of pear skins (Pyrus spp.). J. Agric. Food Chem. 2008, 56, 9094–9101. [Google Scholar] [CrossRef] [PubMed]
- La Barbera, G.; Capriotti, A.L.; Cavaliere, C.; Piovesana, S.; Samperi, R.; Chiozzi, R.Z.; Laganà, A. Comprehensive polyphenol profiling of a strawberry extract (Fragaria × ananassa) by ultra-high-performance liquid chromatography coupled with high-resolution mass spectrometry. Anal. Bioanal. Chem. 2017, 409, 2127–2142. [Google Scholar] [CrossRef] [PubMed]
- D′Urso, G.; Pizza, C.; Piacente, S.; Montoro, P. Combination of LC–MS based metabolomics and antioxidant activity for evaluation of bioactive compounds in Fragaria vesca leaves from Italy. J. Pharm. Biomed. Anal. 2018, 150, 233–240. [Google Scholar] [CrossRef] [PubMed]
- Giannasi, D.E. Generic relationships in the Ulmaceae based on flavonoid chemistry. Taxon 1978, 331–344. [Google Scholar] [CrossRef]
- Santamour, F.S., Jr. Flavonoid distribution in Zelkova [landscape tree in the United States]. J. Arbori. 1983, 27, 331–344. [Google Scholar]
- Stobiecki, M.; Skirycz, A.; Kerhoas, L.; Kachlicki, P.; Muth, D.; Einhorn, J. Profiling of phenolic glycosidic conjugates in leaves of Arabidopsis thaliana using LC/MS. Metabolomics 2006, 2, 197–219. [Google Scholar] [CrossRef]
- Son, S.Y.; Kim, N.K.; Lee, S.; Singh, D.; Kim, G.R.; Lee, J.S.; Lee, C.H. Metabolite fingerprinting, pathway analyses, and bioactivity correlations for plant species belonging to the Cornaceae, Fabaceae, and Rosaceae families. Plant Cell Rep. 2016, 35, 1917–1931. [Google Scholar] [CrossRef] [PubMed]
- Zhang, Y.; Wang, D.; Yang, L.; Zhou, D.; Zhang, J. Purification and characterization of flavonoids from the leaves of Zanthoxylum bungeanum and correlation between their structure and antioxidant activity. PLoS ONE 2014, 9, e105725. [Google Scholar] [CrossRef] [PubMed]
- Heim, K.E.; Tagliaferro, A.R.; Bobilya, D.J. Flavonoid antioxidants: Chemistry, metabolism and structure-activity relationships. J. Nutr. Biochem. 2002, 13, 572–584. [Google Scholar] [CrossRef]
- Esatbeyoglu, T.; Wray, V.; Winterhalter, P. Isolation of dimeric, trimeric, tetrameric and pentameric procyanidins from unroasted cocoa beans (Theobroma cacao L.) using countercurrent chromatography. Food Chem. 2015, 179, 278–289. [Google Scholar] [CrossRef] [PubMed]
- Mendoza–Wilson, A.M.; Castro-Arredondo, S.I.; Balandrán-Quintana, R.R. Computational study of the structure–free radical scavenging relationship of procyanidins. Food Chem. 2014, 161, 155–161. [Google Scholar] [CrossRef] [PubMed]
- Da Silva Porto, P.A.L.; Laranjinha, J.A.N.; de Freitas, V.A.P. Antioxidant protection of low density lipoprotein by procyanidins: Structure/activity relationships. Biochem. Pharm. 2003, 66, 947–954. [Google Scholar] [CrossRef]
- Hamedeyazdan, S.; Niroumand, F.; Fathiazad, F. Phytochemical analysis and antioxidative properties of Centaurea albonitens. Res. J. Pharma. 2017, 4, 57–64. [Google Scholar]
- Betthauser, T.J.; Ellison, P.A.; Murali, D.; Lao, P.J.; Barnhart, T.E.; Furumoto, S.; Christian, B.T. Characterization of the radiosynthesis and purification of [18F] THK-5351, a PET ligand for neurofibrillary tau. Appl. Radiat. Isot. 2017, 130, 230–237. [Google Scholar] [CrossRef] [PubMed]
- Kuang, P.; Song, D.; Yuan, Q.; Yi, R.; Lv, X.; Liang, H. Separation and purification of sulforaphene from radish seeds using macroporous resin and preparative high-performance liquid chromatography. Food Chem. 2013, 136, 342–347. [Google Scholar] [CrossRef] [PubMed]
- Jung, E.S.; Lee, S.; Lim, S.H.; Ha, S.H.; Liu, K.H.; Lee, C.H. Metabolite profiling of the short-term responses of rice leaves (Oryza sativa cv. Ilmi) cultivated under different LED lights and its correlations with antioxidant activities. Plant Sci. 2013, 210, 61–69. [Google Scholar] [CrossRef] [PubMed]
Sample Availability: Samples of the compounds are not available from the authors. |


| No. | Tentative Identifications a | UHPLC-LTQ-ESI-IT-MS/MS | UPLC-Q-TOF-MS | I.D. e | |||||||
|---|---|---|---|---|---|---|---|---|---|---|---|
| tR b(min) | Measured Mass (m/z) | [M − H]−MS n Fragments (m/z) c | UV (nm) | Measured Mass (m/z) [M − H]− | Elemental Composition [M − H]− | mDa | i-FIT (norm) d | ||||
| [M − H]− | [M + H]+ | ||||||||||
| Flavonoids | |||||||||||
| 1 | Quercetin O-rhamnosyl rutinoside ** | 6.60 | 755 | 757 | 755 > 737, 609, 591, 489, 343, 301, 271 | 267sh, 366sh f | 755.2042 | C33H39O20 | 0.7 | 0.102 | Ref. [15] |
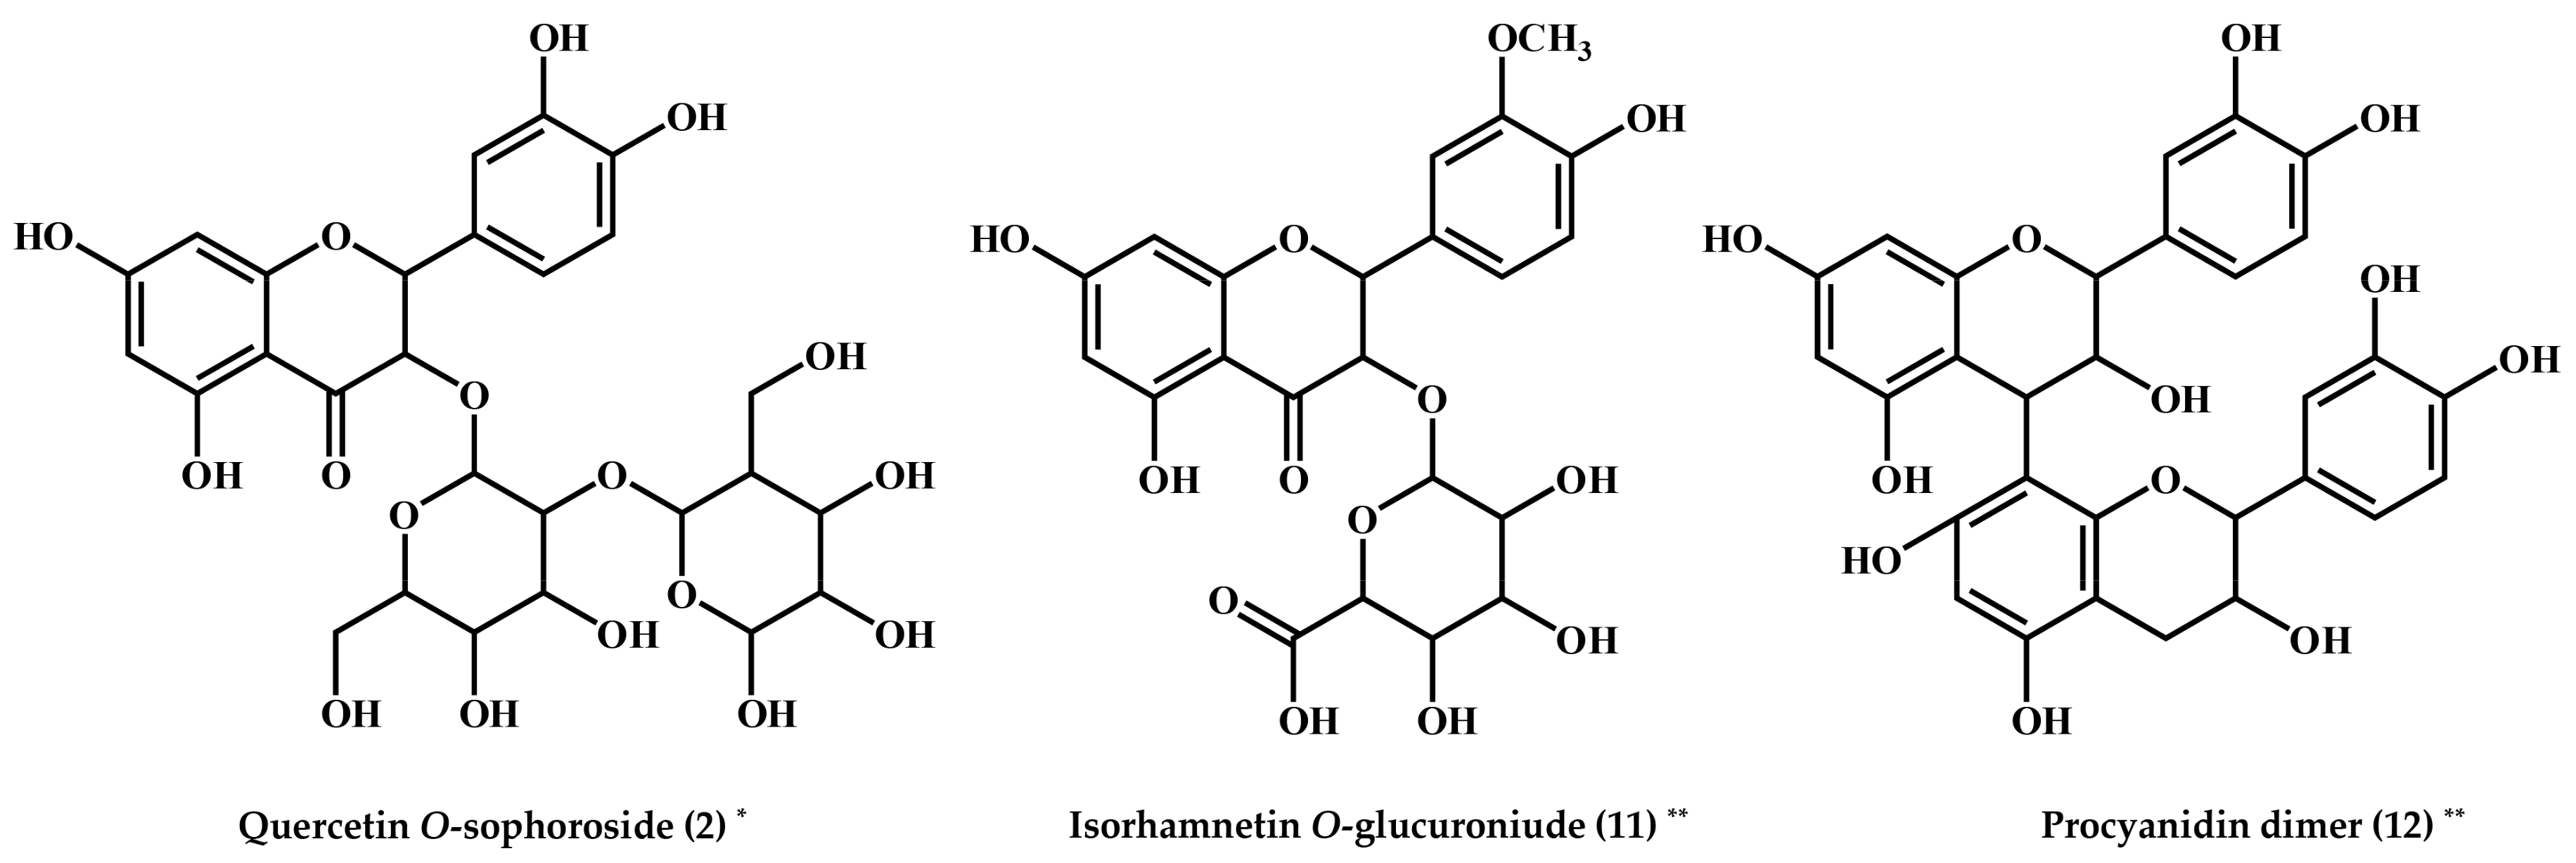
| 2 | Quercetin O-sophoroside * | 6.62 | 625 | 627 | 625 > 505, 463, 445, 301, 271, 255 | 266sh, 366sh | 625.1405 | C27H29O17 | 0.4 | 2.215 | Ref. [16] |
| 3 | Kaempferol O-rhamnosyl-rutinoside * | 7.09 | 739 | 741 | 739 > 693, 593, 575, 393, 285, 255 | 256, 355 | 739.1663 | C33H39O19 | 0.6 | 0.726 | Ref. [15] |
| 4 | Quercetin O-rutinoside * | 7.45 | 609 | 611 | 609 > 301 > 273, 257, 179, 151 | 256, 354 | 609.1456 | C27H29O16 | −2.0 | 1.482 | LIB |
| 5 | Quercetin O−glucuronide ** | 7.68 | 477 | 479 | 477 > 301 > 273, 257, 179 > 151 | 281, 316sh | 477.0669 | C21H17O13 | 0.3 | 0.260 | Ref. [15,19] |
| 6 | Quercetin O-glucoside * | 7.69 | 463 | 465 | 463 > 301 > 273, 257, 179 > 151 | 265, 346, 366sh | 463.0877 | C21H19O12 | −0.1 | 0.258 | LIB |
| 7 | Kaempferol O-rutinoside * | 7.85 | 593 | 595 | 593 > 285 > 267, 257, 229, 213, 179, 163 | 266, 346 | 593.1506 | C27H29O15 | 1.1 | 0.171 | Ref. [15,16,17] |
| 8 | Isorhamnetin O-rutinoside * | 7.94 | 623 | 625 | 623 > 315 > 300, 287 > 271, 255 | 281, 366sh | 623.1612 | C28H31O16 | −0.7 | 0.523 | Ref. [15,17,19] |
| 9 | Quercetin O-(malonyl)-glucoside * | 7.99 | 549 | 551 | 549 > 505 > 463, 301 > 273, 257, 179, 151 | 281, 381sh | 549.0880 | C24H21O15 | 0.4 | 0.261 | Ref. [17] |
| 10 | Kaempferol O-glucoside * | 8.12 | 447 | 449 | 447 > 327, 285 > 267, 257, 241 > 239, 229, 163 | 281, 334sh | 447.0927 | C21H19O11 | 0.1 | 1.485 | LIB |
| 11 | Isorhamnetin O-glucuronide ** | 8.36 | 491 | 493 | 491 > 315 > 300 > 271, 255, 151 | 280, 325sh | 491.0826 | C22H19O13 | −0.1 | 0.341 | Ref. [18] |
| 12 | Procyanidin dimer ** | 8.43 | 575 | 577 | 575 > 449, 437, 394, 287 | 281, 319sh | 575.1190 | C30H23O12 | −0.2 | 2.055 | Ref. [19] |
| 13 | Kaempferol O-(malonyl)-glucoside * | 8.46 | 533 | 535 | 533 > 489 > 285 > 267, 257, 229, 197, 163 | 279sh, 327sh | 533.0931 | C24H21O14 | 0.1 | 1.343 | Ref. [17] |
| Non-Identified | |||||||||||
| 14 | N.I. 1 ** | 7.36 | 567 | 569 | 567 > 521, 405, 359, 341, 329 | 256, 354 | 567.2078 | C27H35O13 | 1.9 | 2.412 | - |
| 15 | N.I. 2 * | 8.27 | 451 | 453 | 451 > 341, 299 > 323, 297, 231, 217, 177 | 270, 351sh | 451.1026 | C24H19O9 | −0.3 | 1.235 | - |
| 16 | N.I. 3 ** | 8.57 | 625 | 627 | 625 > 607, 540, 463, 445, 415, 397, 227 | 281 | 625.2708 | C27H45O16 | 0.0 | 0.325 | - |
| 17 | N.I. 4 ** | 8.77 | 551 | 553 | 551 > 389, 329, 227 | 281 | 551.2336 | C24H39O14 | −0.4 | 2.612 | - |
© 2018 by the authors. Licensee MDPI, Basel, Switzerland. This article is an open access article distributed under the terms and conditions of the Creative Commons Attribution (CC BY) license (http://creativecommons.org/licenses/by/4.0/).
Share and Cite
Won, J.Y.; Son, S.Y.; Lee, S.; Singh, D.; Lee, S.; Lee, J.S.; Lee, C.H. Strategy for Screening of Antioxidant Compounds from Two Ulmaceae Species Based on Liquid Chromatography-Mass Spectrometry. Molecules 2018, 23, 1830. https://doi.org/10.3390/molecules23071830
Won JY, Son SY, Lee S, Singh D, Lee S, Lee JS, Lee CH. Strategy for Screening of Antioxidant Compounds from Two Ulmaceae Species Based on Liquid Chromatography-Mass Spectrometry. Molecules. 2018; 23(7):1830. https://doi.org/10.3390/molecules23071830
Chicago/Turabian StyleWon, Joong Yeun, Su Young Son, Sunmin Lee, Digar Singh, Sarah Lee, Jong Seok Lee, and Choong Hwan Lee. 2018. "Strategy for Screening of Antioxidant Compounds from Two Ulmaceae Species Based on Liquid Chromatography-Mass Spectrometry" Molecules 23, no. 7: 1830. https://doi.org/10.3390/molecules23071830