Article

Anthocyanin-Rich Sour Cherry Extract Attenuates the Lipopolysaccharide-Induced Endothelial Inflammatory Response

1
Institute of Animal Science, Biotechnology and Nature Conservation, Institute of Food Technology, University of Debrecen, H-4032 Debrecen, Hungary
2
Department of Pharmacology and Pharmacotherapy, University of Debrecen, H-4032 Debrecen, Hungary
3
Department of Biophysics and Cell Biology, Faculty of Medicine, University of Debrecen, H-4032 Debrecen, Hungary
4
Department of Obstetrics and Gynaecology, University of Debrecen, H-4032 Debrecen, Hungary
*
Author to whom correspondence should be addressed.
Molecules 2019, 24(19), 3427; https://doi.org/10.3390/molecules24193427
Submission received: 14 August 2019 / Revised: 10 September 2019 / Accepted: 19 September 2019 / Published: 21 September 2019
(This article belongs to the Special Issue Anthocyanins: Recent Progress in Health Benefits Studies)

Abstract

:
The anthocyanin content of Hungarian sour cherry is remarkable based on our preliminary investigations. Nutraceutical and pharmaceutical effects of anthocyanins have been extensively studied. The objective of this work was to investigate the the effect of purified sour cherry extract using human umbilical cord vein endothelial cells (HUVECs) as the inflammatory model. HUVECs were isolated by enzymatic digestion and characterized by flow cytometry. The optimal concentration range of sour cherry extract was selected based on MTT, apoptosis, and necrosis assays. Cells were divided into three groups, incubating with M199 medium as control, or with lipopolysaccharide (LPS) or with LPS plus anthocyanin extract (ACE). The effect of sour cherry extract on oxidative stress, pro-inflammatory factors, and arachidonic pathway was investigated. An amount of 50 μg/mL ACE (ACE50) was able to increase the level of glutathione and decrease the ROS, thereby improving the unbalanced redox status in inflammation. ACE50 lowered pro-inflammatory cytokine levels including Interleukin-6 (IL-6), regulated on activation, normal T cell expressed and secreted (RANTES), granulocyte-macrophage colony-stimulating factor (GM-CSF), and tumor necrosis factor alpha (TNF-α). ACE50 affected the arachidonic acid pathway by reducing the LPS-induced enzyme expression (cyclooxygenase-1, cyclooxygenase-2, and prostacyclin synthase). The extract under investigation seems to have a pleiotropic effect including anti-oxidative, anti-inflammatory, hemostatic, and vasoactive effects. Our results indicate that purified sour cherry extract could reduce the LPS-induced inflammatory response, thereby improving endothelial dysfunction.

Graphical Abstract

1. Introduction

Polyphenol compounds including flavonoids are secondary metabolic products of plants that play a protective role against different stress effects. Anthocyanins are a subgroup of flavonoids. Regarding chemical structure, they have a positive charge at the oxygen atom of the C-ring of the basic flavonoid structure. Anthocyanins are commonly found in flowers and fruits, and some of these plants have been traditionally used as colorants and food [1]. The main sources of anthocyanins are red berry fruits, red grapes, red wine, crops (e.g., purple maize), and different red cabbage varieties [2]. Current research trends clearly indicate that natural products are one of the most important sources of new drugs [3]. Anthocyanins are also used in traditional medicine for the treatment of various diseases. In recent decades, anthocyanin-related research has proved its beneficial health effects [4]. Until the beginning of the century, anthocyanins appeared in scientific reports as chemical structures with a high antioxidant capacity. However, today we know that apart from their antioxidant capacity they can modulate several signal transduction pathways [5]. Anthocyanins possess anti-inflammatory [6], antimicrobial [7], anticancer [8], antidiabetic [9], and anti-obesity effects [10], as well as the notable prevention impact on cardiovascular diseases (CVDs) [11]. Furthermore, anthocyanins can inhibit human salivary α-amylase and the growth of Streptococcus mutans [12].
It is well known that anthocyanins reach maximum blood concentration within 3 h. This fast process is due to rapid absorption by the stomach [13]. Then, anthocyanins eliminate readily from the plasma by liver degradation [14]. The biological availability is <2% [15]. The anthocyanin level in plasma seems to be high enough to perform its biological activity, especially for those specific targets such as endothelial cells in veins, where anthocyanins significantly modulate intracellular signal transduction pathways and gene control activities [16].
Many studies have focused on their defensive role in inflammation [17]. A randomized control trial also showed that the level of plasma IL-1β of hypercholesterolemic patients who consumed an anthocyanin mixture (320 mg/day) for six months was substantially lower compared to placebo [18]. An in vivo study indicated that lipopolysaccharide (LPS)-induced mice fed with 10% blueberries had attenuated expression of protein and mRNA of tumor necrosis factor alpha (TNF-α) and interleukin-6 (IL-6) in the blood serum compared to the control [19]. An in vitro study demonstrated decreasing IFN-α-induced (100 ng/mL) expressions of MCP-1, IL-6, and TNF-α in human monocytic THP-1 cells due to a treatment of 10 mg/mL anthocyanin-containing bilberry extract [20]. Another in vitro study highlighted the protective effect of purified sour cherry anthocyanin extract on cytokine-induced inflammatory caco-2 monolayers [21].
The investigated Hungarian sour cherry varieties synthetize anthocyanins in high concentration. They produce selective cyanidin glycosides, the main component being cyanidin-3-O-rutinoside [22]. Other research has shown a wide range of polyphenolic compounds of sour cherry extract identified by mass spectrometer coupled to liquid chromatography (LC-MS). That study also clarified that the main anthocyanin components of sour cherry are cyanidin-3-rutinoside, cyanidin-3-O-glucoside, and cyanidin-3-O-glucosyl-rutinoside [23]. In our present study, the effect of sour cherry anthocyanin extract (ACE) was investigated in an inflammatory model. Inflammation is a biological response of body tissues to harmful stimuli, such as pathogens, damaged cells, or irritants, by a very complex instrument in which reactive oxygen species (ROS), cytokine burst, paracrine agents, balance of vasodilatation and vasoconstriction compounds, and balance of hemostasis play significant roles [24]. Because human umbilical cord vein endothelial cells (HUVECs) have been extensively used to study the biology and pathobiology of various diseases including the inflammatory process [25], we applied HUVECs as an inflammatory model. Inflammatory response was induced by LPS, an endotoxin from the outer membrane of bacteria, which is routinely used to trigger inflammation.

2. Results

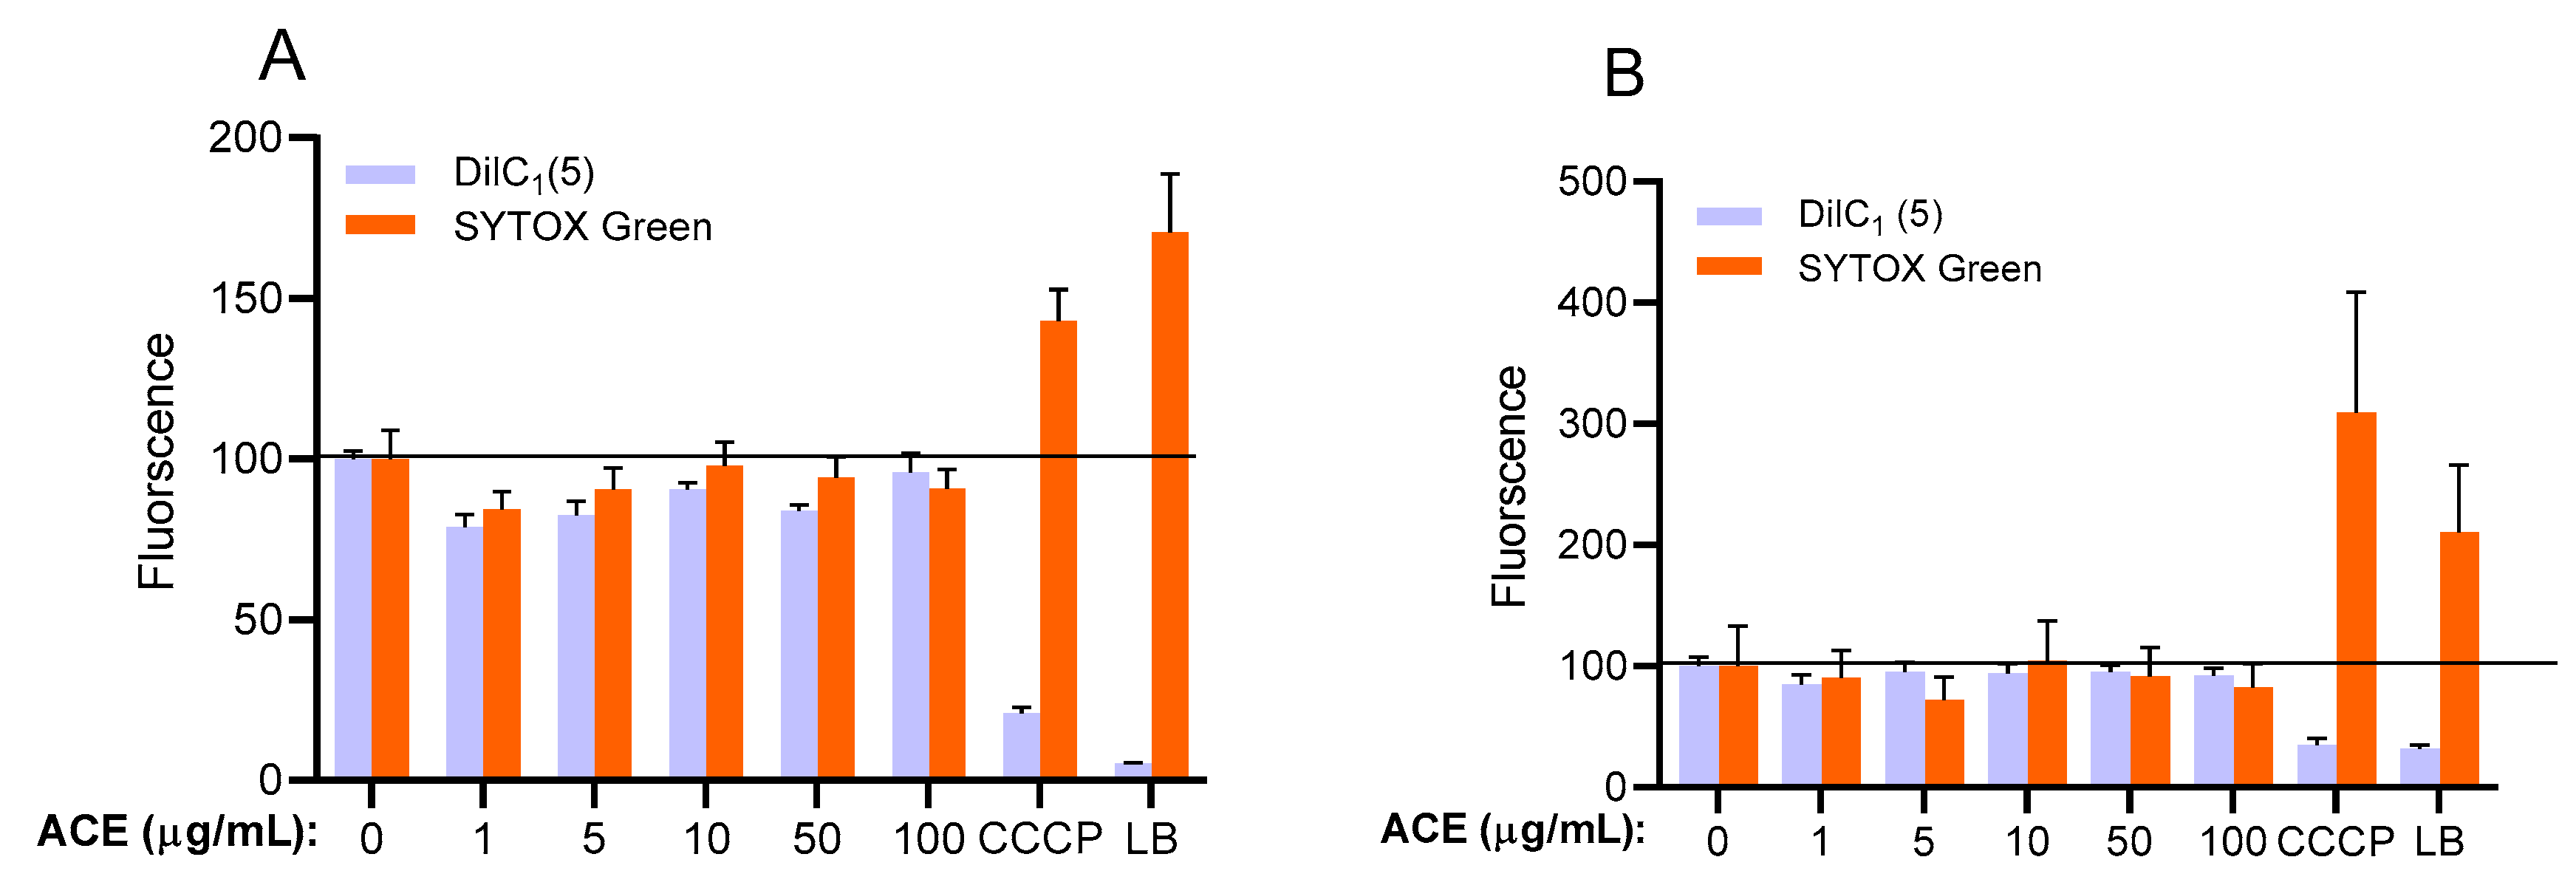
2.1. Flow Cytometric Measurements

HUVECs were characterized to positive and negative marker expression using flow cytometry and antibodies against specific marker proteins ICAM-1 (intracellular adhesion molecule 1, CD54), PECAM-1 (Platelet endothelial cell adhesion molecule 1, CD31), PTPRC (protein tyrosine phosphatase receptor type C, CD45) and VCAM-1 (vascular cell adhesion molecule 1, CD106). As shown in Figure 1, isolated HUVECs showed high CD54 and CD31 positive marker expression levels (approximately 90% double positive cells), whereas approximately 97% of the cells did not express CD45 and CD106 markers (Figure 1), strongly suggesting the high accuracy and efficiency of cell isolation.

2.2. Main Compounds of Purified Sour Cherry Extract

Figure 2 shows the main components of the investigated sour cherry extract.

2.3. Seeking of Optimal ACE Concentration

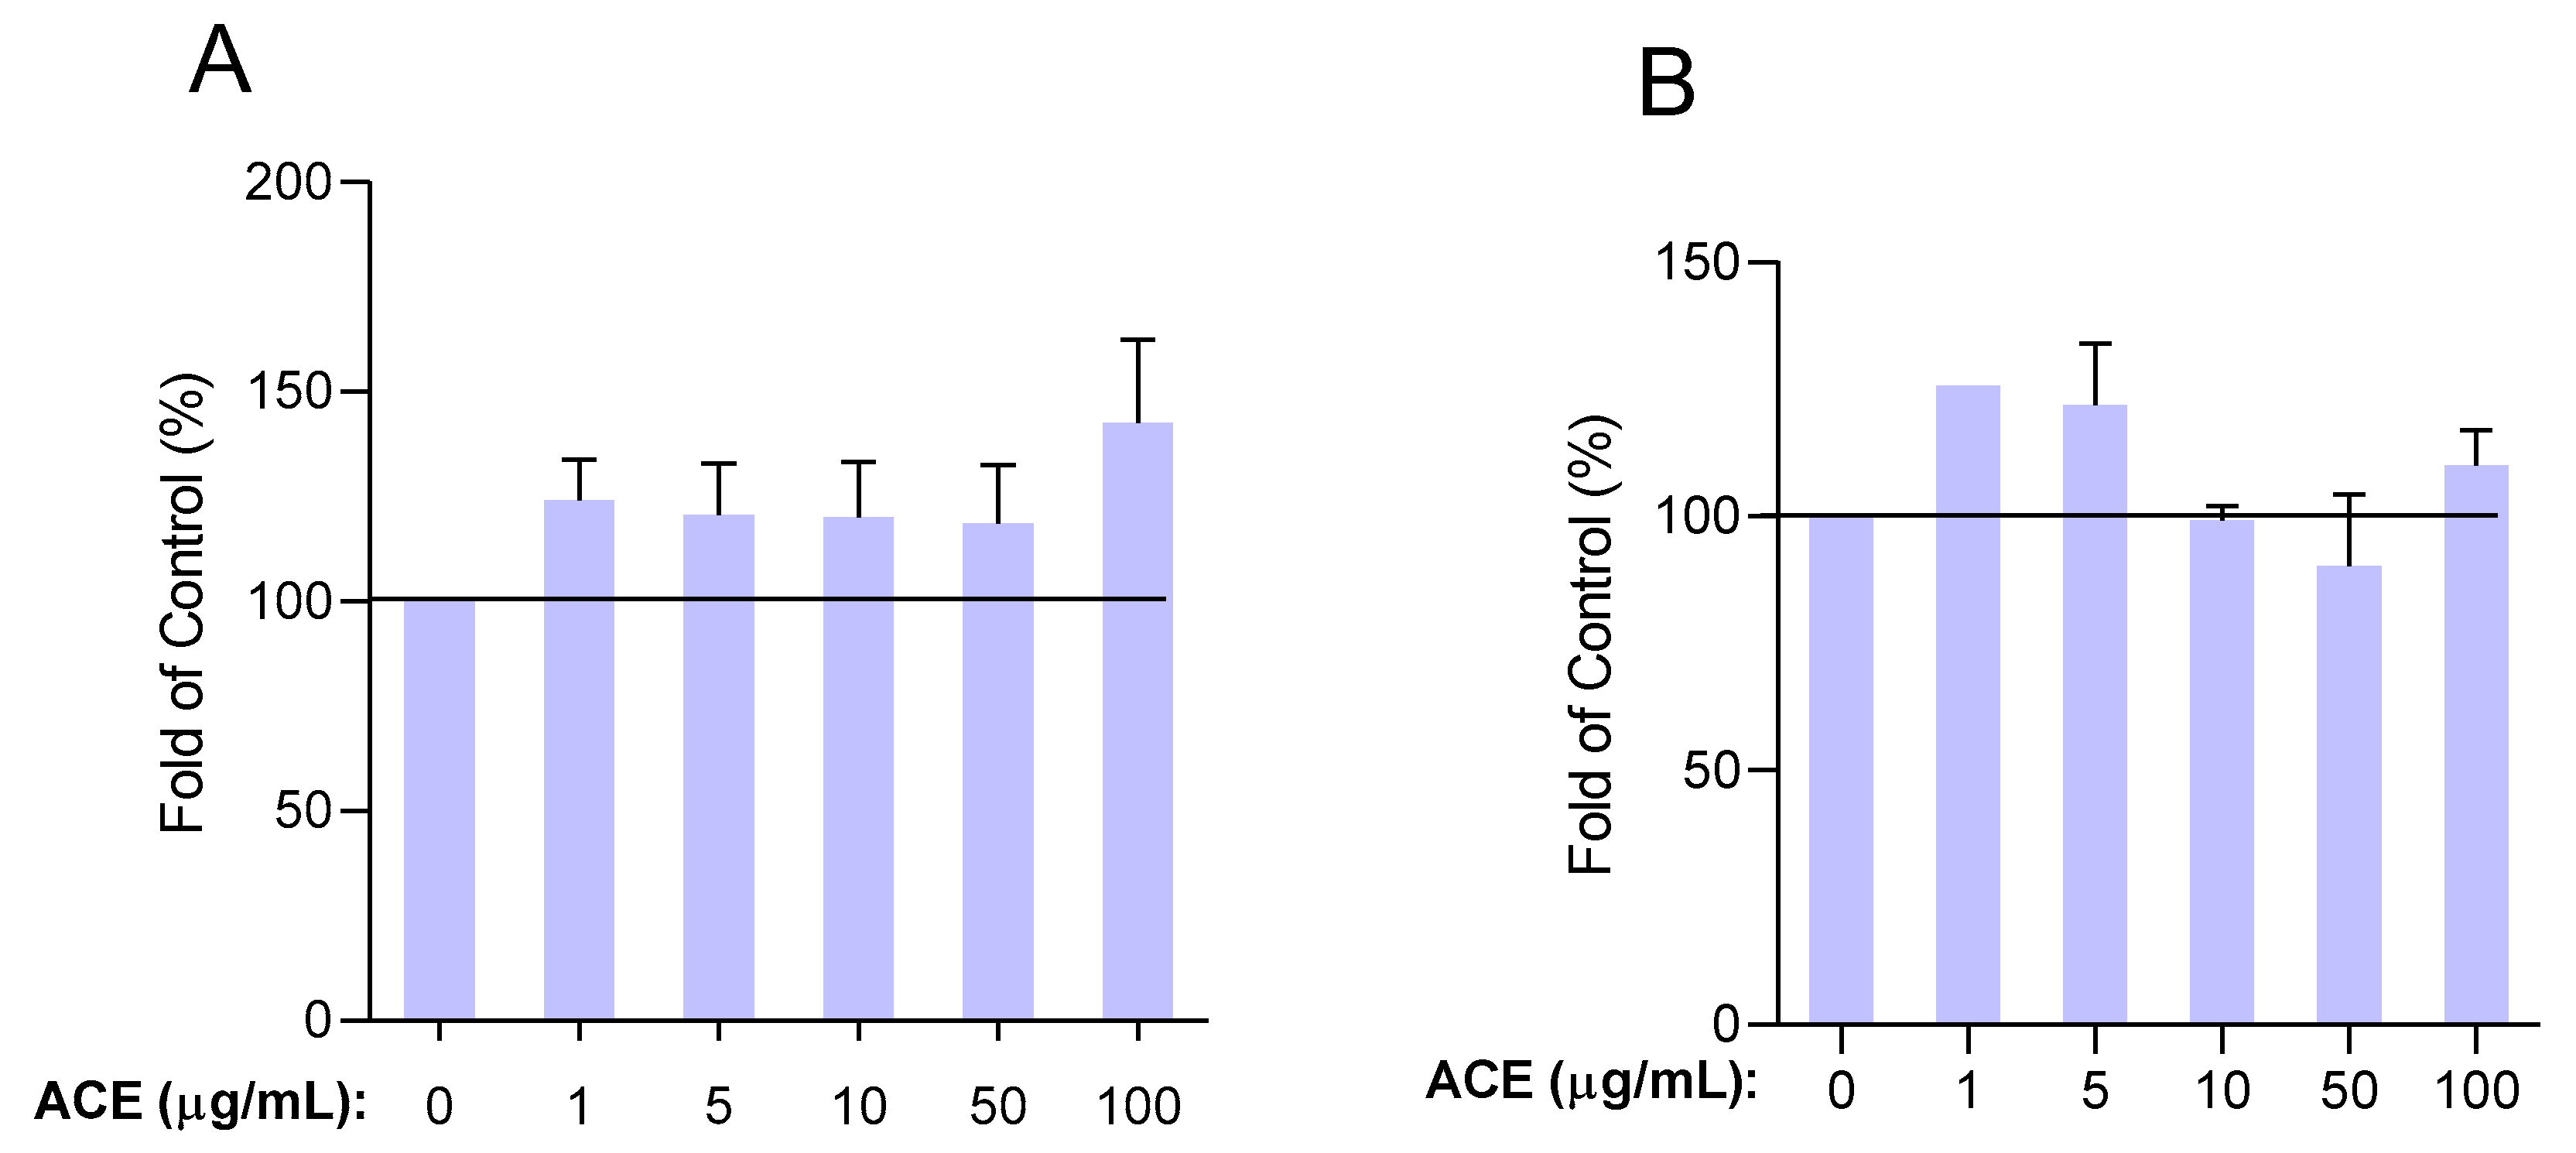
2.3.1. Up to 100 μg/mL, Survival Rate of HUVECs Was Not Altered by ACE Treatment

Prior to examining the effect of ACE on HUVECs, the effect of ACE on cell viability was evaluated. As shown in Figure 3, we found that ACE treatment at concentrations of 1, 5, 10, 50, and 100 μg/mL did not result in a significant change in viability of HUVECs. To confirm the promising results of the MTT assay, we also examined the potential apoptotic and necrotic effects of ACE using fluorescent labelling (DilC1(5) and SYTOX Green dyes) [26]. The results show that ACE did not induce apoptotic and necrotic events in this concentration range (Figure 4). These data suggest that the concentrations of ACE mentioned above can be used without the risk of any biologically relevant cytotoxic actions. According to our unpublished data, at higher concentrations of ACE (≥500 μg/mL) the viability of cells was substantially decreased and necrotic cell death was observed.

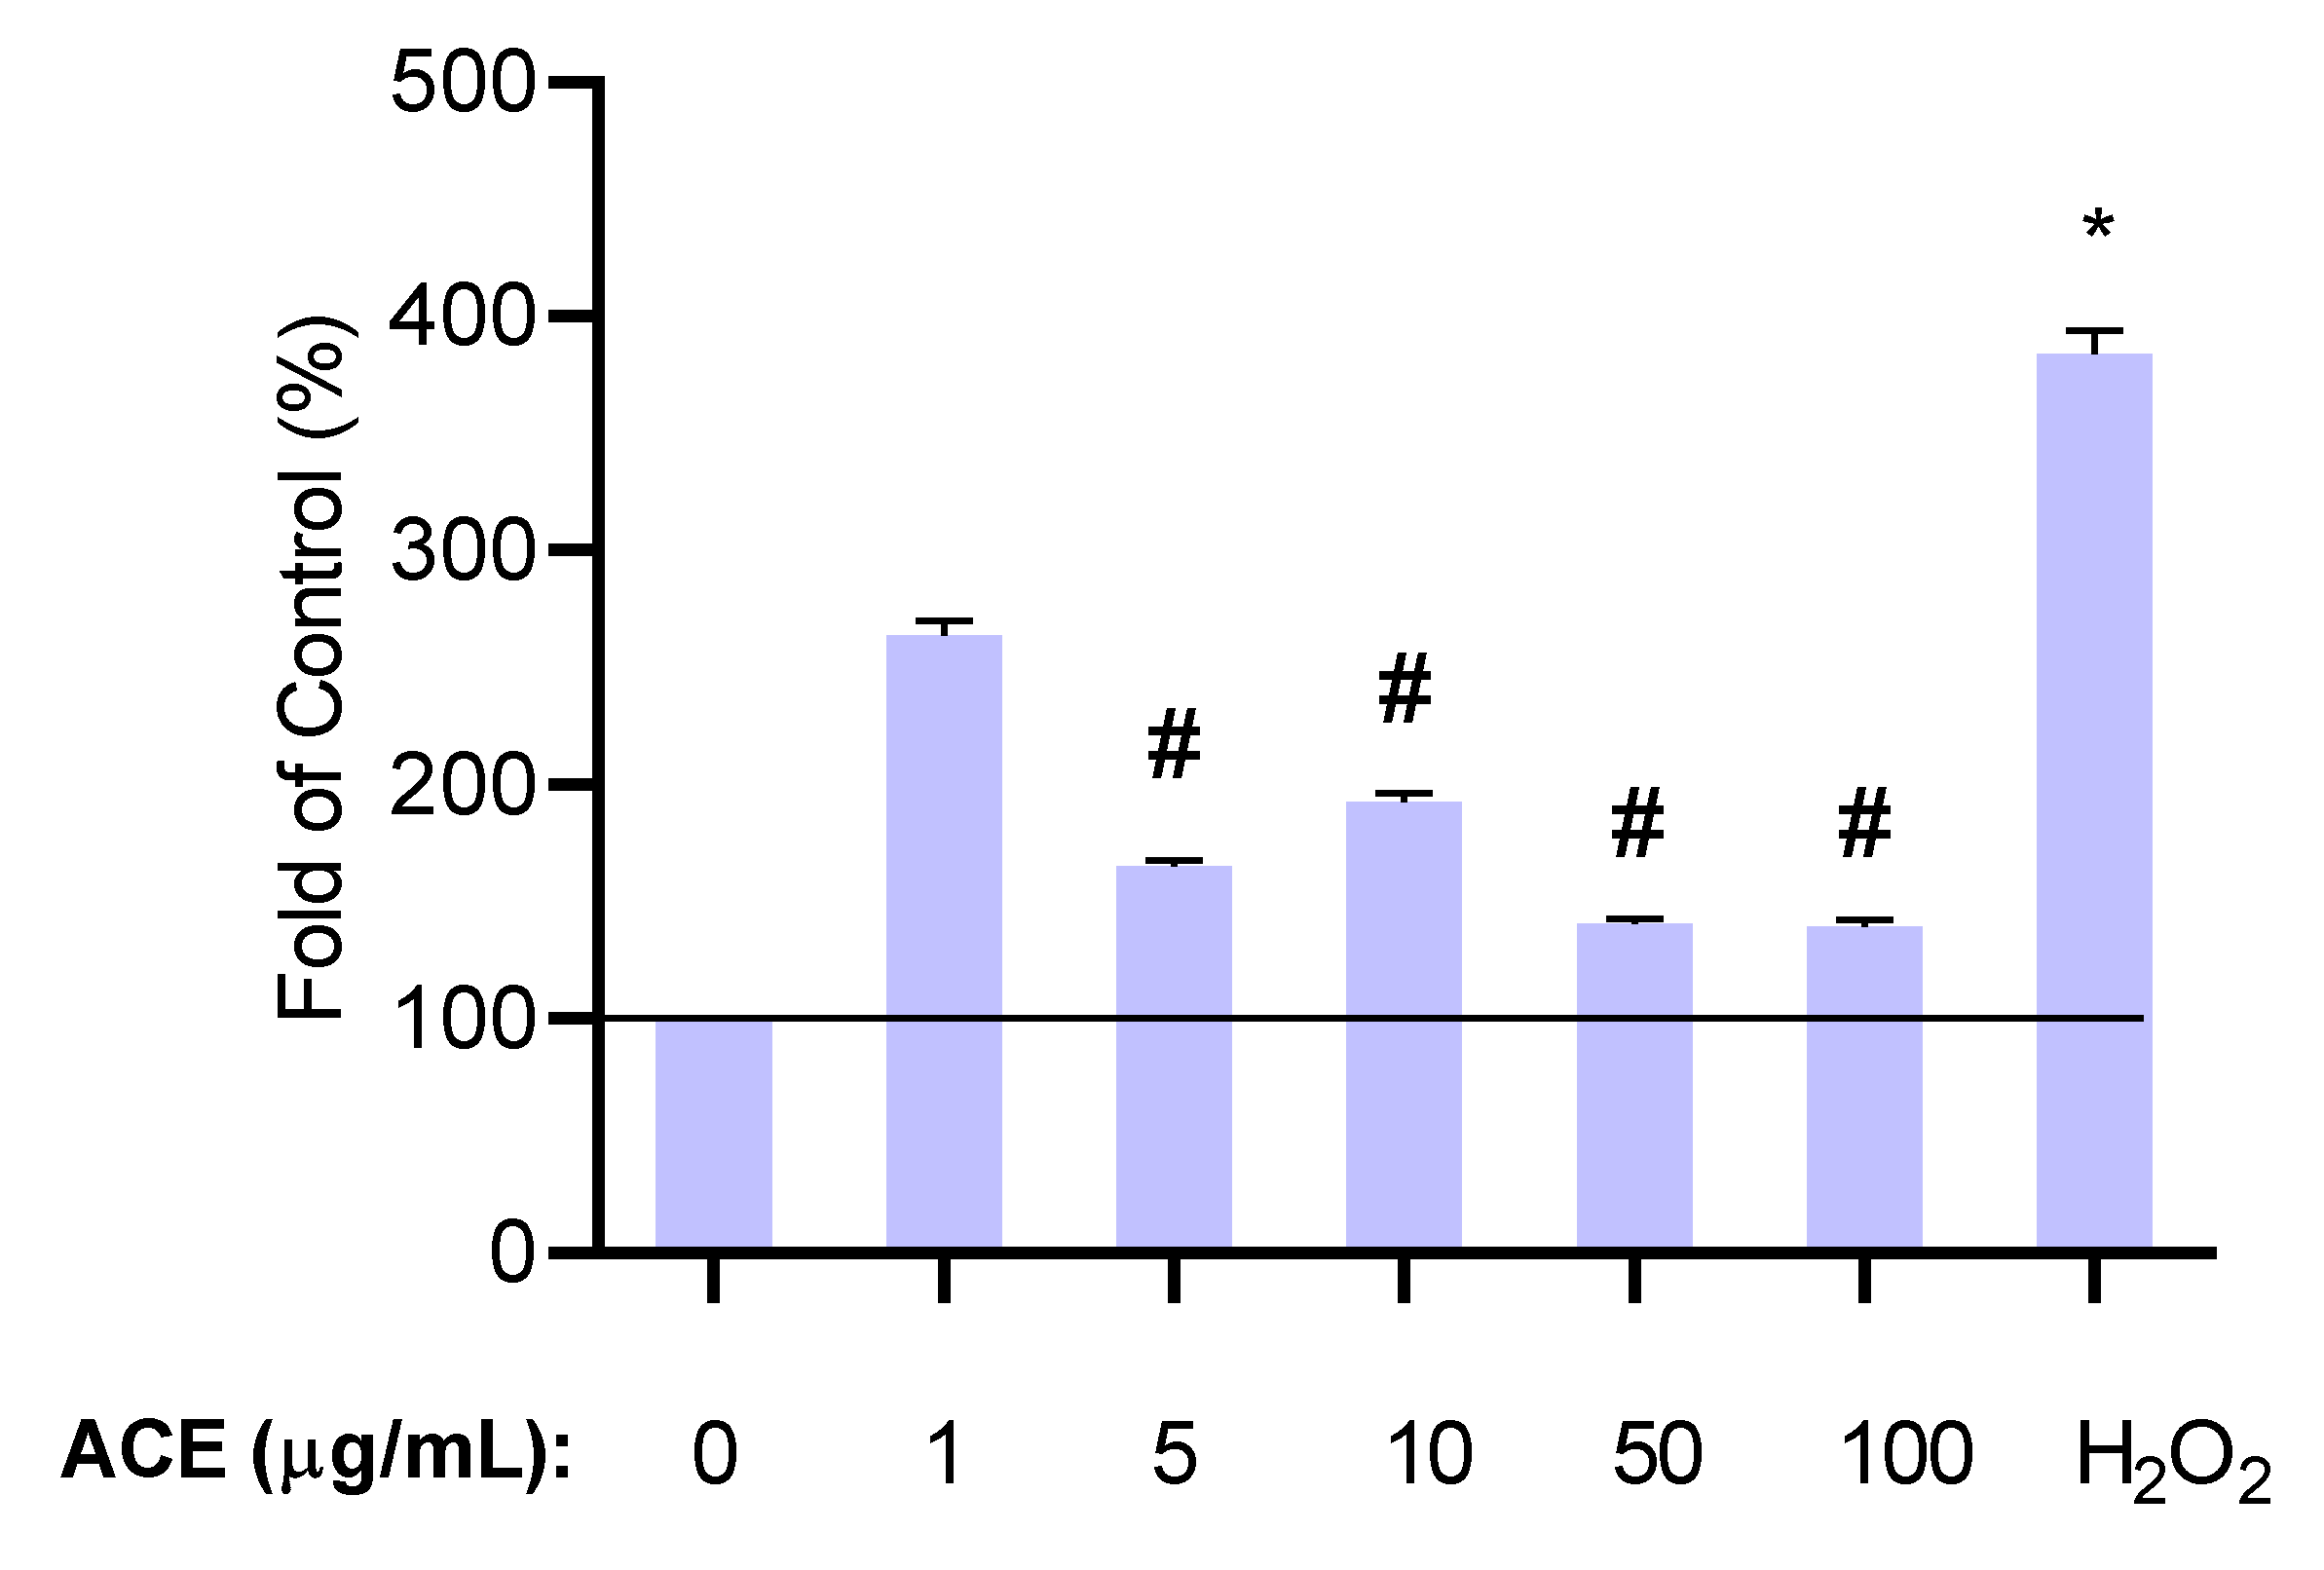
2.3.2. Determination of Effective Antioxidant Concentrations

To select the appropriate concentration for further experiments, we also examined the antioxidant effect of ACE. We wanted to exclude the possibility that ACE has insufficient antioxidant capacity at low concentrations indicating biological inactivity. Cells were treated with H2O2 and levels of reactive oxygen species (ROS) were evaluated. Amounts of 50 and 100 μg/mL were the most effective in eliminating ROS (Figure 5). Since the maximum absorption of the main components (cyaniding-3-O-rutinoside) of the ACE in the blood is closer to 50 μg/mL, this concentration was selected (ACE50) and applied for further experiments [27].

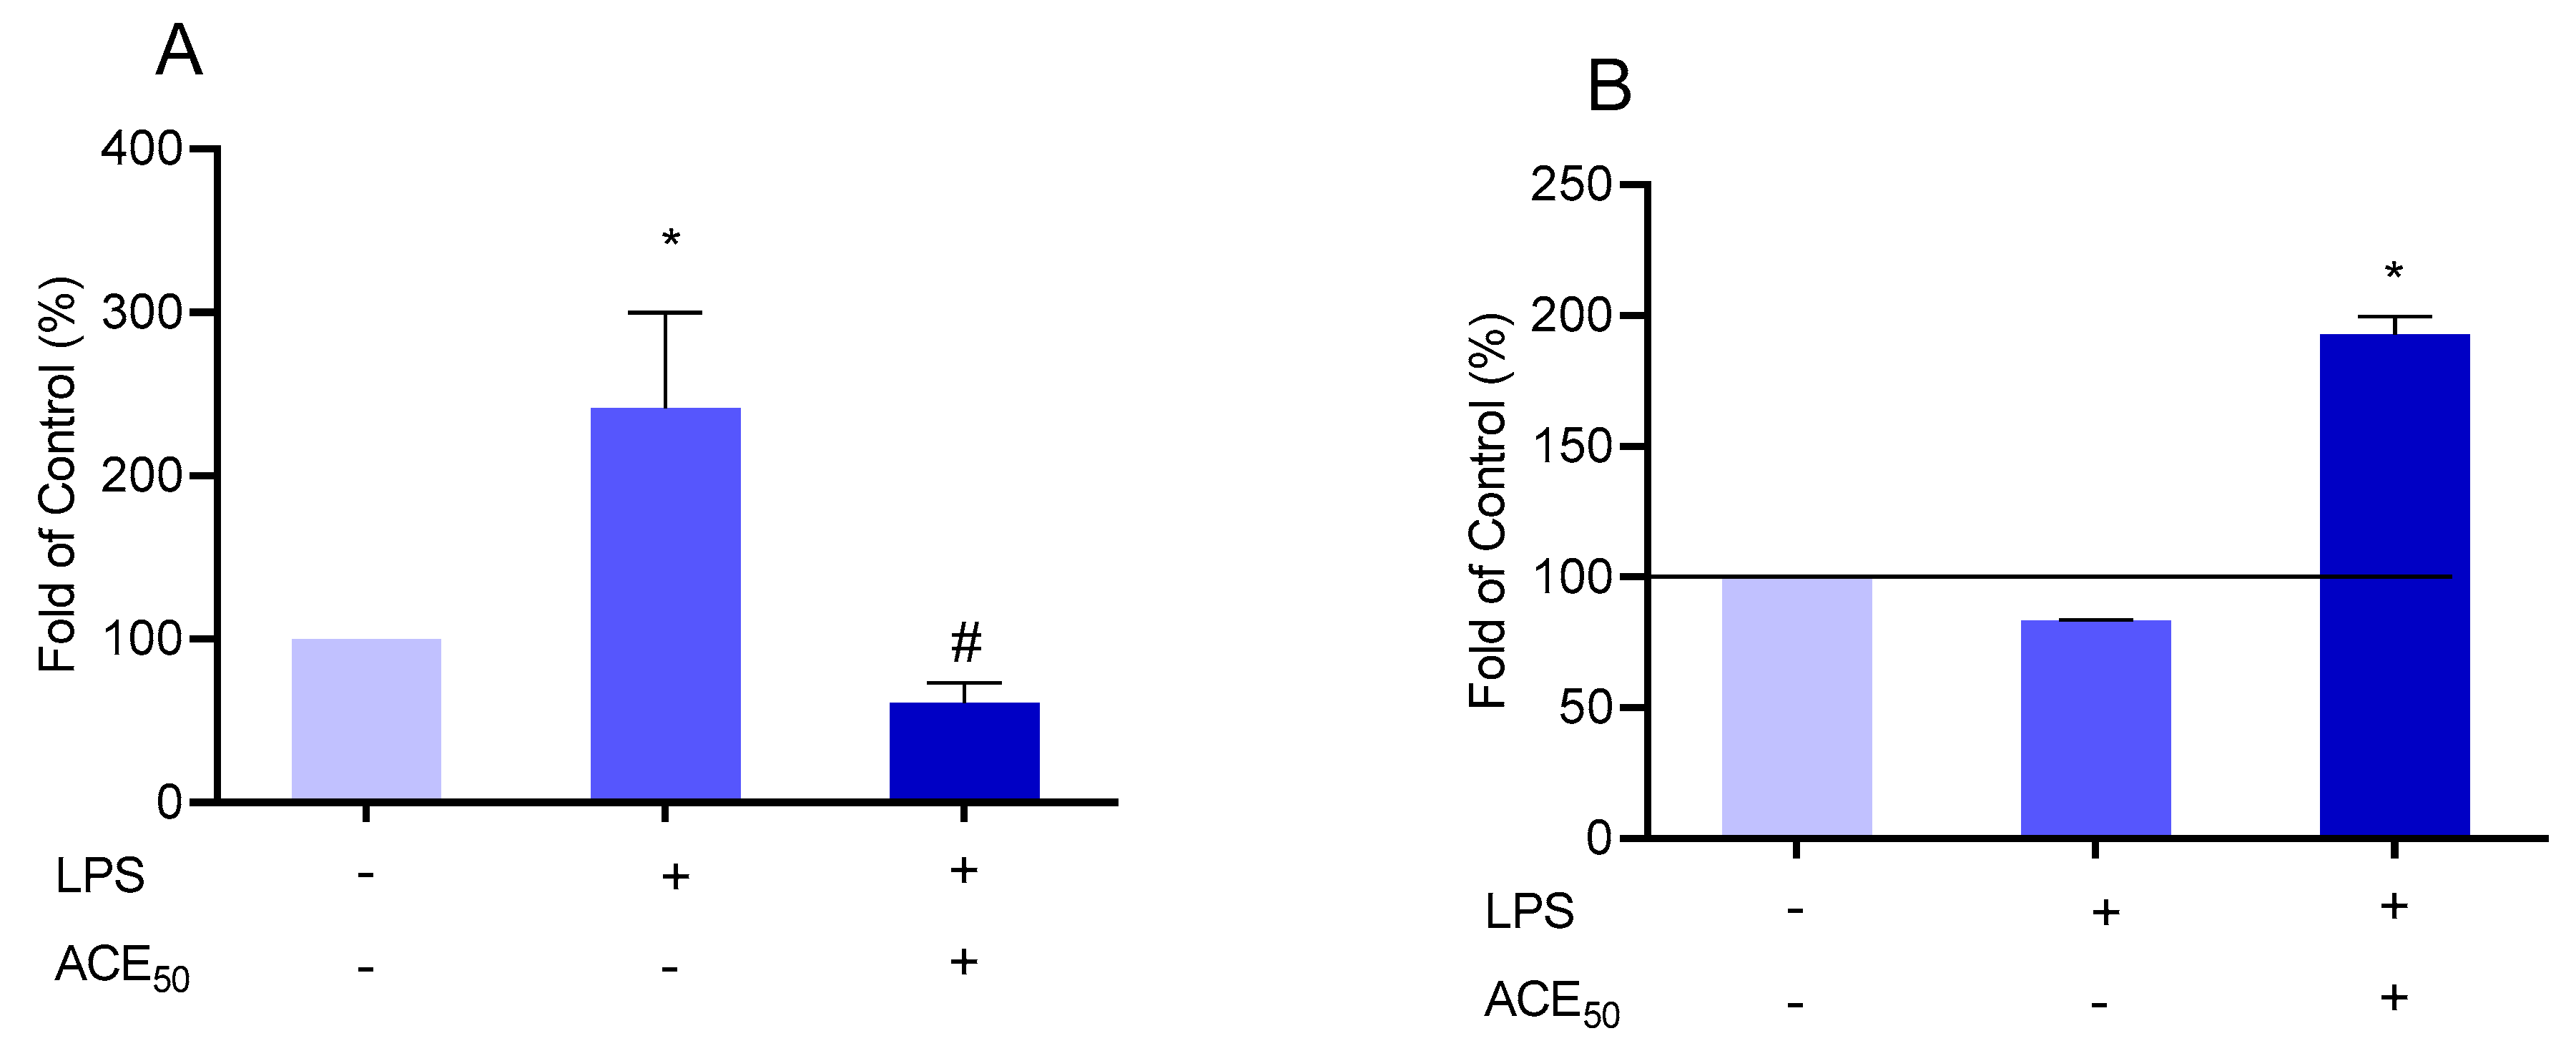
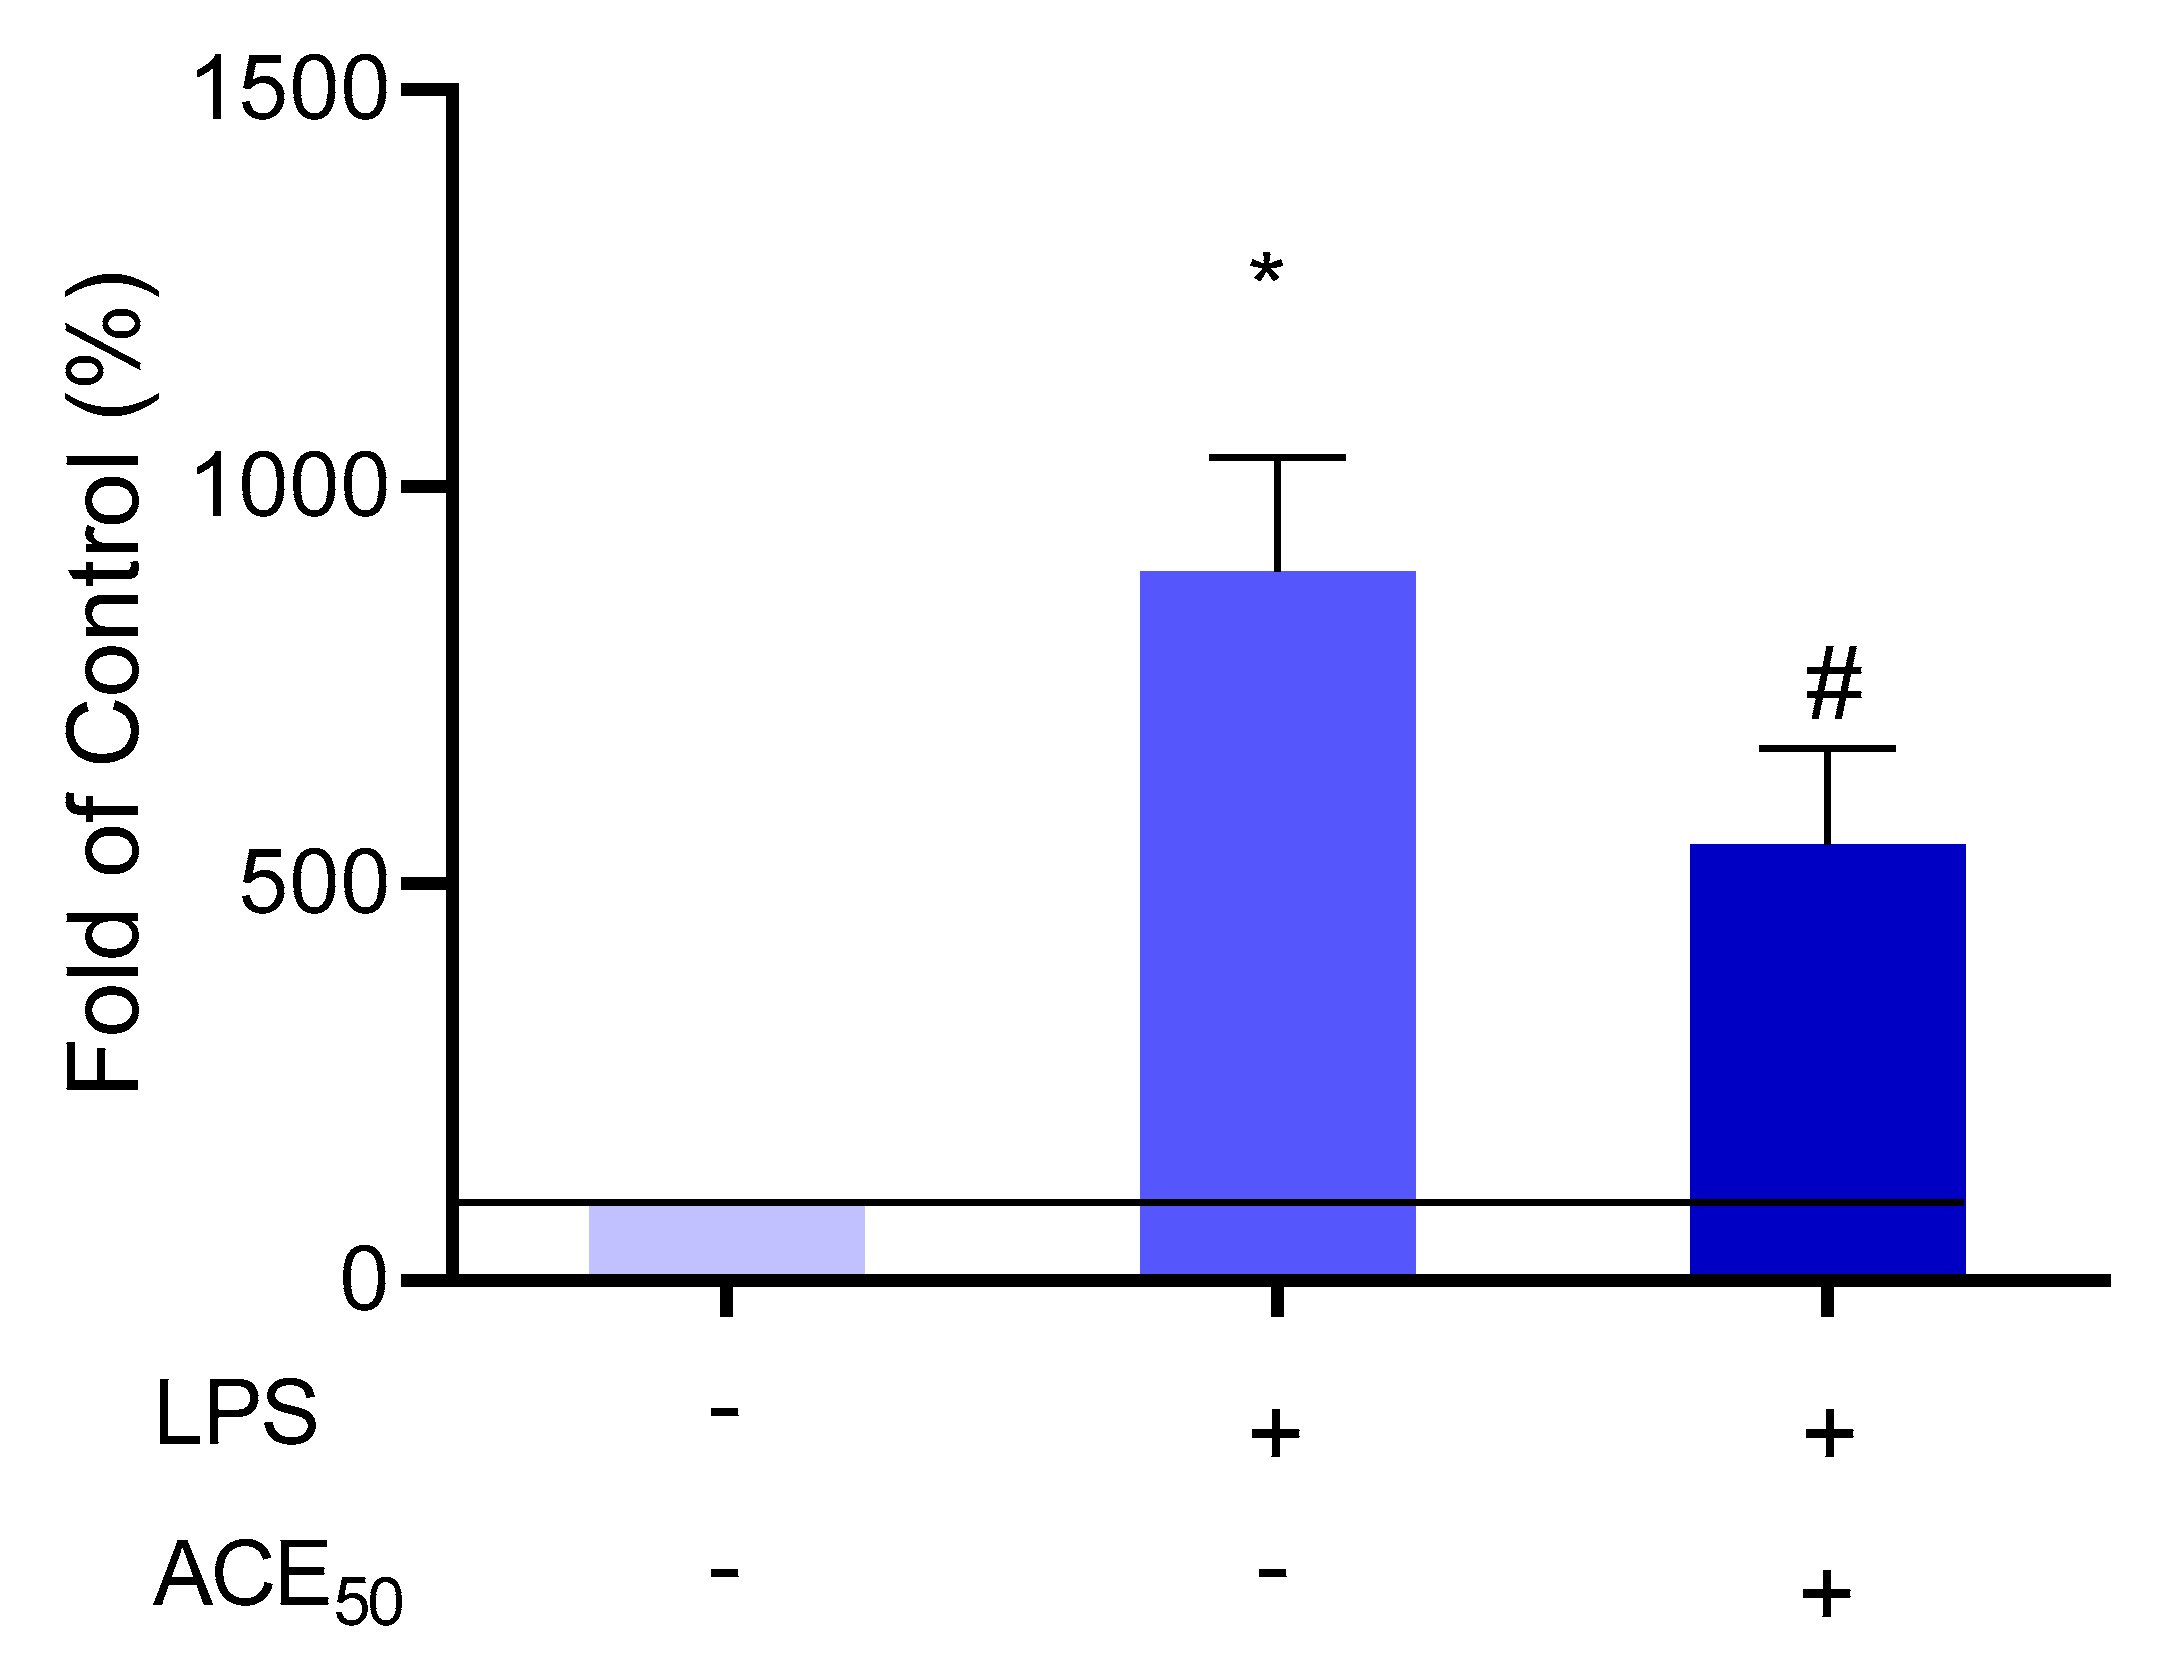
2.4. ACE50 Inhibits LPS-Induced ROS in HUVECs

ROS production plays a pivotal role in inflammation [28]. It is well known that anthocyanins have excellent antioxidant properties. The effect of ACE50 on the level of ROS in HUVECs was evaluated (Figure 6A). LPS induced a considerable ROS production in the HUVECs. Incubating HUVECs with ACE50 led to a decreased amount of ROS. We also examined the level of glutathione (GSH), which is a good indicator of the antioxidant status [29] (Figure 6B). The level of GSH was significantly higher after ACE50 treatment.
These observations indicate that ACE50 can improve the imbalance of pro- and anti-oxidative agents causing the alleviation of oxidative stress.

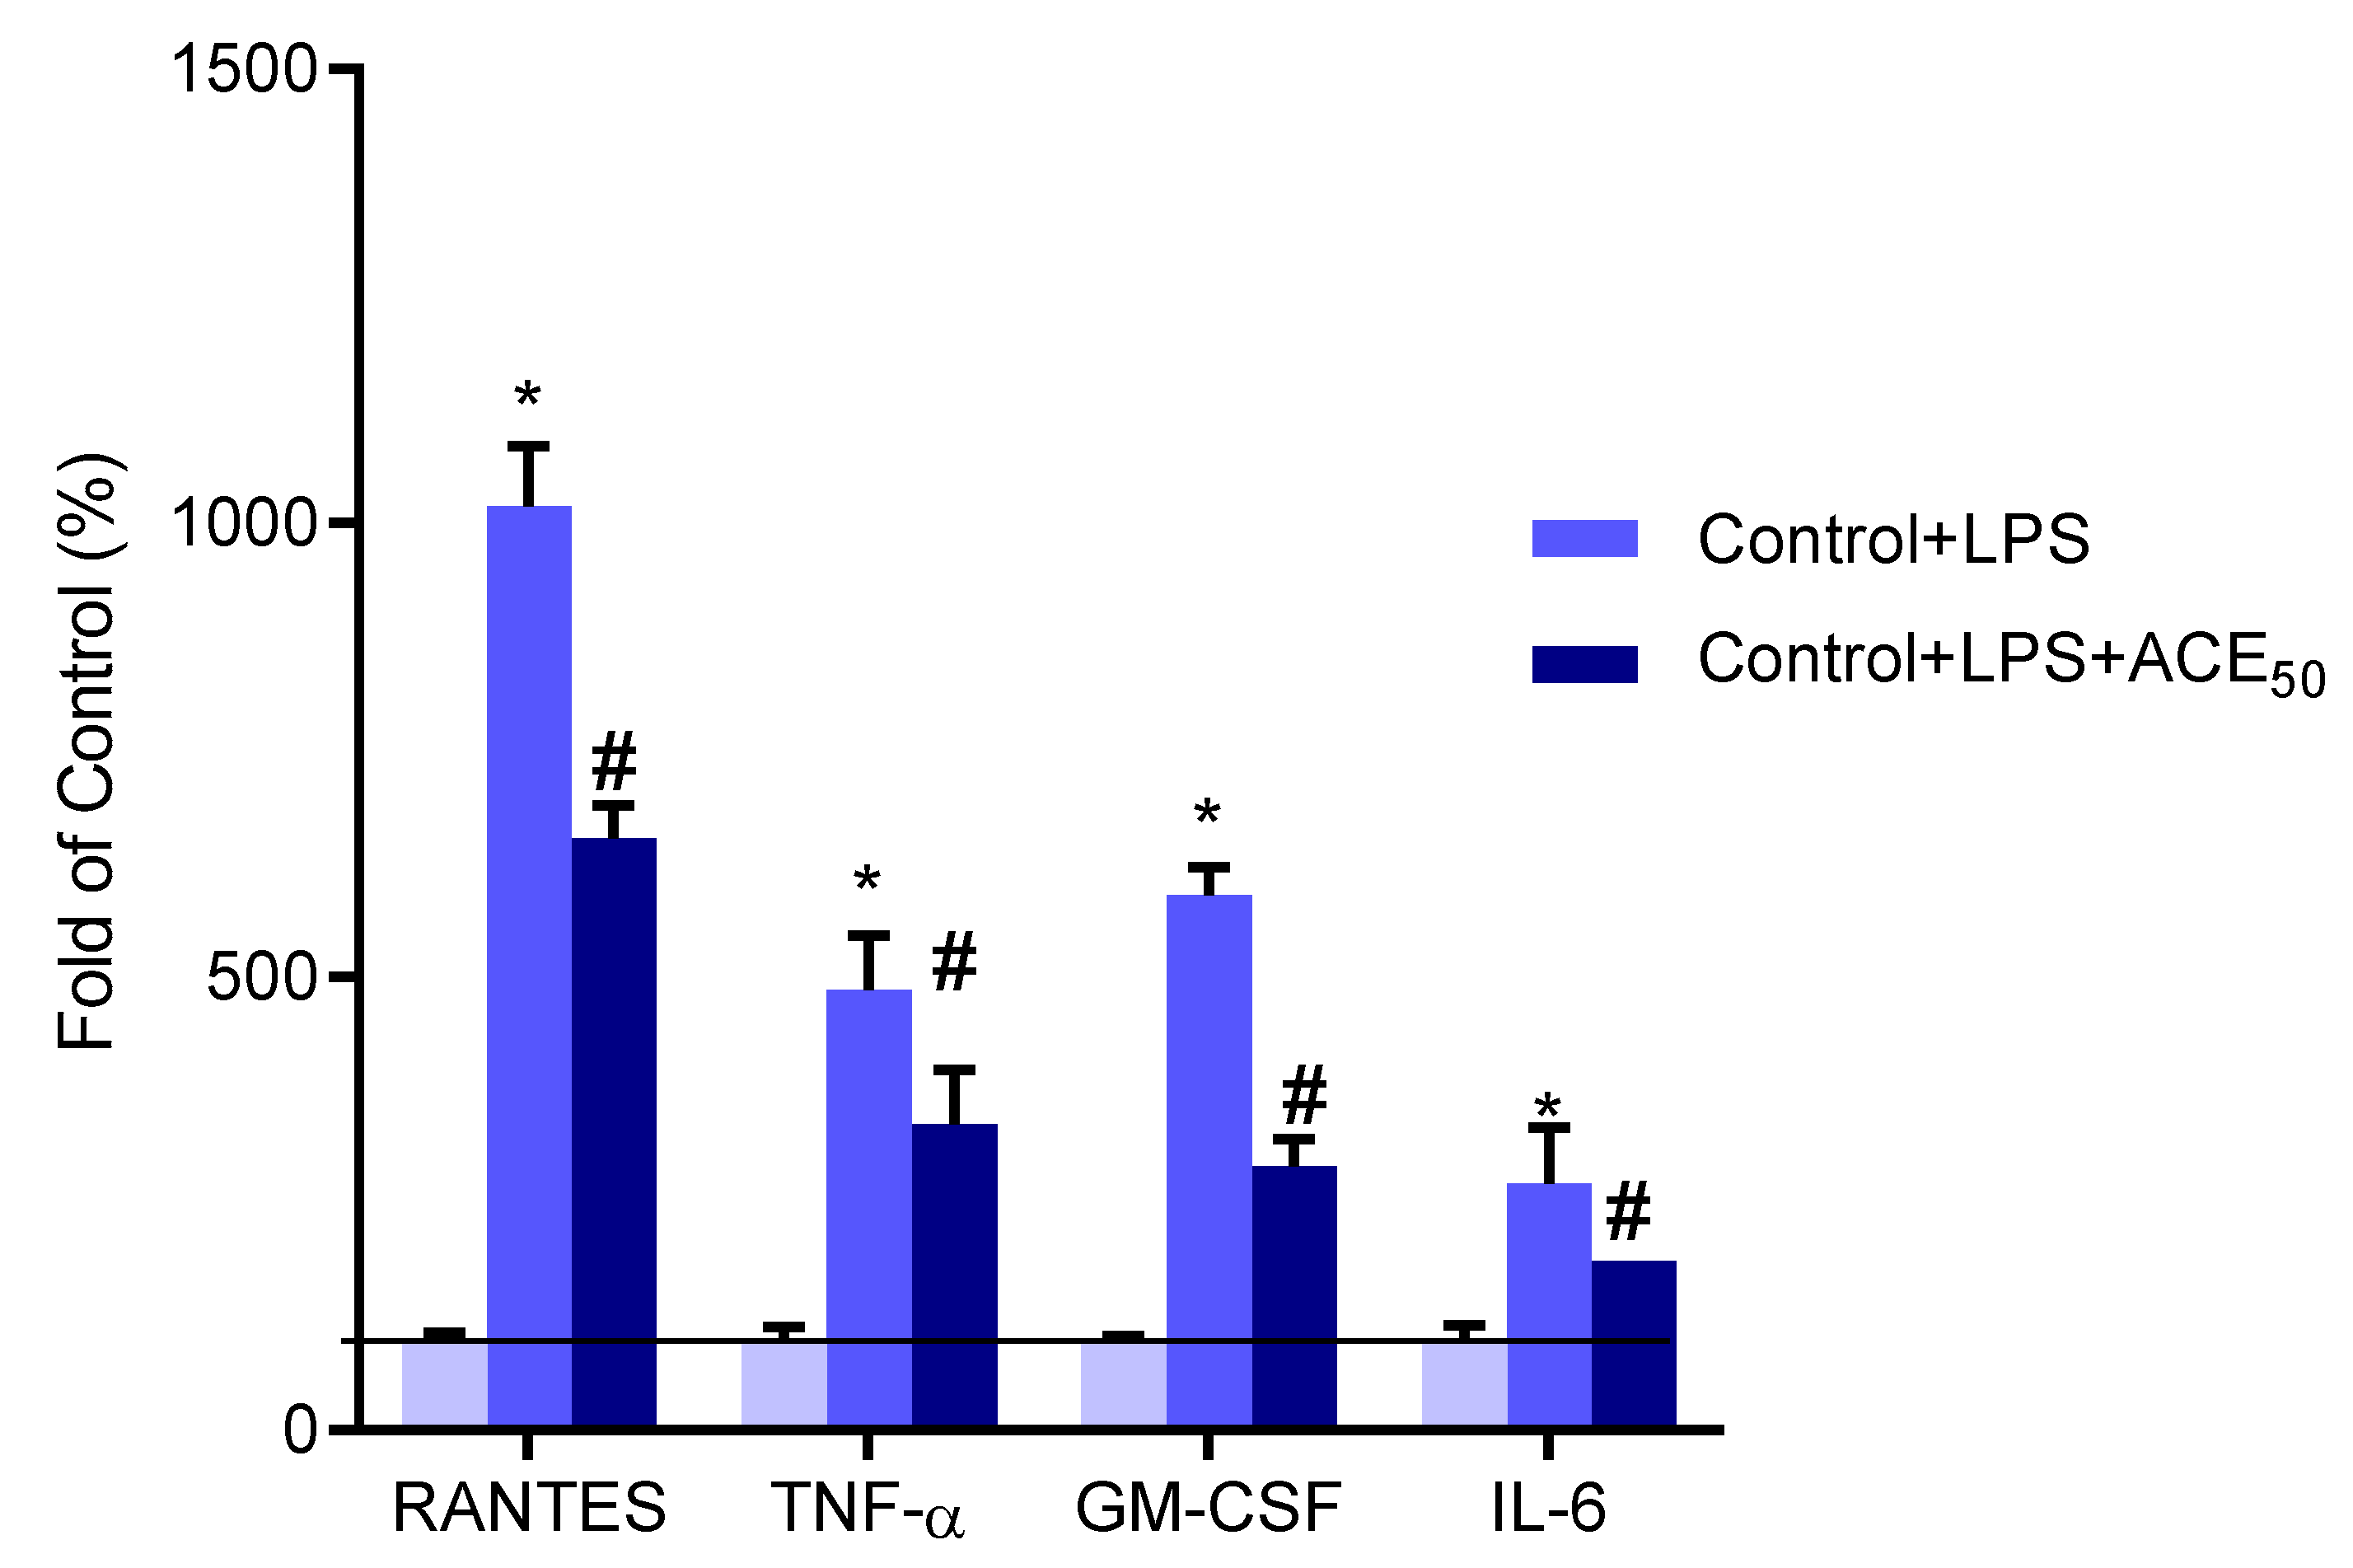
2.5. ACE50 Decreases Secretion of Pro-Inflammatory Cytokines and Chemokines

To determine the inhibitory effect of ACE50 on cytokine and chemokine secretion by HUVECs, IL-6, TNF-α, granulocyte-macrophage colony-stimulating factor (GM-CSF) and regulated on activation, normal T cell expressed and secreted (RANTES) levels were evaluated in supernatant after treatment with 100 ng/mL LPS in the presence or absence of ACE50. ACE50 was able to attenuate the level of the above-mentioned cytokines and chemokines (Figure 7). These observations confirm that sour cherry ACE50 can reduce inflammation on LPS-stimulated HUVECs by suppressing cytokine and chemokine release.

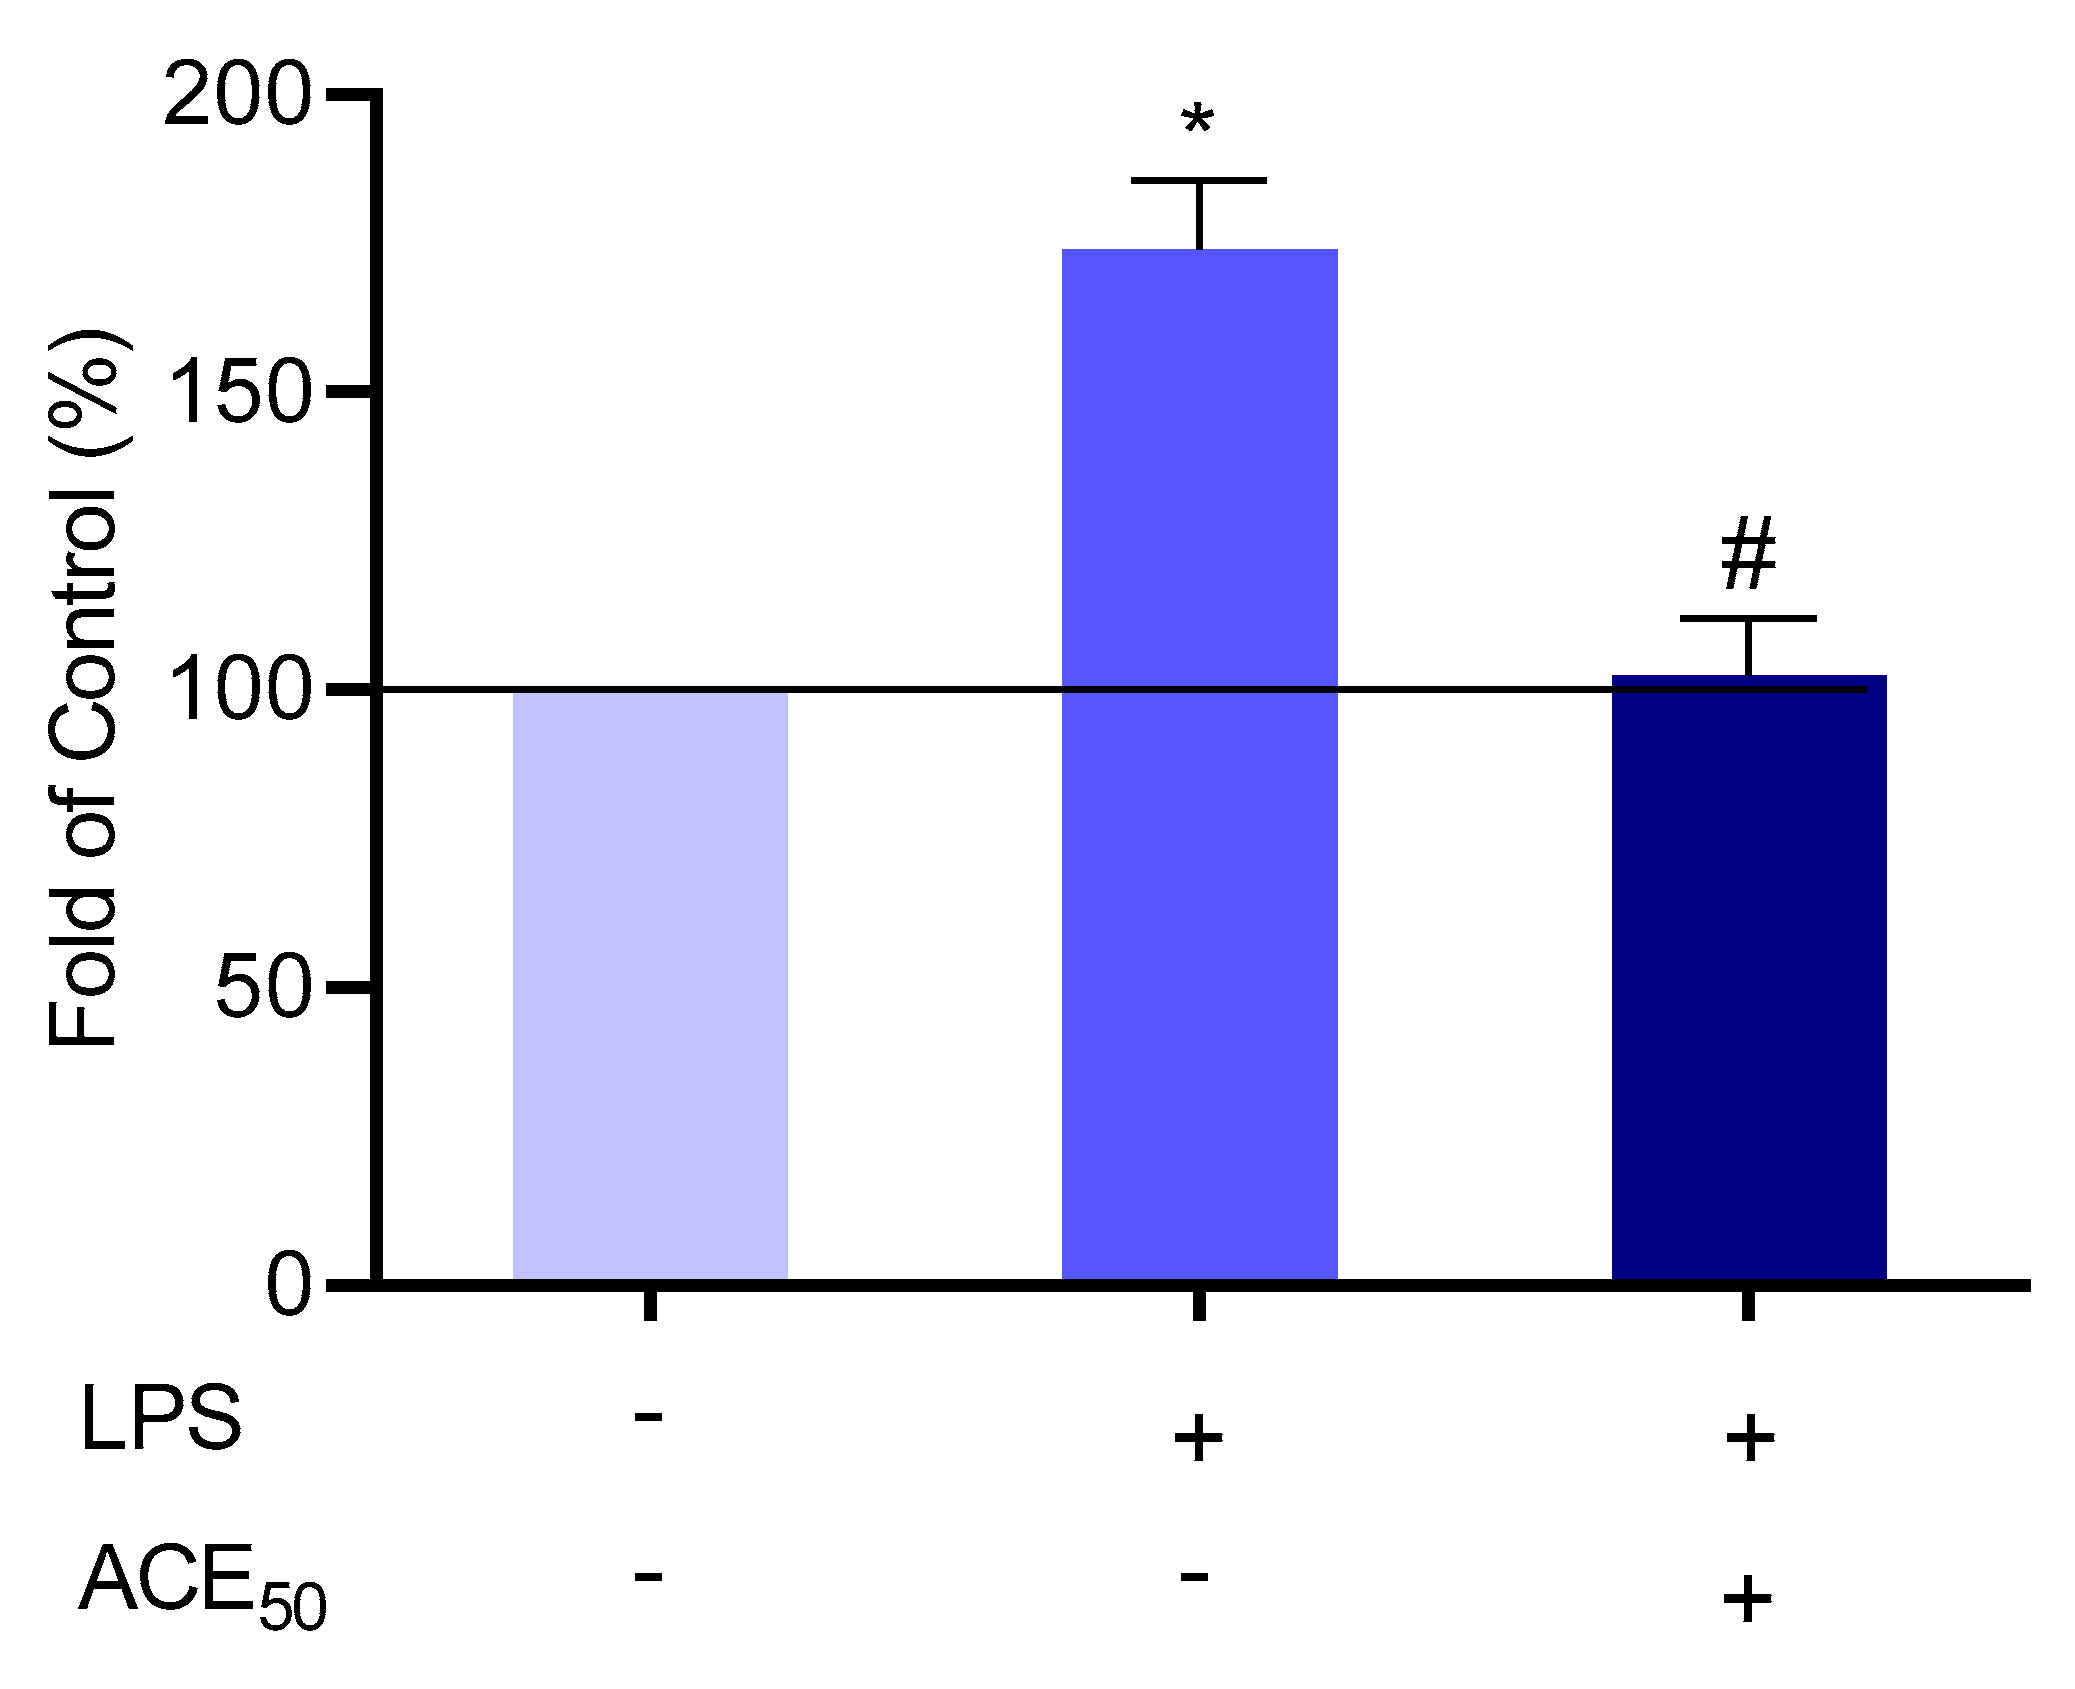
2.6. ACE50 Decreases Level of Tissue-Type Plasminogen Activator (tPA)

tPA has a dual function. As a serine protease, tPA plays a key role in the homeostasis of hemostasis and the extracellular matrix regulation. As a cytokine, tPA accomplishes multiple actions by binding to its membrane receptors and triggering intracellular signaling events [30]. tPA was investigated in the LPS-induced inflammatory model and assessed in supernatant after treatment with 100 ng/mL LPS in the presence or absence of ACE50. ACE50 had a similar effect on the level of tPA as on the above-mentioned cytokines. ACE50 was able to reduce the level of tPA in LPS-induced inflammation in HUVECs (Figure 8).

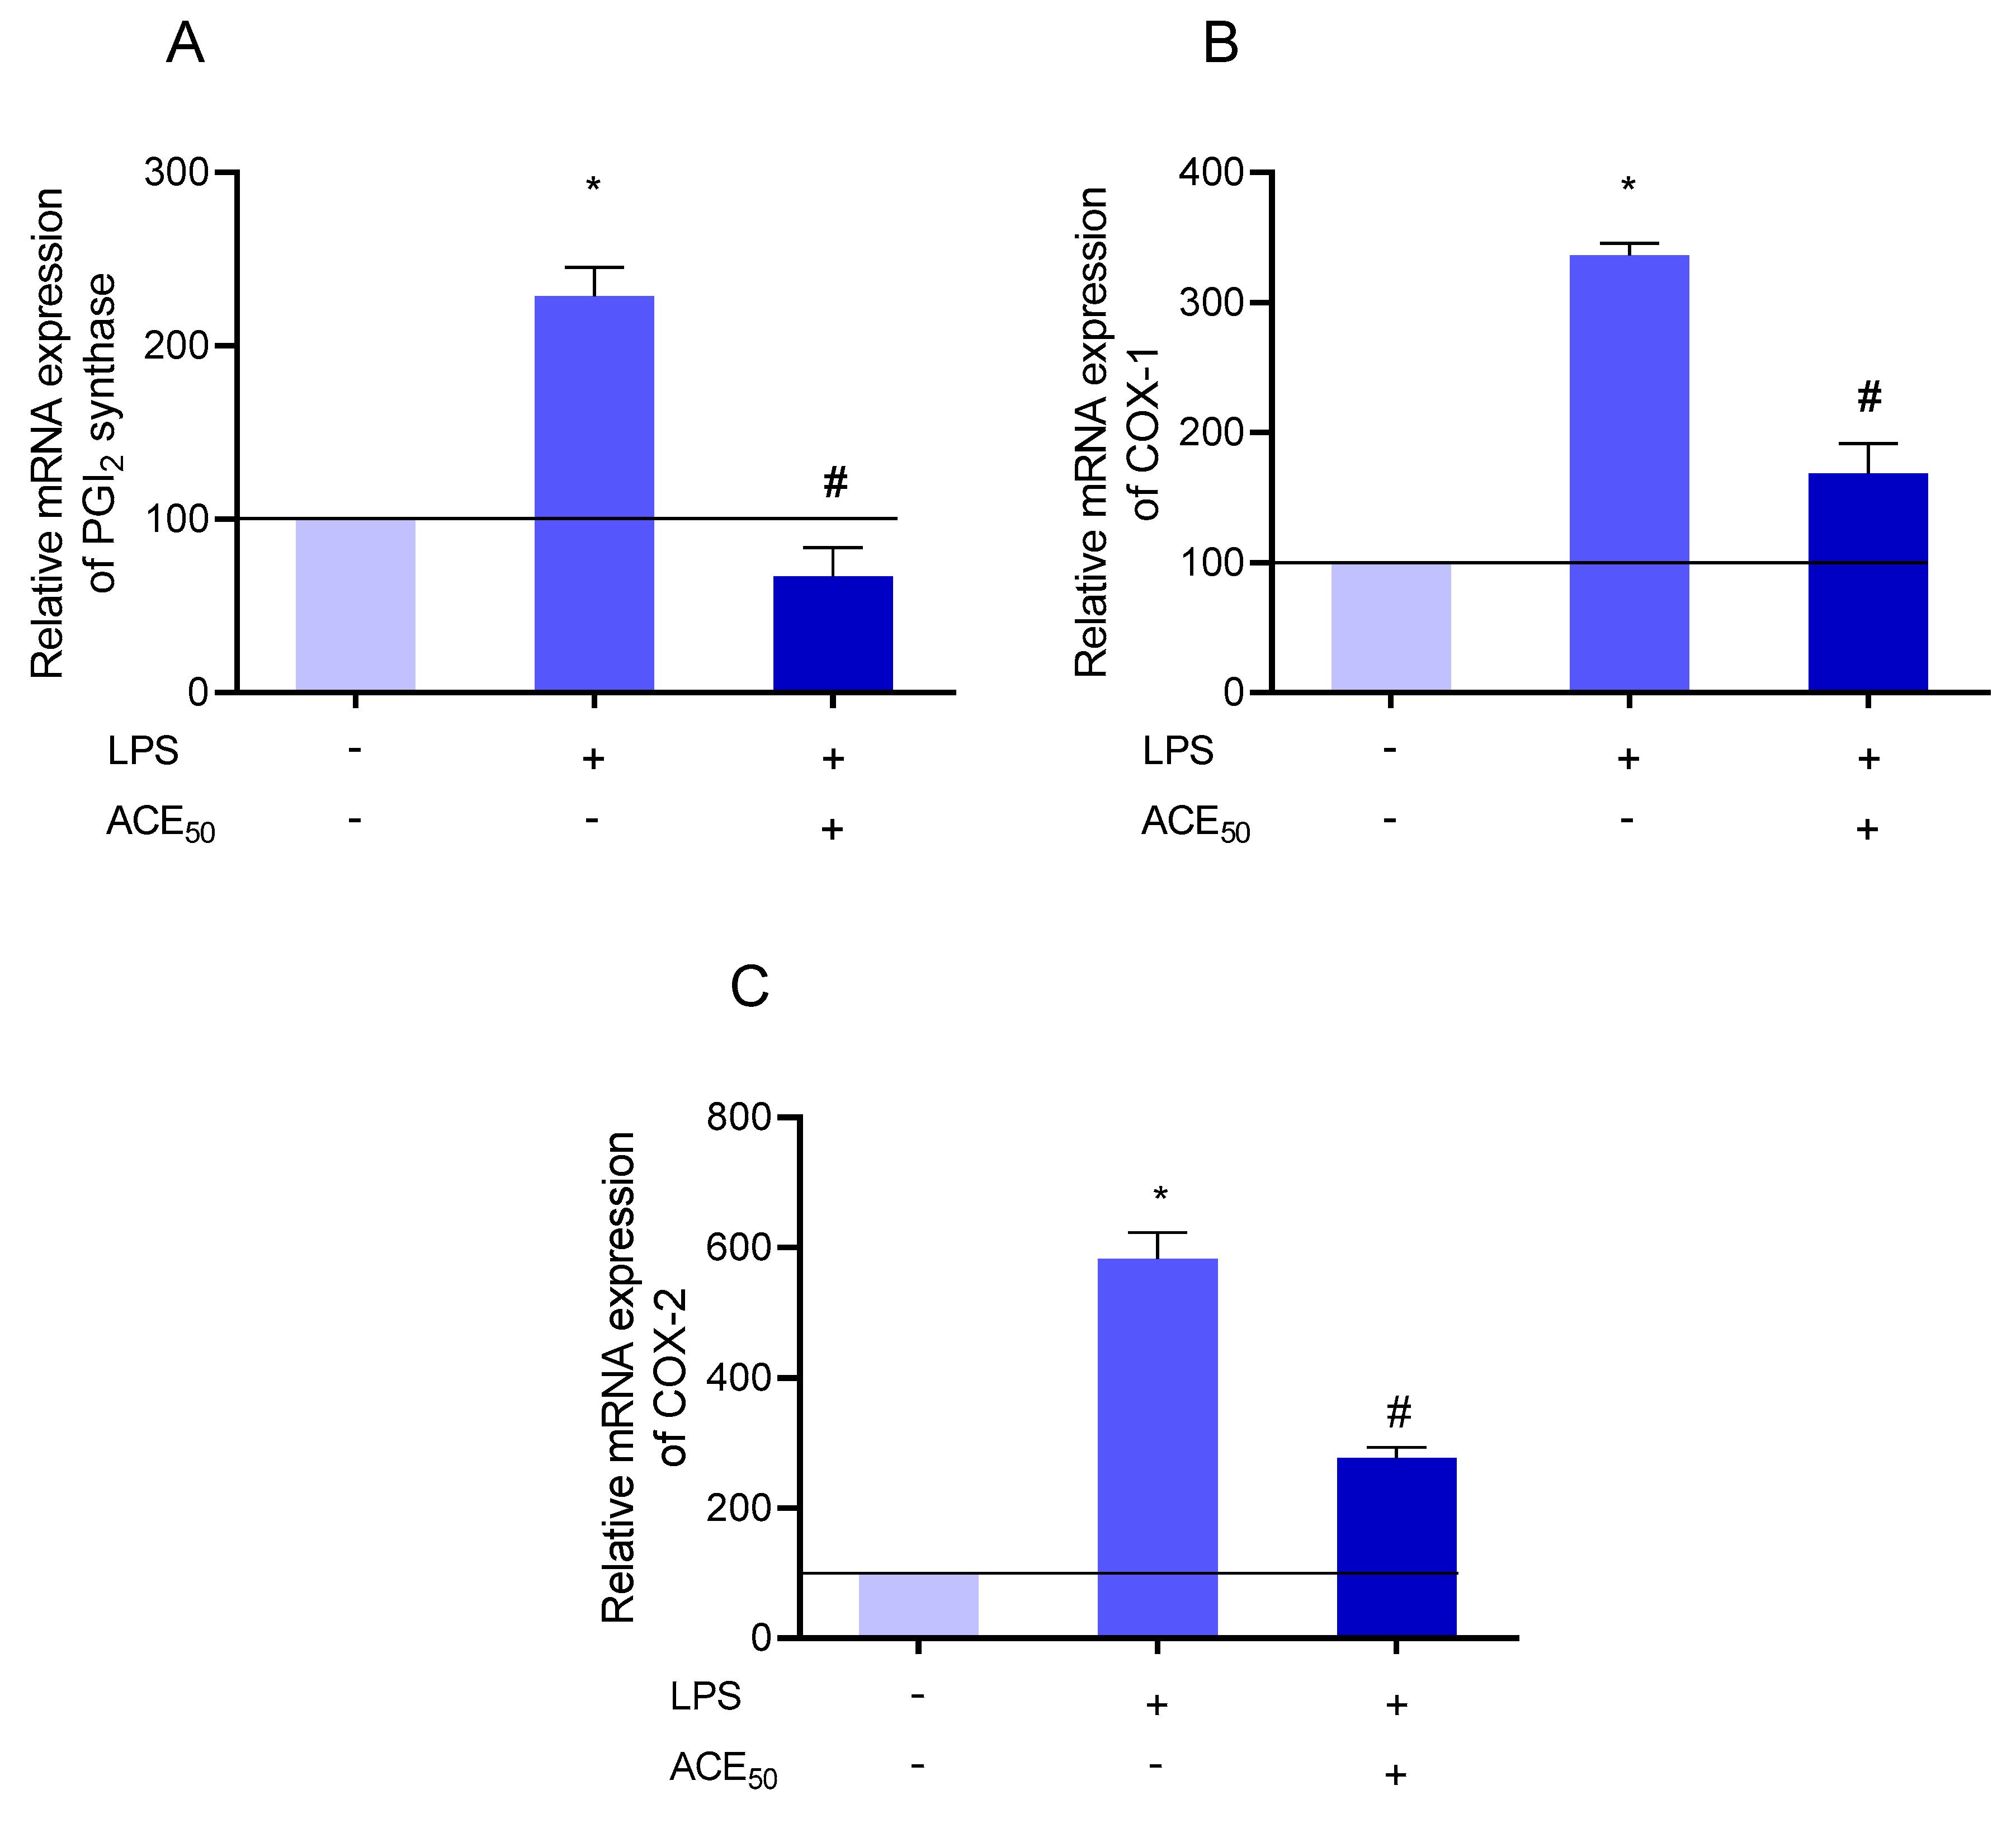
2.7. ACE50 Impact on Arachidonic Acid Pathway

Regulatory elements of inflammation are mainly protein derivatives (cytokines, chemokines). In addition, arachidonic acid derivatives play an important role in the regional control of inflammation due to their very low half-life [31,32]. We investigated eicosanoids, which have both a vasoactive effect on smooth muscle cells and aggregative/anti-aggregative effects on platelets [32]. Since ACE50 can influence inflammatory response, we investigated the arachidonic acid pathway as well. We examined the level of thromboxane (TxA2) and prostacyclin (PGI2) in our inflammatory model. As shown in Figure 9, we found that ACE50 has a strong effect on the level of PGI2 (according to data not shown, the level of TxA2 was not influenced by ACE50).
Therefore, we investigated the expression of enzymes involved in prostacyclin synthesis by measuring their mRNA levels. The mRNA of cyclooxygenase-1 (COX-1), cyclooxygenase-2 (COX-2), and prostacyclin synthase (PGI2 synthase) was tested. It is well known that COX enzymes, with particular reference to COX-2, and PGI2 synthase are upregulated in inflammation [31]. In our experiments, we confirmed these facts. Furthermore, we found that ACE50 decreased the LPS-induced expression of COX-1, COX-2, and PGI2 synthase as determined by Q-PCR (Figure 10). The greatest mitigating effect was observed in the expression of PGI2 synthase (Figure 10A).

3. Discussion

Endothelium plays an important role in mediating inflammation, maintaining hemostasis, balancing vasodilatation and vasoconstriction, among other roles [33]. We investigated the effect of anthocyanin-rich sour cherry extract on LPS-induced inflammation in HUVECs in relation to the above. First, we assessed the optimal concentration of anthocyanin-rich sour cherry extract in our experiments. MTT, apoptosis, and necrosis assays were performed to seek the maximal non-harmful concentration. A reactive oxygen radical elimination ability test was carried out to seek the minimal effective antioxidant concentration. Based on these measurements, the amount of 50 μg/mL ACE (ACE50) was selected as the final concentration for further experiments.
Several studies have shown that anthocyanins are excellent antioxidant compounds [34]. Antioxidant properties may be mediated in several ways. On the one hand, anthocyanins as proton donors can directly eliminate reactive species. Therefore, we tested the effect of ACE50 on the formation of ROS in LPS-induced HUVECs. ACE50 was able to significantly reduce the formation of ROS. On the other hand, flavonoids can indirectly increase the expression of gene-encoding γ-glutamyl cysteine synthase, which determines the rate of glutathione synthesis [35,36]. We investigated the level of GSH and confirmed that ACE50 increases the level of GSH. These observations demonstrate that ACE50 can improve the imbalance of pro- and anti-oxidative agents, thereby alleviating oxidative stress.
Moreover, we examined the inflammatory response to LPS by measuring the secretion of chemokines and cytokines. IL-6 is a soluble mediator with a pleiotropic effect on inflammation, immune response, and hematopoiesis. It may have a central role in host defense mechanisms because of its effect on B-lymphocyte, T-lymphocyte, and hematopoietic stem cells, among others [37]. Tumor necrosis factor alpha (TNF-α) is an inflammatory cytokine produced by macrophages and monocytes during acute inflammation and is responsible for a diverse range of signaling events within cells [38]. Endothelial cells also produce chemokines that regulate eosinophil chemotaxis including RANTES [39]. Another chemokine, granulocyte-macrophage colony-stimulating factor (GM-CSF), is an important hematopoietic growth factor and immune modulator. GM-CSF also has profound effects on the functional activities of various circulating leukocytes [40]. Levels of IL-6, TNF-α, RANTES and GM-CSF were investigated in our experimental setup to evaluate the effect of ACE50 on inflammation. According to recently published articles, dietary anthocyanins can lower levels of these cytokines and chemokines in vitro and in vivo [17,41,42]. In accordance with the above, sour cherry-originated ACE50 decreased these pro-inflammatory cytokines and chemokines significantly. This suggests that ACE50 can modulate inflammatory response.
Considering the multifunctionality of the endothelium and the above-mentioned observations, we investigated the tPA, which serves as a cytokine and a hemostatic agent [30]. As a two-edged sword, tPA can be a promising target to alleviate inflammatory changes. We confirmed that sour cherry ACE50 decreases the level of tPA in LPS-induced HUVECs.
Furthermore, we investigated the effect of ACE50 on eicosanoids because arachidonic acid derivatives play a pivotal role in the local regulation of inflammation [43]. We found that ACE50 has a significant effect on PGI2 among eicosanoids but not on TxA2. To describe more accurately the mechanism of action, we tested the expression of COX-1, COX-2, and PGI2 synthase. The data suggest that the place of effect for the sour cherry ACE50 can found around the prostacyclin synthesis.
Since prostacyclin is a potent vasodilator, ACE50 may have a vasoactive effect. Further measurements are needed to confirm that hypothesis.
In summary, ACE50 has a pleiotropic effect in our inflammation model, including anti-oxidative, anti-inflammatory, hemostatic and vasoactive effects. With respect to mechanisms of action and possible clinical value, further investigations are needed since the sour cherry anthocyanin extract may have a therapeutic potential in endothelial dysfunction-associated diseases.

4. Materials and Methods

4.1. Materials

Purified sour cherry anthocyanin extract (ACE) was prepared by solid phase extraction procedure, as described earlier [22]. All other reagents were obtained from iBioTech Hungary Ltd. (Budapest, Hungary) and Nucleotest Bio Ltd. (Budapest, Hungary).

4.2. Methods

4.2.1. Cell Culture Conditions

The human umbilical cord vein endothelial cells (HUVECs) were isolated from human umbilical cords. Umbilical cords were obtained from the Department of Obstetrics and Gynaecology, Clinical Centre, University of Debrecen, Debrecen, Hungary. The vein of the umbilical cord was cannulated and washed twice with Hank’s Balanced Salt Solution (HBSS). Digestion of HUVECs was performed with 22 U/100 mL collagenase solution incubating for 15 min at 37 °C. The cell pellet was suspended and transferred to a 75 cm2 flask. HUVECs were grown using M199 medium supplemented with 10% heat-inactivated FBS, 1% penicillin/streptomycin, 1% amphotericin B, 2 mM glutamine, and Endothelial Cell Growth Medium-2 (EGM-2) at 37 °C in a humidified incubator under 5% CO2. Media was changed every 48 h until cells reached 80% to 90% confluency. At confluency, cells were either subcultured or used for experiments. For all experiments, cells were growing at passage 1–4. Media as described above was used as control. To create an inflammatory model, LPS was added to M199 medium to a final concentration of 100 ng/mL. Cells were divided into three groups, 24 h incubating with M199 medium (Control), 24 h incubating with 100 ng/mL LPS (Control + LPS), and 24 h incubating with 100 ng/mL LPS plus 50 μg/mL ACE (Control + LPS + ACE50).

4.2.2. Flow Cytometry Studies

For the identification of HUVECs, cells were incubated with four fluorescent dye-labeled antibodies for 30 min at room temperature in the dark. Approximately 100,000 cells were used for one measurement. Cell counting was performed using a Bürker chamber (Hirschmann Laboratory, Eberstadt, Germany). Amounts of 20 μL of fluorescein-isothiocyante (FITC)-labeled mouse anti-human CD31, 20 μL phycoerythrin (PE)-labeled anti-human CD54, 20 μL allophycocyanin (APC)-labeled mouse anti-human CD106, and 5 μL PerCP-Cy5.5 mouse anti-human CD45 were used for labelling. The measurements were carried out using a Becton Dickinson FACSAriaIII Cell Sorter (Becton Dickinson, Mountain View, CA, USA). FITC and PerCP-Cy5.5 were excited with a 488 nm laser (Becton Dickinson), and the emitted green light of FITC was detected using a 530/30 band-pass filter (Becton Dickinson), whereas the far-red fluorescence of PerCP-Cy5.5 was measured using a 635 dichroic mirror (Becton Dickinson) and 695/40 band-pass filter (Becton Dickinson). PE was excited by the 562 nm line of a solid state laser and the emitted light was detected applying a 595/50 nm band-pass filter. APC was excited with a 635 nm red laser and fluorescence intensity was detected using a 660/20 band-pass filter (Becton Dickinson). In all, 20,000 cells/sample were recorded and analyzed. Cytofluorimetric data were analyzed using FCS Express 4 Research Edition (De Novo Software, version 7, Glendale, CA, USA).

4.2.3. Determination of Cellular Viability

Cell viability was determined by MTT assay measuring the conversion of tetrazolium salt to formazan crystals by mitochondrial dehydrogenases. Cells were seeded to 96-well plates at a density of 20,000 cells per well in quadruplicates and were treated with sour cherry extract of different concentrations (1, 5, 10, 50, and 100 μg/mL) for 24 and 48 h. Cells were then incubated with 0.5 mg/mL MTT solution for 3 h. Formazan crystals formed proportional to the number of viable cells. After dissolving them in isopropyl alcohol, absorbance was measured colorimetrically at 465 nm using a Clariostar microplate reader (BMG Labtech, Ortenberg, Germany). The results were expressed relative to 100% of the control group.

4.2.4. Determination of Apoptosis

Decrease in the mitochondrial membrane potential is one of the earliest markers of apoptosis. Therefore, to estimate the process, the mitochondrial membrane potential of the HUVECs was determined using DilC1(5) dye. Cells (20,000 cells/well) were cultured in 96-well plates and treated as indicated in Section 4.2.4. After removal of the supernatants, the cells were incubated for 30 min with a DilC1(5) working solution (50 μL/well) and then washed with PBS, and the fluorescence of DilC1(5) was measured at 630 nm excitation and 670 nm emission wavelengths using a Clariostar microplate reader. The results were expressed relative to 100% of the control group.

4.2.5. Determination of Necrosis

Necrotic processes were evaluated by SYTOX Green staining. Cells were cultured in 96-well plates, and treated as indicated in Section 4.2.4. Then, the supernatants were discarded, and the cells were incubated for 30 min with 1 μM SYTOX Green dye. After incubation, cells were washed with PBS, and the fluorescence of SYTOX Green was measured at 490 nm excitation and 520 nm emission wavelengths using a Clariostar microplate reader. The results were expressed relative to 100% of the control group.

4.2.6. Measurement of ROS

The cells were treated in a 24-well plate and exposed to 100 μM 2′,7′-dichlorofluorescin diacetate (DCFDA) for 1 h at 37 °C to label intracellular ROS. After incubation, the cells were washed twice with PBS. Then, the labelled cells were monitoring every 6 h. Fluorescence intensity (excitation = 485 nm; emission = 530 nm) was measured using a microplate reader (Clariostar; BMG Labtech). The results were expressed relative to 100% of the control group.

4.2.7. Measurement of GSH Level

The assay was performed according to the manufacturer′s instructions (Abcam Plc., Cambridge, UK) using a Glutathione Assay Kit (Abcam Plc.). The results were expressed relative to 100% of the control group.

4.2.8. Luminex MagPlex Assay

HUVECs were treated with 100 ng/mL LPS for 24 h and the supernatant was collected and centrifuged for 10 min 10,000 r·min−1 and stored at −80 °C. The supernatant levels of IL-6, GM-CSF, TNF-α, and RANTES were determined using a MILLIPLEX MAP Human cytokine/chemokine Magnetic Bead Panel (HCYTOMAG-60K-09, EMD Millipore Corp., Billerica, MA, USA) according to the manufacturer′s instructions. The results were expressed relative to 100% of the control group.

4.2.9. ELISA

HUVECs were treated with 100 ng/mL LPS for 24 h and the supernatants were collected and centrifuged for 10 min 10,000 r·min−1 and stored at −80 °C. The concentrations of PGI2 and tPA were measured in the cell supernatant with a competitive (PGI2) and sandwich (tPA) ELISA (Abcam Plc., Cambridge, UK) according to the manufacturer’s instructions. The results were expressed relative to 100% of the control group.

4.2.10. Q-PCR

Q-PCR was performed on a Roche LightCycler 480 System (Roche, Basel, Switzerland) using the 5′ nuclease assay. Total RNA was isolated using Extrazole. 1 μg of total RNA was reverse-transcribed into cDNA using an UltraScript 2.0 cDNA Synthesis Kit (PCR Biosystems, London, UK). The amplification was performed using the 2× qPCRBIO Probe Mix No-ROX assay (PCR Biosystems, London, UK). As internal control, glyceraldehyde 3-phosphate dehydrogenase was determined. The results were expressed relative to 100% of the control group.

4.2.11. Statistical Analysis

For multiple comparisons, results were analyzed by ANOVA followed by modified t-test for repeated measures according to Bonferroni’s method. Data were presented as mean ± SEM. p < 0.05 was considered statistically significant.

4.3. Ethics

The study was conducted in accordance with the Declaration of Helsinki, and the protocol was approved by the Ethics Committee of the University of Debrecen (registration number RKEB/IKEB 3712-2012).

Author Contributions

J.R. conceived and designed the experiments, A.B., A.M., J.R.H., L.S., J.L., C.H., and E.S. performed the experiments. A.B., A.M., S.T. and J.R. analyzed the data. A.B. and J.R. wrote the paper. All authors read and approved the final manuscript.

Funding

This research received no external funding.

Acknowledgments

The work is supported by the GINOP-2.2.1-15-2017-00079 project. This project is co-financed by the European Union and the European Social Fund. The authors are grateful for the generous help of the Hungarian Academy of Sciences - University of Debrecen (HAS-UD) Vascular Biology and Myocardial Pathophysiology Research Group, Faculty of Medicine, Nephrology Division, Debrecen, Hungary, for the human umbilical vein endothelial cell isolation. The authors would like to thank Adam Biro for helpful advice and corrections.

Conflicts of Interest

The authors declare no conflict of interest.

References

  1. Khoo, H.E.; Azlan, A.; Tang, S.T.; Lim, S.M. Anthocyanidins and anthocyanins: Colored pigments as food, pharmaceutical ingredients, and the potential health benefits. Food Nutr. Res. 2017, 61, 1361779. [Google Scholar] [CrossRef] [PubMed]
  2. De Pascual-Teresa, S.; Sanchez-Ballesta, M.T. Anthocyanins: From plant to health. Phytochem. Rev. 2008, 7, 281–299. [Google Scholar] [CrossRef]
  3. Thomford, N.E.; Senthebane, D.A.; Rowe, A.; Munro, D.; Seele, P.; Maroyi, A. Natural Products for Drug Discovery in the 21st Century: Innovations for Novel Drug Discovery. Int. J. Mol. Sci. 2018, 19, 1578. [Google Scholar] [CrossRef] [PubMed]
  4. Li, D.; Wang, P.; Luo, Y.; Zhao, M.; Chen, F. Health benefits of anthocyanins and molecular mechanisms: Update from recent decade. Crit. Rev. Food Sci. Nutr. 2017, 57, 1729–1741. [Google Scholar] [CrossRef] [PubMed]
  5. Hou, D.-X.; Fujii, M.; Terahara, N.; Yoshimoto, M. Molecular Mechanisms Behind the Chemopreventive Effects of Anthocyanidins. J. Biomed. Biotechnol. 2004, 2004, 321–325. [Google Scholar] [CrossRef] [PubMed] [Green Version]
  6. Mena, P.; Dominguez-Perles, R.; Girones-Vilaplana, A.; Baenas, N.; Garcia-Viguera, C.; Villano, D. Flavan-3-ols, anthocyanins, and inflammation. IUBMB Life 2014, 66, 745–758. [Google Scholar] [CrossRef] [PubMed]
  7. Cisowska, A.; Wojnicz, D.; Hendrich, A.B. Anthocyanins as antimicrobial agents of natural plant origin. Nat. Prod. Commun. 2011, 6, 149–156. [Google Scholar] [CrossRef] [PubMed]
  8. Wang, L.-S.; Stoner, G.D. Anthocyanins and their role in cancer prevention. Cancer Lett. 2008, 269, 281–290. [Google Scholar] [CrossRef] [Green Version]
  9. Rojo, L.E.; Ribnicky, D.; Logendra, S.; Poulev, A.; Rojas-Silva, P.; Kuhn, P.; Dorn, R.; Grace, M.H.; Lila, M.A.; Raskin, I. In vitro and in vivo anti-diabetic effects of anthocyanins from Maqui Berry (Aristotelia chilensis). Food Chem. 2012, 131, 387–396. [Google Scholar] [CrossRef] [Green Version]
  10. Azzini, E.; Giacometti, J.; Russo, G.L. Antiobesity Effects of Anthocyanins in Preclinical and Clinical Studies. Oxid. Med. Cell Longevity 2017, 2017, 2740364. [Google Scholar] [CrossRef]
  11. Wallace, T.C. Anthocyanins in cardiovascular disease. Adv. Nutr. 2011, 2, 1–7. [Google Scholar] [CrossRef] [PubMed]
  12. Homoki, J.; Gyémánt, G.; Balogh, P.; Stundl, L.; Bíró-Molnár, P.; Paholcsek, M.; Varadi, J.; Ferenc, F.; Kelentey, B.; Nemes, J.; et al. Sour cherry extract inhibits human salivary α-amylase and growth of Streptococcus mutans (a pilot clinical study). Food Funct. 2018, 9, 4008–4016. [Google Scholar] [CrossRef] [PubMed]
  13. Passamonti, S.; Vrhovsek, U.; Vanzo, A.; Mattivi, F. The stomach as a site for anthocyanins absorption from food. FEBS Lett. 2003, 544, 210–213. [Google Scholar] [CrossRef]
  14. Milbury, P.E.; Cao, G.; Prior, R.L.; Blumberg, J. Bioavailablility of elderberry anthocyanins. Mech. Ageing Dev. 2002, 123, 997–1006. [Google Scholar] [CrossRef]
  15. Stoner, G.D.; Sardo, C.; Apseloff, G.; Mullet, D.; Wargo, W.; Pound, V.; Singh, A.; Sanders, J.; Aziz, R.; Casto, B.; et al. Pharmacokinetics of anthocyanins and ellagic acid in healthy volunteers fed freeze-dried black raspberries daily for 7 days. J. Clin. Pharmacol. 2005, 45, 1153–1164. [Google Scholar] [CrossRef] [PubMed]
  16. Cimino, F.; Speciale, A.; Anwar, S.; Canali, R.; Ricciardi, E.; Virgili, F.; Trombetta, D.; Saija, A. Anthocyanins protect human endothelial cells from mild hyperoxia damage through modulation of Nrf2 pathway. Genes Nutr. 2013, 8, 391–399. [Google Scholar] [CrossRef] [PubMed]
  17. Lee, Y.-M.; Yoon, Y.; Yoon, H.; Park, H.-M.; Song, S.; Yeum, K.-J. Dietary Anthocyanins against Obesity and Inflammation. Nutrients 2017, 9, 1089. [Google Scholar] [CrossRef]
  18. Zhu, Y.; Ling, W.; Guo, H.; Song, F.; Ye, Q.; Zou, T.; Li, D.; Zhang, Y.; Li, G.; Xiao, Y.; et al. Anti-inflammatory effect of purified dietary anthocyanin in adults with hypercholesterolemia: A randomized controlled trial. Nutr. Metab. Cardiovasc. Dis. 2013, 23, 843–849. [Google Scholar] [CrossRef]
  19. Xie, C.; Kang, J.; Ferguson, M.E.; Nagarajan, S.; Badger, T.M.; Wu, X. Blueberries reduce pro-inflammatory cytokine TNF-alpha and IL-6 production in mouse macrophages by inhibiting NF-kappaB activation and the MAPK pathway. Mol. Nutr. Food Res. 2011, 55, 1587–1591. [Google Scholar] [CrossRef]
  20. Roth, S.; Spalinger, M.R.; Gottier, C.; Biedermann, L.; Zeitz, J.; Lang, S.; Weber, A.; Rogler, G.; Scharl, M. Bilberry-Derived Anthocyanins Modulate Cytokine Expression in the Intestine of Patients with Ulcerative Colitis. PLoS ONE 2016, 11, e0154817. [Google Scholar] [CrossRef] [Green Version]
  21. Le Phuong Nguyen, T.; Fenyvesi, F.; Remenyik, J.; Homoki, J.R.; Gogolák, P.; Bácskay, I.; Fehér, P.; Ujhelyi, Z.; Vasvári, G.; Vecsernyés, M.; et al. Protective Effect of Pure Sour Cherry Anthocyanin Extract on Cytokine-Induced Inflammatory Caco-2 Monolayers. Nutrients 2018, 10, 861. [Google Scholar] [CrossRef] [PubMed]
  22. Homoki, J.R.; Nemes, A.; Fazekas, E.; Gyemant, G.; Balogh, P.; Gal, F.; Al-Asri, J.; Mortier, J.; Wolber, G.; Babinszky, L.; et al. Anthocyanin composition, antioxidant efficiency, and alpha-amylase inhibitor activity of different Hungarian sour cherry varieties (Prunus cerasus L.). Food Chem. 2016, 194, 222–229. [Google Scholar] [CrossRef] [PubMed]
  23. Nemes, A.; Szőllősi, E.; Stündl, L.; Biró, A.; Homoki, J.R.; Szarvas, M.M.; Balogh, P.; Cziáky, Z.; Remenyik, J. Determination of Flavonoid and Proanthocyanidin Profile of Hungarian Sour Cherry. Molecules 2018, 23, 3278. [Google Scholar] [CrossRef] [PubMed]
  24. Stankov, S. Definition of Inflammation, Causes of Inflammation and Possible Anti-inflammatory Strategies. Open Inflamm. J. 2012, 5, 1–9. [Google Scholar] [CrossRef] [Green Version]
  25. Gimbrone, M.A., Jr.; García-Cardeña, G. Endothelial Cell Dysfunction and the Pathobiology of Atherosclerosis. Circ. Res. 2016, 118, 620–636. [Google Scholar] [CrossRef] [PubMed] [Green Version]
  26. Markovics, A.; Toth, K.F. Nicotinic acid suppresses sebaceous lipogenesis of human sebocytes via activating hydroxycarboxylic acid receptor 2 (HCA2). J. Cell Mol. Med. 2019, 23, 6203–6214. [Google Scholar] [CrossRef] [PubMed]
  27. Kay, C.D.; Pereira-Caro, G.; Ludwig, I.A.; Clifford, M.N.; Crozier, A. Anthocyanins and Flavanones Are More Bioavailable than Previously Perceived: A Review of Recent Evidence. Annu. Rev. Food Sci. Technol. 2017, 8, 155–180. [Google Scholar] [CrossRef]
  28. Forrester, S.J.; Kikuchi, D.S.; Hernandes, M.S.; Xu, Q.; Griendling, K.K. Reactive Oxygen Species in Metabolic and Inflammatory Signaling. Circ. Res. 2018, 122, 877–902. [Google Scholar] [CrossRef]
  29. Forman, H.J.; Zhang, H.; Rinna, A. Glutathione: Overview of its protective roles, measurement, and biosynthesis. Mol. Aspects Med. 2009, 30, 1–12. [Google Scholar] [CrossRef] [Green Version]
  30. Lin, L.; Hu, K. Tissue plasminogen activator and inflammation: From phenotype to signaling mechanisms. Am. J. Clin. Exp. Immunol. 2014, 3, 30–36. [Google Scholar]
  31. Ricciotti, E.; FitzGerald, G.A. Prostaglandins and inflammation. Arterioscler. Thromb. Vasc. Biol. 2011, 31, 986–1000. [Google Scholar] [CrossRef] [PubMed]
  32. Noda, M.; Kariura, Y.; Pannasch, U.; Nishikawa, K.; Wang, L.; Seike, T.; Ifuku, M.; Kosai, Y.; Wang, B.; Nolte, C.; et al. Neuroprotective role of bradykinin because of the attenuation of pro-inflammatory cytokine release from activated microglia. J. Neurochem. 2007, 101, 397–410. [Google Scholar] [CrossRef] [PubMed]
  33. Yau, J.W.; Teoh, H.; Verma, S. Endothelial cell control of thrombosis. BMC Cardiovasc. Disord. 2015, 15, 130. [Google Scholar] [CrossRef] [PubMed]
  34. Kahkonen, M.P.; Heinonen, M. Antioxidant activity of anthocyanins and their aglycons. J. Agric. Food Chem. 2003, 51, 628–633. [Google Scholar] [CrossRef] [PubMed]
  35. Myhrstad, M.C.; Carlsen, H.; Nordstrom, O.; Blomhoff, R.; Moskaug, J.O. Flavonoids increase the intracellular glutathione level by transactivation of the gamma-glutamylcysteine synthetase catalytical subunit promoter. Free Radical Biol. Med. 2002, 32, 386–393. [Google Scholar] [CrossRef]
  36. Moskaug, J.O.; Carlsen, H.; Myhrstad, M.C.; Blomhoff, R. Polyphenols and glutathione synthesis regulation. Am. J. Clin. Nutr. 2005, 81, 277s–283s. [Google Scholar] [CrossRef] [PubMed]
  37. Tanaka, T.; Narazaki, M.; Kishimoto, T. IL-6 in inflammation, immunity, and disease. Cold Spring Harbor Perspect. Biol. 2014, 6, a016295. [Google Scholar] [CrossRef]
  38. Idriss, H.T.; Naismith, J.H. TNF alpha and the TNF receptor superfamily: Structure-function relationship(s). Microsc. Res. Tech. 2000, 50, 184–195. [Google Scholar] [CrossRef]
  39. Appay, V.; Rowland-Jones, S.L. RANTES: A versatile and controversial chemokine. Trends Immunol. 2001, 22, 83–87. [Google Scholar] [CrossRef]
  40. Shi, Y.; Liu, C.H.; Roberts, A.I.; Das, J.; Xu, G.; Ren, G.; Zhang, Y.; Zhang, L.; Yuan, Z.R.; Tan, H.S.; et al. Granulocyte-macrophage colony-stimulating factor (GM-CSF) and T-cell responses: What we do and don’t know. Cell Res. 2006, 16, 126–133. [Google Scholar] [CrossRef]
  41. Karlsen, A.; Retterstol, L.; Laake, P.; Paur, I.; Bohn, S.K.; Sandvik, L.; Blomhoff, R. Anthocyanins inhibit nuclear factor-kappaB activation in monocytes and reduce plasma concentrations of pro-inflammatory mediators in healthy adults. J. Nutr. 2007, 137, 1951–1954. [Google Scholar] [CrossRef] [PubMed]
  42. Haggard, S.; West, L.; De Mejia, E.G. Protective Potential of Anthocyanin Rich Plant Extracts on an in vitro Model of Celiac Disease. FASEB J. 2017, 31, lb319. [Google Scholar]
  43. Khanapure, S.P.; Garvey, D.S.; Janero, D.R.; Letts, L.G. Eicosanoids in inflammation: Biosynthesis, pharmacology, and therapeutic frontiers. Curr. Top. Med. Chem. 2007, 7, 311–340. [Google Scholar] [CrossRef] [PubMed]
Sample Availability: Not available.
Figure 1. Flow cytometric analysis of human umbilical cord vein endothelial cells (HUVECs). Isolated HUVECs were checked for positive markers (b) CD54 and CD31 and negative marker proteins (c) CD45 and CD106 expression using specific antibodies. (a) Forward- and side-scatter plot and (b) dot-plots of HUVEC positive- and (c) negative-markers are shown. Representative graph of three independent experiments.
Molecules 24 03427 g001
Figure 2. UHPLC chromatogram of sour cherry at 535 nm. Confirmed by standard.
Molecules 24 03427 g002
Figure 3. Viability of HUVECs was evaluated at (A) 24 h and (B) 48 h. Results are expressed in the percentage of the control (100% is represented by the solid lines). Data are expressed as the mean ± SEM of four individual experiments. ACE, anthocyanin extract.
Molecules 24 03427 g003
Figure 4. Combined fluorescent DilC1(5) and SYTOX Green labelling. To observe apoptotic and necrotic cell death, HUVECs were treated as indicated (A) 24 h or (B) 48 h. Results are expressed in the percentage of the control (100% is represented by the solid lines). Data are expressed as the mean ± SEM of four individual experiments. CCCP, carbonyl cyanide m-chlorophenyl hydrazone (positive control for apoptosis); LB, lysis buffer (positive control for necrosis); ACE, anthocyanin extract.
Molecules 24 03427 g004
Figure 5. Effect of ACE on the level of reactive oxygen species (ROS) in various concentrations. * indicates the significant increase of ROS after H2O2 treatment compared to the control. # indicates the significant changes in ROS after H2O2 and ACE treatment compared to the H2O2 treatment without ACE. Results are expressed in the percentage of the control (100% is represented by the solid lines). Data are expressed as the mean ± SEM of four individual experiments. H2O2, hydrogen peroxide (positive control for oxidative stress); ACE, anthocyanin extract.
Molecules 24 03427 g005
Figure 6. Effect of ACE50 on the level of ROS (A). * indicates the significant increase of ROS in lipopolysaccharide (LPS)-induced inflammation compared to the control. # indicates the significant changes in ROS in LPS-induced inflammation and ACE50 treatment compared to the level of ROS in LPS-induced inflammation without ACE50. Effect of ACE50 on the level of GSH (B). * indicates the significant increase of GSH after ACE50 treatment in LPS-induced inflammation compared to the control. Results are expressed in the percentage of the control (100% is represented by the solid lines). Data are expressed as the mean ± SEM of four individual experiments. ACE50, 50 μg/mL anthocyanin extract.
Molecules 24 03427 g006
Figure 7. The level of evaluated cytokines and chemokines increased significantly compared to the control after LPS-treatment indicated by *. # indicates the significant changes in cytokines in LPS-induced inflammation and ACE50 treatment compared to the level of cytokines in LPS-induced inflammation without ACE50. Results are expressed in the percentage of the control (100% is represented by the solid lines). Data are expressed as the mean ± SEM of four individual experiments. ACE50, 50 μg/mL anthocyanin extract. Interleukin-6 (IL-6), regulated on activation, normal T cell expressed and secreted (RANTES), granulocyte-macrophage colony-stimulating factor (GM-CSF), and tumor necrosis factor alpha (TNF-α).
Molecules 24 03427 g007
Figure 8. The level of tPA increased significantly compared to the control after LPS-treatment indicated by *. # indicates the significant changes in tPA in LPS-induced inflammation and ACE50 treatment compared to the level of tPA in LPS-induced inflammation without ACE50. Results are expressed in the percentage of the control (100% is represented by the solid lines). Data are expressed as the mean ± SEM of four individual experiments. ACE50, 50 μg/mL anthocyanin extract.
Molecules 24 03427 g008
Figure 9. The level of PGI2 increased significantly compared to the control after LPS-treatment indicated by *. # indicates the significant changes in PGI2 in LPS-induced inflammation and ACE50 treatment compared to the level of PGI2 in LPS-induced inflammation without ACE50. Results are expressed in the percentage of the control (100% is represented by the solid lines). Data are expressed as the mean ± SEM of four individual experiments. ACE50, 50 μg/mL anthocyanin extract.
Molecules 24 03427 g009
Figure 10. (A) The level of prostacyclin (PGI2) synthase mRNA increased significantly compared to the control after LPS-treatment indicated by *. # indicates the significant changes in PGI2 synthase mRNA in LPS-induced inflammation and ACE50 treatment compared to the level of PGI2 synthase mRNA in LPS-induced inflammation without ACE50. (B) The level of cyclooxygenase-1 (COX-1) mRNA increased significantly compared to the control after LPS-treatment indicated by *. # indicates the significant changes in COX-1 mRNA in LPS-induced inflammation and ACE50 treatment compared to the level of COX-1 mRNA in LPS-induced inflammation without ACE50. (C) The level of COX-2 mRNA increased significantly compared to the control after LPS-treatment indicated by *. # indicates the significant changes in COX-2 mRNA in LPS-induced inflammation and ACE50 treatment compared to the level of COX-2 mRNA in LPS-induced inflammation without ACE50. Results are expressed in the percentage of the control (100% is represented by the solid lines). Data are expressed as the mean ± SEM of four individual experiments. ACE50, 50 μg/mL anthocyanin extract.
Molecules 24 03427 g010

