
Nano-(Q)SAR for Cytotoxicity Prediction of Engineered Nanomaterials


1
A. N. Bach Institute of Biochemistry, Research Center of Biotechnology, Russian Academy of Sciences, Leninsky Prospect 33, 119071 Moscow, Russia
2
Physical Faculty, St. Petersburg State University, 7/9 Universitetskaya Naberezhnaya, 199034 St. Petersburg, Russia
3
Institute of Physiologically Active Compounds, Russian Academy of Sciences, Severny Proezd 1, 142432 Chernogolovka, Moscow Region, Russia
*
Author to whom correspondence should be addressed.
Molecules 2019, 24(24), 4537; https://doi.org/10.3390/molecules24244537
Submission received: 30 October 2019
/
Revised: 24 November 2019
/
Accepted: 10 December 2019
/
Published: 11 December 2019
(This article belongs to the Special Issue Integrated QSAR)
Abstract
:Although nanotechnology is a new and rapidly growing area of science, the impact of nanomaterials on living organisms is unknown in many aspects. In this regard, it is extremely important to perform toxicological tests, but complete characterization of all varying preparations is extremely laborious. The computational technique called quantitative structure–activity relationship, or QSAR, allows reducing the cost of time- and resource-consuming nanotoxicity tests. In this review, (Q)SAR cytotoxicity studies of the past decade are systematically considered. We regard here five classes of engineered nanomaterials (ENMs): Metal oxides, metal-containing nanoparticles, multi-walled carbon nanotubes, fullerenes, and silica nanoparticles. Some studies reveal that QSAR models are better than classification SAR models, while other reports conclude that SAR is more precise than QSAR. The quasi-QSAR method appears to be the most promising tool, as it allows accurately taking experimental conditions into account. However, experimental artifacts are a major concern in this case.
1. Introduction
Nanomaterials and nanoparticles (NPs) possess unique physico-chemical properties (size, shape, chemical composition, physiochemical stability, crystal structure, surface area, surface energy, and surface roughness [1]), which give them beneficial characteristics. For this reason, nanotechnology is a new and rapidly growing field of knowledge which includes design, development, and usage of NPs and nanomaterials. According to the Organization for Economic Co-operation and Development (OECD), there exist 11 types of engineered nanomaterials (ENMs): Cerium oxide, dendrimers, fullerenes, gold nanoparticles, multi-walled carbon nanotubes (MWCNTs), nanoclays, silicon dioxide, silver nanoparticles, single-walled carbon nanotubes (SWCNTs), titanium dioxide, and zinc oxide.
The toxicity of ENMs and their influence on humans and the environment should be carefully evaluated [2,3]. Generally, there are five key mechanisms of ENMs’ toxicity: (1) Direct lesion by ion detachment; (2) oxidative stress induced by reactive oxygen species; (3) adsorption of biologically active molecules; (4) photochemical and redox reactions; and (5) Trojan horse effects (NPs may act as vectors for the transport of toxic compounds into cells) [4,5,6,7,8]. Not only is complete experimental characterization of the toxicity for all varying preparations extremely laborious, but predictions of the theoretical descriptions of the correspondence between structure/composition of ENMs and their biological activity are in demand.
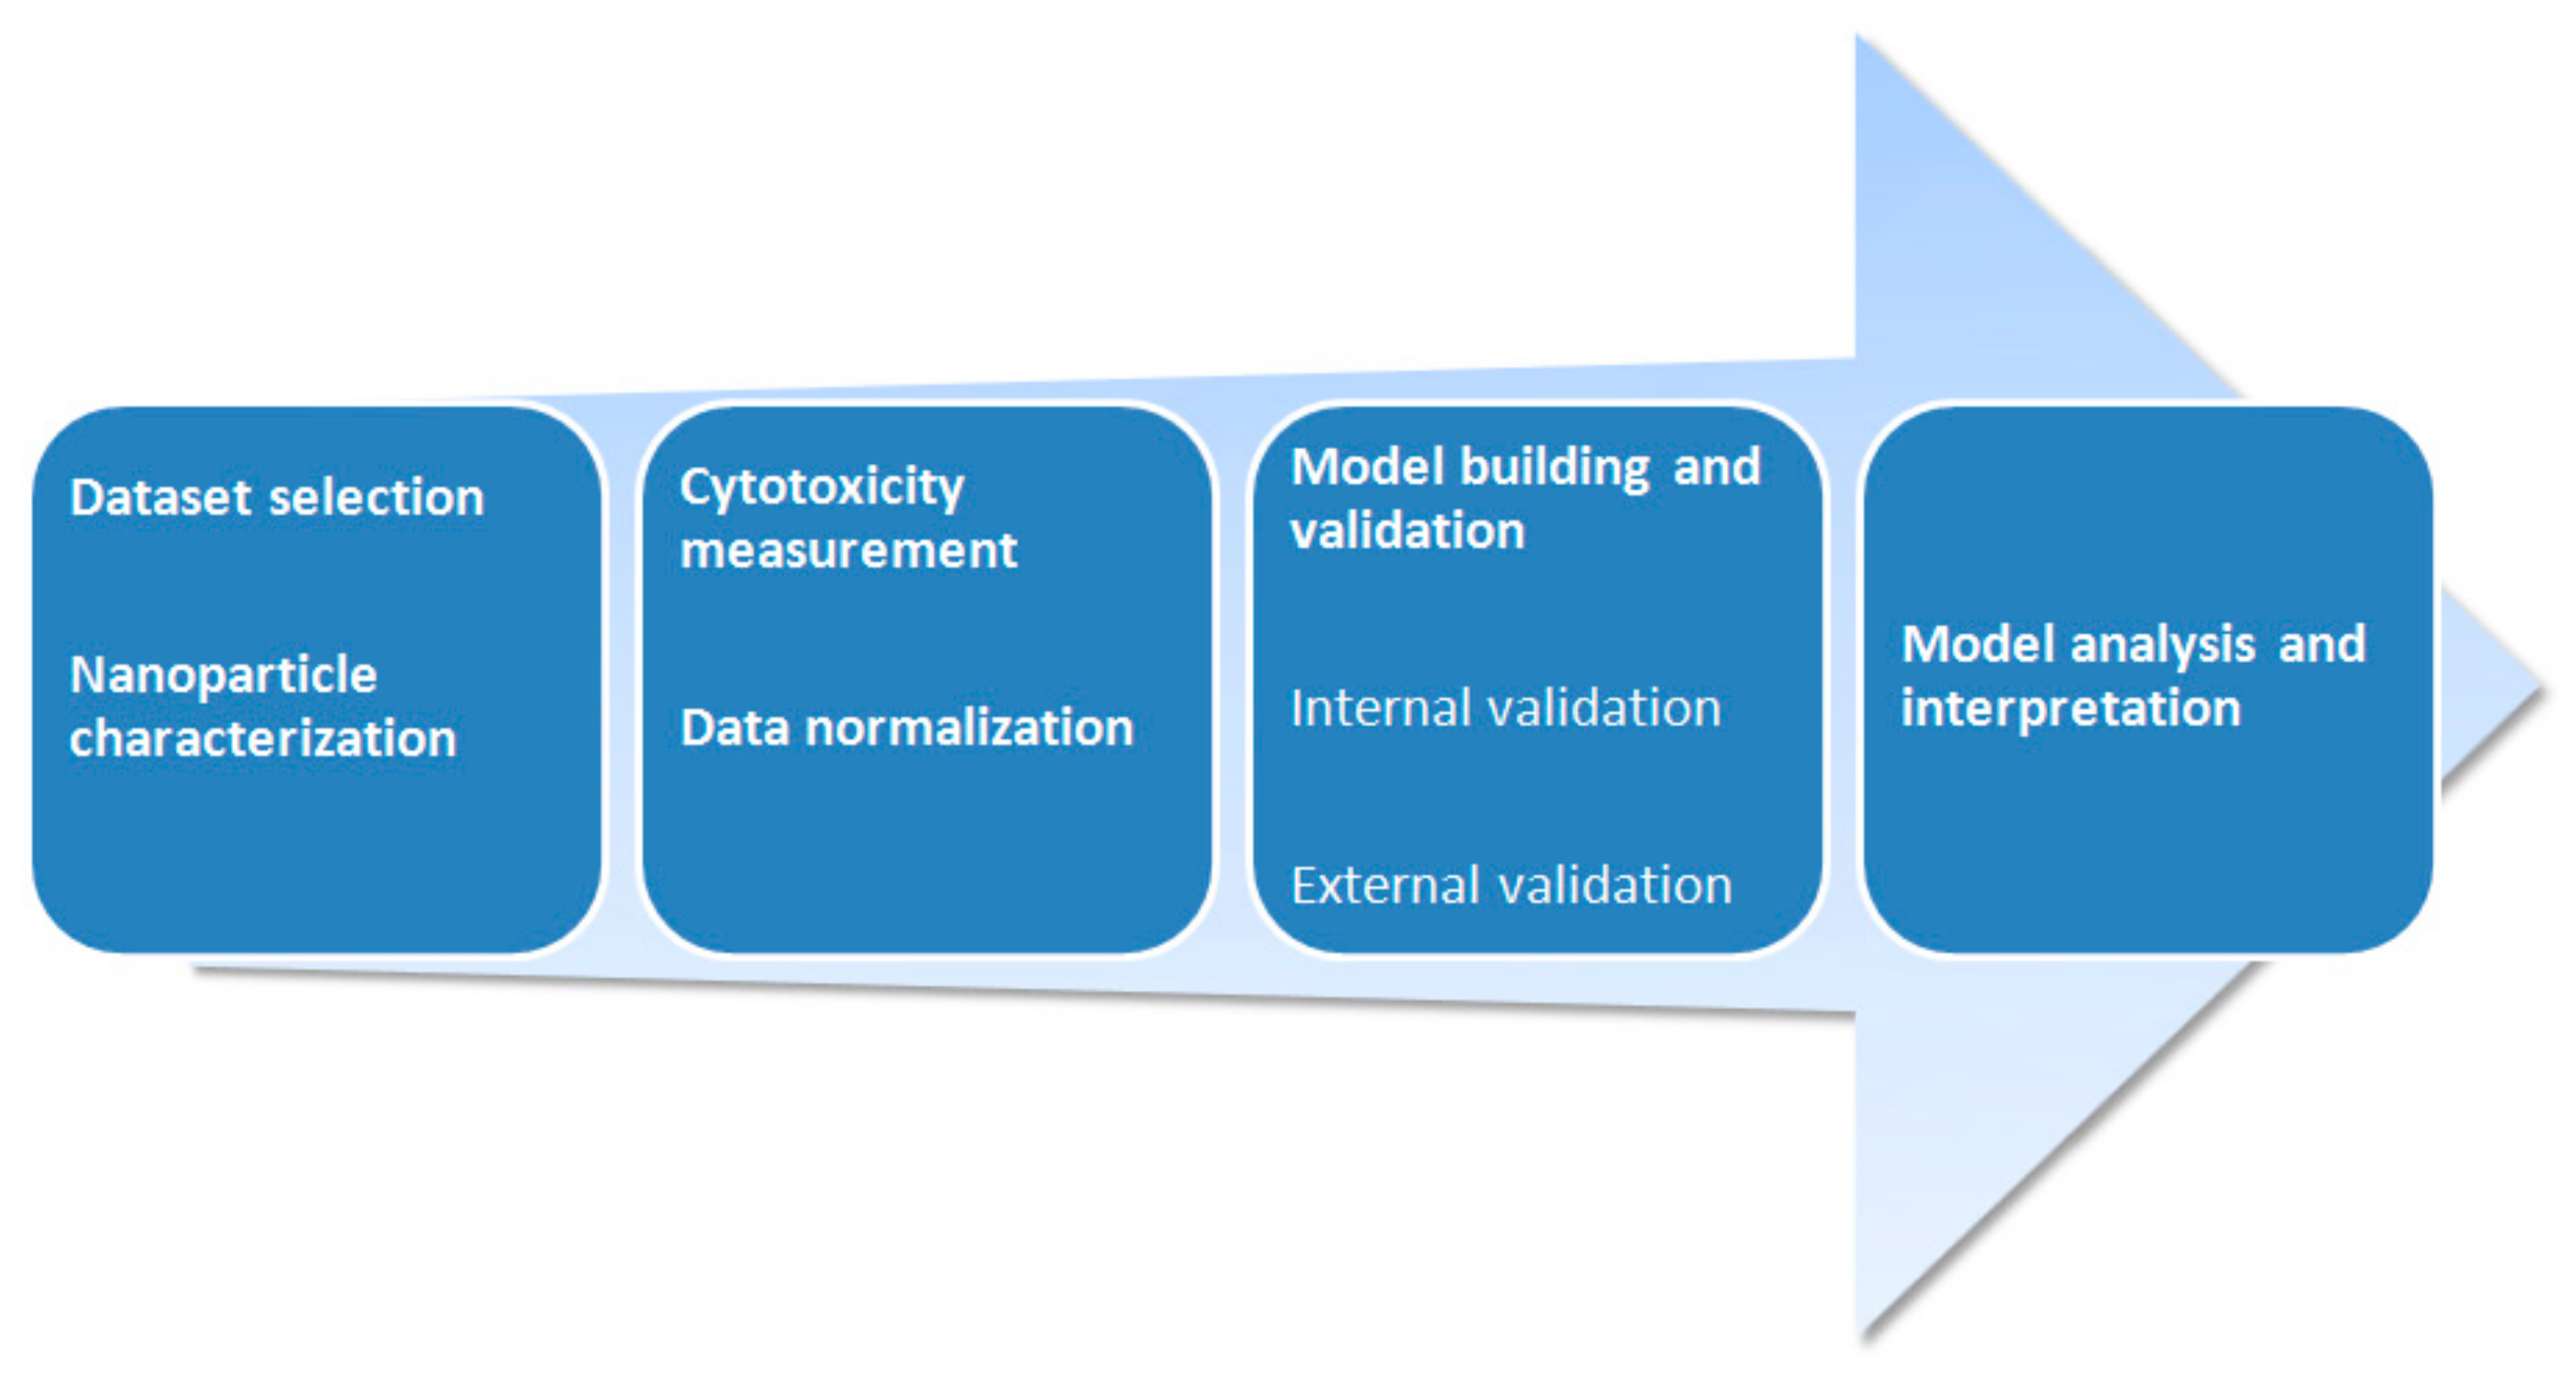
Quantitative structure-activity relationship, or QSAR (Figure 1), is an area of molecular modeling that studies relationships between structure and activity using mathematical statistics and machine learning methods. QSAR is efficiently used to predict toxicity of chemical substances [9,10,11,12,13]. Classical QSAR is a so-called Hansch analysis [14], which stands on the assumption that bioactivity of compounds is correlated with geometrical and physicochemical descriptors. Generally, a molecular descriptor can be considered as a “number” describing a certain molecular property, which might be experimentally determined (i.e., dipole moment) or calculated (i.e., potential energy), or determined from the chemical structure (i.e., number of methyl groups). However, a molecular descriptor may be a mathematically obtained property (i.e., Wiener, Balaban, or Randic indices)—chemical graph theory is often used to derive mathematical descriptors [15]. Three-dimensional QSAR is another approach which allows building relations between the spatial structure of molecules, interaction fields, and activity. The first application of the three-dimensional (3D) QSAR technique was proposed in 1988 by Cramer and co-authors [16], when they were first to develop comparative molecular field analysis (CoMFA). CoMFA supposes that differences in bio-activity depend on the change of strength of non-covalent interaction fields (electrostatic and van der Waals) around the molecules. Another 3D QSAR method is comparative molecular similarity indices analysis (CoMSIA), which takes into account the same molecular interactions as CoMFA, but with the addition of hydrophobic interactions and hydrogen bonding. CoMSIA was developed in 1994 [17]. Three-dimensional QSAR provides multiple benefits to a researcher who studies organic compounds. However, 3D QSAR and classical molecular descriptors are unable to express the specificity of nanoparticles, because their exact structure is usually unknown. This circumstance leads to a lack of sufficient molecular descriptors appropriate for nano-QSAR modeling [18].
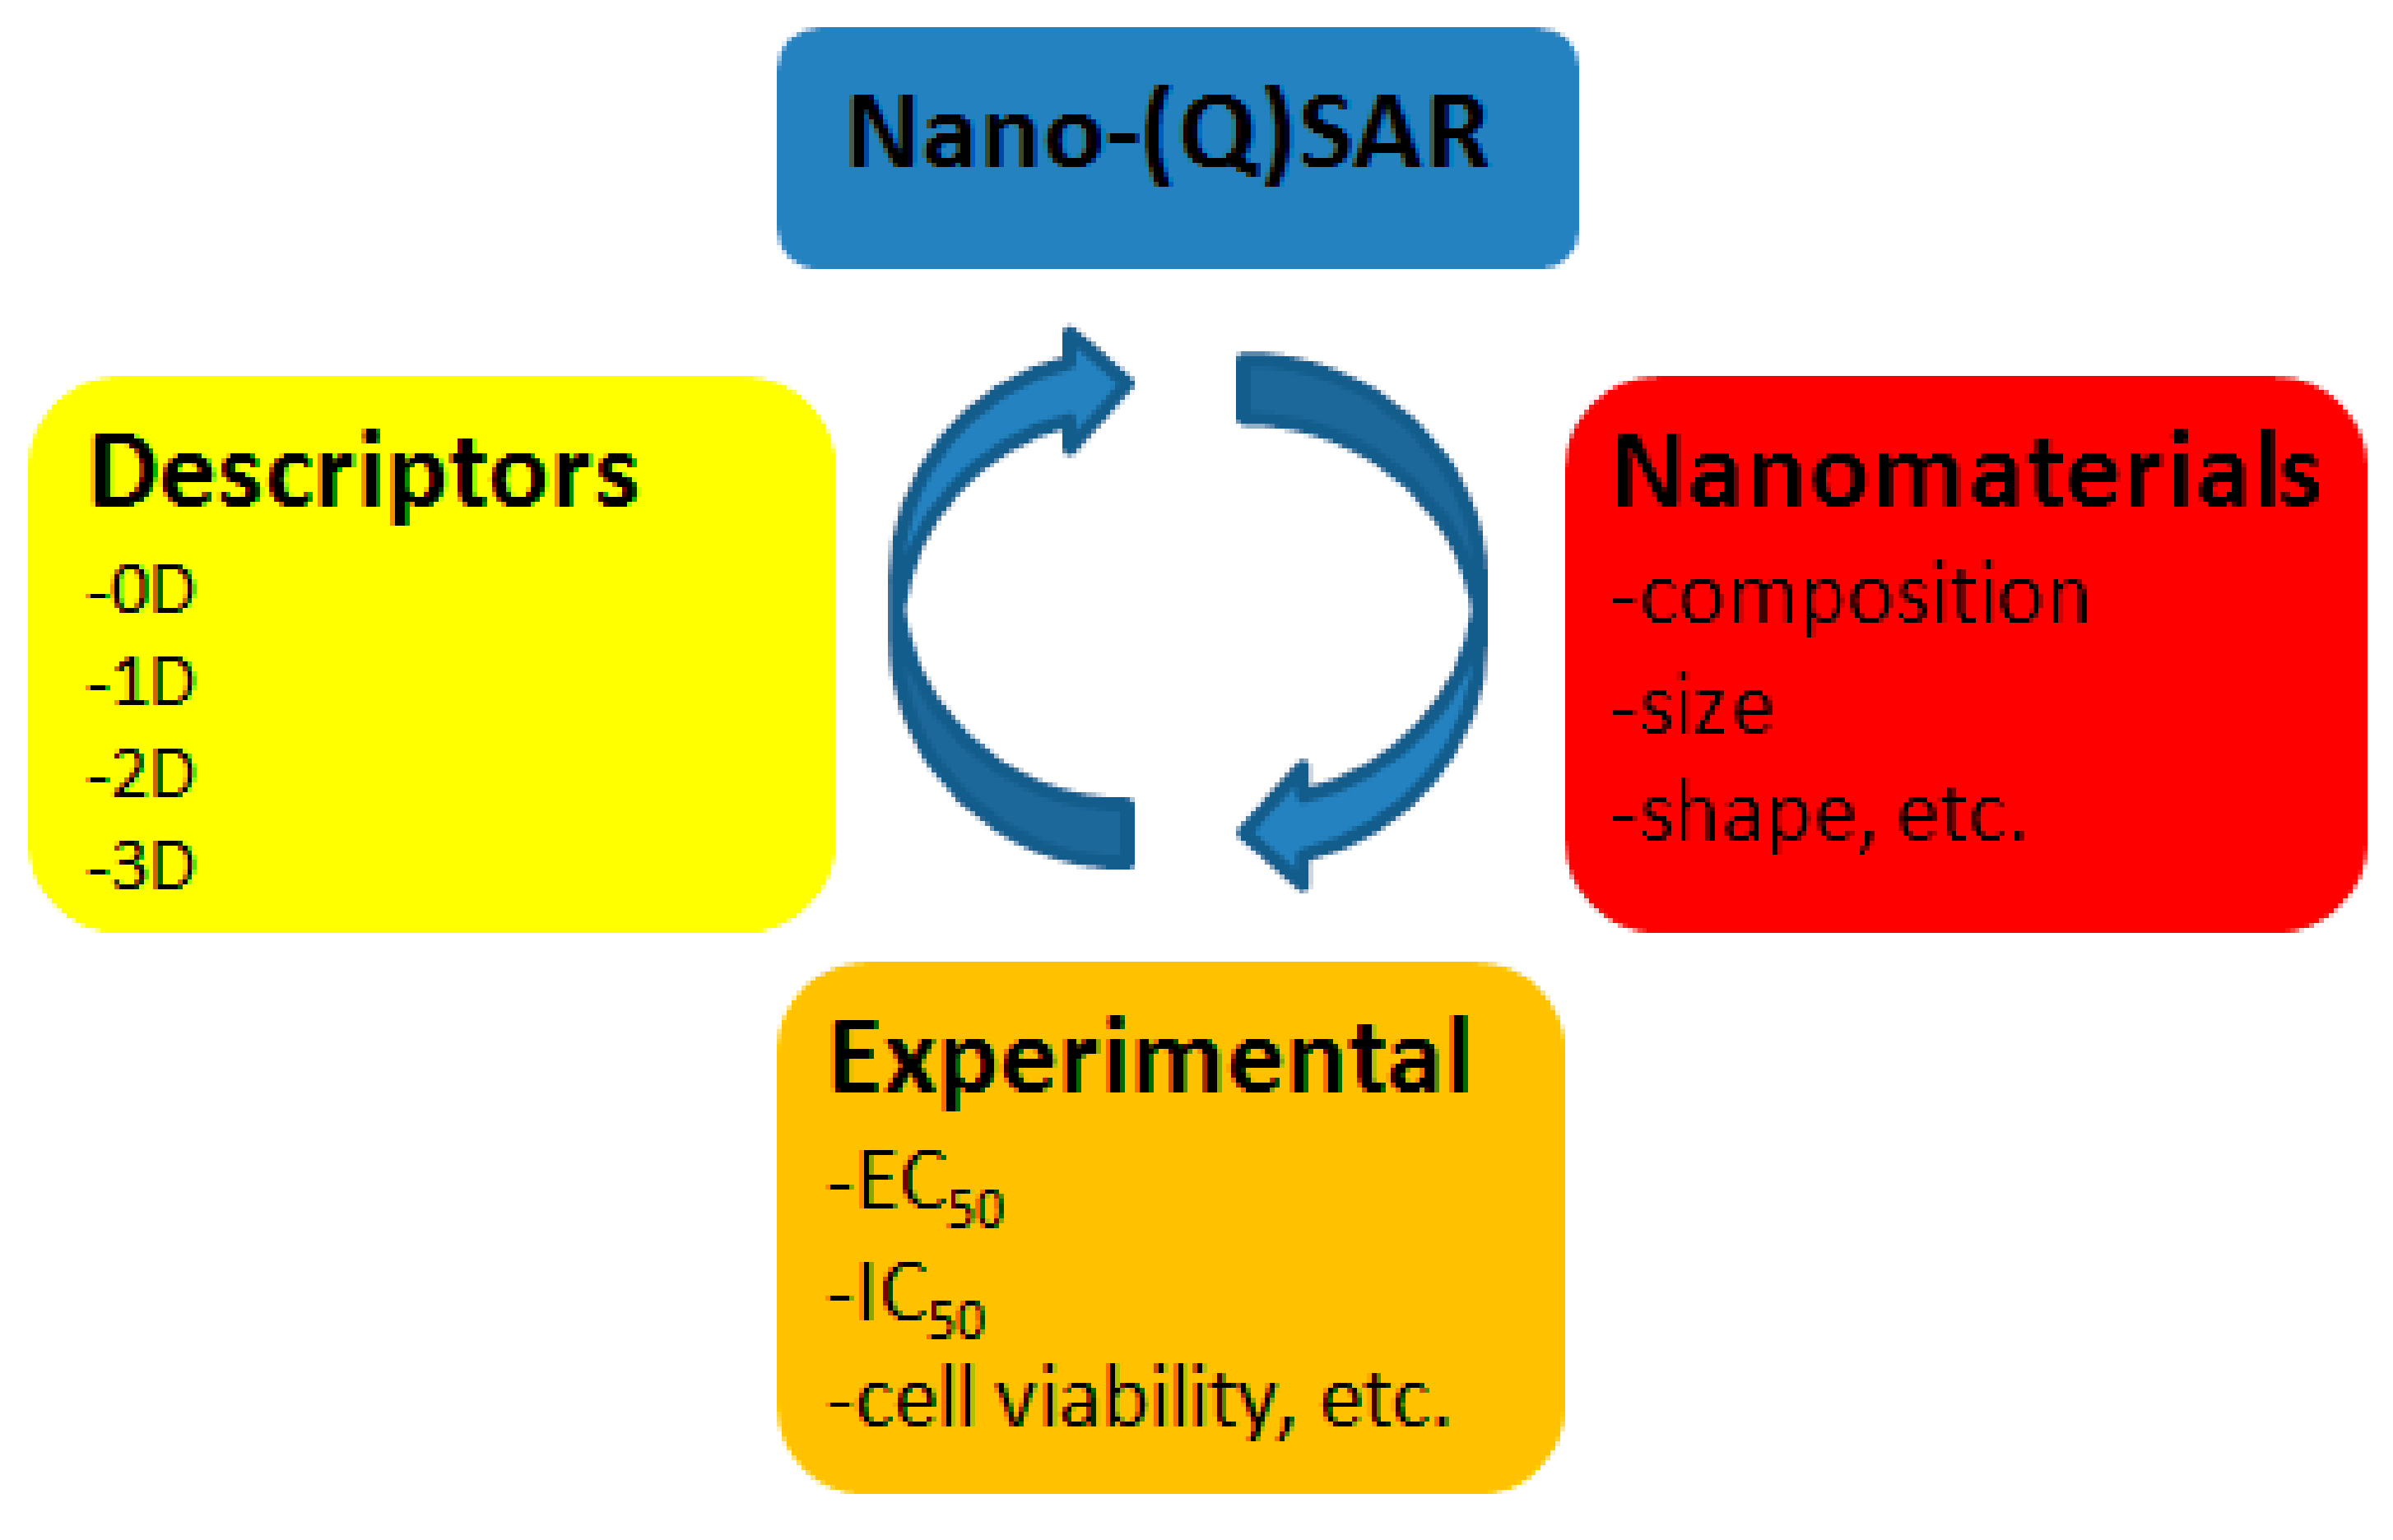
Nano-QSAR (Figure 2) allows the efficient study of nanoparticles and determination of correlations between their structure and activity [19]. Nano-QSAR may use all three approaches: One-dimensional (1D), two-dimensional (2D), and 3D QSAR [20,21,22]. However, it also raises a question: Which technique (nano-Hansch, nano-CoMFA, or nano-CoMSIA) is the best way to study nano-objects? There have been attempts to answer this question. Jagiello and co-authors compared the performance of nano-QSAR and 3D nano-QSAR, studying the activity of fullerene derivatives [23]. They concluded that nano-QSAR is a more universal approach, which allows gathering general information about the mode of biological activity of nanomaterials: Not only the receptor-based response, but also cell- and organism-based responses. The latter allows efficiently predicting the toxicity of nanoparticles. However, the application of 3D QSAR should be used to study the receptor-based response and would help in understanding such activity in detail [23]. In general, application of QSAR modeling of nanomaterials can reduce the need for time- and labor-consuming cytotoxicity tests, which are extremely important and economically feasible.
There are several classes of theoretical molecular descriptors: 0D-descriptors (for example, constitutional and count descriptors), 1D descriptors (for example, structural fragments, fingerprints), 2D descriptors (graph invariants), and 3D descriptors (quantum-chemical descriptors, size, steric, surface, and volume descriptors). Molecular descriptors cannot be determined for super-complex substances such as NPs and ENMs, since clear representation of their molecular structure is usually absent. In this regard, the basic idea is to change the traditionally used paradigm of “the endpoint is a mathematical function of the molecular structure”, to another paradigm: “The endpoint is a mathematical function of available eclectic information”. The eclectic data may include experimental data and can be (1) conditions of a synthesis, (2) technological attributes, (3) size of nanoparticles, (4) concentration, and (5) attributes related to cell membranes, etc. Such an approach is called quasi-QSAR [24].
In this respect, the aim of the present review is to summarize all available data on nano-QSAR usage for cytotoxicity predictions of nanomaterials and nanoparticles. In addition, we attempt to analyze the efficiency of 2D and 3D QSAR in studying nanomaterials, to compare which technique is the best for each class of nanoparticles: Fullerenes, metal oxides, metal nanoparticles, etc. We also critique recent papers on the usage of nano-QSAR for cytotoxicity research. This review summarizes exactly ten years of experience since the appearance of the first paper [25] studying the cytotoxicity of nanomaterials with the (Q)SAR technique. We establish here classes of NPs with available data for (Q)SAR consideration: Metal oxides, metal-containing particles, MWCNTs, fullerenes, and silica.
2. Metal Oxides
Metal oxide NPs are used in renewable energy, wastewater treatment, electronics, cosmetics, textiles, foods, agriculture, medicine, pharmaceutics, and for many other purposes. Metal oxides are probably the most well-studied object of nano-QSAR research. The pioneer work by Hu et al. investigated seven nano-sized metal oxides: ZnO, CuO, Al2O3, La2O3, Fe2O3, SnO2, and TiO2. They applied the multiple linear regression (MLR) method. The cytotoxicity towards Escherichia coli was found to be highly correlated with metal cation charge. The higher the cation charge, the lower the cytotoxicity of the nano-sized metal oxide [25]. The cytotoxicity of metal oxide ENMs were measured in terms of LD50: The dosage of NPs shown to cause the death of 50% of E. coli cells.
The oxidative stress potential of metal oxide NPs could be predicted by looking at their band gap energy [5]. Puzyn and co-authors developed a model describing the cytotoxicity towards Escherichia coli of nanoparticles based on 16 different metal oxides and SiO2 [20]. All quantum-chemical calculations were performed using the PM6 semi-empirical method. They applied the MLR method combined with a genetic algorithm. The model obtained was characterized by R2 = 0.862. The model reliably predicted the toxicity of all metal oxides and included only one descriptor—ΔHMe+—which is the enthalpy of formation of a gaseous cation. The endpoint of cytotoxicity measurement was LD50. Log(1/LD50) was used as a dependent variable in the MLR equation.
The structure–cytotoxicity relationship for the same dataset of 17 metal oxide NPs was further investigated in a succession of papers [18,26,27,28,29,30,31,32]. Density functional theory (DFT)-based descriptors (energy gap, hardness, softness, electronegativity, and electrophilicity index), in conjunction with the MLR statistical method, were used to find a high correlation between experimental and predicted activity values [27]. The absolute electronegativity is defined as half of the summation between the ionization potential and the electron affinity. The absolute hardness is defined as half the difference between the ionization potential and the electron affinity. Within the Koopmans’ theorem approximation, these parameters can be expressed as the highest occupied molecular orbital (HOMO) and lowest unoccupied molecular orbital (LUMO) energies. Thus, electronegativity (χ) is determined according to the equation:
Hardness (η) is determined according to the equation:
In a model by Kar et al., electronegativity (χ) and charge of the metal cation were used as molecular descriptors to build QSAR models for the prediction of cytotoxicity of metal oxide NPs (Table 1). They hypothesized that small particles of metal oxides release an electron much easier than the same particles in the crystal structure; small fragments initiate formation of reactive oxygen species, which invoke the oxidative stress condition to bacteria [28]. A simple QSAR model with high predictive ability (R2 = 0.87) was built based on two descriptors: Absolute electronegativity of metal and electronegativity of metal oxide [32]. In addition, a high correlation (R2 = 0.804) was obtained to predict the photo-toxicity of metal oxide NPs using two descriptors: Molar heat capacity and LUMO energy of the metal oxide [32]. The best model by Mu et al. associated cytotoxicity of 16 metal oxide NPs towards E. coli with enthalpy of formation of a gaseous cation (ΔHme+) and polarization force (Z/r) [33]:
The model by Pan et al. used the same dataset, a simplified molecular input line entry system (SMILES)-based optimal descriptor and the MLR method, and showed the highest predictive ability towards both training (R2 = 0.89–0.98) and test set (R2 (test) = 0.82–0.87) [18]. Other works [20,27,28,32,33] also used the MLR method.
Log(1/EC50) = (4.412 ± 0.165) + (−0.121 ± 0.068) Z/r + (0.001 ± 2.57 × 10⁻⁴)ΔHme+
Classification models were developed using Monte Carlo modeling [26], random forest (RF) [29,39], the ensemble learning approach [30], the read-across method [31], support vector machines (SVMs) [40], and counter propagation artificial neural networks [38]. Toropov et al. used Monte Carlo optimization of correlation weights and SMILES-based optimal descriptor [26]. The detailed validation of the model with an external dataset and six splits was performed. The distribution of the R2 (test) values predicted was within the 0.83–0.96 range. The model was based on the information about the presence of oxygen and double bonds [26]. Liquid drop model (LDM)-based descriptors [56], van der Waals interactions, electronegativity, and metal–ligand binding characteristics contributed to the model by Sizochenko and co-authors [29]. However, this model suffered from over-fitting: It was obtained using 13 training set NPs with seven descriptors. The RF model in [39] associated cytotoxicity with oxygen in weight percentage and enthalpy of formation of a gaseous cation. Singh and Gupta built an ensemble learning model with high stability and high predictive ability using three descriptors: Oxygen percent, molar refractivity, and polar surface area [30]. Gajewicz et al. used ionization enthalpy of the detached metal atoms to classify metal oxide NPs into toxic and non-toxic NPs [31]. The counter propagation artificial neural network models were tested for the prediction of metal oxide cytotoxicity towards E. coli by Fjodorova and co-authors [38]. The cytotoxicity of metal oxide NPs was found to be correlated with metal electronegativity by Pauling scale, number of metal atoms in oxide, number of oxygen atoms in oxide, and charge of metal cation [38].
Nano-QSAR was proposed to evaluate the cytotoxicity of metal oxide NPs towards E. coli [40]. Six molecular descriptors were selected and calculated using the DFT-B3LYP method. Linear and nonlinear models were built using the MLR and SVM methods, respectively. The results demonstrated that both models possessed high stability and good predictive performance, yet the statistical parameters of the SVM model were slightly higher. Five quantum-chemical parameters, namely, the highest occupied molecular orbital (HOMO) energy, α-LUMO (lowest unoccupied molecular orbital) and β-LUMO energy, the average of α-LUMO and β-LUMO, and the energy gap between the frontier molecular orbitals ∆E, as well as molar heat capacity (Cp), were involved in the model. It was revealed that LUMO energy and Cp were the two key descriptors affecting the cytotoxicity of metal oxide NPs [40]. Kaweeteerawat et al. worked with a different dataset of 24 metal oxide NPs and used an SVM approach to build a classification model, with conduction band energy and hydration enthalpy (ΔHhyd) descriptors used to predict cytotoxicity towards E. coli [41]. The endpoint of cytotoxicity measurement was IC50, which is a half-maximal growth inhibitory concentration.
Gajewicz and co-authors performed a joint experimental–theoretical study to develop a nano-QSAR model describing the toxicity of 18 metal oxide NPs towards human keratinocyte cell line (HaCaT cells); they built a genetic algorithm MLR model using enthalpy of formation of metal oxide and Mulliken’s electronegativity descriptors [42]. Sizochenko with co-authors used the same dataset, in addition to LDM-based descriptors, van der Waals interactions, electronegativity, and metal–ligand binding descriptors, to build a RF model [29]. While using the same dataset, a SMILES-based optimal descriptor allowed the building of an MLR model [18]. The RF model by Basant and Gupta associated cytotoxicity with 10-based logarithm of solubility measured in mol/L (LogS), topological polar surface area (TPSA), and Mulliken’s electronegativity.
The comparison of the toxicity of metal oxide NPs towards bacteria E. coli (prokaryotic organism) and HaCaT cells (eukaryote) revealed that, in both cases, the exposure to metal oxide NPs caused an increase in the production of reactive oxygen species, which led to oxidative stress and, subsequent, cytotoxicity. However, the authors concluded that different modes of toxic action occur between prokaryotic and eukaryotic organisms: Dissimilarities in cell morphology, surface redox activity, and the ability of metal cations to release from the NP surface [42]. Sizochenko et al. also explored experimental toxicity data of metal oxide nanoparticles to both E. coli and HaCaT cells. They developed nano-QSAR models which showed the dissimilarities in the mechanisms of toxicity of metal oxide NPs towards eukaryotic and prokaryotic cells [29]. The individual size and aggregation size were found to be the most important factors for the toxicity towards E. coli and HaCaT cells, especially for the latter [18]. It was found that cytotoxicity of metal oxide NPs towards E. coli and HaCaT are correlated. pEC50 (half maximal effective concentration in logarithmic form) of E. coli depended on the enthalpy of formation of a gaseous cation (ΔHMe+), charge of the metal cation (χox), and pEC50 of HaCaT, while pEC50 of HaCaT depended on the enthalpy of formation of metal oxide (ΔHf) nano-cluster, electronic chemical potential of the cluster, and pEC50 of E. coli [36]. Kuz’min et al. also investigated cytotoxicity of metal oxide NPs towards both HaCaT cells and E. coli. Poor applicability of classic 2D descriptors for representation of metal oxide nanoparticles was demonstrated. The combination of 1D descriptors and size-dependent descriptors was used to reveal the composition of nanoparticles. For this purpose, descriptors based on the fundamental characteristics of atoms (nuclear charge, ionization potential, electronegativity, ionic radius, etc.) were combined with descriptors obtained from the structural formula (atomic mass of the metal, charge of the nucleus of the atom, van der Waals radius of a metal, etc.), and LDM-derived size-dependent parameters (Wigner-Seitz radius Rwz, mass density ρ, thickness of interfacial layer h, etc.) [8]. These results indicate that the specific role in cytotoxicity of metal oxide NPs is driven both by size-dependent parameters and by the chemical nature of metal ions. As was revealed in the previous studies, the main factor determining the cytotoxicity of nano-sized metal oxides is the charge of the metal ion.
A single QSAR model for predicting cytotoxicity of 16 metal oxide NPs both towards E. coli and HaCaT cells was built in [37]. The model was based on the representation of the available data, encoded into quasi-SMILES. Quasi-SMILES are an analog and an attractive alternative to more traditional SMILES. Quasi-SMILES are a tool to represent different conditions: Physico-chemical properties and experimental conditions. The statistical quality of the models was evaluated using average determination coefficient R2 and root mean squared error (RMSE) for the training set, which were equal to 0.79 and 0.216; R2 and RMSE for the validation set were equal to 0.90 and 0.247, respectively [37].
Classification cytotoxicity nano-SAR models (logistic regression) were built using a set of nine metal oxide NPs, to which transformed bronchial epithelial cells (BEAS-2B) were exposed. The best model had a 100% classification accuracy to both internal and external validation. This model was based on three descriptors: Atomization energy of the metal oxide, period of the nanoparticle metal, and nanoparticle primary size [46]. In another study, SAR models were developed using 24 metal oxide NPs towards BEAS-2B and murine myeloid (RAW 264.7) cells. Zhang et al. [6] reported regression tree models using the metal dissolution of metal oxide NPs and energy of conduction band to predict the toxicity potential of 24 metal oxide NPs. The conduction band energy was derived from the following equation with pH = 7.4 in a biological system:
where Ec refers to conduction band energy; χoxide is an absolute electronegativity of metal oxide; Eg is a band gap; and PZZP is a point of zero zeta potential.
Ec = − χoxide + 0.5Eg + 0.059(PZZP − pH)
Application of the SMILES-based optimal descriptors and quasi-SMILES (dose, exposure time) were used to build a predictive model for cell membrane damage caused by 24 metal oxide NPs towards BEAS-2B cells [49]. The experimental data were taken from the paper by Patel and co-authors [50]. The values of activity calculated with the Monte Carlo method were in good agreement with the experimental data [49].
A SVM approach, in conjunction with conduction band energy and ionic index (a parameter used to calculate the metal ion hydration energy, which is an indicator of the ability to form hydrated metal ions) descriptors, was used by Liu et al. The model had a high classification accuracy of 93.74% [48]. With the data from Zhang et al., Sizochenko et al. [47] built nano-SAR models for BEAS-2B and RAW 264.7 cell lines with high predictivity; they used seven and nine descriptors, respectively. The model for BEAS-2B cells included the following descriptors: Mass density, covalent index (represents interactions of NPs with protein-bound sulfhydryl and depleting glutathione), cation polarizing power (represents electrostatic interactions between NPs and cells), Wigner-Seitz radius [56], surface area-to-volume ratio and aggregation parameter (both of which are LDM-based descriptors), and tri-atomic descriptor of atomic charges (SiRMS descriptor [34,35]). The model for RAW 264.7 cell line included the following descriptors: Mass density, molecular weight, electronegativity, covalent index, surface area, surface area-to-volume ratio, two-atomic descriptor of van der Waals interactions, tetra-atomic descriptor of atomic charges, and size. As a whole, ionic, fragmental, and LDM-based descriptors revealed the structure and characteristics of metal oxide NPs [47]. A partial least squares (PLS) regression analysis was performed by Forest et al., in which 25 nanoparticles from six metal oxides with different particle sizes and shapes were synthesized and characterized. Their toxicity was evaluated using RAW 264.7 cells. A model with four chemical composition-related descriptors (metal cation charge, hydration rate, radius of the metallic cation, and Pauling electronegativity) was also built [53].
Cytotoxicity of 42 metal oxide NPs was investigated in [54]. A set of 24 TiO2 NPs and 18 ZnO NPs were tested for their ability to disrupt the lipid membrane in cells. Data were measured in rat L2 lung epithelial cells and rat lung alveolar macrophages. Size, concentration, size in phosphate-buffered saline, size in water, and zeta potential descriptors were used in multivariate linear regression and linear discriminant analysis (LDA)-based classification [54]. The same dataset was used by Papa et al. A total of 31 NPs was used to develop an MLR model based on three descriptors: Engineered size, size in phosphate-buffered saline (PBS), and concentration. The best model developed only for ZnO NPs was based on the same descriptors: Engineered size, size in PBS, and concentration. The best combination of variables selected to model TiO2 NPs was engineered size and concentration. Additionally, a simple classification model was developed, which predicted the potential for cell membrane disruption of the studied nanoparticles with good accuracy on the basis of two empirical descriptors: Experimentally determined size and concentrations. The obtained models may be beneficial to screen the potential harmful effects of nanoparticles to human and living organisms and to perform optimal design of toxicological tests [55].
Classification models for six different metal oxides and SiO2 were presented in [57]. The authors compared the performance of four different algorithms: Generalized linear model, SVM, RF, and neural network. The neural network model was identified as the model with the best predicting ability. The analysis of relative descriptor importance for the built neural network model identified dose, formation enthalpy, exposure time, and hydrodynamic size as the four most important descriptors [57]. However, the advantage of regression models for the analysis of toxicity of NPs was shown in comparison with the classification models on metal NPs and metal oxide NPs [58]: Regression models allow not only qualitative, but also a quantitative evaluation of the studied nanomaterials.
A quasi-QSAR model (based on quasi-SMILES descriptors) was developed to predict the cell viability of human BEAS-2B and HaCaT cells exposed to 21 metal oxide NPs. The cell viability data originated from six research articles [6,42,44,45,51,52]. Quasi-SMILES descriptors (core size, hydrodynamic size, surface charge, and dose) represented the physicochemical properties and experimental conditions. Hierarchical cluster analysis (HCA) and the min–max normalization method were used, and their performance compared. The quasi-QSAR model built using quasi-SMILES generated by means of HCA showed better performance than the min–max normalization method. Model quality was evaluated using adjusted determination coefficient and was shown to be satisfactory [43].
In conclusion, we have summarized the data relating to 39 QSAR and SAR models (18 for E. coli, nine for HaCaT cells, six for transformed bronchial epithelial cells (BEAS-2B), four for murine myeloid cells (RAW 264.7), and two for rat L2 lung epithelial cells and rat lung alveolar macrophages). Of the 39 models, 12 were built using the MLR method, which is reasonable since MLR has certain advantages compared to classification models [58]. Most of the descriptors in the described models relate to physico-chemical, constitutional, topological, and quantum mechanical types. The most popular descriptors are metal cation charge, electronegativity, and enthalpy of formation.
3. Other Metal-Containing Nanoparticles
In a pioneer work [59], an SVM classification model was developed using the experimental data of 44 different NPs from Shaw et al. [60]. The model used four experimentally determined descriptors: Size, zeta potential evaluating the intensity of charge on their surface, and R1 and R2 relaxivities estimating their magnetic properties. The authors concluded that QSAR is an appropriate methodology for predicting the cytotoxicity of novel nanomaterials, as well as for the design and manufacture of safer NPs. Fourches and co-authors also analyzed a dataset by Weissledder et al. [61], where cellular uptake was evaluated. They used both SVM classification and kNN regression to build predictive models. The most important descriptors were lipoplicity and a number of double bonds [59]. Yet another nano-QSAR study for the prediction of the cytotoxicity of metal-containing NPs was conducted in [62] using smooth muscle cells from Shaw et al. [60]. The model was built based on cytotoxicity data for 31 NPs using MLR and a Bayesian regularized artificial neural network. The model predicting smooth muscle apoptosis (SMA) consisted of three descriptors: Core material (IFe2O3), surface coating (Idextran), and surface charge (Isurf.chg):
SMA = 2.26(±0.72) − 10.73(±1.05)IFe2O3 – 5.57(±0.98)Idextran – 3.53(±0.54)Isurf.chg
IFe2O3 was set to 1 for the Fe2O3 core and 0 when the core was Fe3O4. Idextran was equal to 1 in the case of dextran coating and 0 for the others. Surface functionality was equal to 1 (basic), −1 (acidic), or 0 (neutral). The model possessed a determination coefficient for the training set equal to 0.81 and 0.86 for the test set. Table 2 summarizes the information about nano-(Q)SAR models predicting cytotoxicity of metal-containing nanoparticles.
A nano-SAR model was built allowing the classification of 44 iron core-based NPs into bioactive or inactive, using a naive Bayesian classifier based on four descriptors: Primary size, spin-lattice and spin-spin relaxivities, and zeta potential [63]. Liu et al. measured toxicity of 82 NPs against zebrafish embryo; NPs included metal and metal oxide, dendrimer, and polymeric NPs. The principal descriptors were concentration, shell composition, surface functional groups, purity, core structure, and surface charge [64].
A QSAR-perturbation model was built and predicted the cytotoxicity of NPs with an accuracy higher than 93%. Cytotoxicity against several mammalian cell lines was taken into account. The influences of molar volume, polarizability, and size of the particles were involved as principal descriptors of the model. The cytotoxicity of different silica (SiO2), nickel (Ni), and nickel oxide (NiO) NPs was predicted and found to be in consensus with the experiment. The dataset consisted of 1681 cases (nanoparticle-nanoparticle pairs) [65]. A perturbation model was developed for the prediction of eco- and cytotoxicity of NPs; molar volume, polarizability, size of NPs, electronegativity, hydrophobicity, and polar surface area of surface coating descriptors were included in the model. The endpoint of cytotoxicity measurement were taken from several sources: CC50 (cytotoxic concentration of the nanoparticle leading to 50% reduction in cell viability), EC50 (effective concentration of the nanoparticle that inhibits at 50% the growth of the living system), IC50 (concentration of the nanoparticle that inhibits the root elongation of the living system at 50%), TC50 (concentration that causes toxic effects in 50% of the living system), LC50 (lethal concentration that causes mortality in 50% of the living system). These cytotoxicity endpoint measurements were used with different cutoff values to divide NPs into two classes: Either toxic or nontoxic [66]. In their work, Kleandrova et al. developed nano-QSAR models with the aim to test the ecotoxicity of NPs on several assay organisms (bio-indicators). Ecotoxicity of three nickel-based nanoparticles was predicted. The predictions were found to be in very good agreement with the experimental evidence, confirming that Ni-nanoparticles are not ecotoxic when compared with other NPs [67]. Further, a unified in silico machine learning model based on artificial neural networks was developed by Concu and co-authors [68]; the model was aimed to simultaneously predict general toxicity profiles of NPs under diverse experimental conditions. Application of perturbation theory to a set of 260 unique NPs showed higher accuracy of more than 97%. Two families of descriptors were used in this study: Physico-chemical and 2D topological [68].
Global classification models were built to predict the ecotoxicity of metal core NPs. The toxicity data were retrieved from the dataset of [69]. Four tree methods (functional tree, C4.5 decision tree, random tree, and simple classification and regression trees (CART)) were used for model development. EC50, LC50, and MIC (minimum inhibitory concentration) were used as endpoints of cytotoxicity measurement. Global nano-SARs across species were shown to correctly predict more than 70% of the samples in training (320 NPs) and test sets (80 NPs). Species-specific classification models were also developed for Danio rerio, Daphnia magna, Pseudokirchneriella subcapitata, and Staphylococcus aureus. The descriptors used were molecular polarizability, accessible surface area, and solubility [70]. Species-specific models also showed high predictive ability. Boukhvalov and Yoon investigated metal NPs and developed descriptors based on the results of first-principle calculations. To estimate the activity of metal NPs, they regarded two reactions: Ion extraction from the surface of an NP to aqueous media and water dissociation on the surface. They performed calculations for a set of metals: Al, Fe, Cu, Ag, Au, and Pt. Different models of NPs were used: (001) and (111) surfaces, nanorods, and two cubic nanoparticles of 0.6 and 0.3 nm size. Significant energy dependence of the reactions from the selected model of NP was demonstrated. Descriptors revealed the dependence of chemical activity from the size and shape of nanoparticles [72].
The cytotoxicity of Au and Pd surface-modified TiO2-based NPs was studied using QSAR. Toxicity tests were done on E. coli and Chinese hamster ovary (CHO-K1) cells. Three types of clusters were investigated: Monometallic (Au, Pd) clusters, core-shell particles, and alloy bimetallic clusters (Au/Pd). The cytotoxic effect of monometallic Au-TiO2, Pd-TiO2, and bimetallic Au/Pd-TiO2 was stronger than that observed for pure TiO2. Size and specific surface area (Brunauer-Emmett-Teller surface, BET) of nanoparticles were important factors for toxicity estimation of modified TiO2-based nanoparticles. The mechanism of NPs’ cytotoxic action was regarded; the main factor was the release of ions from the TiO2 surface, as well as generation of reactive oxygen species and subsequently induced oxidative stress [71].
4. Multi-Walled Carbon Nanotubes (MWCNTs)
Certain MWCNTs display asbestos-like toxic effects. To reduce the need for risk assessment, it has been suggested that the physicochemical characteristics or reactivity of nanomaterials could be used to predict their hazard. Fiber-shape and ability to generate reactive oxygen species (ROS) are important indicators of high hazard materials. Asbestos is a known ROS generator, while MWCNTs may either produce or scavenge ROS [73]. Table 3 summarizes the information about nano-(Q)SAR models predicting cytotoxicity of MWCNTs.
Toxicity of MWCNTs—in particular, genotoxicity—was studied in sufficient detail. Quasi-QSAR [76] models were based on the representation of conditions (not on molecular structure) such as concentration, presence of S9 mix (metabolic activation), and usage or not of preincubation in a quasi-SMILES form. Quasi-SMILES descriptor correlation weights were calculated with the Monte Carlo method. The statistical parameters of the models for three random splits—the determination coefficient of the training set R2 and the leave-one-out cross validation parameter q2—were in the ranges 0.645–0.809 and 0.473–0.726, respectively [74]. In another study with usage of quasi-SMILES descriptors, the model was a function of dose, metabolic activation, and two types of MWCNTs (the first with diameter of 44 nm and surface area of 69 m2/g, and the second with diameter of 70 nm and surface area of 23 m2/g) [76]. In yet another study, the genotoxicity of MWCNTs was studied, along with fullerenes. Genotoxicity was a function of five parameters: Particle type (fullerene or MWCNT), illumination (dark or irradiation), concentration, metabolic activation, and preincubation. Statistical parameters of the models were satisfactory [78].
Nano-QSAR models were constructed to predict the toxicity of 20 MWCNTs types (276 data records) towards human lung cells by using a quasi-SMILES optimal descriptor [80]. Quasi-SMILES were used to represent the physico-chemical properties and experimental conditions for the MWCNTs: Diameter, length, surface area, in vitro toxicity assay, cell line, exposure time, and dose. The model calculations were performed by using the Monte Carlo method. The quasi-SMILES-based nano-QSAR model provided sufficient statistical parameters (determination coefficient R2 for internal validation datasets were in the range 0.60−0.80; R2 for external validation datasets were equal to 0.81−0.88).
5. Fullerenes
Toropov et al. continued to study the toxicity of fullerenes in further publications. The experimental data on the cytotoxicity of C60 NPs towards Salmonella typhimurium was examined [79]. By means of quasi-SMILES descriptors obtained with the Monte Carlo method a mathematical model was constructed. The model was a function of dose, metabolic activation (S9 mix), and illumination (darkness or irradiation). Only one split into the training, calibration, and validation set was made. The statistical parameters of the model were not notably high: R2 = 0.755, q2 = 0.571 [81]. In the next study, two datasets were used for the bacterial reverse mutation test performed using either S. typhimurium or E. coli strain WP2 uvrA/pKM101 [79]. By means of the quasi-SMILES optimal descriptors calculated with the Monte Carlo method, mathematical models were built (several splits into the training, calibration, and validation set were made). The models were a function of the same experimental conditions as in the previous study: dose, metabolic activation, and illumination [82]. Table 4 summarizes the information about nano-(Q)SAR models predicting cytotoxicity of fullerenes.
6. Silica Nanomaterials
Silica (SiO2), or silicon dioxide, is one of the most commonly used ENMs. Silica can be divided into two types: Non-crystalline (amorphous) and crystalline. Amorphous SiO2 is also divided into natural amorphous silica and synthetic SiO2. SiO2 has been studied thoroughly, along with metal oxide NPs, which are discussed above. Here, we concentrate exclusively on silica NPs. Table 5 summarizes the information about nano-(Q)SAR models predicting cytotoxicity of silica nanomaterials.
A predictive model for cytotoxicity of 20- and 50-nm silica nanoparticles was built using so-called quasi-SMILES descriptors as a mathematical function of size, concentration, and exposure time. The calculation was performed using three random splits into training, calibration, and validation sets. Cell viability (%) of cultured human embryonic kidney cells (HEK293) exposed to different concentrations of silica nanoparticles was measured by MTT assay. The models obtained showed that quasi-QSAR and Monte Carlo methods can provide satisfactory models for silica nanomaterials [83].
In one of the studies, numerical data on the cellular viability of silica nanoparticles were taken from literature [85]. These data were randomly split three times into the sub-training, calibration, and validation sets. All models showed high determination coefficients (0.83–0.89), as well as high q2 parameter values (0.71–0.82) for the sub-training set. The cv% values were a function of size (20 and 100 nm), concentration, and exposure times (24, 48, and 72 h) [24].
A set of cytotoxicity experimental data corresponding to 19 data points for silica nanomaterials was investigated to compare the widely employed quasi-QSAR (with usage of quasi-SMILES optimal descriptors) and RF approaches. The endpoint of cytoxicity measurement used in this work was EC25 (the concentration level which induces 25% of maximum response above the baseline after a given treatment time). The aspect ratio and zeta potential were found to be the two most important variables for RF. Quasi-QSAR failed to reproduce these results. The predictive performance estimated from leave-one-out cross-validation was significantly higher for the RF method and substantially less over-fitting was observed. As a whole, it was demonstrated that the RF approach is applicable to modeling the cytotoxicity of silica nanoparticles [86]. However, later, Manganelli and Benfenati used CORAL software to build nano-QSAR models based on «quasi-SMILES» with more consistent experimental data and high determination coefficients: 0.80–0.95 [87].
7. Conclusions
In this study, we reviewed QSAR and SAR studies of several classes of engineered nanomaterials (ENMs): Metal oxides, metal-containing nanoparticles, multi-walled carbon nanotubes, fullerenes, and silica. The relationships between cytotoxicity and ENM properties are complex, tangled, and difficult to understand, which is partly due to the lack of detailed structural data relating to nanomaterials. In this regard, quasi-SMILES appears to be a suitable technique, which allows taking into account the experimental conditions and empirical properties (size, concentration, etc.) of ENMs. On the other hand, experimental artifacts in the characterization of the nanomaterials arise in this case, which is an important factor, in addition to the complicated interactions with living organisms [88].
Author Contributions
Writing—original draft preparation, A.A.B.; writing—review and editing, A.V.Z. and B.B.D.; supervision, B.B.D.
Funding
This research was financially supported by the Ministry of Science and High Education of the Russian Federation; state contract 14.613.21.0086 beginning on 27 November 2018; unique identifier of the project: RFMEFI61318X0086.
Conflicts of Interest
The authors declare no conflict of interests.
References
- Gatoo, M.A.; Naseem, S.; Arfat, M.Y.; Dar, A.M.; Qasim, K.; Zubair, S. Physicochemical properties of nanomaterials: Implication in associated toxic manifestations. Biomed Res. Int. 2014, 2014, 498420. [Google Scholar] [CrossRef]
- Buzea, C.; Pacheco, I.I.; Robbie, K. Nanomaterials and nanoparticles: Sources and toxicity. Biointerphases 2007, 2, 17–71. [Google Scholar] [CrossRef] [Green Version]
- Gajewicz, A.; Rasulev, B.; Dinadayalane, T.C.; Urbaszek, P.; Puzyn, T.; Leszczynska, D.; Leszczynski, J. Advancing risk assessment of engineered nanomaterials: Application of computational approaches. Adv. Drug Deliv. Rev. 2012, 64, 1663–1693. [Google Scholar] [CrossRef]
- Valko, M.; Morris, H.; Cronin, M.T. Metals, toxicity and oxidative stress. Curr. Med. Chem. 2005, 12, 1161–1208. [Google Scholar] [CrossRef] [Green Version]
- Burello, E.; Worth, A.P. A theoretical framework for predicting the oxidative stress potential of oxide nanoparticles. Nanotoxicology 2011, 5, 228–235. [Google Scholar] [CrossRef]
- Zhang, H.; Ji, Z.; Xia, T.; Meng, H.; Low-Kam, C.; Liu, R.; Pokhrel, S.; Lin, S.; Wang, X.; Liao, Y.P.; et al. Use of metal oxide nanoparticle band gap to develop a predictive paradigm for oxidative stress and acute pulmonary inflammation. ACS Nano 2012, 6, 4349–4368. [Google Scholar] [CrossRef]
- Lynch, I.; Weiss, C.; Valsami-Jones, E. A strategy for grouping of nanomaterials based on key physico-chemical descriptors as a basis for safer-by-design NMs. Nano Today 2014, 9, 266–270. [Google Scholar] [CrossRef] [Green Version]
- Kuz’min, V.E.; Ognichenko, L.N.; Sizochenko, N.; Chapkin, V.A.; Stelmakh, S.I.; Shyrykalova, A.O.; Leszczynski, J. Combining features of metal oxide nanoparticles: Nano-QSAR for cytotoxicity. Int. J. Quant. Struct. Prop. Relat. 2019, 4, 28–40. [Google Scholar] [CrossRef] [Green Version]
- Tang, W.; Chen, J.; Wang, Z.; Xie, H.; Hong, H. Deep learning for predicting toxicity of chemicals: A mini review. J. Environ. Sci. Health C Environ. Carcinog. Ecotoxicol. Rev. 2018, 36, 252–271. [Google Scholar] [CrossRef]
- Idakwo, G.; Luttrell, J.; Chen, M.; Hong, H.; Zhou, Z.; Gong, P.; Zhang, C. A review on machine learning methods for in silico toxicity prediction. J. Environ. Sci. Health C Environ. Carcinog. Ecotoxicol. Rev. 2018, 36, 169–191. [Google Scholar] [CrossRef]
- Zhang, L.; Zhang, H.; Ai, H.; Hu, H.; Li, S.; Zhao, J.; Liu, H. Applications of Machine Learning Methods in Drug Toxicity Prediction. Curr. Top. Med. Chem. 2018, 18, 987–997. [Google Scholar] [CrossRef]
- Lu, J.; Lu, D.; Fu, Z.; Zheng, M.; Luo, X. Machine learning-based modeling of drug toxicity. Methods Mol. Biol. 2018, 1754, 247–264. [Google Scholar]
- Kar, S.; Leszczynski, J. Exploration of computational approaches to predict the toxicity of chemical mixtures. Toxics 2019, 7, 15. [Google Scholar] [CrossRef] [Green Version]
- Hansch, C.; Streich, M.; Geiger, F.; Muir, R.M.; Maloney, P.P.; Fujita, T. Correlation of biological activity of plant growth regulators and chloromycetin derivatives with Hammett constants and partition coefficients. J. Am. Chem. Soc. 1963, 85, 2817–2824. [Google Scholar] [CrossRef]
- Bonchev, D.; Rouvray, D.H. Chemical Graph Theory: Introduction and Fundamentals; Taylor & Francis: London, UK, 1991. [Google Scholar]
- Cramer, R.D.; Patterson, D.E.; Bunce, J.D. Comparative molecular field analysis (CoMFA). 1. Effect of shape on binding of steroids to carrier proteins. J. Am. Chem. Soc. 1988, 110, 5959–5967. [Google Scholar] [CrossRef]
- Klebe, G.; Abraham, U.; Mietzner, T. Molecular similarity indexes in a comparative-analysis (Comsia) of drug molecules to correlate and predict their biological-activity. J. Med. Chem. 1994, 37, 4130–4146. [Google Scholar] [CrossRef]
- Pan, Y.; Li, T.; Cheng, J.; Telesca, D.; Zink, J.I.; Jianga, J. Nano-QSAR modeling for predicting the cytotoxicity of metal oxide nanoparticles using novel descriptors. RSC Adv. 2016, 6, 25766–25775. [Google Scholar] [CrossRef]
- Burello, E.; Worth, A.P. QSAR modeling of nanomaterials. Wiley Interdiscip. Rev. Nanomed. Nanobiotechnol. 2011, 3, 298–306. [Google Scholar] [CrossRef]
- Puzyn, T.; Rasulev, B.; Gajewicz, A.; Hu, X.; Dasari, T.P.; Michalkova, A.; Hwang, H.M.; Toropov, A.; Leszczynska, D.; Leszczynski, J. Using nano-QSAR to predict the cytotoxicity of metal oxide nanoparticles. Nat. Nanotechnol. 2011, 6, 175–178. [Google Scholar] [CrossRef]
- Tzoupis, H.; Leonis, G.; Durdagi, S.; Mouchlis, V.; Mavromoustakos, T.; Papadopoulos, M.G. Binding of novel fullerene inhibitors to HIV-1 protease: Insight through molecular dynamics and molecular mechanics Poisson-Boltzmann surface area calculations. J. Comput. Aided Mol. Des. 2011, 25, 959–976. [Google Scholar] [CrossRef]
- Ahmed, L.; Rasulev, B.; Turabekova, M.; Leszczynska, D.; Leszczynski, J. Receptor- and ligand-based study of fullerene analogues: Comprehensive computational approach including quantum-chemical, QSAR and molecular docking simulations. Org. Biomol. Chem. 2013, 11, 5798–5808. [Google Scholar] [CrossRef]
- Jagiello, K.; Grzonkowska, M.; Swirog, M.; Ahmed, L.; Rasulev, B.; Avramopoulos, A.; Papadopoulos, M.G.; Leszczynski, J.; Puzyn, T. Advantages and limitations of classic and 3D QSAR approaches in nano-QSAR studies based on biological activity of fullerene derivatives. J. Nanopart. Res. 2016, 18, 256. [Google Scholar] [CrossRef] [Green Version]
- Toropova, A.P.; Toropov, A.A.; Benfenati, E. A quasi-QSPR modelling for the photocatalytic decolourization rate constants and cellular viability (CV%) of nanoparticles by CORAL. SAR QSAR Environ. Res. 2015, 26, 29–40. [Google Scholar] [CrossRef]
- Hu, X.; Cook, S.; Wang, P.; Hwang, H.M. In vitro evaluation of cytotoxicity of engineered metal oxide nanoparticles. Sci. Total Environ. 2009, 407, 3070–3072. [Google Scholar] [CrossRef]
- Toropov, A.A.; Toropova, A.P.; Benfenati, E.; Gini, G.; Puzyn, T.; Leszczynska, D.; Leszczynski, J. Novel application of the CORAL software to model cytotoxicity of metal oxide nanoparticles to bacteria Escherichia coli. Chemosphere 2012, 89, 1098–1102. [Google Scholar] [CrossRef]
- Venigalla, S.; Dhail, D.; Ranjan, P.; Jain, S.; Chakraborty, T. Computational study about cytotoxicity of metal oxide nanoparticles invoking nano-QSAR. New Front. Chem. 2013, 23, 123–130. [Google Scholar]
- Kar, S.; Gajewicz, A.; Puzyn, T.; Roy, K.; Leszczynski, J. Periodic table-based descriptors to encode cytotoxicity profile of metal oxide nanoparticles: A mechanistic QSTR approach. Ecotox. Environ. Safe. 2014, 107, 162–169. [Google Scholar] [CrossRef]
- Sizochenko, N.; Rasulev, B.; Gajewicz, A.; Kuz’min, V.; Puzyn, T.; Leszczynski, J. From basic physics to mechanisms of toxicity: The “liquid drop” approach applied to develop predictive classification models for toxicity of metal oxide nanoparticles. Nanoscale 2014, 6, 13986–13993. [Google Scholar] [CrossRef]
- Singh, K.P.; Gupta, S. Nano-QSAR modeling for predicting biological activity of diverse nanomaterials. RSC Adv. 2014, 4, 13215–13230. [Google Scholar] [CrossRef]
- Gajewicz, A.; Cronin, M.; Rasulev, B.; Leszczynski, J.; Puzyn, T. Novel approach for efficient predictions properties of large pool of nanomaterials based on limited set of species: Nano-read-across. Nanotechnology 2015, 26, 015701. [Google Scholar] [CrossRef]
- Pathakoti, K.; Huang, M.-J.; Watts, J.D.; He, X.; Hwang, H.-M. Using experimental data of Escherichia coli to develop a QSAR model for predicting the photo-induced cytotoxicity of metal oxide nanoparticles. J. Photochem. Photobiol. B 2014, 130, 234–240. [Google Scholar] [CrossRef]
- Mu, Y.; Wu, F.; Zhao, Q.; Ji, R.; Qie, Y.; Zhou, Y.; Hu, Y.; Pang, C.; Hristozov, D.; Giesy, J.P.; et al. Predicting toxic potencies of metal oxide nanoparticles by means of nano-QSARs. Nanotoxicology 2016, 10, 1207–1214. [Google Scholar] [CrossRef]
- Kuz’min, V.E.; Artemenko, A.G.; Polischuk, P.G.; Muratov, E.N.; Hromov, A.I.; Liahovskiy, A.V.; Andronati, S.A.; Makan, S.Y. Hierarchic system of QSAR models (1D–4D) on the base of simplex representation of molecular structure. J. Mol. Model. 2005, 11, 457–467. [Google Scholar] [CrossRef]
- Kuz’min, V.E.; Muratov, E.N.; Artemenko, A.G.; Gorb, L.G.; Qasim, M.; Leszczynski, J. The effect of nitroaromatics composition on their toxicity in vivo. 1D QSAR research. Chemosphere 2008, 72, 1373–1380. [Google Scholar] [CrossRef]
- Kar, S.; Gajewicz, A.; Roy, K.; Leszczynski, J.; Puzyn, T. Extrapolating between toxicity endpoints of metal oxide nanoparticles: Predicting toxicity to Escherichia coli and human keratinocyte cell line (HaCaT) with Nano-QTTR. Ecotox. Environ. Safe. 2016, 126, 238–244. [Google Scholar] [CrossRef] [Green Version]
- Toropova, A.P.; Toropov, A.A.; Manganelli, S.; Leone, C.; Baderna, D.; Benfenati, E.; Fanelli, R. Quasi-SMILES as a tool to utilize eclectic data for predicting the behavior of nanomaterials. NanoImpact 2016, 1, 60–64. [Google Scholar] [CrossRef] [Green Version]
- Fjodorova, N.; Novic, M.; Gajewicz, A.; Rasulev, B. The way to cover prediction for cytotoxicity for all existing nano-sized metal oxides by using neural network method. Nanotoxicology 2017, 11, 475–483. [Google Scholar] [CrossRef]
- Basant, N.; Gupta, S. Multi-target QSTR modeling for simultaneous prediction of multiple toxicity endpoints of nano-metal oxides. Nanotoxicology 2017, 11, 339–350. [Google Scholar] [CrossRef]
- Zhou, Z.; Tang, X.; Dai, W.; Shi, J.; Chen, H. Nano-QSAR models for predicting cytotoxicity of metal oxide nanoparticles (MONPs) to E. coli. Can. J. Chem. 2017, 95, 863–866. [Google Scholar] [CrossRef]
- Kaweeteerawat, C.; Ivask, A.; Liu, R.; Zhang, H.; Chang, C.H.; Low-Kam, C.; Fischer, H.; Ji, Z.; Pokhrel, S.; Cohen, Y.; et al. Toxicity of metal oxide nanoparticles in Escherichia coli correlates with conduction band and hydration energies. Environ. Sci. Technol. 2015, 49, 1105–1112. [Google Scholar] [CrossRef]
- Gajewicz, A.; Schaeublin, N.; Rasulev, B.; Hussain, S.; Leszczynska, D.; Puzyn, T.; Leszczynski, J. Towards understanding mechanisms governing cytotoxicity of metal oxides nanoparticles: Hints from nano-QSAR studies. Nanotoxicology 2015, 9, 313–325. [Google Scholar] [CrossRef]
- Choi, J.S.; Trinh, T.X.; Yoon, T.H.; Kim, J.; Byun, H.G. Quasi-QSAR for predicting the cell viability of human lung and skin cells exposed to different metal oxide nanomaterials. Chemosphere 2019, 217, 243–249. [Google Scholar] [CrossRef]
- Yang, X.; Liu, J.; He, H.; Zhou, L.; Gong, C.; Wang, X.; Yang, L.; Yuan, J.; Huang, H.; He, L. SiO2 nanoparticles induce cytotoxicity and protein expression alteration in HaCaT cells. Part. Fibre Toxicol. 2010, 7, 1. [Google Scholar] [CrossRef] [Green Version]
- Comfort, K.K.; Maurer, E.I.; Hussain, S.M. Slow release of ions from internalized silver nanoparticles modifies the epidermal growth factor signaling response. Colloids Surf. B 2014, 123, 136–142. [Google Scholar] [CrossRef]
- Liu, R.; Rallo, R.; George, S.; Ji, Z.; Nair, S.; Nel, A.E.; Cohen, Y. Classification NanoSAR development for cytotoxicity of metal oxide nanoparticles. Small 2011, 7, 1118–1126. [Google Scholar] [CrossRef]
- Sizochenko, N.; Rasulev, B.; Gajewicz, A.; Mokshyna, E.; Kuz’min, V.E.; Leszczynski, J.; Puzyn, T. Causal inference methods to assist in mechanistic interpretation of classification nano-SAR models. RSC Adv. 2015, 5, 77739–77745. [Google Scholar] [CrossRef]
- Liu, R.; Zhang, H.Y.; Ji, Z.X.; Rallo, R.; Xia, T.; Chang, C.H.; Nel, A.; Cohen, Y. Development of structure-activity relationship for metal oxide nanoparticles. Nanoscale 2013, 5, 5644–5653. [Google Scholar] [CrossRef]
- Toropova, A.; Toropov, A.; Benfenati, E.; Korenstein, R.; Leszczynska, D.; Leszczynski, J. Optimal nano-descriptors as translators of eclectic data into prediction of the cell membrane damage by means of nano metal-oxides. Environ. Sci. Pollut. Res. Int. 2015, 22, 745–757. [Google Scholar] [CrossRef]
- Patel, T.; Telesca, D.; Low-Kam, C.; Ji, Z.; Zhang, H.Y.; Xia, T.; Zinc, J.I.; Nel, A.E. Relating nano-particle properties to biological outcomes in exposure escalation experiments. Environmetrics 2013, 25, 57–68. [Google Scholar] [CrossRef]
- Akhtar, M.J.; Ahamed, M.; Kumar, S.; Khan, M.M.; Ahmad, J.; Alrokayan, S.A. Zinc oxide nanoparticles selectively induce apoptosis in human cancer cells through reactive oxygen species. Int. J. Nanomed. 2012, 7, 845e857. [Google Scholar]
- Xiong, S.; George, S.; Yu, H.; Damoiseaux, R.; France, B.; Ng, K.W.; Loo, J.S. Size influences the cytotoxicity of poly (lactic-co-glycolic acid)(PLGA) and titanium dioxide (TiO2) nanoparticles. Arch. Toxicol. 2013, 87, 1075e1086. [Google Scholar] [CrossRef]
- Forest, V.; Hochepied, J.-F.; Leclerc, L.; Trouvé, A.; Abdelkebir, K.; Sarry, G.; Augusto, V.; Pourchez, J. Towards an alternative to nano-QSAR for nanoparticle toxicity ranking in case of small datasets. J. Nanopart. Res. 2019, 21, 95. [Google Scholar] [CrossRef] [Green Version]
- Sayes, C.; Ivanov, I. Comparative study of predictive computational models for nanoparticle-induced cytotoxicity. Risk Anal. 2010, 30, 1723–1734. [Google Scholar] [CrossRef]
- Papa, E.; Doucet, J.P.; Doucet-Panaye, A. Linear and non-linear modelling of the cytotoxicity of TiO2 and ZnO nanoparticles by empirical descriptors. SAR QSAR Environ. Res. 2015, 26, 647–665. [Google Scholar] [CrossRef]
- Smirnov, B.M. Processes involving clusters and small particles in a buffer gas. Phys. -Uspekhi 2011, 54, 691–721. [Google Scholar] [CrossRef]
- Choi, J.S.; Ha, M.K.; Trinh, T.X.; Yoon, T.H.; Byun, H.G. Towards a generalized toxicity prediction model for oxide nanomaterials using integrated data from different sources. Sci. Rep. 2018, 8, 6110. [Google Scholar] [CrossRef] [Green Version]
- Kovalishyn, V.; Abramenko, N.; Kopernyk, I.; Charochkina, L.; Metelytsia, L.; Tetko, I.V.; Peijnenburg, W.; Kustov, L. Modelling the toxicity of a large set of metal and metal oxide nanoparticles using the OCHEM platform. Food Chem. Toxicol. 2018, 112, 507–517. [Google Scholar] [CrossRef] [Green Version]
- Fourches, D.; Pu, D.; Tassa, C.; Weissleder, R.; Shaw, S.Y.; Mumper, R.J.; Tropsha, A. Quantitative nanostructure-activity relationship modeling. ACS Nano 2010, 4, 5703–5712. [Google Scholar] [CrossRef] [Green Version]
- Shaw, S.Y.; Westly, E.C.; Pittet, M.J.; Subramanian, A.; Schreiber, S.L.; Weissleder, R. Perturbational profiling of nanomaterial biologic activity. Proc. Natl. Acad. Sci. USA 2008, 105, 7387–7392. [Google Scholar] [CrossRef] [Green Version]
- Weissleder, R.; Kelly, K.; Sun, E.Y.; Shtatland, T.; Josephson, L. Cell-specific targeting of nanoparticles by multivalent attachment of small molecules. Nat. Biotechnol. 2005, 23, 1418–1423. [Google Scholar] [CrossRef]
- Epa, V.C.; Burden, F.R.; Tassa, C.; Weissleder, R.; Shaw, S.; Winkler, D.A. Modeling biological activities of nanoparticles. Nano Lett. 2012, 12, 5808–5812. [Google Scholar] [CrossRef]
- Liu, R.; Rallo, R.; Weissleder, R.; Tassa, C.; Shaw, S.; Cohen, Y. Nano-SAR development for bioactivity of nanoparticles with considerations of decision boundaries. Small 2013, 9, 1842–1852. [Google Scholar] [CrossRef]
- Liu, X.; Tang, K.; Harper, S.; Harper, B.; Steevens, J.A.; Xu, R. Predictive modeling of nanomaterial exposure effects in biological systems. Int. J. Nanomed. 2013, 8, 31–43. [Google Scholar] [CrossRef] [Green Version]
- Luan, F.; Kleandrova, V.V.; González-Díaz, H.; Ruso, J.M.; Melo, A.; Speck-Planche, A.; Cordeiro, M.N. Computer-aided nanotoxicology: Assessing cytotoxicity of nanoparticles under diverse experimental conditions by using a novel QSTR-perturbation approach. Nanoscale 2014, 6, 10623–10630. [Google Scholar] [CrossRef]
- Kleandrova, V.V.; Luan, F.; González-Díaz, H.; Ruso, J.M.; Speck-Planche, A.; Cordeiro, M.N. Computational tool for risk assessment of nanomaterials: Novel QSTR-perturbation model for simultaneous prediction of ecotoxicity and cytotoxicity of uncoated and coated nanoparticles under multiple experimental conditions. Environ. Sci. Technol. 2014, 48, 14686–14694. [Google Scholar] [CrossRef]
- Kleandrova, V.V.; Luan, F.; González-Díaz, H.; Ruso, J.M.; Melo, A.; Speck-Planche, A.; Cordeiro, M.N. Computational ecotoxicology: Simultaneous prediction of ecotoxic effects of nanoparticles under different experimental conditions. Environ. Int. 2014, 73, 288–294. [Google Scholar] [CrossRef]
- Concu, R.; Kleandrova, V.V.; Speck-Planche, A.; Cordeiro, M.N.D.S. Probing the toxicity of nanoparticles: A unified in silico machine learning model based on perturbation theory. Nanotoxicology 2017, 11, 891–906. [Google Scholar] [CrossRef]
- Chen, G.; Vijver, M.G.; Peijnenburg, W.J. Summary and analysis of the currently existing literature data on metal-based nanoparticles published for selected aquatic organisms: Applicability for toxicity prediction by (Q)SARs. Altern. Lab. Anim. 2015, 43, 221–240. [Google Scholar] [CrossRef]
- Chen, G.; Peijnenburg, W.J.; Kovalishyn, V.; Vijver, M.G. Development of nanostructure-activity relationships assisting the nanomaterial hazard categorization for risk assessment and regulatory decision-making. RSC Adv. 2016, 6, 52227–52235. [Google Scholar] [CrossRef]
- Mikolajczyk, A.; Sizochenko, N.; Mulkiewicz, E.; Malankowska, A.; Nischk, M.; Jurczak, P.; Hirano, S.; Nowaczyk, G.; Zaleska-Medynska, A.; Leszczynski, J.; et al. Evaluating the toxicity of TiO(2)-based nanoparticles to Chinese hamster ovary cells and Escherichia coli: A complementary experimental and computational approach. Beilstein J. Nanotechnol. 2017, 8, 2171–2180. [Google Scholar] [CrossRef] [Green Version]
- Boukhvalov, D.W.; Yoon, T.H. Development of theoretical descriptors for cytotoxicity evaluation of metallic nanoparticles. Chem. Res. Toxicol. 2017, 30, 1549–1555. [Google Scholar] [CrossRef]
- Nymark, P.; Jensen, K.A.; Suhonen, S.; Kembouche, Y.; Vippola, M.; Kleinjans, J.; Catalán, J.; Norppa, H.; van Delft, J.; Briedé, J.J. Free radical scavenging and formation by multi-walled carbon nanotubes in cell free conditions and in human bronchial epithelial cells. Part. Fibre Toxicol. 2014, 11, 4. [Google Scholar] [CrossRef] [Green Version]
- Toropov, A.A.; Toropova, A.P. Quasi-QSAR for mutagenic potential of multi-walled carbon-nanotubes. Chemosphere 2015, 124, 40–46. [Google Scholar] [CrossRef]
- Wirnitzer, U.; Herbold, B.; Voetz, M.; Ragot, J. Studies on the in vitro genotoxicity of baytubes, agglomerates of engineered multi-walled carbonnanotubes (MWCNT). Toxicol. Lett. 2009, 186, 160–165. [Google Scholar] [CrossRef]
- Toropova, A.P.; Toropov, A.A.; Rallo, R.; Leszczynska, D.; Leszczynski, J. Nano-QSAR: Genotoxicity of Multi-Walled Carbon Nanotubes. Int. J. Environ. Res. 2016, 10, 59–64. [Google Scholar]
- Ema, M.; Imamura, T.; Suzuki, H.; Kobayashi, N.; Naya, M.; Nakanishi, J. Evaluation of genotoxicity of multiwalled carbon nanotubes in a battery of in vitro and in vivo assays. Regul. Toxicol. Pharmacol. 2012, 63, 188–195. [Google Scholar] [CrossRef]
- Toropov, A.A.; Toropova, A.P. Quasi-SMILES and nano-QFAR: United model for mutagenicity of fullerene and MWCNT under different conditions. Chemosphere 2015, 139, 18–22. [Google Scholar] [CrossRef]
- Shinohara, N.; Matsumoto, K.; Endoh, S.; Maru, J.; Nakanishi, J. In vitro and in vivo genotoxicity tests on fullerene C60 nanoparticles. Toxicol. Lett. 2009, 191, 289–296. [Google Scholar] [CrossRef]
- Trinh, T.X.; Choi, J.S.; Jeon, H.; Byun, H.G.; Yoon, T.H.; Kim, J. Quasi-SMILES-based nano-quantitative structure-activity relationship model to predict the cytotoxicity of multiwalled carbon nanotubes to human lung cells. Chem. Res. Toxicol. 2018, 31, 183–190. [Google Scholar] [CrossRef]
- Toropov, A.A.; Toropova, A.P. Optimal descriptor as a translator of eclectic data into endpoint prediction: Mutagenicity of fullerene as a mathematical function of conditions. Chemosphere 2014, 104, 262–264. [Google Scholar] [CrossRef]
- Toropova, A.P.; Toropov, A.A.; Veselinović, A.M.; Veselinović, J.B.; Benfenati, E.; Leszczynska, D.; Leszczynski, J. Nano-QSAR: Model of mutagenicity of fullerene as a mathematical function of different conditions. Ecotox. Environ. Safe. 2016, 124, 32–36. [Google Scholar] [CrossRef] [Green Version]
- Manganelli, S.; Leone, C.; Toropov, A.A.; Toropova, A.P.; Benfenati, E. QSAR model for predicting cell viability of human embryonic kidney cells exposed to SiO₂ nanoparticles. Chemosphere 2016, 144, 995–1001. [Google Scholar] [CrossRef]
- Wang, F.; Gao, F.; Lan, M.; Yuan, H.; Huang, Y.; Liu, J. Oxidative stress contributes to silica nanoparticle-induced cytotoxicity in human embryonic kidney cells. Toxicol. Vitr. 2009, 23, 808–815. [Google Scholar] [CrossRef]
- Passagne, I.; Morille, M.; Rousset, M.; Pujalté, I.L.; L’Azou, B. Implication of oxidative stress in size-dependent toxicity of silica nanoparticles in kidney cells. Toxicology 2012, 299, 112–124. [Google Scholar] [CrossRef]
- Cassano, A.; Marchese Robinson, R.L.; Palczewska, A.; Puzyn, T.; Gajewicz, A.; Tran, L.; Manganelli, S.; Cronin, M.T. Comparing the CORAL and Random Forest approaches for modelling the in vitro cytotoxicity of silica nanomaterials. Altern. Lab. Anim. 2016, 44, 533–556. [Google Scholar] [CrossRef]
- Manganelli, S.; Benfenati, E. Nano-QSAR model for predicting cell viability of human embryonic kidney cells. Methods Mol. Biol. 2017, 1601, 275–290. [Google Scholar]
- Djurišić, A.B.; Leung, Y.H.; Ng, A.M.; Xu, X.Y.; Lee, P.K.; Degger, N.; Wu, R.S. Toxicity of metal oxide nanoparticles: Mechanisms, characterization, and avoiding experimental artefacts. Small 2015, 11, 26–44. [Google Scholar] [CrossRef]
Figure 1.
A typical workflow of QSAR modeling for nanoparticles (NPs).

Figure 2.
A general scheme of nano-(Q)SAR modeling. 0D, zero-dimensional; 1D, one-dimensional; 2D, two-dimensional; 3D, three-dimensional.
Figure 2.
A general scheme of nano-(Q)SAR modeling. 0D, zero-dimensional; 1D, one-dimensional; 2D, two-dimensional; 3D, three-dimensional.


Table 1.
Main features of (Q)SAR models predicting cytotoxicity of metal oxide nanoparticles.
| Source | Dataset | Endpoint of Cytotoxicity Measurement | n | R2 1 | Software 2 | Statistical Method | Descriptors |
|---|---|---|---|---|---|---|---|
| Escherichia coli | |||||||
| [25] | [25] | LD50 | 7 | 0.979 | - | Multiple linear regression (MLR) | Metal cation charge |
| [20] | [20] | LD50 | 17 | 0.862 | MATLAB | MLR | Enthalpy of formation of a gaseous cation |
| [26] | [20] | LD50 | 17 | 0.741–0.838 | CORAL | Monte Carlo | SMILES-based optimal descriptor |
| [27] | [20] | LD50 | 17 | 0.933 | Minitab 16 | MLR | Energy gap, hardness, softness, electronegativity, and electrophilicity index |
| [28] | [20] | LD50 | 17 | 0.81–0.90 | - | MLR | Electronegativity, charge of the metal cation corresponding to a given oxide |
| [29] | [20] | LD50 | 17 | 0.93 | RandomForest package | Random forest (RF) | S1—unbonded two-atomic fragments [Me] … [Me], which were encoded based on Simplex representation of molecular structures (SiRMS)-derived descriptors [34,35], describing distance where potential reaches minimum at van der Waals interactions; rw—Wigner–Seitz radius; ρ—mass density; (CPP)—cation polarizing power; S2—SiRMS-derived electronegativity aligned descriptor of oxides molecules—in a sense of the acid-base property of oxides (this parameter increases with a number of oxygens in molecule); S3—tri-atomic fragments [Me]-[O]-[Me], which were encoded by SiRMS-derived descriptors, encoding electronegativity; and (SV)—proportion of surface molecules to molecules in volume |
| [30] | [20] | LD50 | 17 | 0.955 | Ensemble learning | Oxygen percent, molar refractivity, and polar surface area | |
| [31] | [20] | LD50 | 17 | - | MATLAB | Read-across | Ionization enthalpy of the detached metal atoms |
| [18] | [20] | LD50 | 17 | 0.889–0.982 | CORAL | MLR | SMILES-based optimal descriptor |
| [36] | [20] | LD50 | 16 | 0.91 | - | MLR | Enthalpy of formation of a gaseous cation (ΔHMe+), charge of the metal cation (χox), and pEC50 of HaCaT |
| [33] | [20] | LD50 | 16 | 0.879 | SYBYL X1.1 and SPSS statistics v.17 | MLR | Enthalpy of formation of a gaseous cation (ΔHme+) and polarization force (Z/r) |
| [37] | [20] | LD50 | 16 | 0.79 | CORAL | Monte Carlo | Quasi-SMILES |
| [38] | [20] | LD50 | 17 | 0.92 | - | Counter propagation artificial neural network | Metal electronegativity by Pauling scale, number of metal atoms in oxide, number of oxygen atoms in oxide, and charge of metal cation |
| [39] | [20] | LD50 | 17 | 0.968 | - | RF | Oxygen in weight percentage and enthalpy of formation of a gaseous cation |
| [40] | [20] | LD50 | 17 | 0.877 and 0.903 | - | MLR and support vector machines (SVM) | HOMO energy, α-LUMO and β-LUMO energy, the average of α-LUMO and β-LUMO, the energy gap between the frontier molecular orbitals ∆E, and molar heat capacity |
| [8] | [20] | LD50 | 17 | 0.93 | - | Partial least squares (PLS) | Charge of metal ion, metal ion charge-based SiRMS, number of oxygen atoms in brutto formula weighted by ionic potential, covalent index weighted by charge of metal ion, molecular weight of metal oxide weighed by size of nanoparticle, squared thickness of interfacial layer, van der Waals repulsion weighted by size of nanoparticle, and Wigner-Seitz radius weighted by size of nanoparticle |
| [32] | [32] | LD50 | 17 | 0.87 | Self-written program | MLR | Electronegativity of metal and electronegativity of metal oxide |
| [41] | [41] | IC50 | 24 | - | R | SVM | Conduction band energy and hydration enthalpy (ΔHhyd) |
| Human keratinocyte cell line (HaCaT) | |||||||
| [29] | [42] | LD50 | 18 | 0.96 | RandomForest package | RF | S1, rw, ρ, (CI)—covalent index of the metal ion, S2, and (AP)—aggregation parameter |
| [31] | [42] | LD50 | 18 | - | MATLAB | Read-across | Mulliken’s electronegativity |
| [42] | [42] | LD50 | 18 | 0.93 | - | MLR | Enthalpy of formation of metal oxide, Mulliken’s electronegativity |
| [18] | [42] | LD50 | 18 | 0.961–0.999 | CORAL | MLR | SMILES-based optimal descriptor |
| [36] | [42] | LD50 | 16 | 0.88 | - | MLR | Enthalpy of formation of metal oxide (ΔHf) nano-cluster, electronic chemical potential of the cluster, and pEC50 of E. coli |
| [37] | [42] | LD50 | 16 | 0.79 | CORAL | Monte Carlo | Quasi-SMILES |
| [39] | [42] | LD50 | 18 | 0.918 | - | RF | 10-based logarithm of solubility measured in mol/L (LogS), topological polar surface area (TPSA), Mulliken’s electronegativity |
| [8] | [42] | LD50 | 18 | 0.83 | - | PLS | Atom charge-based SiRMS descriptor, charge of the atom weighted by the bond ionicity, charge of metal ion weighted by ionicity of bond, squared ionic potential, ion change-based SiRMS descriptor, number of oxygen atoms in brutto formula per interfacial layer, mass density weighted by ionicity of bond, Wigner-Seitz radius weighted by ionicity of bond, and ionicity of bond based SiRMS |
| [43] | [42,44,45] | Cell viability (%) | 21 | - | CORAL | Hierarchical cluster analysis (HCA) and min–max normalization | Quasi-SMILES |
| Transformed bronchial epithelial cells (BEAS-2B) | |||||||
| [46] | [46] | % of membrane-damaged cells | 9 | - | Weka | RF | Atomization energy of the metal oxide, period of the nanoparticle metal, nanoparticle primary size, and nanoparticle volume fraction |
| [6] | [6] | Cell viability (%) | 24 | - | - | Regression tree | Metal solubility and energy of conduction |
| [47] | [6] | Cell viability (%) | 24 | - | RandomForest package | RF | Mass density, covalent index, cation polarizing power, Wigner–Seitz radius, surface area-to-volume ratio, aggregation parameter, and tri-atomic descriptor of atomic charges |
| [48] | [48] | LD50 | 24 | - | RapidMiner | SVM | Conduction band energy and ionic index of metal cation |
| [49] | [50] | % of membrane-damaged cells | 24 | 0.68 | CORAL | Monte Carlo | SMILES-based optimal descriptor, dose, and exposure time |
| [43] | [6,51,52] | Cell viability (%) | 21 | 0.713–0.733 | CORAL | HCA and min-max normalization | Quasi-SMILES |
| Murine myeloid cells (RAW 264.7) | |||||||
| [6] | [6] | Cell viability (%) | 24 | - | - | Regression tree | Metal solubility and energy of conduction |
| [47] | [6] | Cell viability (%) | 24 | - | RandomForest package | RF | Mass density, molecular weight, aligned electronegativity, covalent index, surface area, surface area-to-volume ratio, two-atomic descriptor of van der Waals interactions, tetra-atomic descriptor of atomic charges, and size in DMEM |
| [48] | [48] | LD50 | 24 | - | RapidMiner | SVM | Conduction band energy and ionic index of metal cation |
| [53] | [53] | Lactate dehydrogenase (LDH) release | 25 | - | R | PLS | Metal cation charge, hydration rate, radius of the metallic cation, and Pauling electronegativity |
| Rat L2 lung epithelial cells and rat lung alveolar macrophages | |||||||
| [54] | [54] | Membrane damage (units L−1) | 42 | - | - | Multivariate linear regression and linear discriminant analysis (LDA) | Size, concentration, size in phosphate buffered saline, size in water, and zeta potential |
| [55] | [54] | Membrane damage (units L−1) | 42 | - | - | MLR and simple classification | Size, concentration, size in phosphate buffered saline, and size in water |
1 Missing R2 value means that an SAR model was built instead of QSAR. 2 If software record is missing, then it was not mentioned in the original paper.
Table 2.
Main features of (Q)SAR models predicting cytotoxicity of metal-containing nanoparticles.
| Source | Dataset | Cell Type | Endpoint of Cytotoxicity Measurement | n | R2 | Software | Statistical Method | Descriptors |
|---|---|---|---|---|---|---|---|---|
| [59] | [60] | Monocytes, hepatocytes, endothelial, and smooth muscle cells | Cellular viability | 51 | 0.72 | WinSVM, ISIDA | SVM classification and k Nearest Neighbors (kNN) regression | Size, zeta potential, R1 and R2 relaxivities |
| [59] | [61] | PaCa2 human pancreatic cancer cells, U937 macrophage cell lines, primary human macrophages, HUVEC human umbilical vein endothelial cells | Cellular uptake | 109 | 0.65–0.80 | WinSVM, ISIDA | SVM classification and k Nearest Neighbors (kNN) regression | Lipophilicity, number of double bonds |
| [62] | [60] | Smooth muscle cells | Cell apoptosis | 31 | 0.81 | - | MLR and Bayesian regularized artificial neural network | IFe2O3, Idextran, and Isurf.chg |
| [63] | [60] | Monocytes, hepatocytes, endothelial, and smooth muscle cells | Cellular viability | 44 | - | - | Naive Bayesian classifier | Primary size, spin-lattice and spin-spin relaxivities, zeta potential |
| [64] | [64] | Zebrafish embryo | 24 h post-fertilization mortality | 82 | - | ABMiner | Numerical prediction | Concentration, shell composition, surface functional groups, purity, core structure, and surface charge |
| [65] | [65] | Mammalian cell lines | TC50 | 1681 | - | STATISTICA v.6 | LDA | Molar volume, polarizability, and size of the particles |
| [66] | [66] | Algae, bacteria, cell lines, crustaceans, plants, fish, and others | CC50, EC50, IC50, TC50, LC50 | 36488 | - | STATISTICA | LDA | Molar volume, polarizability, size of NPs, electronegativity, hydrophobicity, and polar surface area of surface coating |
| [67] | [67] | Bacteria, algae, crustaceans, fish, and others | EC50, IC50, TC50, LC50 | 5520 | - | STATISTICA | LDA | Molar volume, electronegativity, polarizability, and nanoparticle size |
| [68] | [68] | Algae, bacteria, fungi, mammal cell lines, crustaceans, plants, fishes, and others | CC50, EC50, IC50, TC50, LC50 | 54371 | - | STATISTICA | Artificial neural network | Polar surface area, hydrophobicity, atomic weight, atomic van der Waals radius, electronegativity, and polarizability |
| [69] | [70] | Danio rerio, Daphnia magna, Pseudokirchneriella subcapitata, and Staphylococcus aureus | LC50, EC50, MIC (minimum inhibitory concentration) | 400 | - | Weka | Functional tree, C4.5 decision tree, random tree, and CART | Molecular polarizability, accessible surface area, and solubility |
| [71] | [71] | E. coli and Chinese hamster ovary (CHO-K1) cells | EC50, MIC | 17 | 0.94 | R | Nonlinear least-squaress | Size and specific surface area (Brunauer-Emmett-Teller surface) |
Table 3.
Main features of (Q)SAR models predicting cytotoxicity of multi-walled carbon nanotubes.
| Source | Dataset | Cell Type | Endpoint of Cytotoxicity Measurement | n | R2 | Software | Statistical Method | Descriptors |
|---|---|---|---|---|---|---|---|---|
| [74] | [75] | Salmonella typhimurium TA100 | Reverse mutation test TA100 | 24 | 0.65–0.81 | CORAL | Monte Carlo | Quasi-SMILES |
| [76] | [77] | Salmonella typhimurium TA100 | Reverse mutation test TA100 | 30 | 0.53–0.64 | CORAL | Monte Carlo | Quasi-SMILES |
| [78] | [77,79] | Salmonella typhimurium TA100 | Reverse mutation test TA100 | 44 | 0.60–0.78 | CORAL | Monte Carlo | Quasi-SMILES |
| [80] | [80] | Four types of normal human lung cells (BEAS-2B, 16HBE14o-, WI-38, and HBE) | Cell viability (%) | 276 | 0.60–0.80 | CORAL | Monte Carlo | Quasi-SMILES |
Table 4.
Main features of (Q)SAR models predicting cytotoxicity of fullerenes.
| Source | Dataset | Cell Type | Endpoint of Cytotoxicity Measurement | n | R2 | Software | Statistical Method | Descriptors |
|---|---|---|---|---|---|---|---|---|
| [78] | [77,79] | Salmonella typhimurium TA100 | Reverse mutation test TA100 | 44 | 0.60–0.78 | CORAL | Monte Carlo | Quasi-SMILES |
| [81] | [79] | S. typhimurium TA100 | Reverse mutation test TA100 | 20 | 0.76 | CORAL | Monte Carlo | Quasi-SMILES |
| [82] | [79] | S. typhimurium TA100 | Reverse mutation test TA100 | 20 | 0.63–0.76 | CORAL | Monte Carlo | Quasi-SMILES |
| [82] | [79] | E. coli WP2 uvrA/pKM101 | Reverse mutation test WP2 uvrA/pKM101 | 20 | 0.68–0.82 | CORAL | Monte Carlo | Quasi-SMILES |
Table 5.
Main features of (Q)SAR models predicting cytotoxicity of silica nanomaterials.
| Source | Dataset | Cell Type | Endpoint of Cytotoxicity Measurement | n | R2 | Software | Statistical Method | Descriptors |
|---|---|---|---|---|---|---|---|---|
| [83] | [84] | Human embryonic kidney cells HEK293 | Cell viability (%) | 40 | 0.80–0.93 | CORAL | Monte Carlo | Quasi-SMILES |
| [24] | [85] | Human kidney cells HK-2 | Cell viability (%) | 42 | 0.83–0.89 | CORAL | Monte Carlo | Quasi-SMILES |
| [86] | [86] | 16HBE, A549, HaCaT, NRK-52E, and THP-1 | EC25 | 19 | 0.83 | CORAL | Monte Carlo | Quasi-SMILES |
| [86] | [86] | 16HBE, A549, HaCaT, NRK-52E, and THP-1 | EC25 | 19 | 0.87 | R | RF | Aspect ratio and zeta potential |
| [87] | [84] | Human embryonic kidney cell line (HEK293) | Cell viability (%) | 40 | 0.80–0.95 | CORAL | Monte Carlo | Quasi-SMILES |
© 2019 by the authors. Licensee MDPI, Basel, Switzerland. This article is an open access article distributed under the terms and conditions of the Creative Commons Attribution (CC BY) license (http://creativecommons.org/licenses/by/4.0/).
Share and Cite
MDPI and ACS Style
Buglak, A.A.; Zherdev, A.V.; Dzantiev, B.B. Nano-(Q)SAR for Cytotoxicity Prediction of Engineered Nanomaterials. Molecules 2019, 24, 4537. https://doi.org/10.3390/molecules24244537
AMA Style
Buglak AA, Zherdev AV, Dzantiev BB. Nano-(Q)SAR for Cytotoxicity Prediction of Engineered Nanomaterials. Molecules. 2019; 24(24):4537. https://doi.org/10.3390/molecules24244537
Chicago/Turabian StyleBuglak, Andrey A., Anatoly V. Zherdev, and Boris B. Dzantiev. 2019. "Nano-(Q)SAR for Cytotoxicity Prediction of Engineered Nanomaterials" Molecules 24, no. 24: 4537. https://doi.org/10.3390/molecules24244537