Electrochemical and Electrocatalytical Properties of 3,7,13,17-Tetramethyl-2,8,12,18-Tetrabutylporphyrin in Alkaline Solution

Abstract
:Introduction
Results and Discussion
Experimental
General

References and Notes
- Tarasevich, M. R.; Radiushkina, K. A. Kataliz i elektrokataliz s metallporfirinami; Nauka: Moscow, 1982; p. 168. [Google Scholar]
- Askarov, K.A. Porfiriny: spektroskopiya, elektrohimiya, primenenie; Nauka: Moscow, 1987; p. 384. [Google Scholar]
- Mairanovskii, V.G.; Mamaev, V. M.; Ponomarev, G. V. Russ. J. General Chem. 1974, 44, 2508.
- Worthington, P.; Hambright, H.; Williams, R. J. Inorg. Biochem. 1980, 12, 281. [CrossRef]
- Girandeau, A.; Ezhar, I.; Gross, M. Bioelectrochem. and Bioenerg. 1976, 3, 519.
- Bazanov, M. I. Izv. Vuzov. Himiya i him. Tehnologiya 1988, 31, 62.
- Bazanov, M. I. Izv. Vuzov. Himiya i him. Tehnologiya 1988, 31, 16.
- Martynov, N. P.; Bazanov, M. I.; Kolesnikov, N. A. Izv. Vuzov. Himiya i him. Tehnologiya 1995, 38, 97.
- Bazanov, M. I.; Siling, S. A.; Smirnov, R. P. Elektrohimiya 1996, 32, 1120.
- Bazanov, M.I.; Ulitina, O.E.; Tiana, J. Elektrohimiya 1999, 35, 212.
- Sample Availability: Available from the authors.


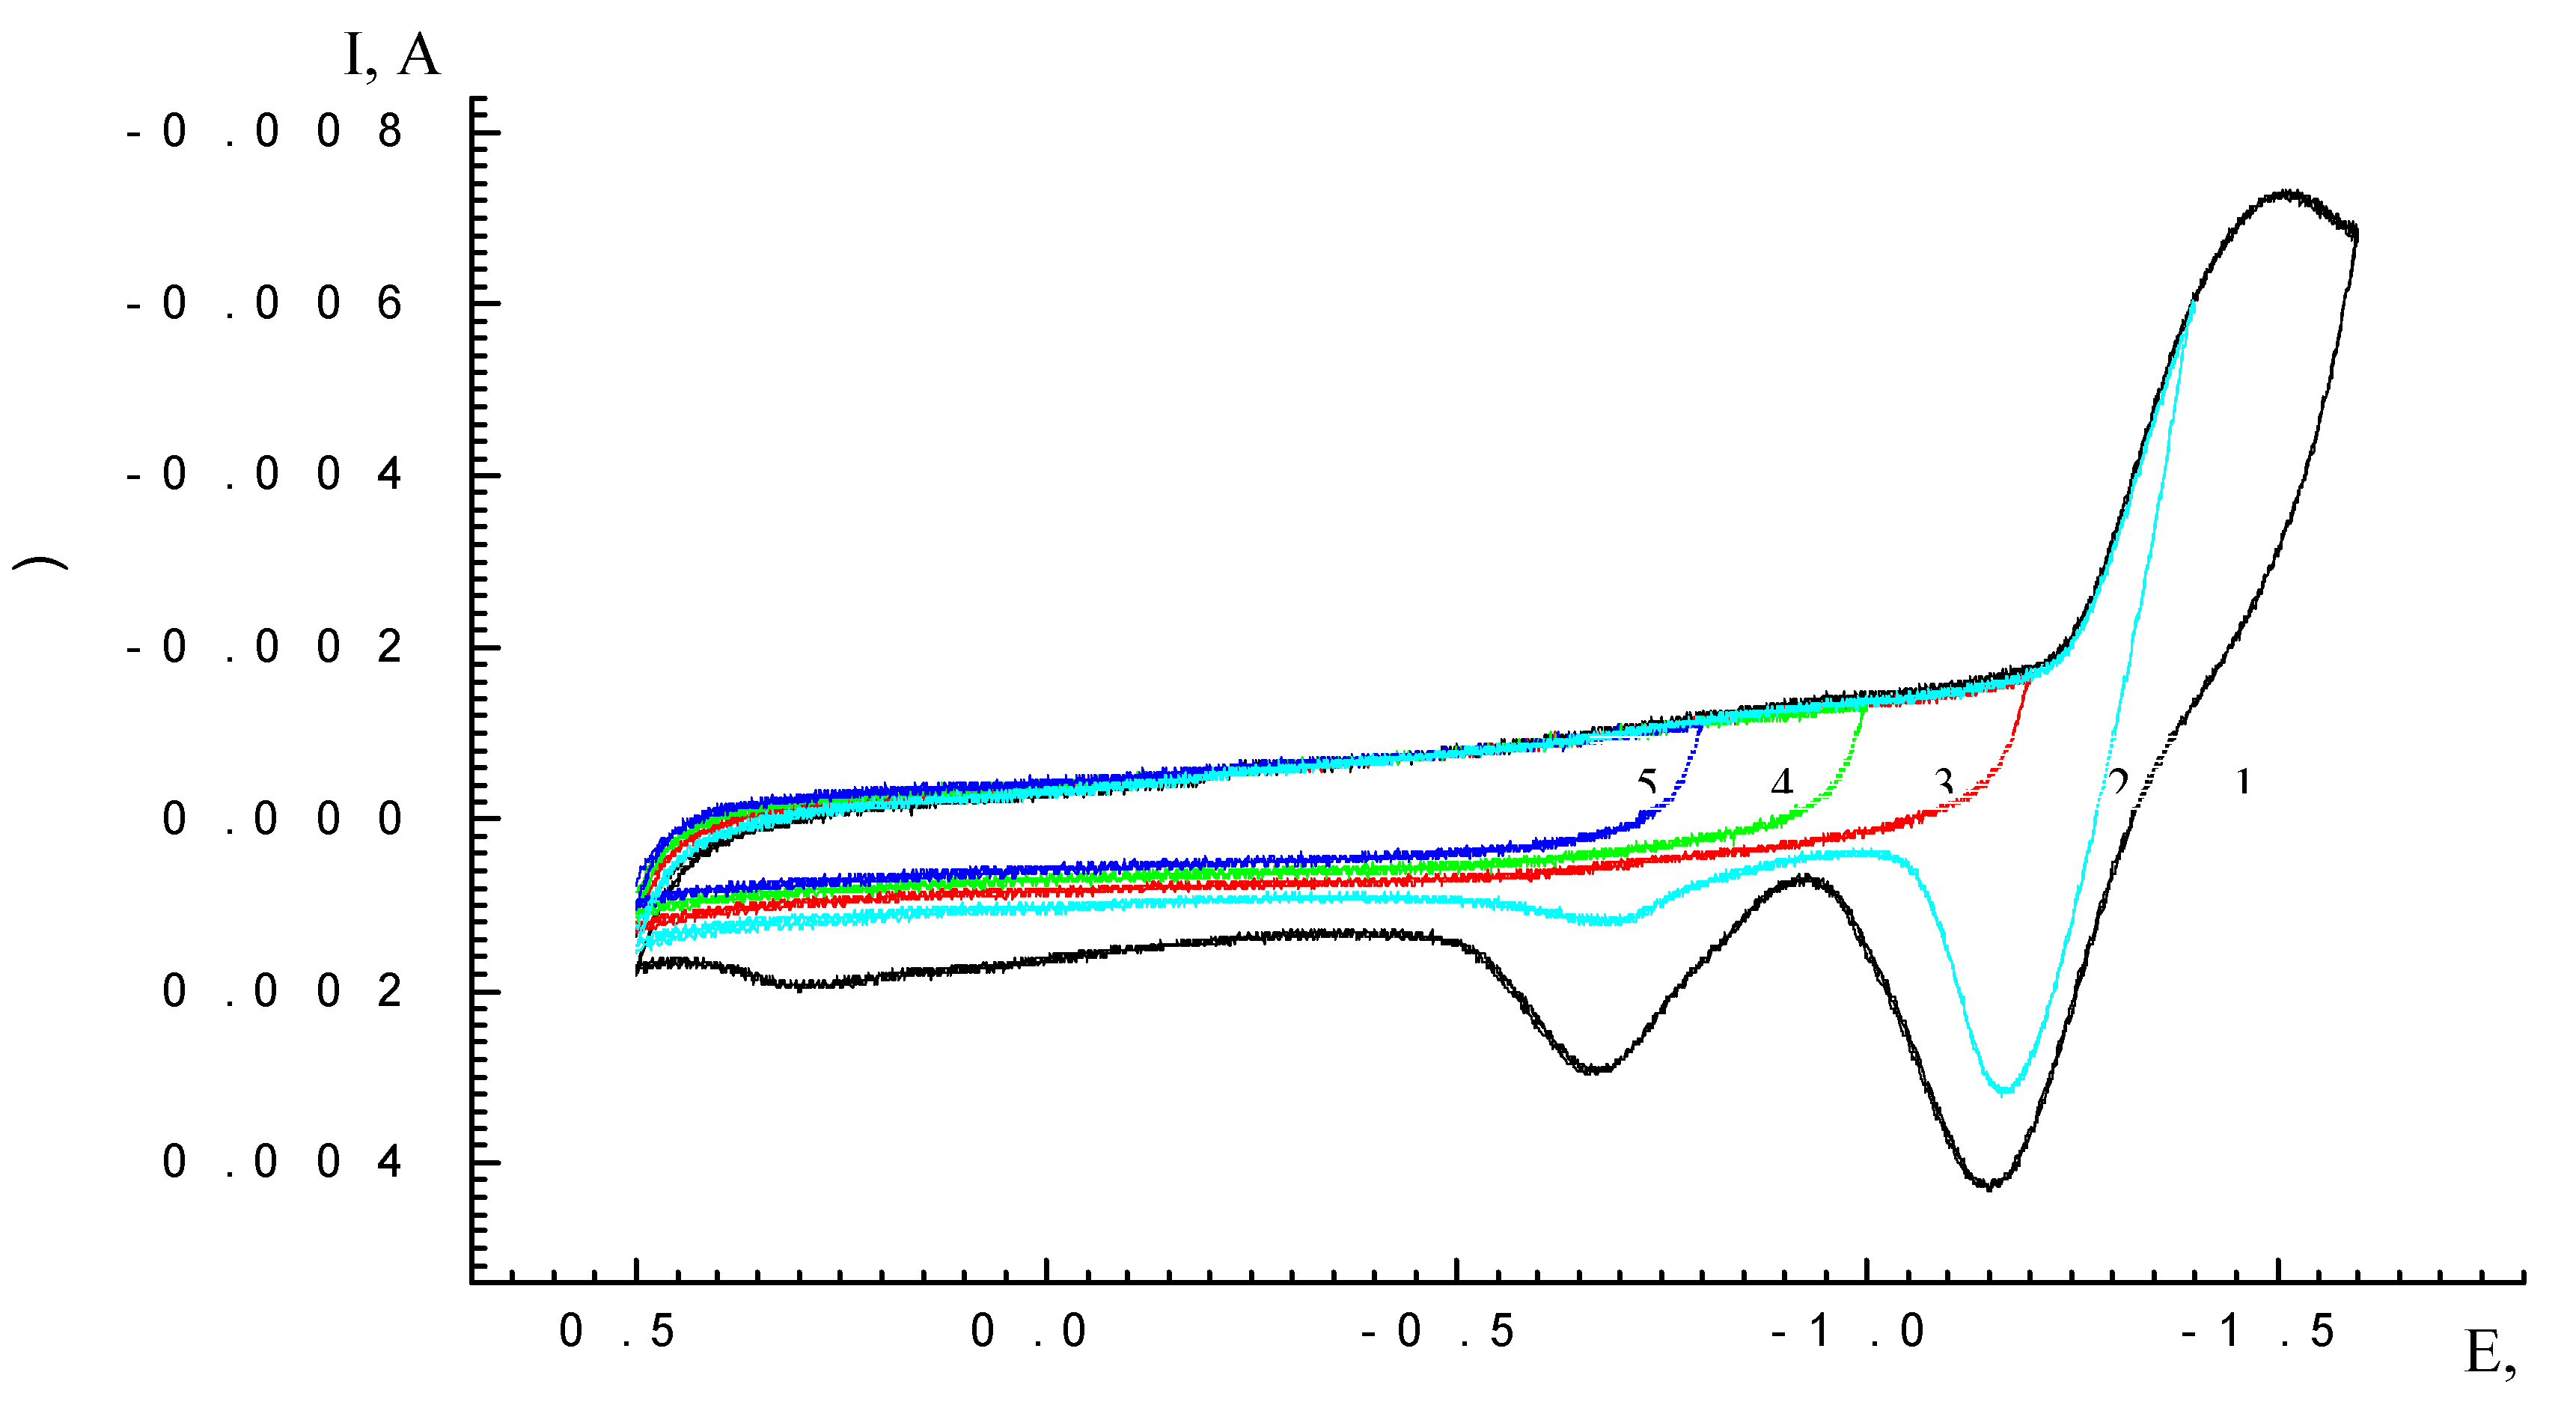
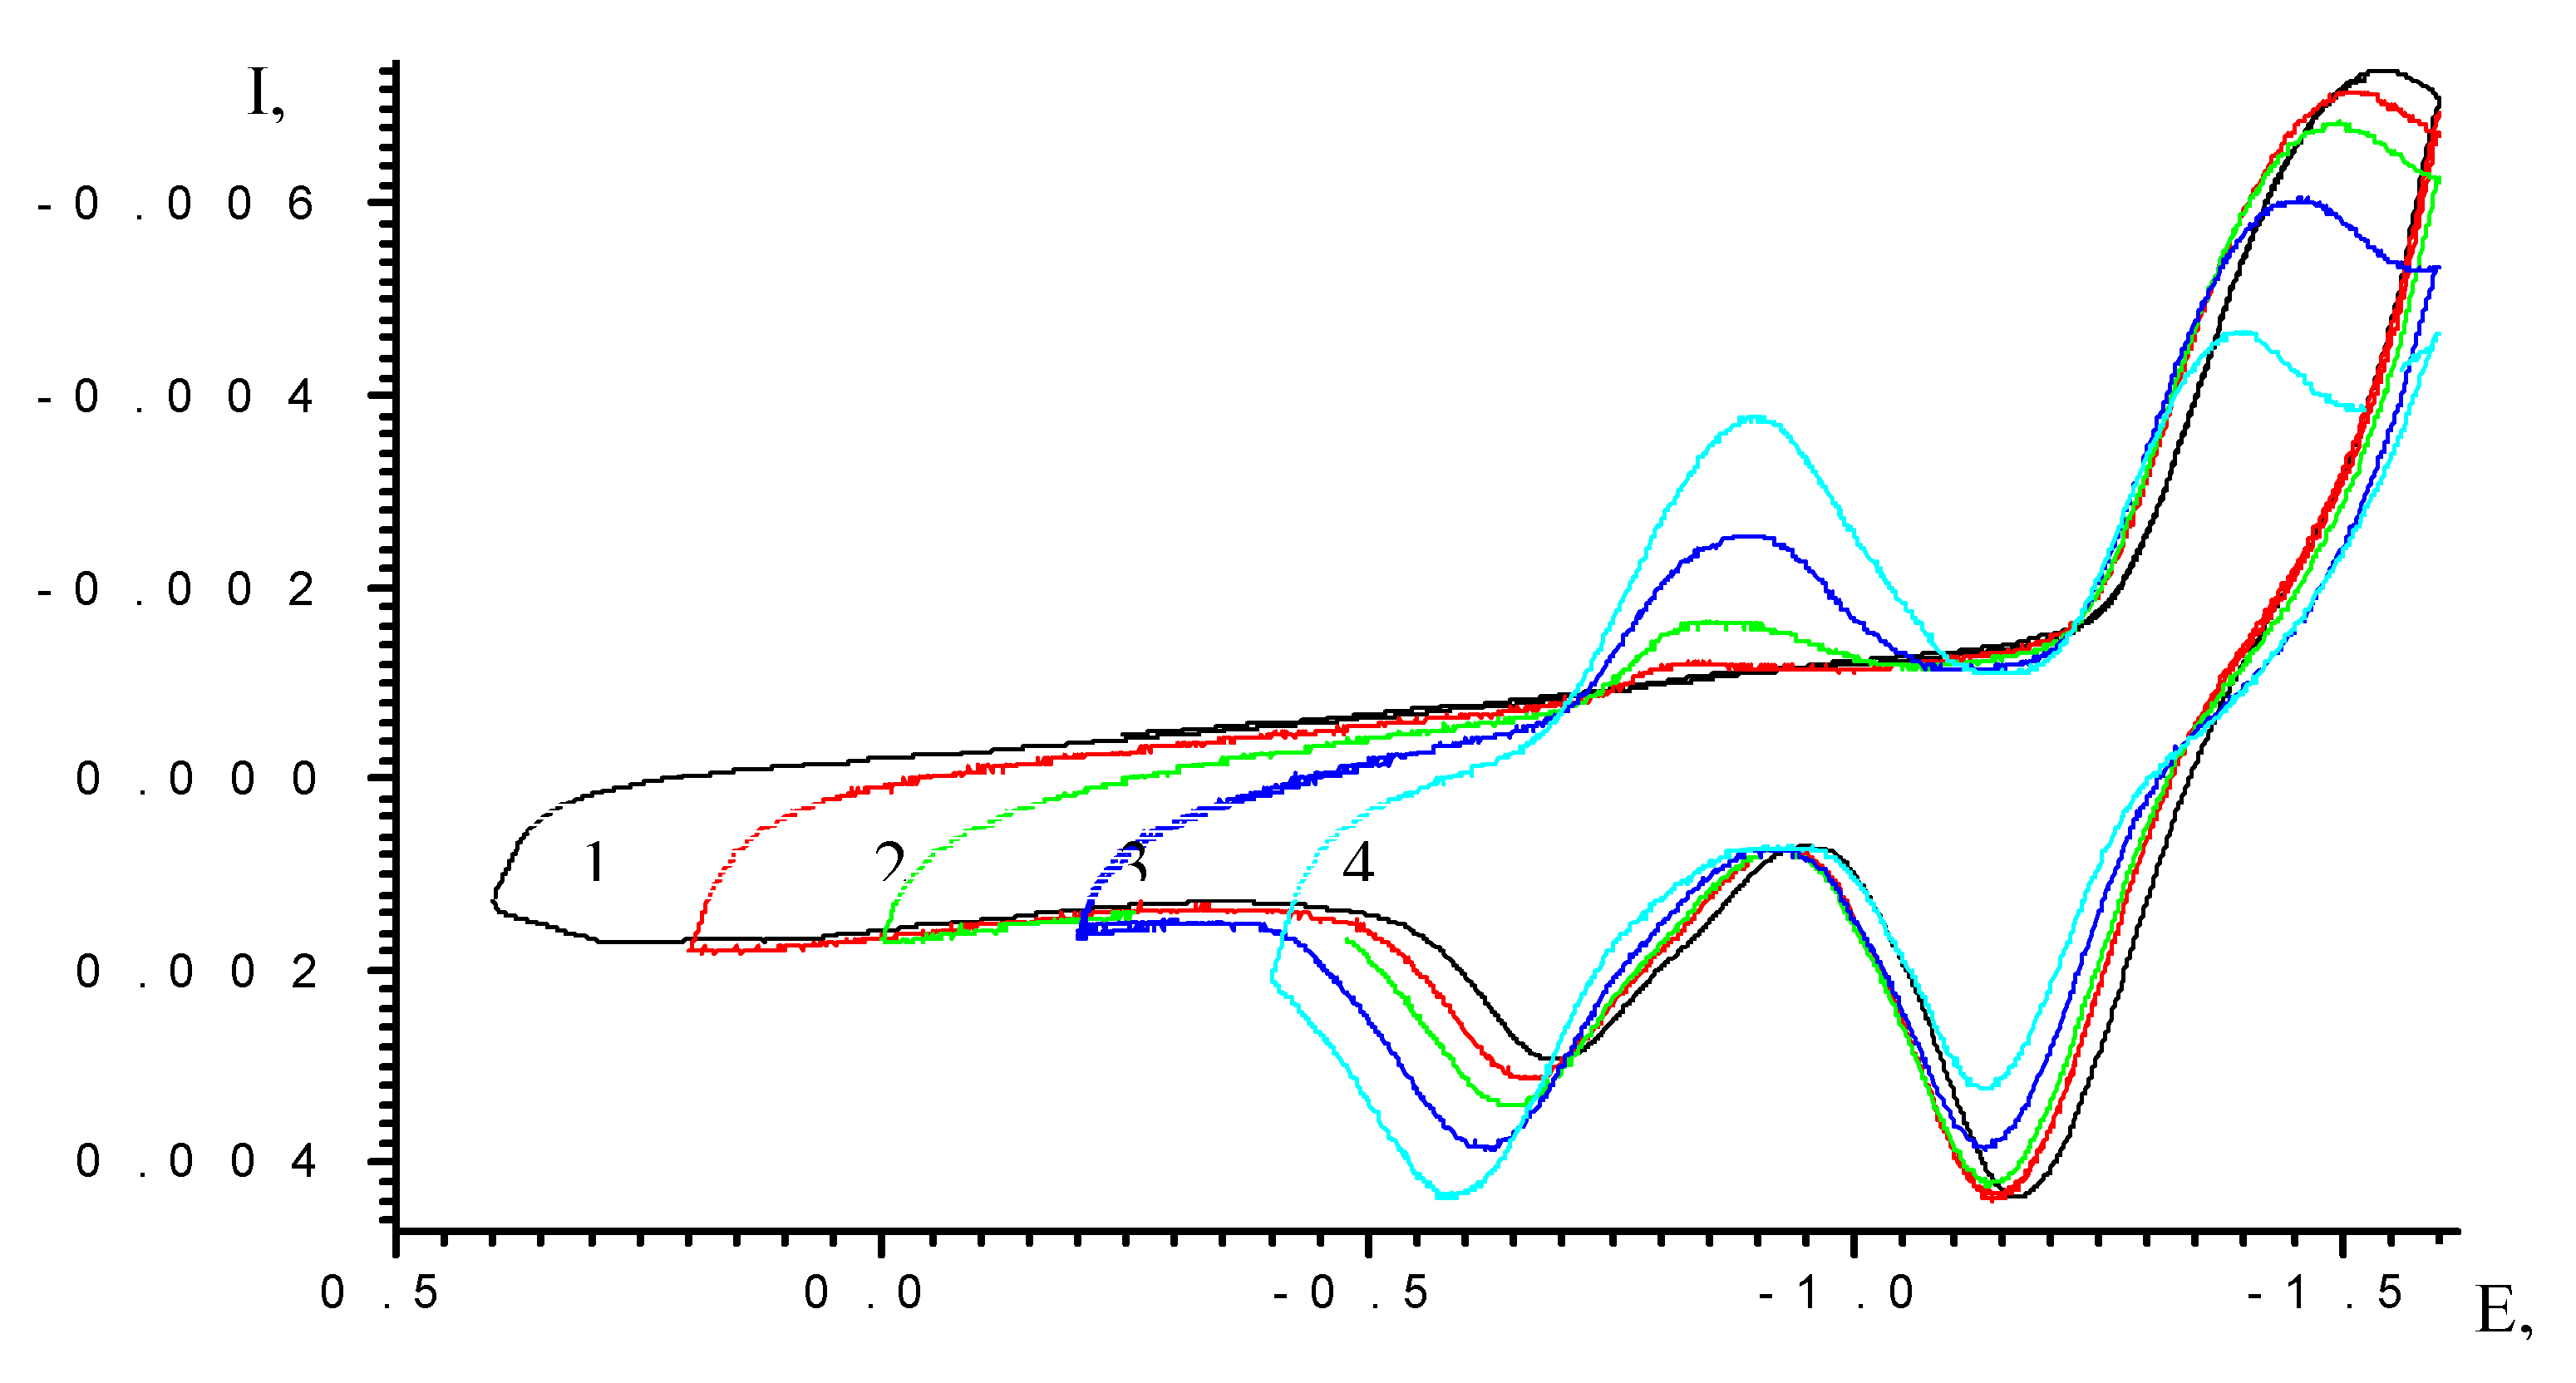
| Scan rate, mV/s | Process I (L ⇔ L-) | Process II (L- ⇔ L2-) | ||||
| Ek, V | Ea, V | Ered/ox, V | Ek, V | Ea, V | Ered/ox, V | |
| 5 | -0.71 | -0.63 | -0.67 | -1.16 | -1.09 | -1,12 |
| 10 | -0.74 | -0.6 | -0.67 | -1.18 | -1.07 | -1,12 |
| 20 | -0.77 | -0.58 | -0.67 | -1.2 | -1.03 | -1,12 |
| 50 | -0.85 | -0.51 | -0.68 | -1.27 | -0.96 | -1,12 |
| 100 | -0.97 | -0.42 | -0.69 | -1.35 | -0.87 | -1,11 |
| Extrapolation to zero scan rate | Ered/ox,V (v→0) -0.67 ± 0.02 | Ered/ox,V (v→0) -1.12 ± 0.02 | ||||
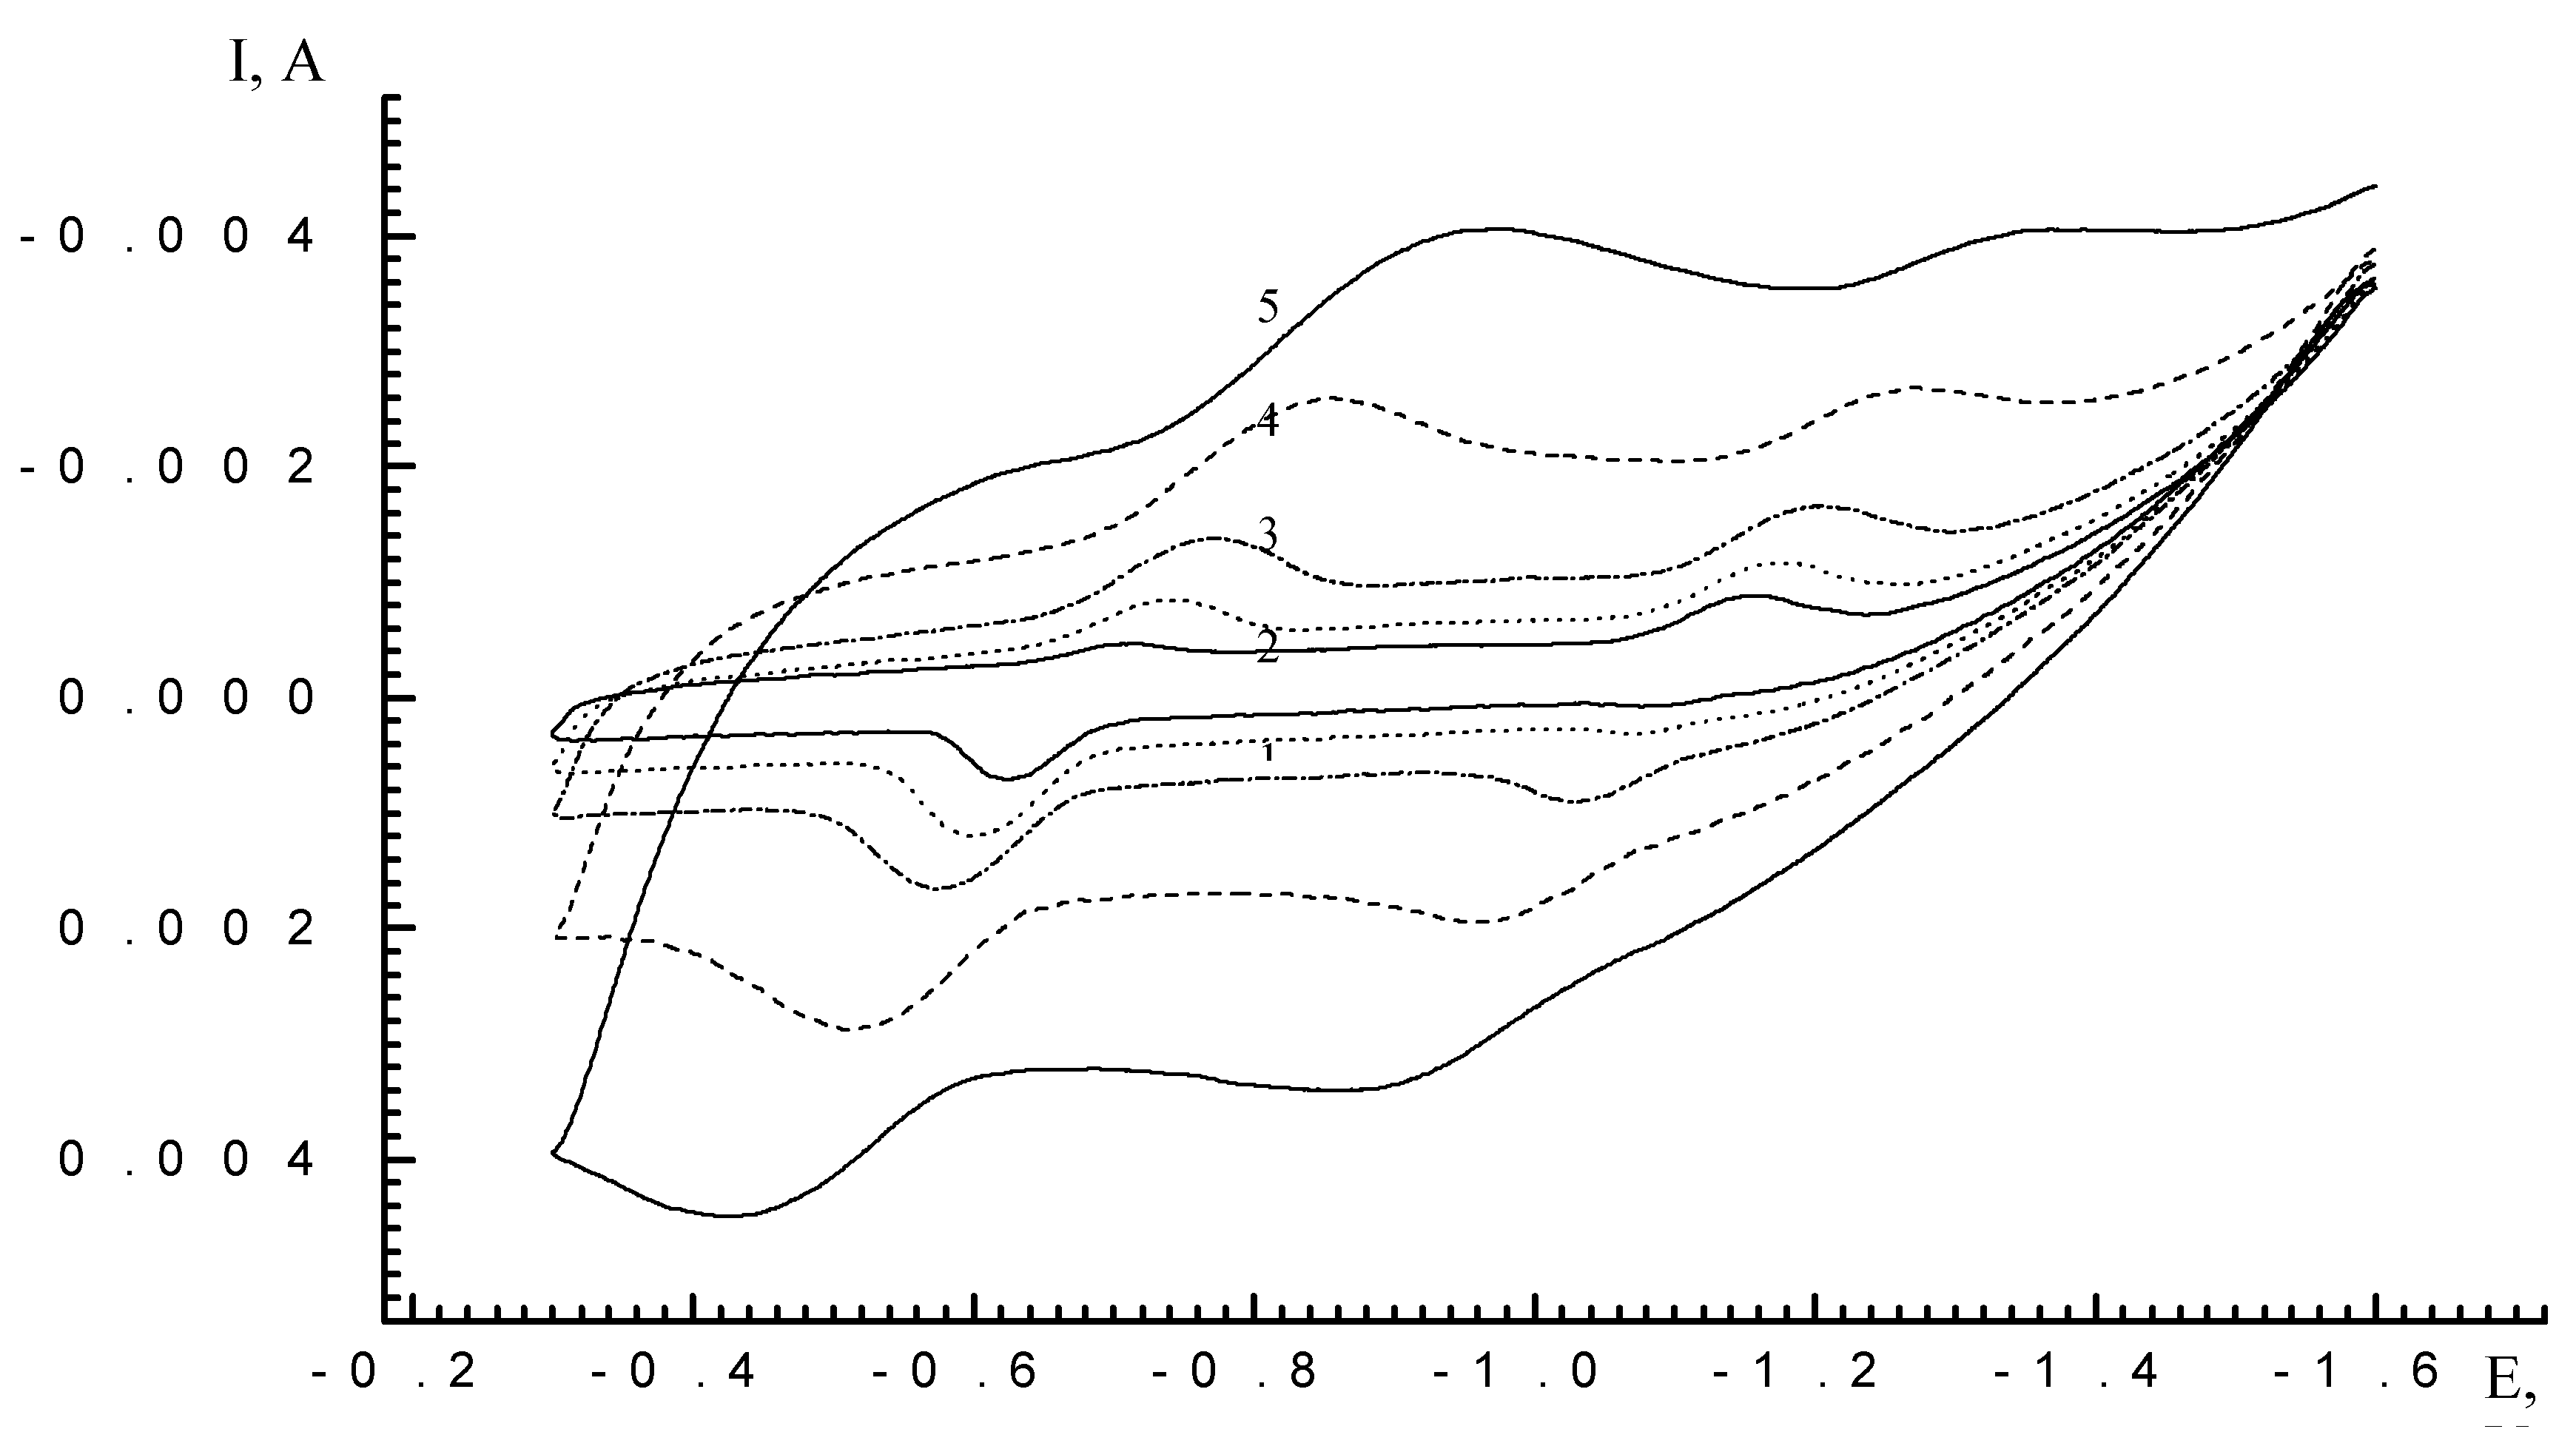
| Cycle N | Scan time (min) | Imax (A) (E=-0.25V) | Imax (A) (E=-0,65V) | Ratio Imax (E=-0.25V)//Imax (E=-0.65V) |
| 4 | 14 | -0.00027262 | -0.000460787 | 0,5916 |
| 6 | 21 | -0.000881274 | -0.00111063 | 0,7935 |
| 8 | 28 | -0.001345321 | -0.001141448 | 1,1786 |
| 10 | 35 | -0.001676613 | -0.000860531 | 1,9484 |
| 15 | 52,5 | -0.001865077 | -0.000974913 | 1,913 |
| 20 | 70 | -0.001937914 | -0.000930405 | 2,083 |
© 2000 by MDPI (http://www.mdpi.org). Reproduction is permitted for noncommercial purposes.
Share and Cite
Girichev, E.G.; Bazanov, M.I.; Mamardashvili, N.Z.; Gjeyzak, A. Electrochemical and Electrocatalytical Properties of 3,7,13,17-Tetramethyl-2,8,12,18-Tetrabutylporphyrin in Alkaline Solution. Molecules 2000, 5, 767-774. https://doi.org/10.3390/50600767
Girichev EG, Bazanov MI, Mamardashvili NZ, Gjeyzak A. Electrochemical and Electrocatalytical Properties of 3,7,13,17-Tetramethyl-2,8,12,18-Tetrabutylporphyrin in Alkaline Solution. Molecules. 2000; 5(6):767-774. https://doi.org/10.3390/50600767
Chicago/Turabian StyleGirichev, Egor G., Michail I. Bazanov, Nugzar Zh. Mamardashvili, and A. Gjeyzak. 2000. "Electrochemical and Electrocatalytical Properties of 3,7,13,17-Tetramethyl-2,8,12,18-Tetrabutylporphyrin in Alkaline Solution" Molecules 5, no. 6: 767-774. https://doi.org/10.3390/50600767