Article

Three-Dimensional Quantitative Structural Activity Relationship (3D-QSAR) Studies of Some 1,5-Diarylpyrazoles: Analogue Based Design of Selective Cyclooxygenase-2 Inhibitors

by
Gautam R. Desiraju
1,*,
Bulusu Gopalakrishnan
2,
Ram K. R. Jetti
1,
Dayam Raveendra
3,
Jagarlapudi A. R. P. Sarma
3 and
Hosahalli S. Subramanya
4
1
School of Chemistry, University of Hyderabad, Hyderabad 500 046, India
2
Dept. of Medicinal Chemistry, NIPER, S. A. S. Nagar (Mohali), 160 062, India
3
Molecular Modeling Group, Organic Division-I, Indian Institute of Chemical Technology, Hyderabad 500 007, India
4
Membrane Biology Division, Central Drug Research Institute, Lucknow, 226 001, India
*
Author to whom correspondence should be addressed.
Molecules 2000, 5(7), 945-955; https://doi.org/10.3390/50700945
Submission received: 17 February 2000 / Revised: 26 June 2000 / Accepted: 26 June 2000 / Published: 8 July 2000

Abstract

:
Selective cyclooxygenase inhibitors have attracted much attention in recent times in the design of new non-steroidal anti-inflammatory drugs (NSAID). 3D-QSAR studies have been performed on a series of 1,5-diarylpyrazoles that act as selective cyclooxygenase-2 (COX-2) inhibitors, using three different methods: comparative molecular field analysis (CoMFA) with partial least squares (PLS) fit; molecular field analysis (MFA) and; receptor surface analysis (RSA) with genetic function algorithms (GFA). The analyses were carried out on 30 analogues of which 25 were used in the training set and the rest considered for the test set. These studies produced reasonably good predictive models with high cross-validated and conventional r2 values in all the three cases.

Introduction

Cyclooxygenase (COX) converts arachidonic acid to prostaglandin (PG)H2 and subsequently to a number of other prostaglandins which are potent mediators of inflammation. COX exists in two different isoforms, namely, COX-1 and COX-2 [1] COX-1 is constitutively expressed in tissues and is responsible for the physiological production of prostaglandins. However, COX-2, the induced isoform, is responsible for the elevated production of prostaglandins during inflammation [2]. Thus the selective inhibition of COX-2 is very important in the design of NSAID molecules. Inhibition of COX-1 produces undesirable gastrointestinal side effects and therefore selectivity is a highly desirable attribute in a potential NSAID [3]. Thus our main objective is to design specific inhibitors of COX-2 in the hope that these molecules may be further explored as powerful non-ulcerogenic anti-inflammatory agents. Though both structure- and analogue-based drug design methods have been used in NSAID design in the past, only the latter type of studies have been carried out in the present study.

Computational Methods

Molecular 3D Structure Building
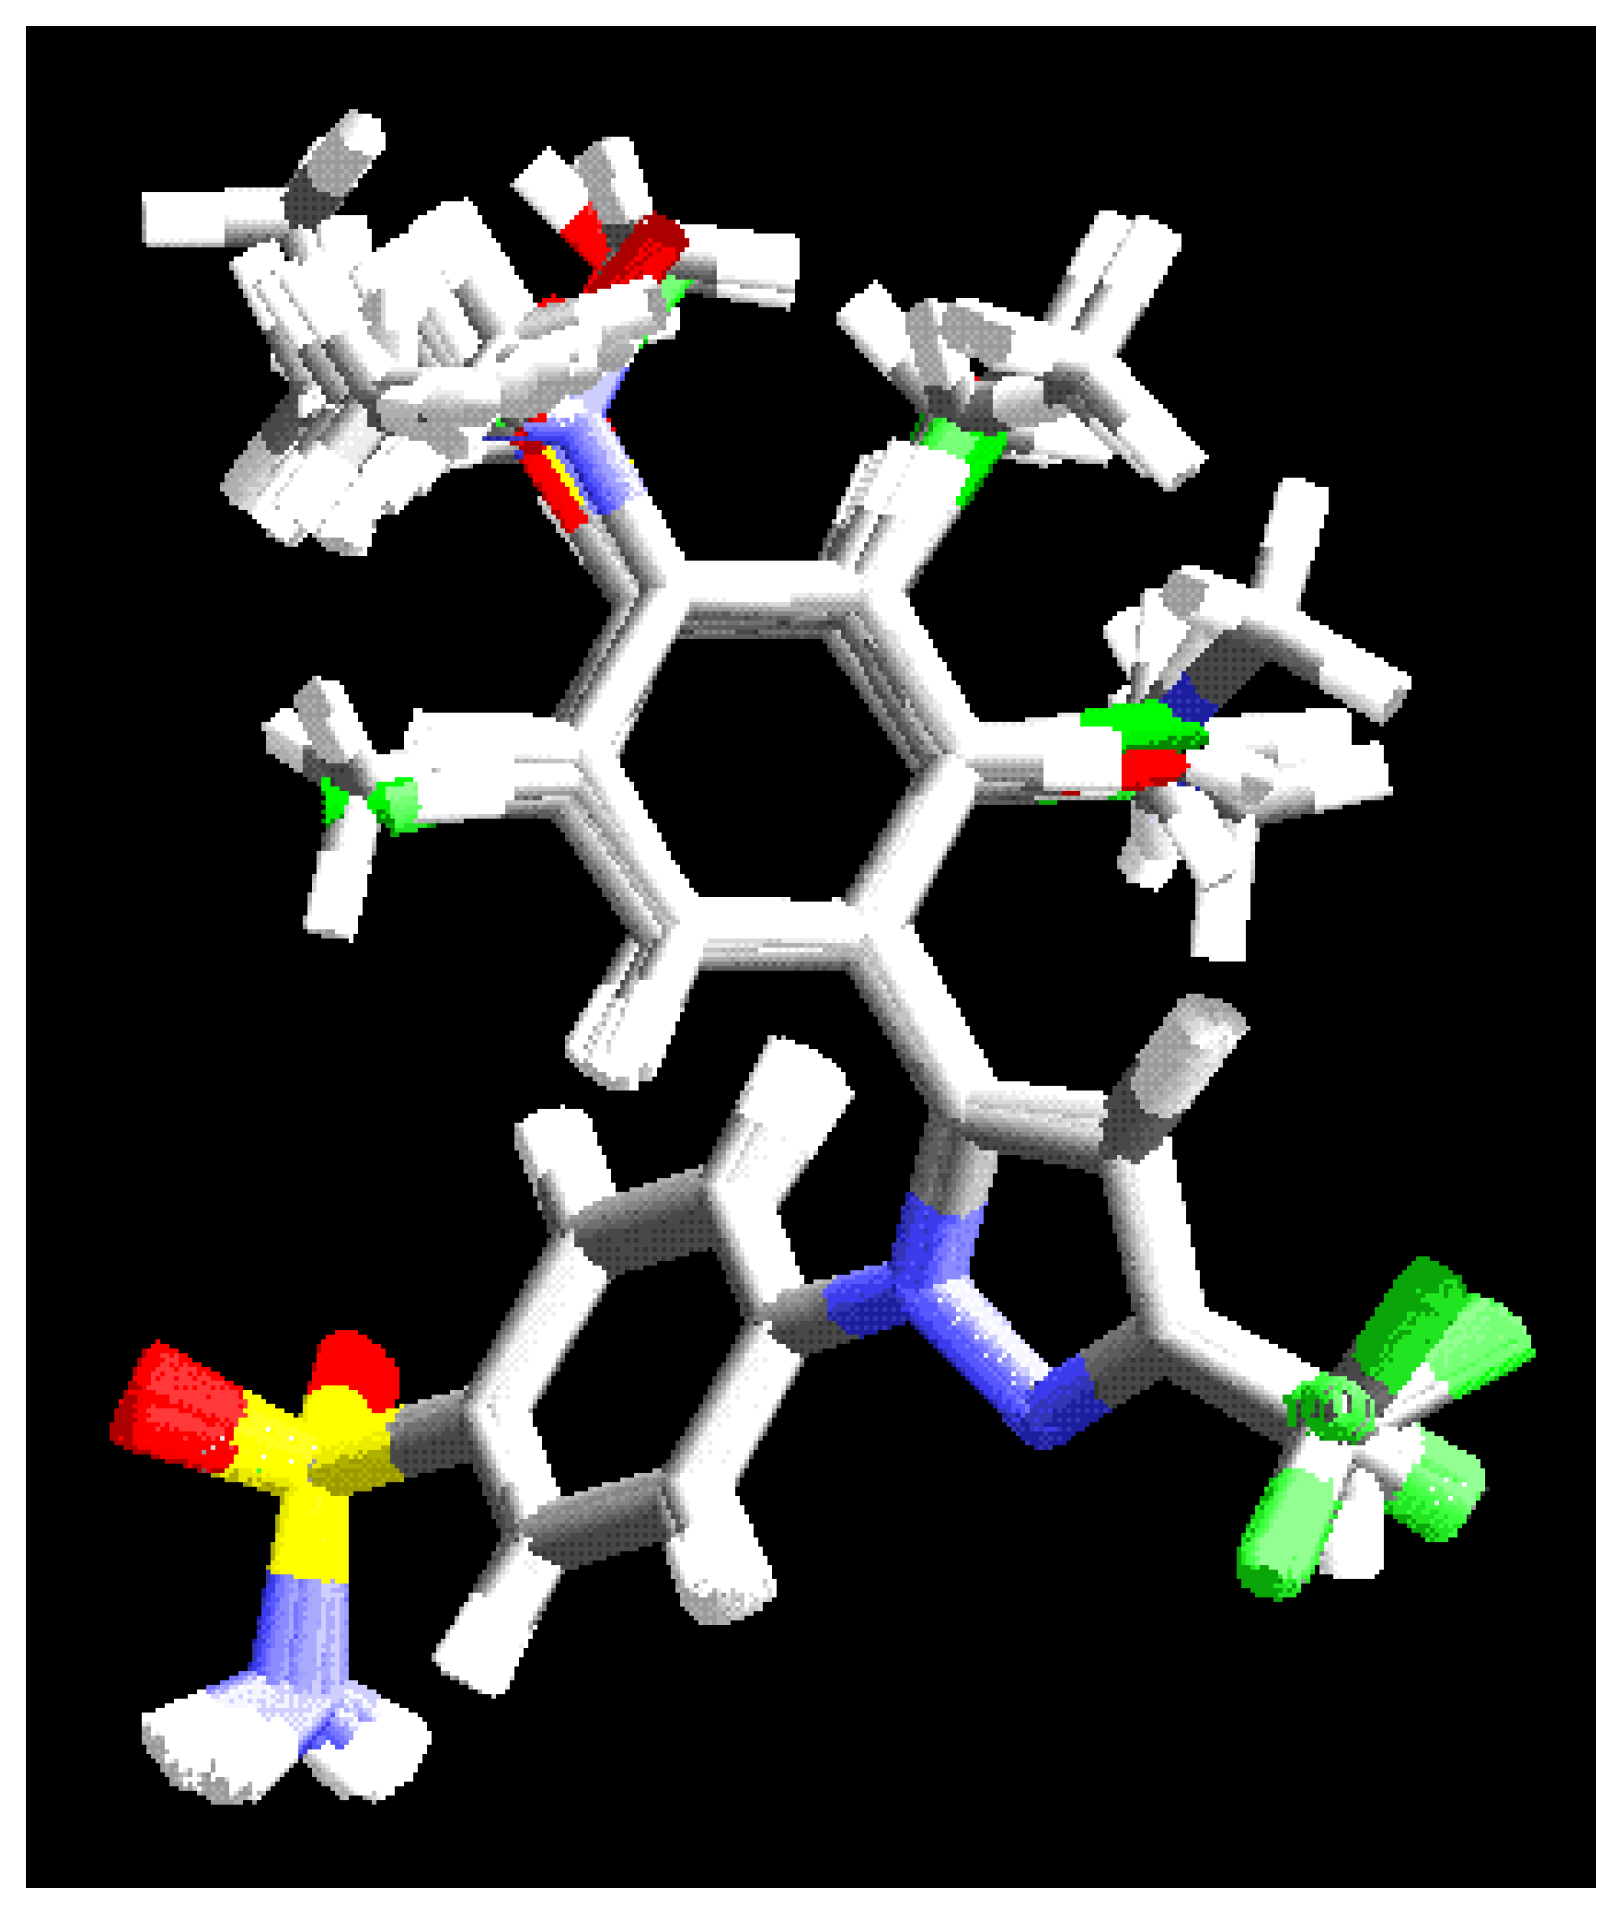
With the satisfactory understanding of the model of the drug action of many NSAIDs, there has been an increased impetus in the synthesis of many COX-2 specific diarylcyclopentane and related heterocyclic systems. From one such report wherein a number of diarylpyrazoles were synthesized and the biological activity evaluated for both COX-1 and COX-2, 30 molecules were randomly selected for the present study (Scheme 1, Table 1 and Table 2) [4]. All inhibitors were modelled with Sybyl. Initial geometric optimizations were carried out using the standard Tripos force field, with a 0.001 Kcal/mol energy gradient convergence criterion and a distance-dependent dielectric constant employing Gasteiger charges [5]. Further geometric optimizations were performed using MOPAC with the AM1 Hamiltonian and derived MOPAC charges were used for the subsequent analysis [6,7]. The final geometry of the molecular skeleton is very similar to that of SC-558 and Celecoxib [2,8].

Alignment

Fragment 1 is common to all the molecules that were considered in this study and the molecules were aligned with respect to this fragment, using the simple alignment method in Sybyl (Figure 1). Alignment by different methods such as field fit or pharmacophore fit were also carried out. However, these studies did not produce any significant deviation in the results obtained from the earlier studies.

CoMFA

CoMFA fields were generated using the standard Tripos field and 3D-QSAR analysis was performed by the PLS method [9]. For each cross-validated CoMFA analysis, the minimum σ value was set to 2 to expedite calculations. For the non cross-validated CoMFA analyses, the minimum σ value was set to 0. The steric and electrostatic field energies were calculated using an sp3 carbon probe atom with a +1 charge. The CoMFA grid spacing was 2.0 Å in all three dimensions within the defined region, and this was extended beyond the van der Waals envelopes of all molecules by at least 4.0 Å. The optimal number of components in the final PLS model was determined by minimizing the standard error between the predicted and actual activities, obtained from the leave-one-out cross-validation technique. It is essential to assess the predictive power of the CoMFA model by using a test set of compounds. Therefore, among the 30-inhibitors initially considered, 25 were randomly selected to be included in the training set and the remaining five were used in the test set. The molecular systems were rotated in the initially defined field box to test for orientation effects. However, no such effect was observed. Similarly, q2-GRS studies employing a grid spacing of 1.0 Å and a cut-off of 0.1 and 0.2 q2 did not improve the r2 cv to any significant extent. Figure 2a and Figure 2b represent the CoMFA contour maps of steric and electrostatic contributions.

MFA

MOPAC minimized structures were also read into Cerius2 and all the molecules were aligned with respect to Fragment 1 (Figure 3) [10]. The molecular field was created using as probes, the methyl group and a proton for steric and electrostatic interactions respectively. Many of the spatial and structural descriptors such as polarizability, dipole moment, radius of gyration, molecular area, molecular dimensions, density, principal moments of inertia, molecular volume, molecular weight, number of rotatable bonds, hydrogen bond donors and acceptors, log P, molar refractivity and others were also considered along with field values [11]. Only 10% of the total variables whose variance is highest were considered as independent variables. The negative logarithm of the biological activity was chosen as the dependent variable in the generation of QSAR equations using the GFA regression method (with only linear terms involved in the equations) [12]. All 25 molecules in the training set were considered as observations. The other specifications are similar to those given in the following section.

RSA

Previous Cerius2 aligned molecules were reconsidered for the generation of a receptor surface [13]. The receptor surface was generated with weights based on the biological activity data. The interaction energies of all the molecules were evaluated within this receptor model. The receptor surface descriptors, expressed as field values based on the probes of methyl group and a proton, were added to the study table along with various types of interaction energies for the QSAR study. Regression analysis was carried out using the GFA method consisting of over 20,000 generations and with specific inclusion of constant, linear, spline, quadratic, offset quadratic and quadratic spline variable terms in a QSAR equation with no fixed length and with no scaling.

Results and Discussion
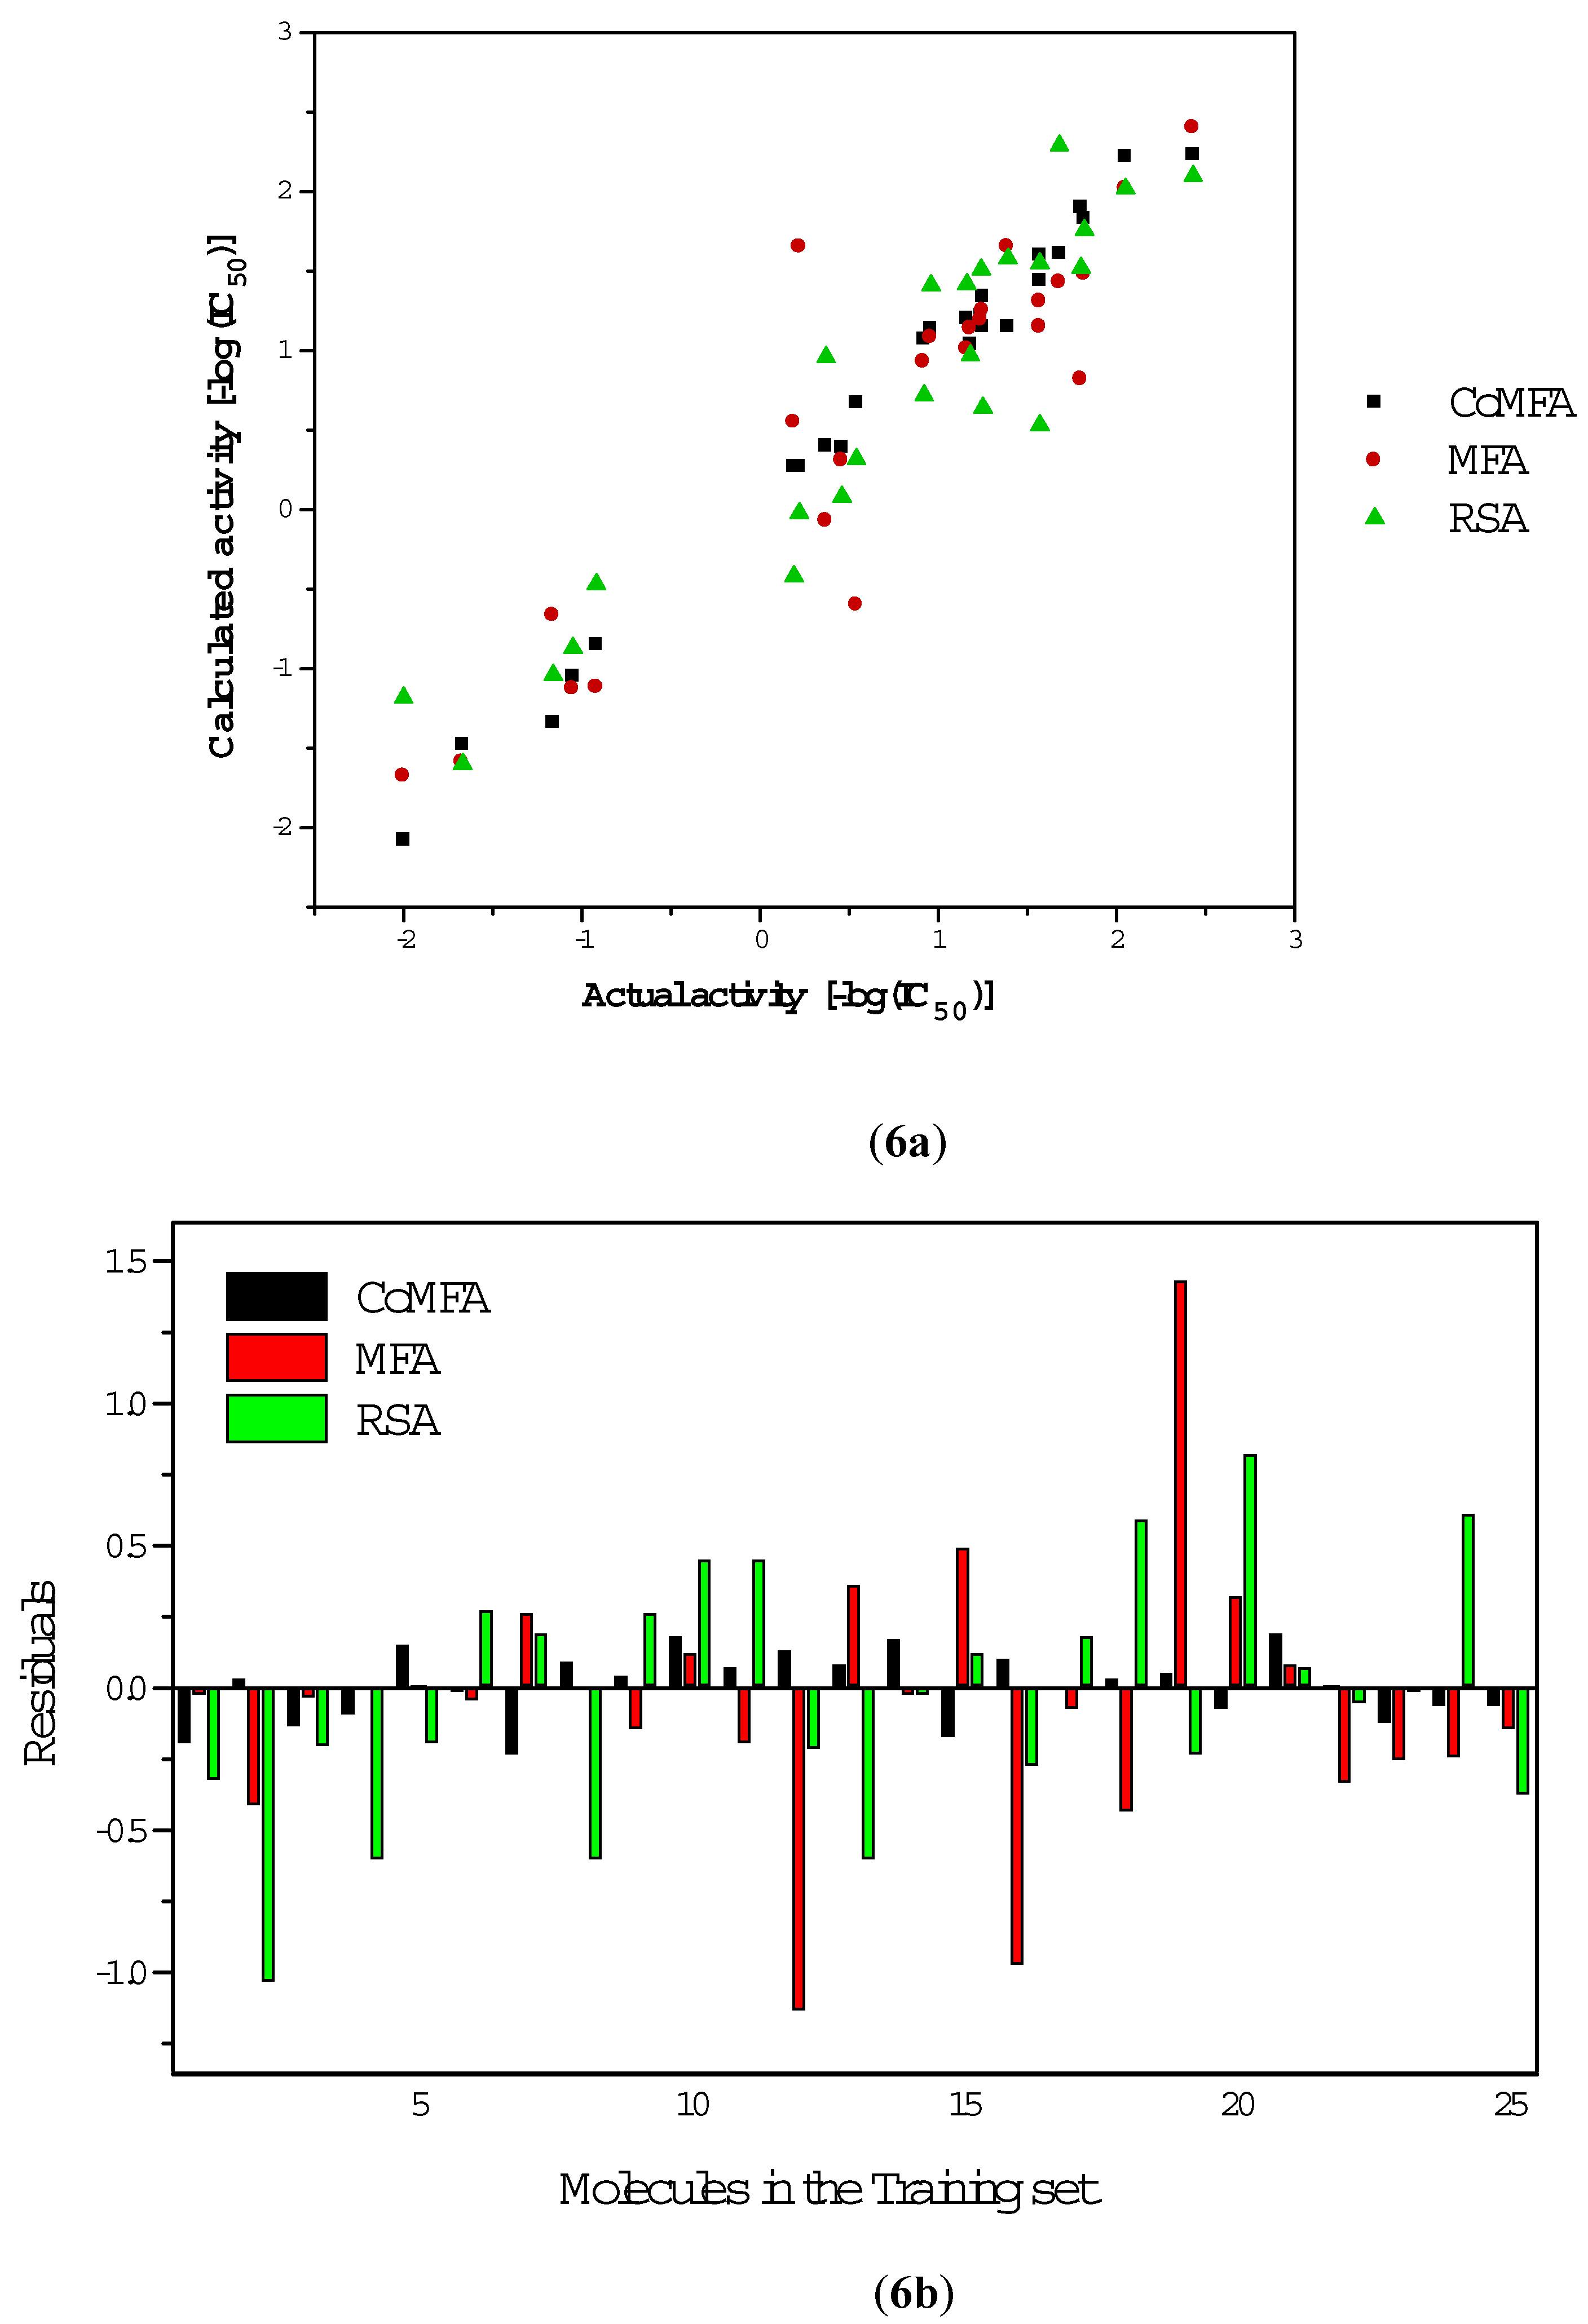
CoMFA

The CoMFA model with 25 compounds produced an r2 cv value of 0.659 (maximum value of r2 cv was obtained with a minimum of 6 components) and a conventional correlation coefficient (r2) of 0.988 with the standard error of estimate being 0.149. The relative contributions of the steric and electrostatic fields are 0.625 and 0.375 respectively. The real validity of the model is expressed in terms of its ability in the prediction of biological activity for new molecules, in other words to predict the activity of those compounds not included in the building of the model. A close analysis of different validity tests indicates that the model generated by the CoMFA analysis is very good. While the actual and predicted activities for the training set are given in Table 1, Table 2 contains the same data for the test set molecules. Table 3 contains additional information regarding model quality.

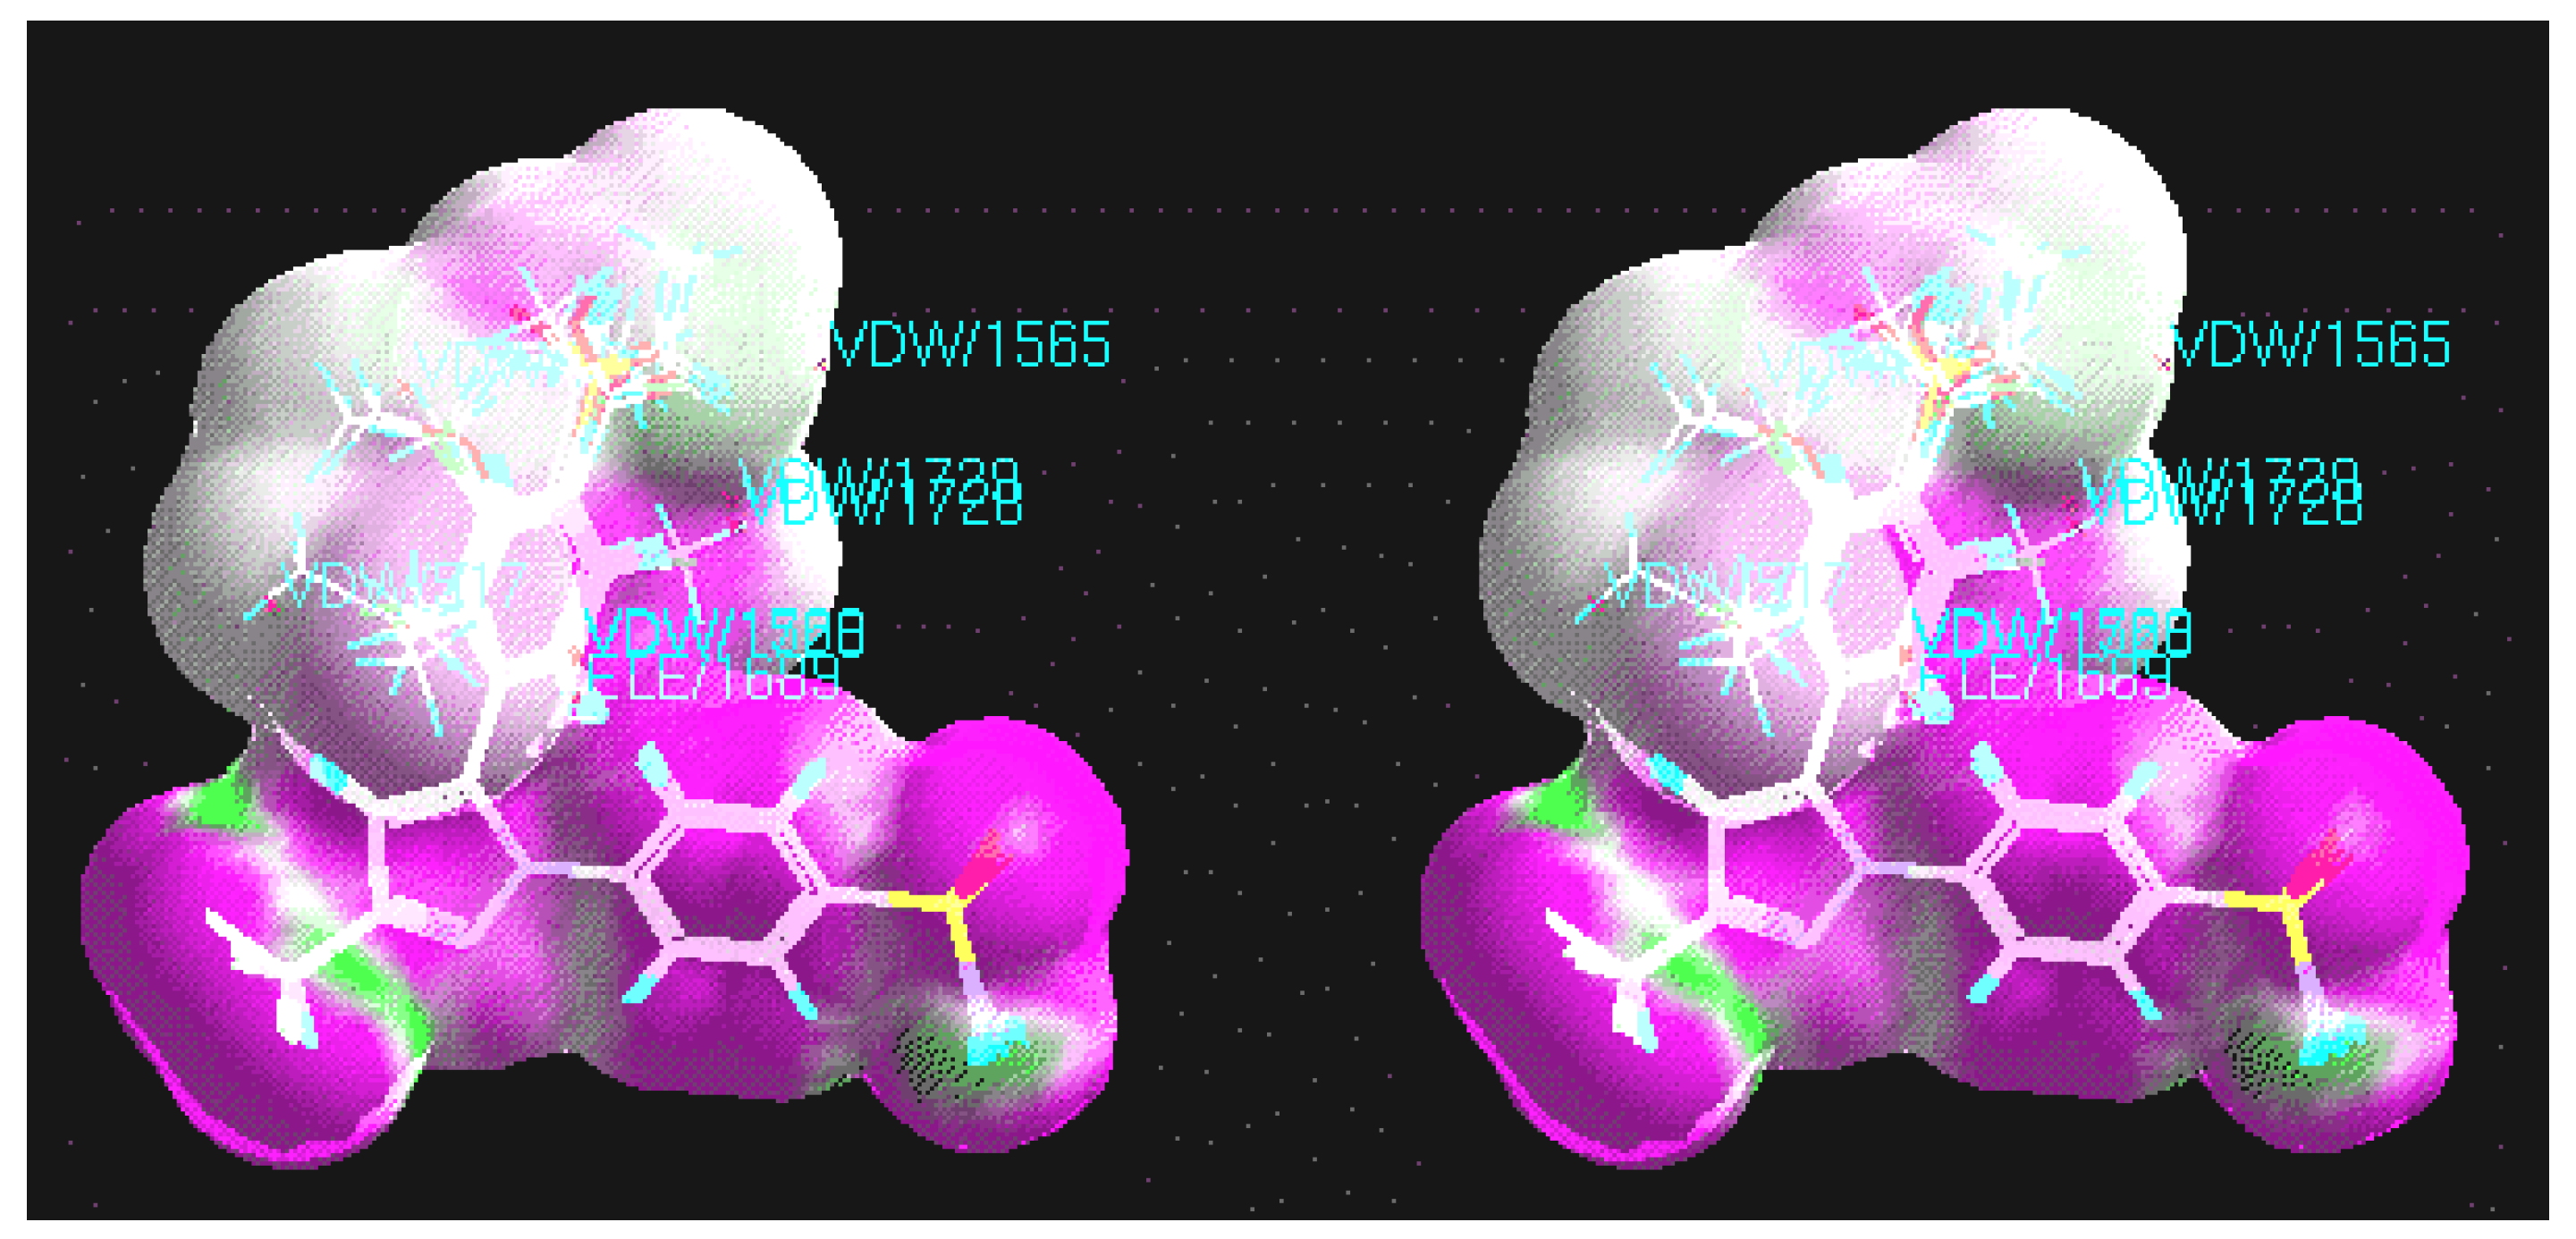
CoMFA coefficient contour maps

The results of QSAR analysis by CoMFA, with its thousands of terms, was generally represented in the form of three-dimensional “coefficient contour” maps. The CoMFA steric and electrostatic fields are represented as coloured contour regions in Figure 2a and Figure 2b respectively. For reference, molecule 1 is displayed in both maps. The green polyhedra in Figure 2a indicate the regions where more bulky substituents are expected to increase the activity; in Figure 2b, any electropositive substituents in the blue regions or electronegative substituents in the red regions enhance the activity. With substituents in appropriate positions, more than one effect may be anticipated (Table 2).
Figure 2a and Figure 2b show the absence of any CoMFA contouring in the ring A region. This is not surprising because all the molecules in the training set are identical in this region. In the absence of any data pertaining to the effect of substitution on ring A, one is unable to say whether or not substitution on this ring will lead to activity variations. However, when the substitution on ring B is varied, there is a significant variation in activity. The electrostatic contour (Figure 2b) shows a favourable interaction of a more electronegative substituent at the 3-position of the ring and this could be due to the presence of both CF3 and CHF2 groups among the training set molecules, with the former generally being the more active.

MFA

The QSAR model with 25 compounds yielded a r2 cv of 0.730 and a conventional correlation coefficient (r2) of 0.860. The predictive ability of this MFA model was evaluated by predicting the biological activities of the test set molecules. The predicted and actual activities of the training set and test set molecules are given in Table 1 and Table 2 while Table 3 features some of the data relating to the validation tests. Figure 4 is the stereoview of the molecules in the training set with a rectangular field grid. Only those field points involved in the QSAR equation are shown in the figure. It is noteworthy that a solitary grid point near ring A is included along with the several grid points near ring B in the QSAR equation.

RSA

The QSAR model generated using the RSA produced a r2 cv of 0.77 and a conventional correlation coefficient (r2) of 0.9. The predictive ability of this model was evaluated by predicting the biological activities of the training set and test set molecules and the actual, predicted activities are given in Table 2 and Table 3. Figure 5 is a stereoview of the receptor surface also showing the molecules in the training set. The violet and green colours indicate favourable and unfavourable interactions respectively, between the molecules and the receptor surface. In Figure 5, while the pyrazole ring and ring A show generally favourable interactions, ring B is not optimized. Thus, substitution patterns may be changed such that the interactions are also optimized with concomitant increase in activity. Thus all the grid points that are part of the QSAR equation are part of this region. The receptor model also supports the models generated by the other two methods.
It is of interest to compare the three models (Table 3, Figure 6a, Figure 6b) with respect to the actual and calculated activities and residuals for all the molecules in the training set. Here, it appears that the CoMFA model is slightly better than the other two (lesser number of off-diagonal points in Figure 6a and bars of smaller height in Figure 6b). When only the test set is considered, the same trend continues as seen from the order of rms values in Table 2. The CoMFA model performs better even when strong electron withdrawing and electron donating groups (NO2, NMe2, F, OMe) are present. MFA and RSA models fare better when steric interactions involving Cl and Me substituents are considered. These trends are reflected in part in the training set. It appears then that each method has advantages and disadvantages. Studies of the present type should not be confined to one model alone.

Conclusions

Three different analogue-based rational drug design methods have been used in the optimisation of COX-2 selective inhibitor design. All three methods produce reasonably good models based on which biological activities for the new molecules can be carried out.

Acknowledgements:

We thank Prof. R. Kumar (I. I. Sc., Bangalore) for his encouragement. Financial assistance from CSIR in the form of project 98(0008)/99/EMR-II is gratefully acknowledged. GRD thanks Molecular Simulations (San Diego) for their continuing support and collaboration.

References and Notes

  1. Picot, D.; Loll, P. J.; Garavito, R. M. The X-ray crystal structure of the membrane protein prostaglandin H2 synthase-1. Nature 1994, 367, 243–249. [Google Scholar] [CrossRef] [PubMed]
  2. Kurumbail, R. G.; Stevens, A. M.; Gierse, J. K.; McDonald, J. J.; Stegeman, R. A.; Pak; Gildehaus, D.; Miyashiro, J. M.; Penning, T. D.; Seibert, K.; Isakson, P. C.; Stallings, W. C. Structural basis for selective inhibition of cyclooxygenase -2 by anti-inflammatory agents. Nature 1996, 384, 644–648. [Google Scholar] [CrossRef] [PubMed]
  3. Kalgutkar, A. S.; Crews, B. C.; Rowlinson, S. W.; Garner, C.; Seibert, K.; Marnett, L. J. Asprin-like molecules that covalently inactivete cyclooxygenase-2. Science 1998, 280, 1268–1270. [Google Scholar] [CrossRef] [PubMed]
  4. Penning, T. D.; Talley, J. J.; Bertenshaw, S. R.; Carter, J. S.; Collins, P. W.; Docter, S.; Graneto, M. J.; Lee, L. F.; Malecha, J. W.; Miyashiro, J. M.; Rogers, R. S.; Rogier, D.; Yu, S. S.; Anderson, G. D.; Burton, E. G.; Cogburn, J. N.; Gregory, S. A.; Koboldt, C. M.; Perkins, W. E.; Seibert, K.; Veenhuizen, A. W.; Zhang, Y. Y.; Isakson, P. C. Synthesis and biological evaluation of the 1,5-diarylpyrazole class of cyclooxygenase-2 inhibitors: Identification of 4-[5-(4-methylphenyl)-3-(trifluromethyl)-1H-pyrazol-1-yl]benzensulfonamide (SC-58635, Celecoxib). J. Med. Chem. 1997, 40, 1347–1365. [Google Scholar] [CrossRef] [PubMed]
  5. SYBYL 6.5 Molecular Modeling Software, Tripos Associates Inc.: S. Hanley Road. St. Louis, MO 63144-2913, 1699.
  6. Stewart, J. J. P. MOPAC; A semiemperical molecular orbital program. J. Comput.-Aided Mol. Des. 1990, 4, 1–105. [Google Scholar] [CrossRef] [PubMed]
  7. Dewar, M. J. S.; Zoebish, E. G.; Healy, E. F.; Stewart, J. J. P. AM1 A New General Purpose Quantum Mechanical Molecular Model. J. Am. Chem. Soc. 1985, 107, 3902. [Google Scholar] [CrossRef]
  8. Reddy, G. O.; Dev, R. V.; Rekha, K. S.; Vyas, K.; Mohanti, S. B.; Kumar, P. R. Acta Crystallogr. 1999, C55, IUC9900161.
  9. Cramer, R. D., III; Patterson, D E.; Bunce, J. D. Comparative Molecular Field Analysis (CoMFA). 1 Effect of shape on binding of steroids to carrier proteins. J. Am. Chem. Soc. 1988, 110, 5959–5967. [Google Scholar]
  10. Cerius2 A program suite for molecular modelling activities, Molecular Simulations Inc.: Scranton Road, San Diego, CA 92121-3752, USA.
  11. Rohrbaugh, R. H.; Jurs, P. C. Descriptions of molecular shape applied in studies of structure/activity and structure/property relationships. Analytica Chimica Acta 1987, 199, 99–109. [Google Scholar] [CrossRef]
  12. Rogers, D.; Hopfinger, A. J. Application of genetic function approximation to quantitative structure-activity relationships and quantitative structure property relationships. J. Chem. Inf. Comput. Sci. 1994, 34, 854–866. [Google Scholar] [CrossRef]
  13. Stanton, D.T.; Jurs, P.C. Development and use of charge partial surface area structural descriptors in computer-assisted quantitative structure-property relationship studies. Anal. Chem. 1990, 62, 2323–29. [Google Scholar] [CrossRef]
  • Sample Availability: Not available.
Scheme 1.
Scheme 1.
Molecules 05 00945 sch001
Figure 1. Fragment 1 and alignment of all molecules using the Sybyl database alignment procedure.
Molecules 05 00945 g001
Figure 2. Stereoviews of steric (a) and electrostatic (b) CoMFA contour plots for pyrazole 1. (a) Bulky substituents enhance activity in the regions shaded green and depress activity in the yellow regions. (b) Electropositive substituents enhance activity in the regions shaded blue and depress activity in the red regions.
Molecules 05 00945 g002
Figure 3. Molecular alignment (Cerius2) based on Fragment 1. Note the very similar molecular superpositions in both Figure 1 and Figure 3. Still, some subtle differences may be observed.
Molecules 05 00945 g003
Figure 4. Stereoview of the molecular rectangular field grid around the superposed molecular units. Both steric (CH3) and electrostatic (H+) grid points in the final QSAR equation are labelled.
Molecules 05 00945 g004
Figure 5. Stereoview of the receptor surface with all molecules considered and weights based on biological activities. Interaction energies of individual molecules on the receptor surface are coloured (violet for a favourable interaction and green for an unfavourable one). The grid points involved in the final QSAR equation are labelled which mainly originates from different substituted phenyl ring which is neither violet nor green indicating substitution maneuvering is possible there without significant loss of biological activity.
Molecules 05 00945 g005
Figure 6. (a) Plot of actual vs. calculated biological activities of the training set molecules in the three methods of analysis. (b) Plot of residuals in the three methods of analysis. In general, CoMFA produced a better model.
Molecules 05 00945 g006
Table 1. Structures, and experimental and calculated inhibitory activities, -(log IC50), of the molecules used in the training set based on the molecular skeleton defined in Scheme 1.
Comp. No.R1, R2R3Activity-(logIC50)Calculated activity
CoMFAMFARSA
13-CH3-4-SCH3CF32.432.232.402.10
23-Cl-4-NHCH3CF31.571.601.150.53
33-Cl-4-OCH3-5-CH3CF31.181.041.140.97
42,4-di-ClCF31.251.151.250.64
52,4-di-CH3CF30.921.070.930.72
62-FCF31.241.221.191.51
74-FCF31.391.151.651.58
82-ClCF31.251.341.250.64
92-MeCF31.161.201.011.42
103-MeCF30.961.141.081.41
114-CF3CF3-0.92-0.85-1.12-0.47
122-OMeCF30.540.67-0.600.32
134-OEtCF30.190.270.55-0.42
144-SMeCF32.052.222.022.02
152-NMe2CF3-1.16-1.34-0.67-1.04
164-NHMeCF31.801.900.821.52
174-CO2HCF3-1.05-1.05-1.13-0.87
183-C2H5-4-OCH3CF30.370.40-0.070.96
193,4-di-OCH3CF30.220.271.65-0.02
204-SO2MeCF3-2.00-2.08-1.68-1.18
214-CO2HCHF2-1.67-1.48-1.59-1.60
224-OMeCHF21.821.831.481.76
233-Cl-4-OCH3CHF21.571.441.311.55
243,5-di-Cl-4-OCH3CHF21.681.611.432.29
253,5-di-F-4-OCH3CHF20.460.390.310.08
Table 2. Structures, and experimental and predicted inhibitory activities, -(log IC50), of the molecules used in the test set.
Comp. No.R1, R2R3Activity-(logIC50)Predicted Activitya
CoMFAMFARSA
264-ClCF32.001.041.841.25
274-MeCF31.400.791.111.24
284-NO2CF3-0.42-0.77-1.720.33
294-NMe2CF32.332.32-0.700.89
303-F-4-OCH3CHF21.301.401.541.32
arms values for the three models are 0.534, 1.486 and 0.803 respectively
Table 3. Details of CoMFA, MSA, and RSA calculations.
CoMFAMFAcRSAd
r 2 cv0.660.730.77
ar 20.99 (0.62 and 0.37)0.860.90
No. of components644
PRESSb0.49.77.756
Standard deviation0.130.430.4
aConventional r2 and the steric and electrostatic contributions are given in the parenthesis.
bPRESS = predicted sum of squares is the root mean square error of all target predictions.
cQSAR equation: Activity = 0.947055 - 0.258821(Ele/401) + 0.085612(vdW/392) + 0.122799(Ele/391) - 0.7848(vdW/350).
dQSAR equation: Activity = 0.546816 - 624.921(vdW/1726)2 + 31.65(vdW/505)2 + 602.116(vdW/1563)2 - 50.1242(-0.1561-vdW/517)2 -0.11822(Ele/1673).

