An EXAFS Study on the Local Structure Around Iron in Atmospheric Aerosols Collected in the Qingdao Area

Abstract
:Introduction
Experimental
Sample collection
EXAFS
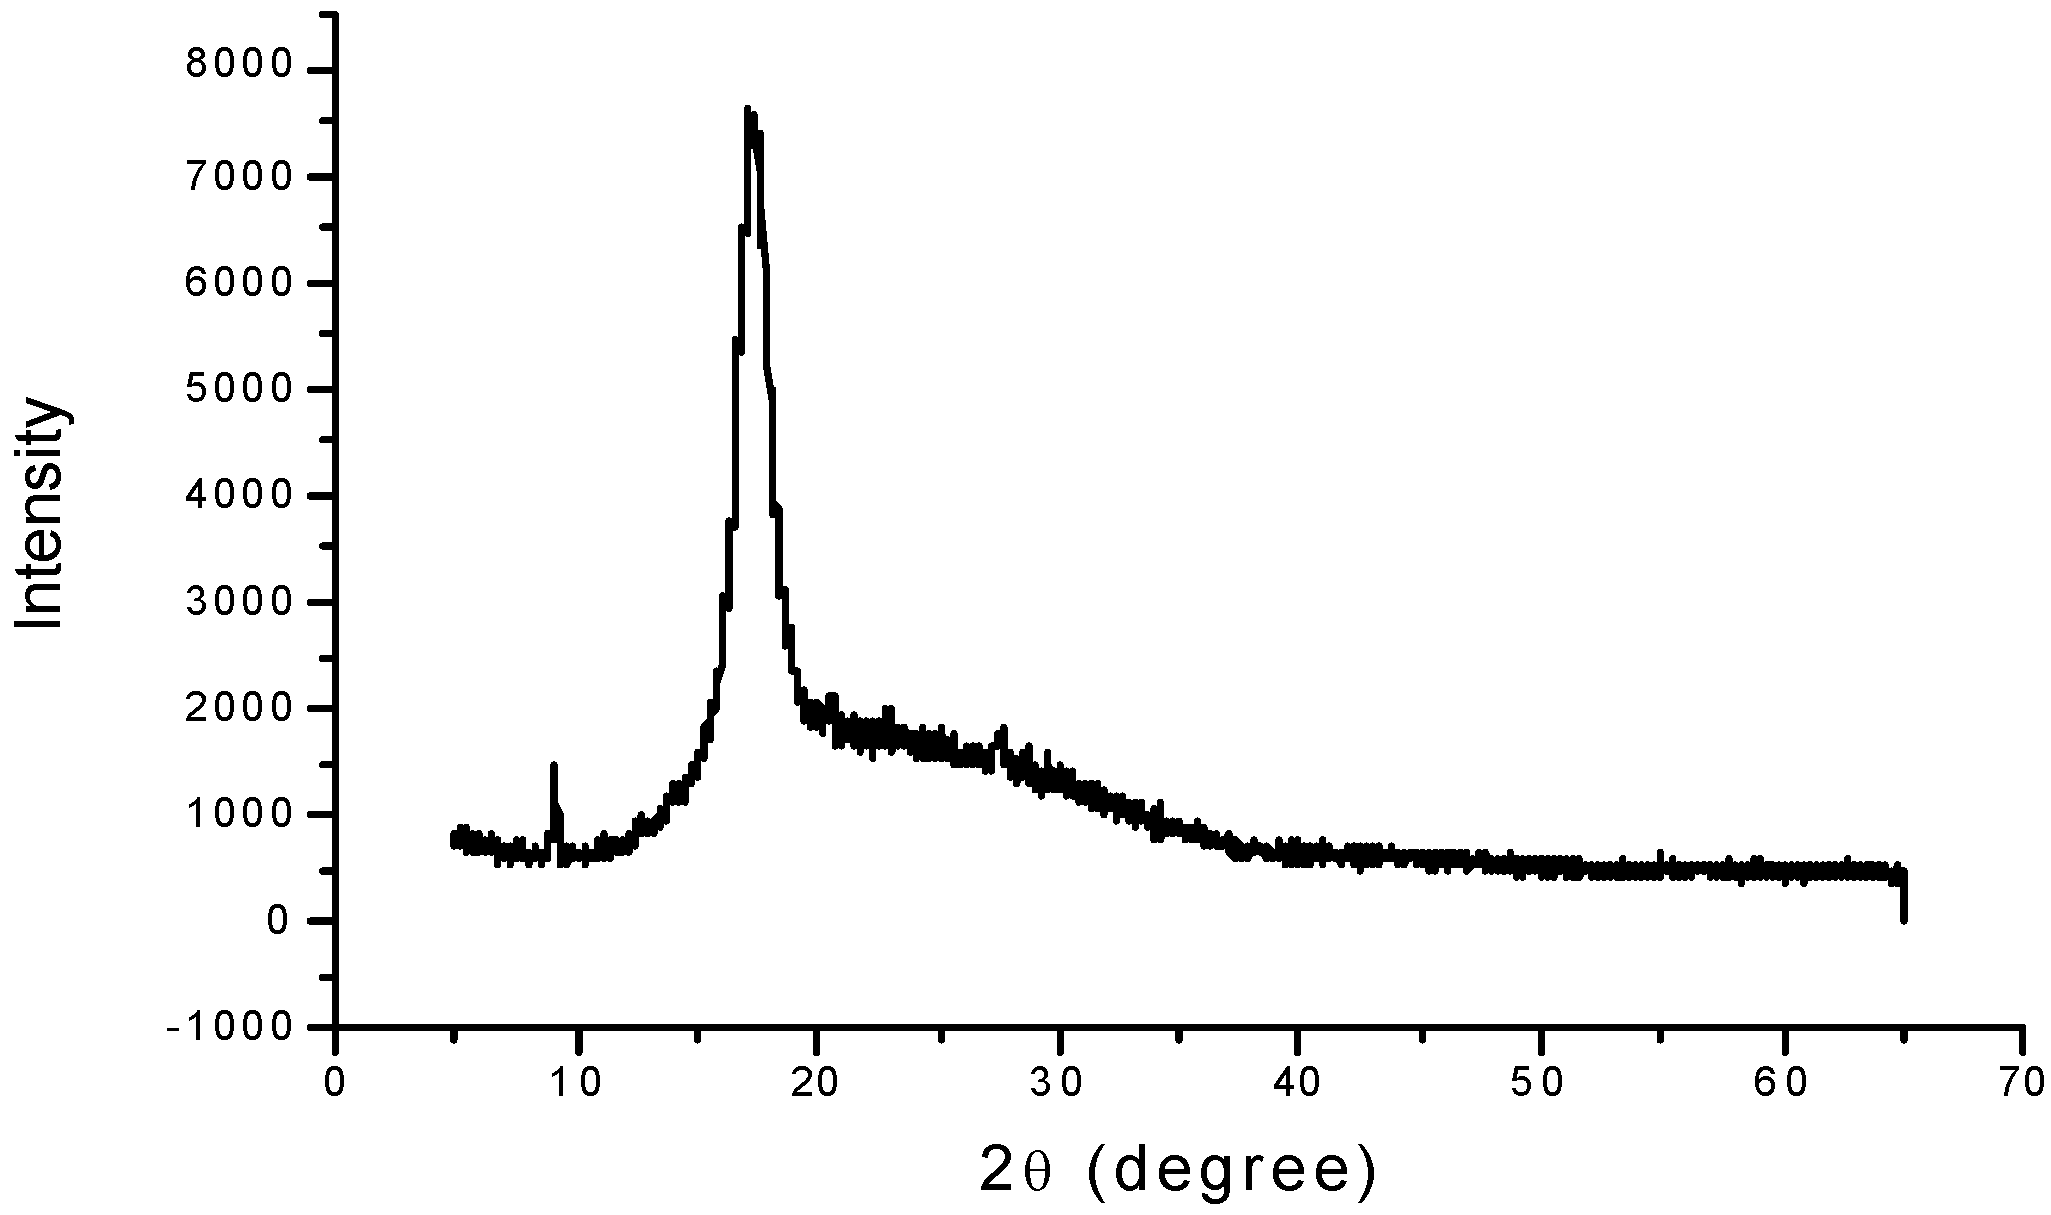
XRD
Iron content measurements
Results and Discussion
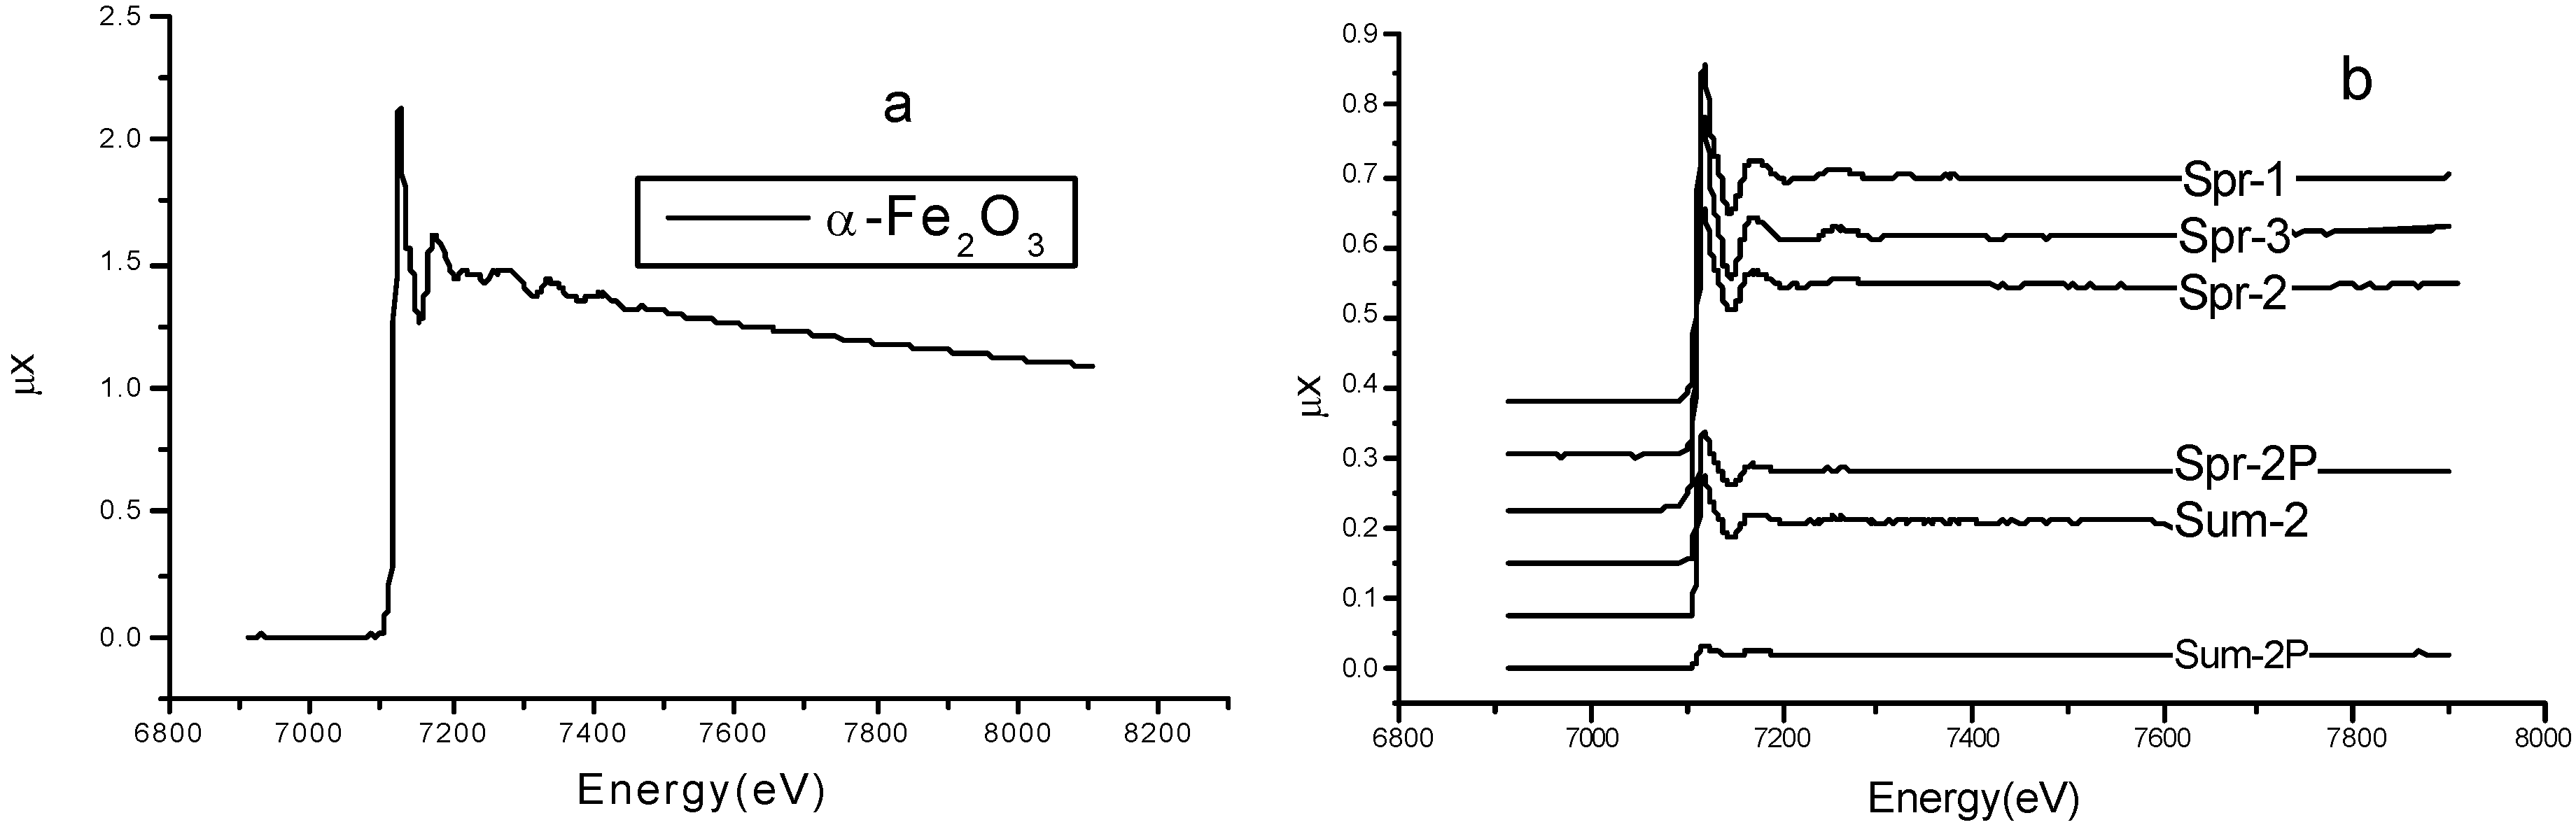
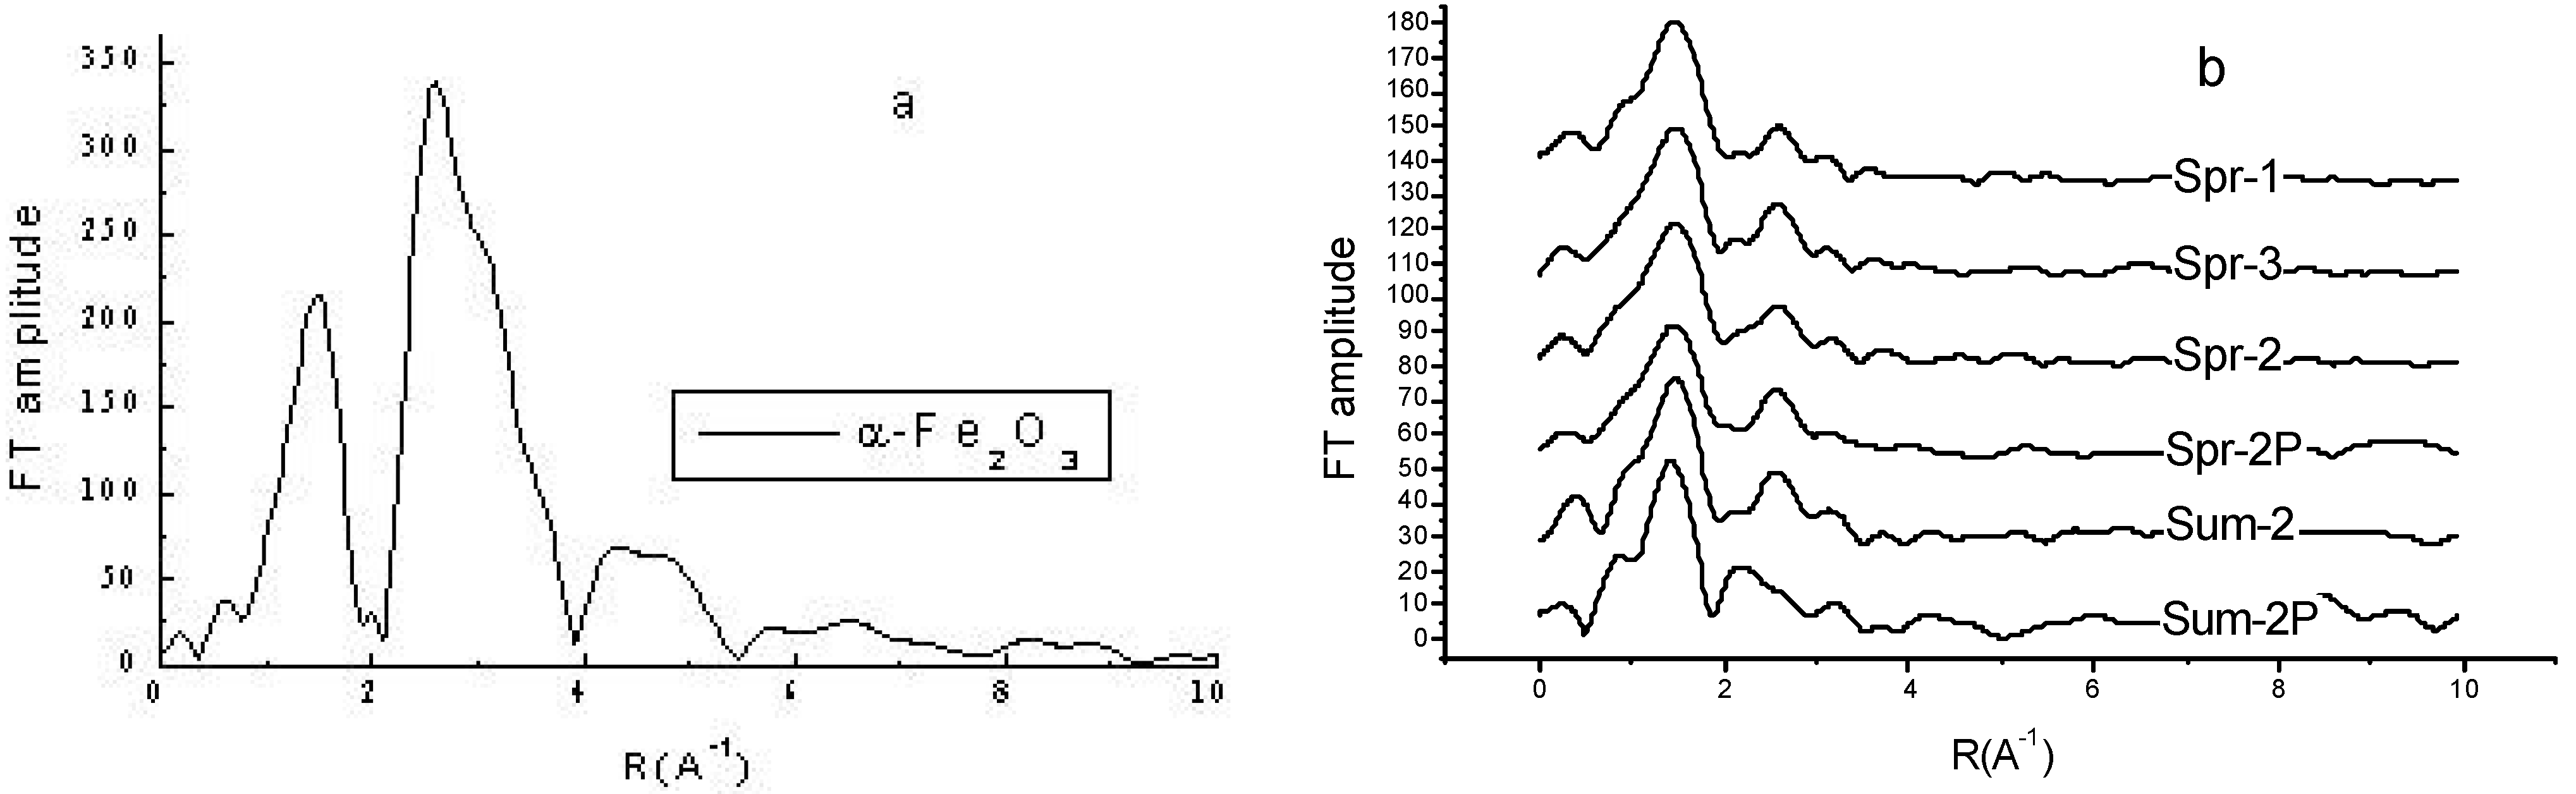
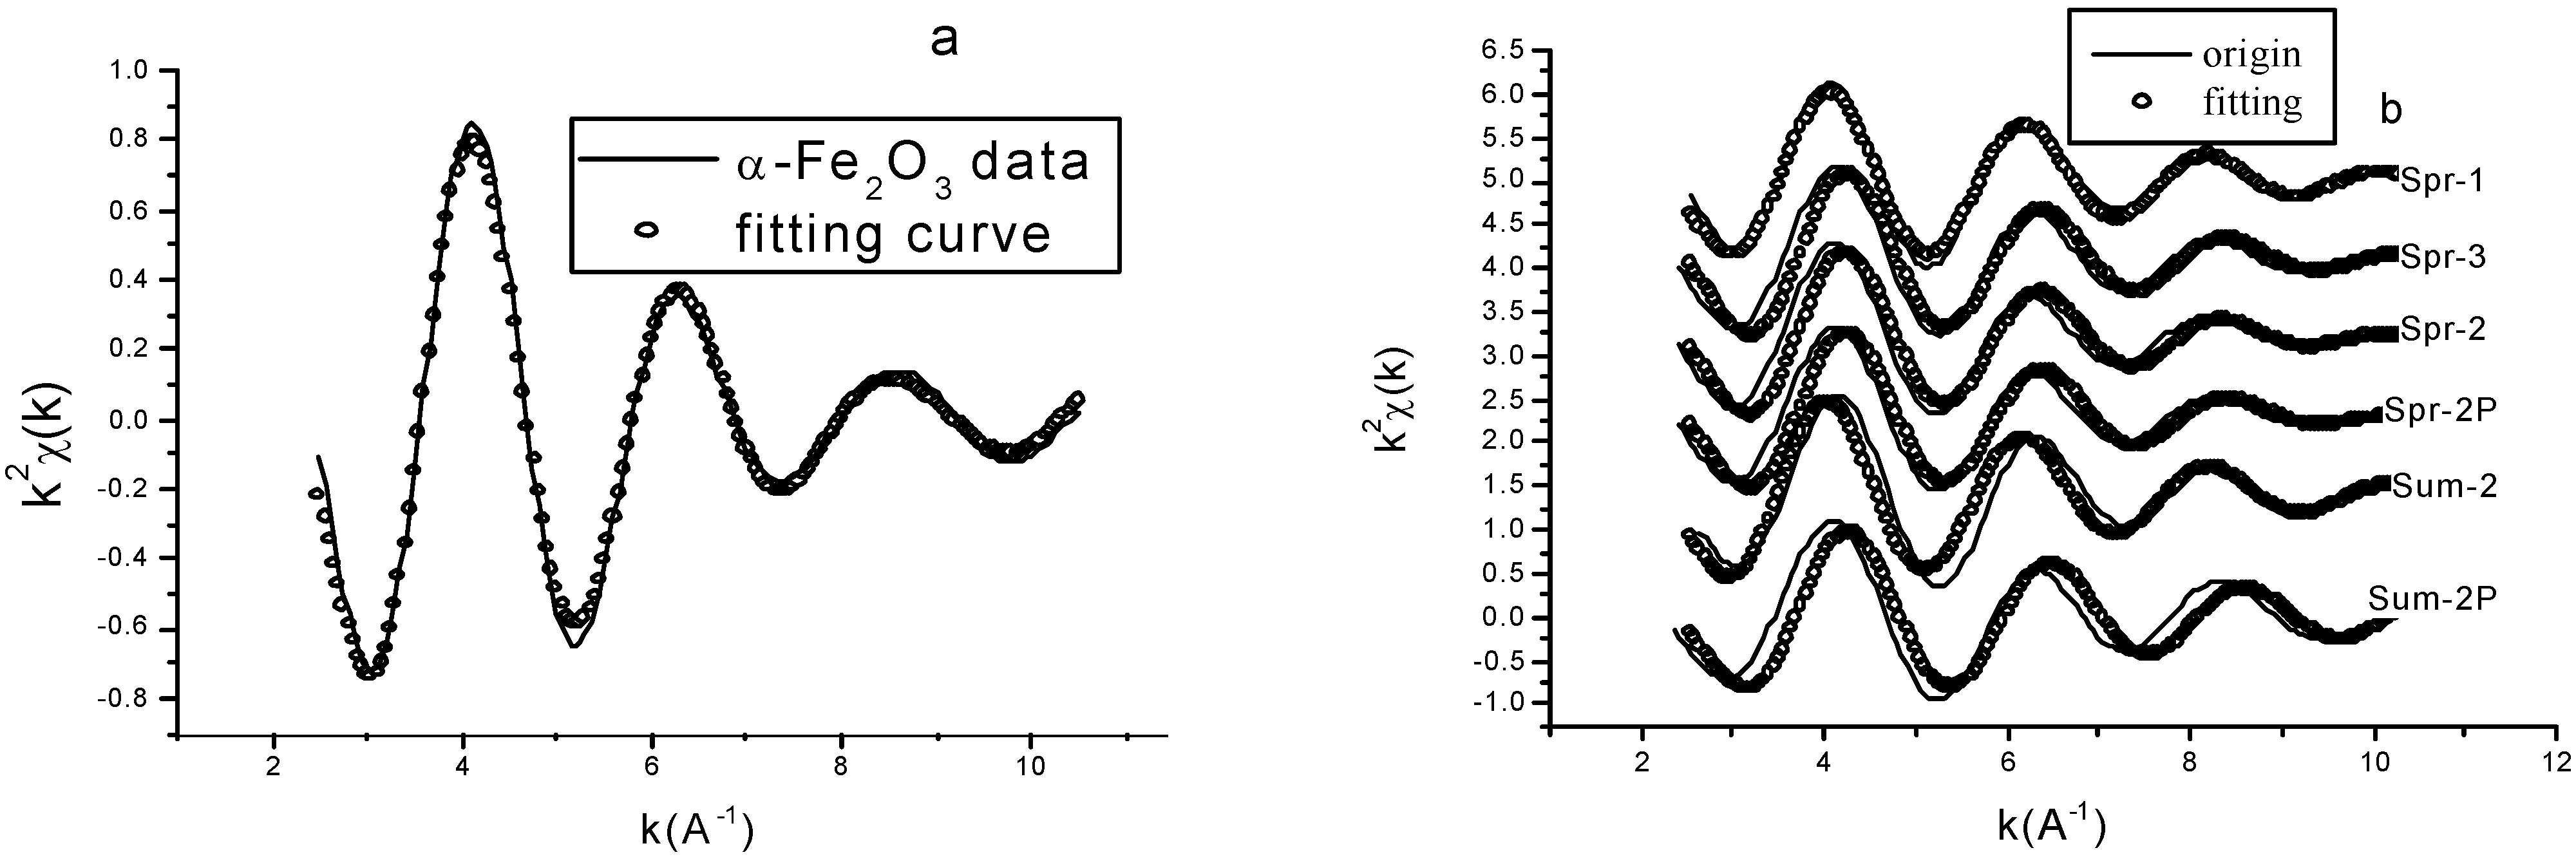
EXAFS data analysis


 is the normalized Planck constant. The EXAFS spectra χ(k)~k were then obtained, and a weight factor of k2 was applied to compensate the swing attenuation effect.

EXAFS analysis results

| Sample | Fe content (%) | First subshell of Fe-O coordination R1(Å) | Coordination number of the first subshell, N1 | Second subshell of Fe-O coordination R2(Å) | Coordination number of the second subshell, N2 |
|---|---|---|---|---|---|
| α-Fe2O3 | 1.945 | 3 | 2.115 | 3 | |
| Spr-1 | 1.77 | 1.966±0.002 | 3.05±0.05 | 2.108±0.02 | 3.01±0.05 |
| Spr-2 | 3.18 | 1.956±0.002 | 3.05±0.05 | 2.108±0.02 | 3.01±0.05 |
| Spr-2P | 2.76 | 1.952±0.002 | 3.05±0.05 | 2.108±0.02 | 2.91±0.05 |
| Spr-3 | 3.10 | 1.960±0.002 | 3.02±0.05 | 2.108±0.02 | 2.91±0.05 |
| Sum-2 | 0.82 | 1.963±0.002 | 3.05±0.05 | 2.108±0.02 | 2.67±0.05 |
| Sum-2P | 0.68 | 1.958±0.002 | 3.05±0.05 | 2.108±0.02 | 2.19±0.05 |
Summary and Conclusions
Acknowledgements
References
- Wang, M.X. Atmospheric Chemistry; China Meteorological Press: Beijing, 1999; pp. 166–244. [Google Scholar]
- Iwasaka, Y.; Yamato, M.; Imasu, R.; Ono, A. Transport of Asian dust (KOSA) particles - importance of weak KOSA events on the geochemical cycle of soil particles. Tellus 1988, 40B, 494–503. [Google Scholar]
- Jiang, Y.R.; Gao, Q.X. Review of atmospheric aerosol impact on climate and ecosystem. Chinese Res. Environ. Sci. 1998, 11, 17–21. [Google Scholar]
- Lin, F.J.; Hsu, S.C.; Jeng, W.L. Lead in the southern East China Sea. Mar. Environ. Res. 2000, 49, 329–342. [Google Scholar]
- Tindale, N.W.; Pease, P.P. Aerosols over the Arabian Sea: atmospheric transport pathways and concentrations of dust and seasalt. Deep-Sea Res. Part II: Topic Studies in Oceanography 1999, 46, 1577–1595. [Google Scholar]
- Spokes, L.; Jickells, T.; Jarvis, K. Atmospheric inputs of trace metals to the northeast Atlantic Ocean: the importance of southeasterly flow. Mar. Chem. 2001, 76, 319–330. [Google Scholar]
- Herut, B.; Nimmo, M.; Medway, A.; Chester, R.; Krom, M.D. Dry atmospheric inputs of trace metals at the Mediterranean coast of Israel (SE Mediterranean): sources and fluxes. Atmos. Environ. 2001, 35, 803–813. [Google Scholar]
- Duce, R. A. The impact of atmosphere nitrogen, phosphorus, and iron species on marine biological productivity. In The Role of Air-Sea Exchange in Geochemical Cycling; Buat-Menard, P., Ed.; Reidel, D.: Dordrecht, 1986; pp. 497–529. [Google Scholar]
- Wells, M.L.; Price, N.M.; Bruland, K.W. Iron chemistry in seawater and its relationship to phytoplankton: a workshop report. Mar. Chem. 1995, 48, 157–182. [Google Scholar]
- Zhuang, G.S.; Yi, Z.; Duce, R.A.; Brown, P.R. Chemistry of iron in marine aerosols. Glob. Biogeochem. Cycles. 1992, 6, 161–173. [Google Scholar]
- Zhuang, G.S.; Yi, Z.; Duce, R.A.; Brown, P.R. Link between iron and sulfur suggested by the detection of Fe(II) in remote marine aerosols. Nature 1992, 355, 537–539. [Google Scholar]
- Gledhill, M.; ven den Berg, C.M.G.; Nolting, R.F.; Timmermans, K.R. Variability in the speciation of iron in the northern North Sea. Mar. Chem. 1998, 59, 283–300. [Google Scholar]
- Wang, Q.W.; Liu, W.H. X-ray absorption fine structure and its application; China Science Press: Beijing, 1994; pp. 52–100. [Google Scholar]
- Ma, L.D.; Yang, F.J. Introductionto Synchrotron Radiation Applications; Fudan University Press: Shanghai, 2001; pp. 149–191. [Google Scholar]
- Sayers, D.E.; Bunker, B.A. X-ray absorption, principles, applications, techniques of EXAFS, SEXAFS and XANES; Konmingsberger, D.C., Prins, R., Eds.; John Wiley: New York, 1988; pp. 211–253. [Google Scholar]
- Rehr, J.J.; Mustre de Leon, J.; Zabinsky, S.I. Theoretical X-ray absorption fine structure standards. J. Am. Chem. Soc. 1991, 113, 5135–5140. [Google Scholar]
- Zhu, Z.P.; Cui, H.; Li, Y.M. Study of iron chemical forms in iron-loaded coal chars. ChineseJ. Fuel Chem. Technol. 1996, 24, 125–130. [Google Scholar]
© 2003 by MDPI ( http://www.mdpi.org). Reproduction is permitted for noncommercial purposes.
Share and Cite
Qi, J.; Zhang, M.; Feng, L.; Li, X.; Xie, Z.; Sun, Z.; Hu, T. An EXAFS Study on the Local Structure Around Iron in Atmospheric Aerosols Collected in the Qingdao Area. Molecules 2003, 8, 31-39. https://doi.org/10.3390/80100031
Qi J, Zhang M, Feng L, Li X, Xie Z, Sun Z, Hu T. An EXAFS Study on the Local Structure Around Iron in Atmospheric Aerosols Collected in the Qingdao Area. Molecules. 2003; 8(1):31-39. https://doi.org/10.3390/80100031
Chicago/Turabian StyleQi, Jianhua, Manping Zhang, Lijuan Feng, Xianguo Li, Zhi Xie, Zhihu Sun, and Tiandou Hu. 2003. "An EXAFS Study on the Local Structure Around Iron in Atmospheric Aerosols Collected in the Qingdao Area" Molecules 8, no. 1: 31-39. https://doi.org/10.3390/80100031