Atomic Force Microscope Imaging of the Aggregation of Mouse Immunoglobulin G Molecules

Department of Chemistry, Jinan University, Guangzhou, 510632, China
*
Author to whom correspondence should be addressed.
Molecules 2003, 8(1), 86-91; https://doi.org/10.3390/80100086
Submission received: 1 January 2003
/
Published: 31 January 2003
(This article belongs to the Special Issue Selected Papers from the International Symposium on Frontiers in Molecular Science (ISFMS 2002))
Abstract
:Mouse immunoglobulin G (Ig G1 and the mixture of Ig G1 and Ig G2) deposited on mica were imaged with an atomic force microscope at room temperature and ambient pressure. At a concentration around 1.0mg/L, the molecules were well dispersed. 2~3 days after sample preparation, both Ig G1 and the mixture could self-assemble into different shapes and further form some types of local-ordered toroidal aggregations (monotoroidal, intercrossed toroidal, concentric toroidal, etc.). The number of monomers was not identical in the different toroidal aggregations but in a same circle, the shapes of polymer self-assembled by several monomolecules were found to be almost the same. There was difference between the aggregation behavior of Ig G1 and the mixture. The mechanism of Ig G molecule aggregation was ascribed to the “Y” shape and loops structure of Ig G molecule.
Introduction
The atomic force microscope (AFM), with its high resolution and continuous images of cells and biomacromolecules, has recently become a powerful tool for the study of biomolecular shapes, conformations, behavior and the relationship between function and molecular conformation. As an antibody, the immunoglobulin G (Ig G) molecule is used as a model in immunology studies and has been studied by many methods, including with AFM [1], due to its important biological function. Its characteristic molecular structure shape, composed of two identical light chains and two identical heavy chains with many loops, makes the Ig G molecule very active and able to bind tightly to almost any other molecule, such as those on the surface of an invading microorganism, therefore the monomolecular behavior of Ig G deserves our attention. Its self-assembled monolayer was studied as a method for immobilizing the interfacial-recognition layer of a surface plasmon resonance immunosensor [2]. In order to further understand the molecular behavior of Ig G itself, AFM was used to probe the aggregation of Ig G molecules deposited on mica in air. The phenomena of further aggregation of Ig G molecules, which have not been reported previously, are reported in this paper and the mechanisms of their aggregation are discussed based on the “Y” shape and loop structures of the Ig G molecule. This study provides valuable data for immunology and clinical medicine.
Results
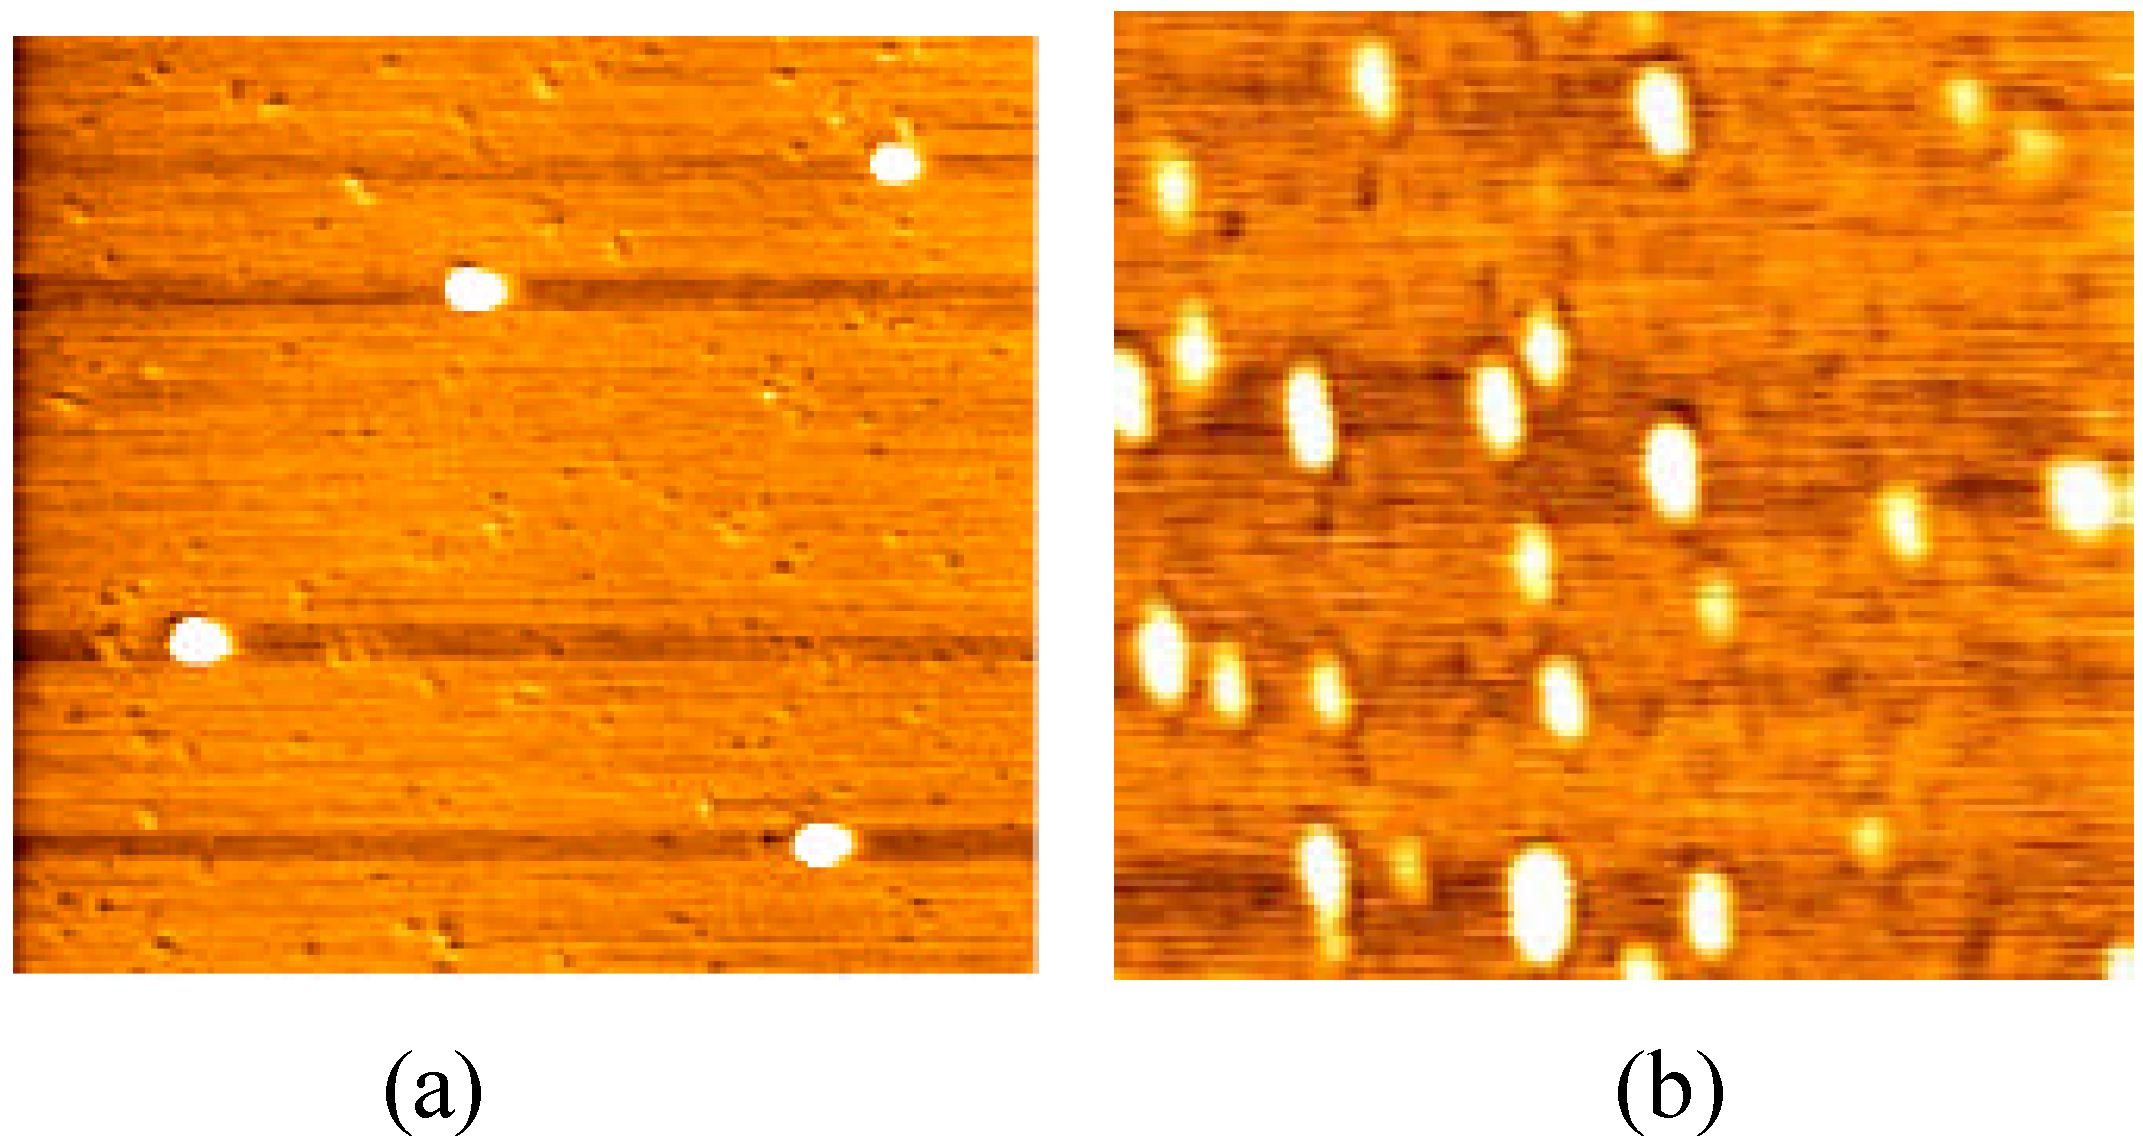
Figure 1 shows the monomolecular image of Ig G1 and Ig G1+Ig G2 (sample concentrations: 0.1μg/mL; scanning scope: 0.5μm) when they were just put on the mica. Ig G1 and Ig G1+Ig G2 were well dispersed as monomers, which in the case of Ig G1 was a 17.0~21.1nm globe, while that of Ig G1+Ig G2 was 20.4~28.8nm. Slight bigger monomer images were obtained here than with X-ray crystallography [3] due to the fact that the Ig G molecule was covered with a water membrane [4] and combined with marker protein PE. The image mechanism of AFM also affected the results [5].
Figure 1.
Monomolecular images of Ig G1 and Ig G1+Ig G2 (a. Ig G1; b. Ig G1+Ig G2)
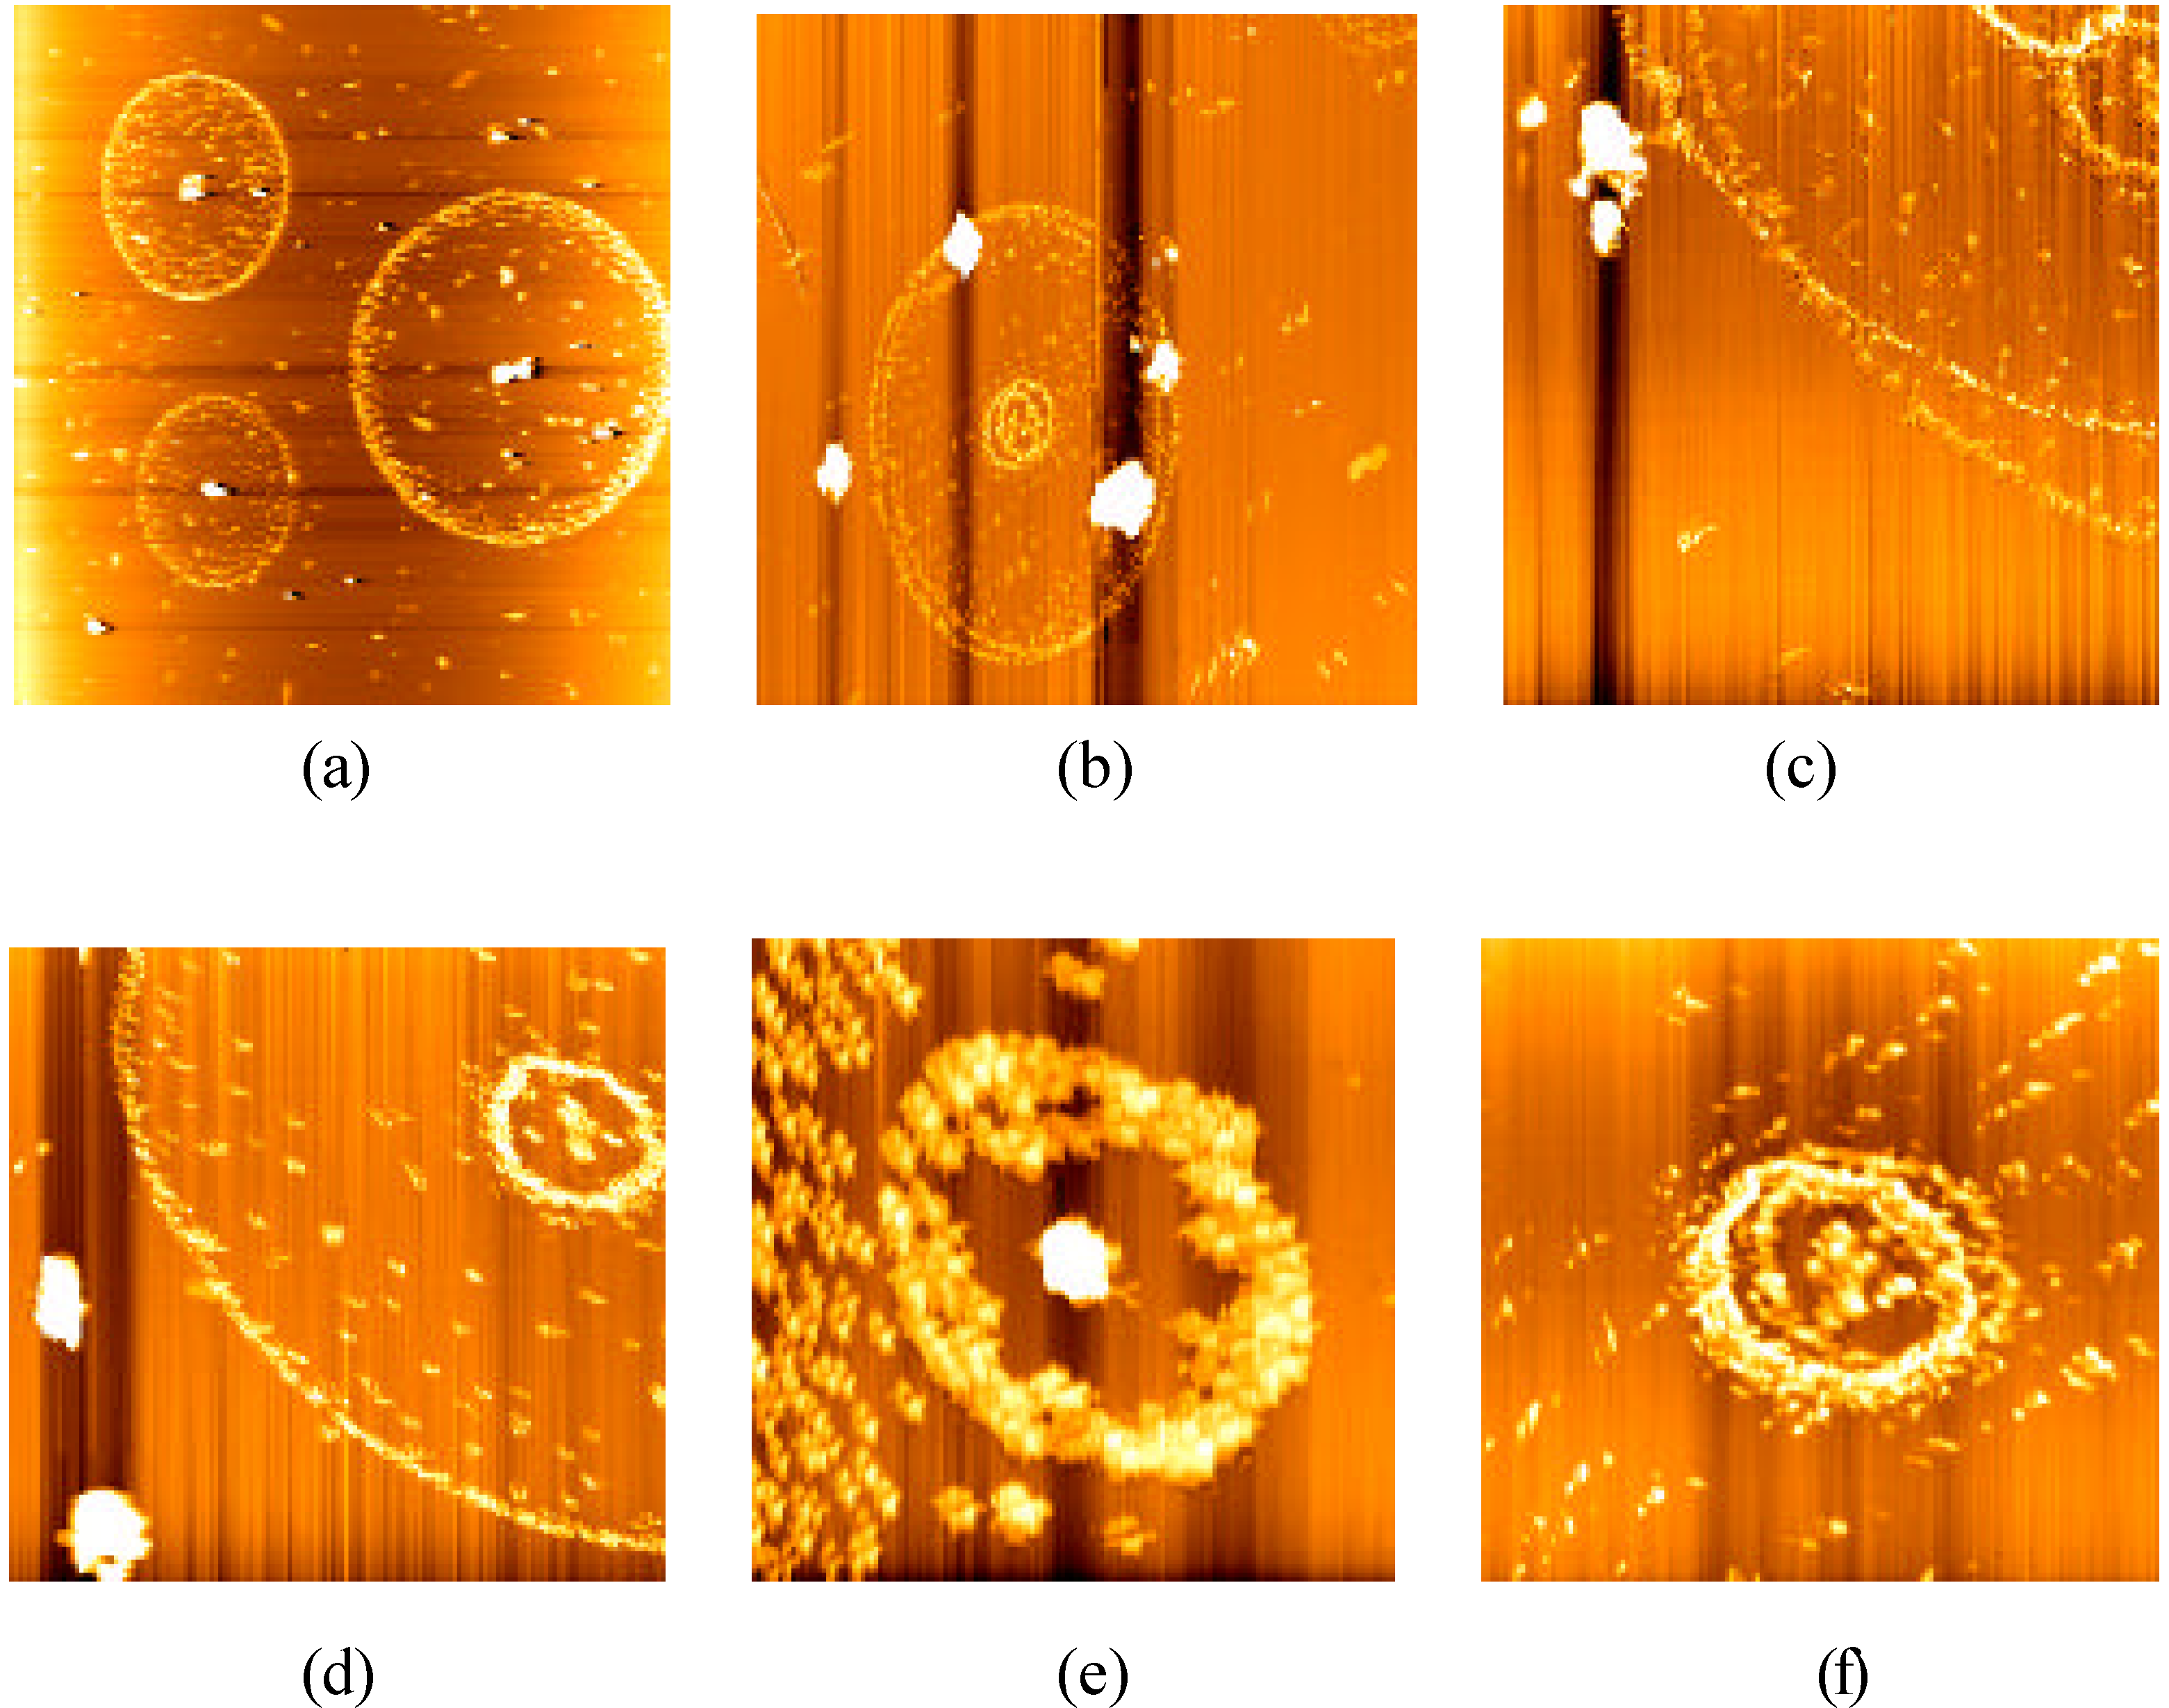
2 or 3 days after sample preparation, as the water in sample solution evaporated gradually, Ig G1 monomers displayed self-assembly and aggregation as shown in Figure 2.
Figure 2.
Some aggregation images of Ig G1

Scanning scopes: a. 18μm; b. 10μm; c. 5μm; d. 5μm; e. 3.5μm; f. 3.31μm
Obviously, these regular aggregations were formed not only by the surface tension as the water evaporated, but also by the interaction among those monomers or polymers, because of the existence of intercrossed toroidal, concentric or nonconcentric circles and so on. These phenomena also appeared in Ig G1+Ig G2, shown in Figure 3, and their aggregation was quicker. From the figures, we find that the monomers self-assembled first into polymers before their further aggregation.
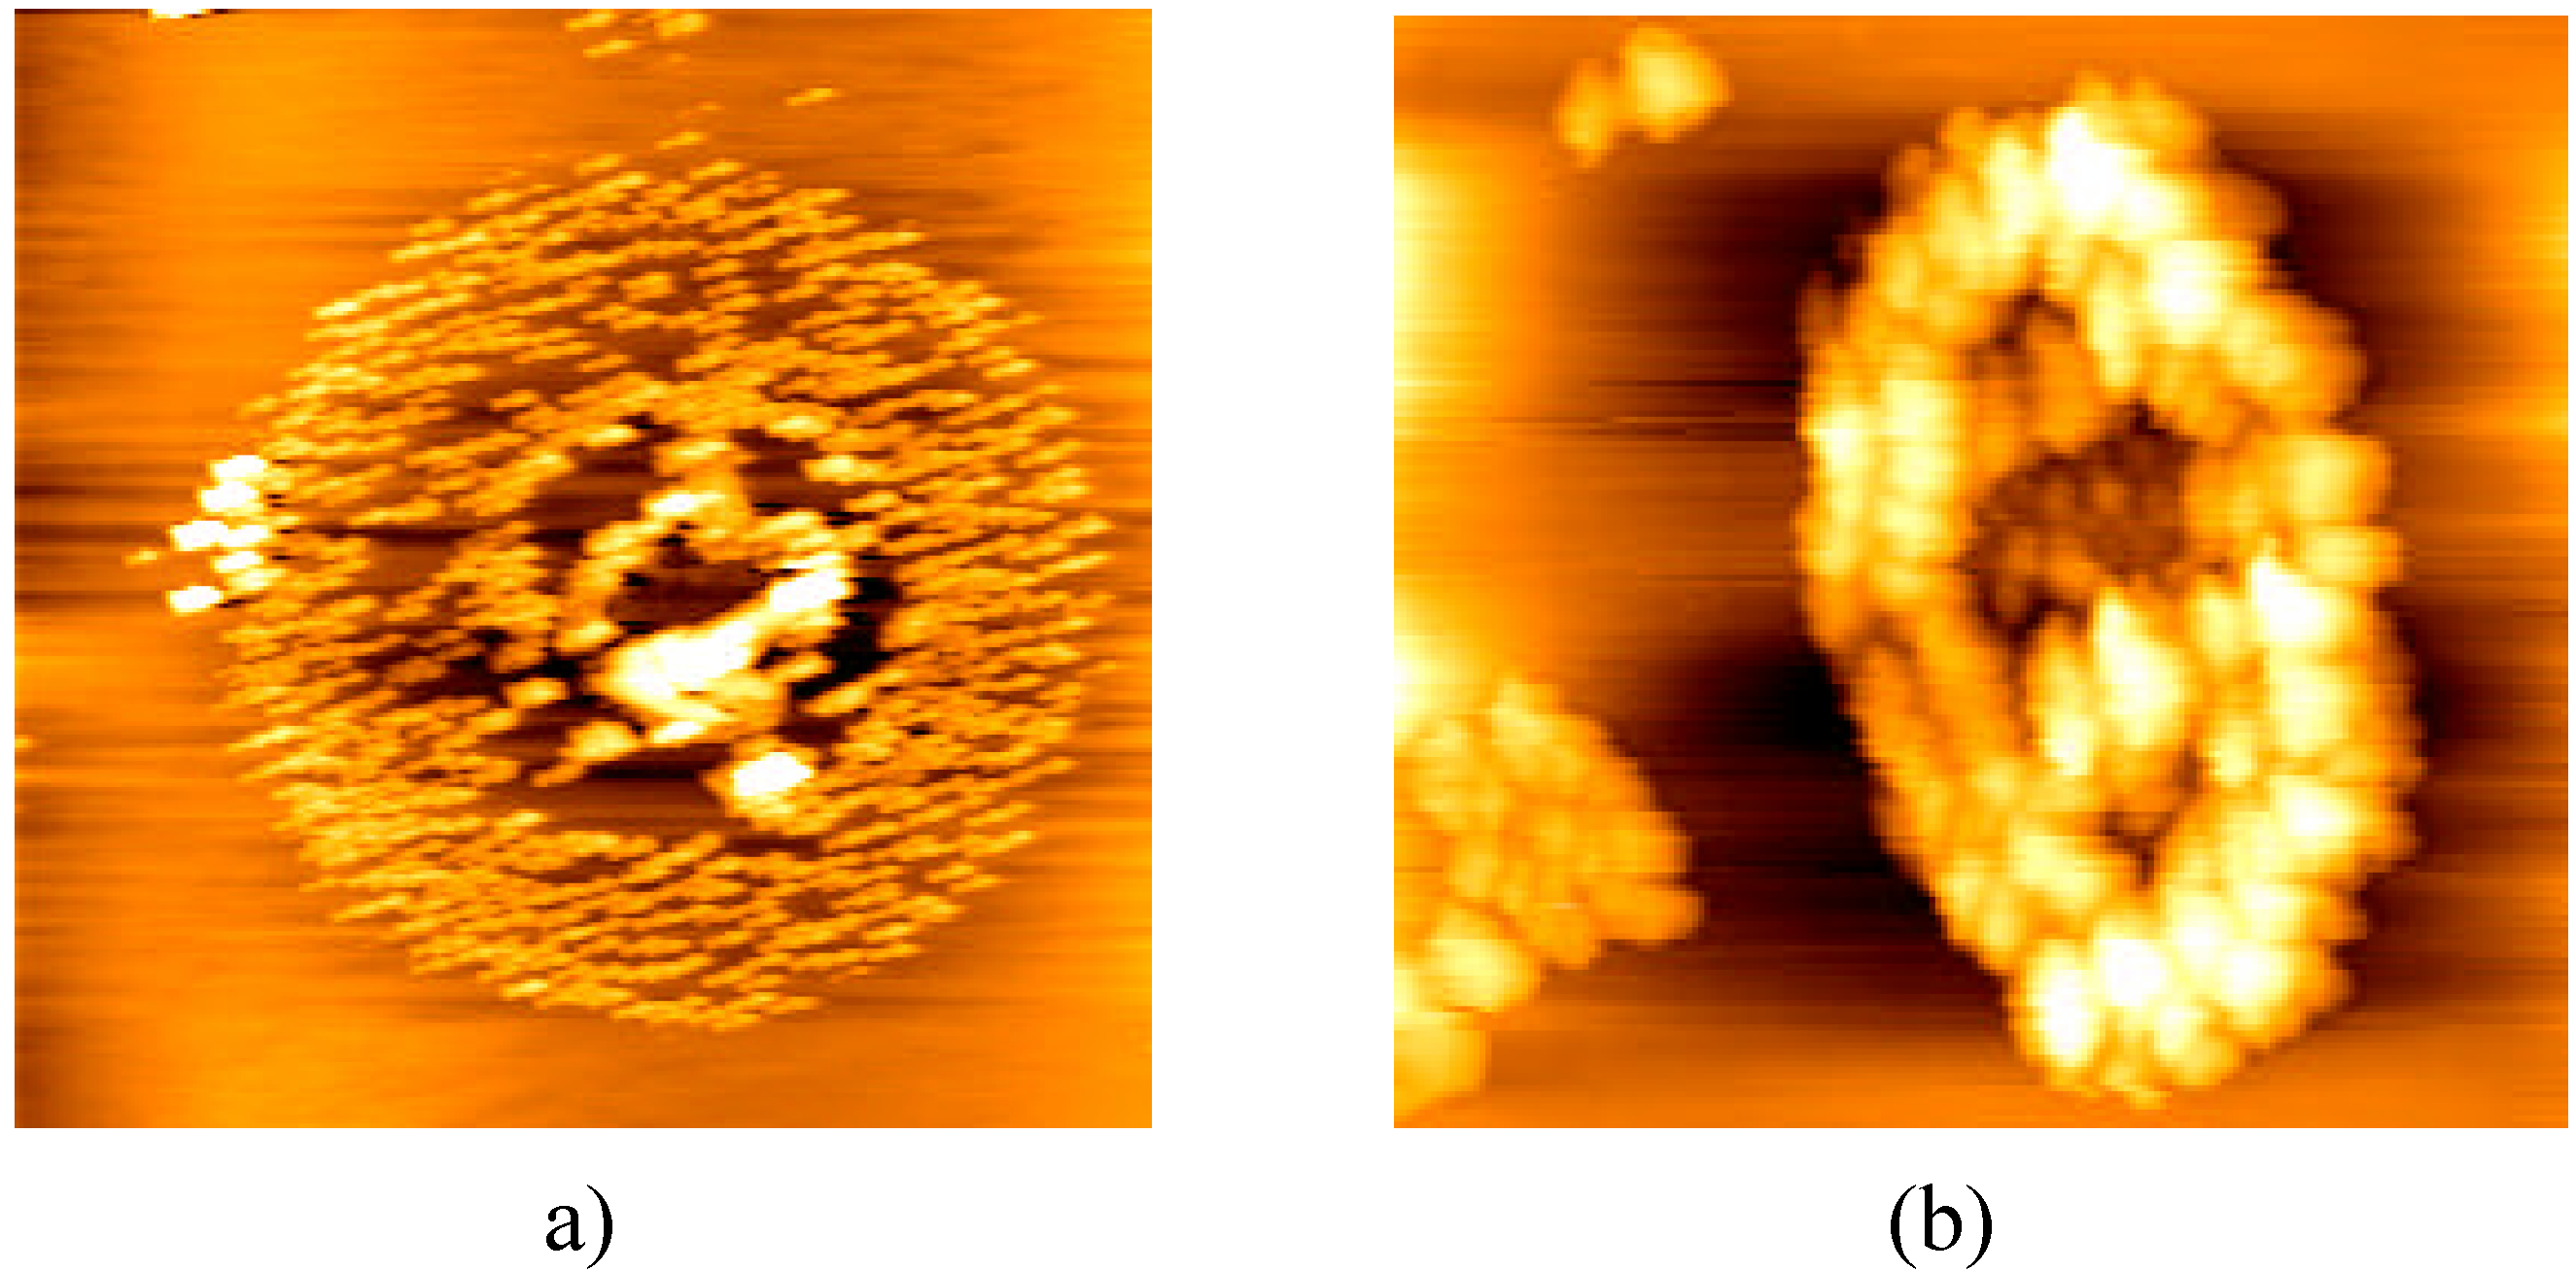
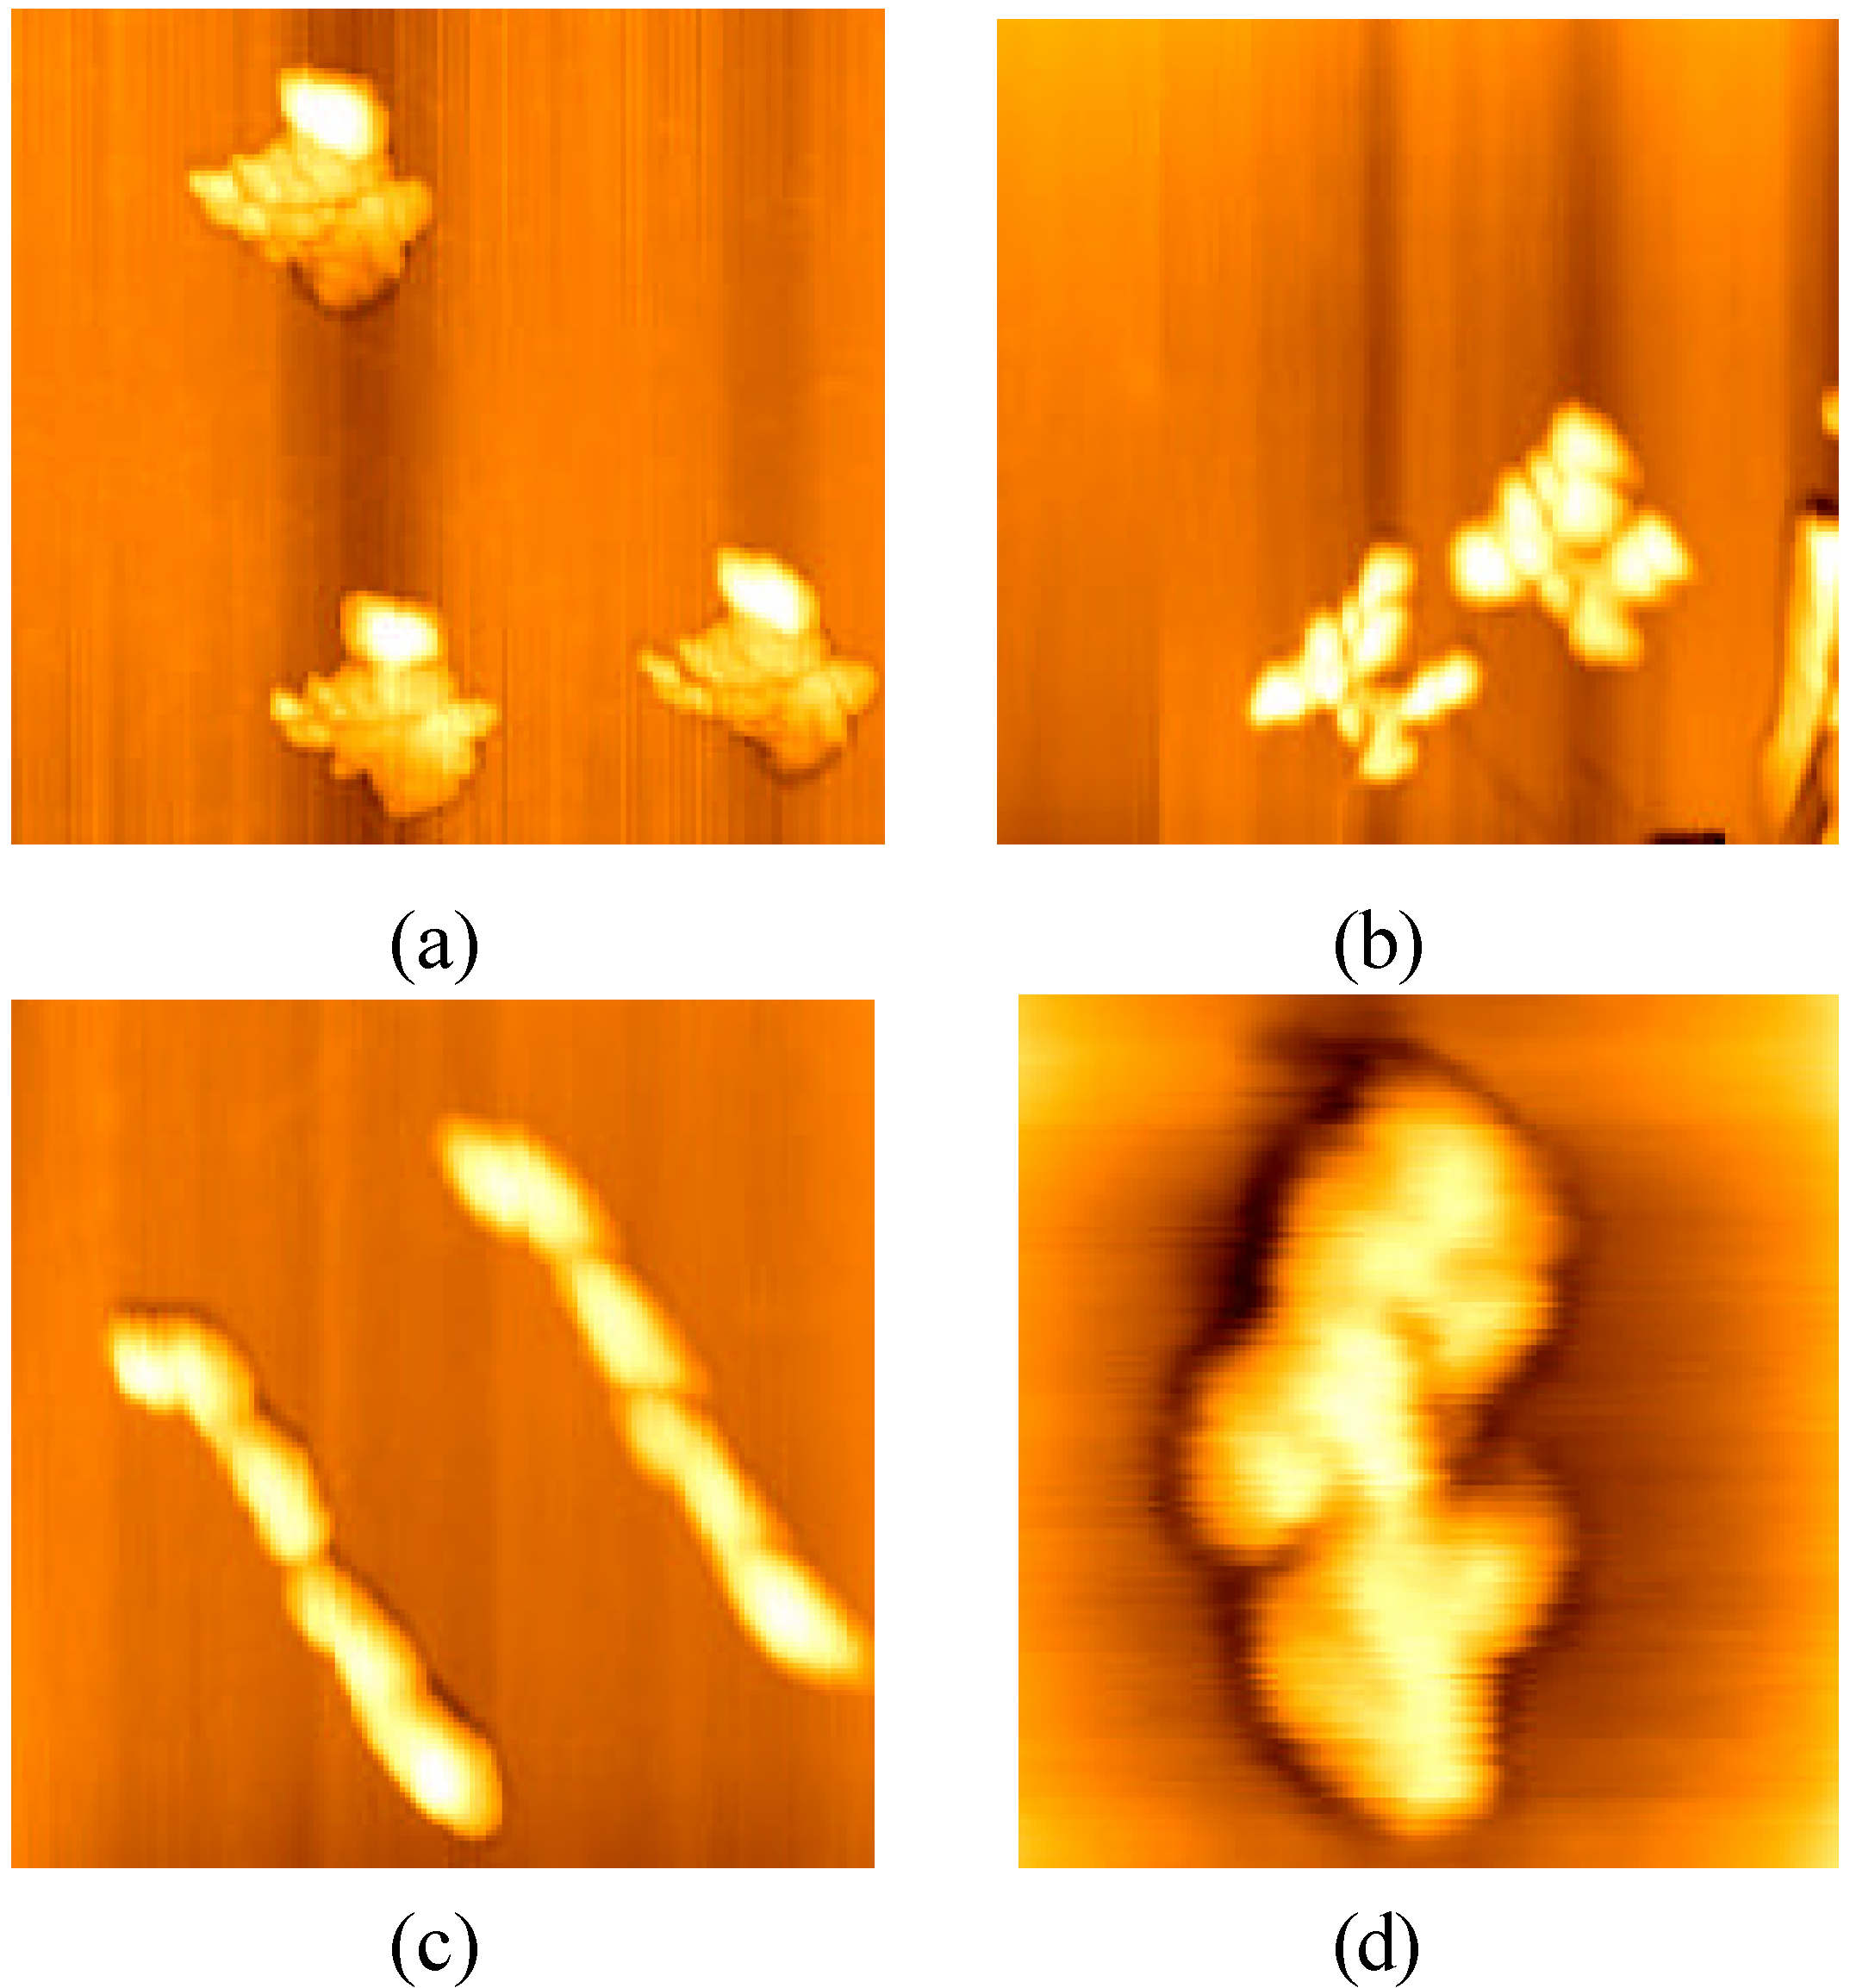
It was interesting that the shapes of polymer self-assembled by several monomolecules were found to be almost same in a concentric circle, and several kinds of them are shown in Figure 4. These results explained also the existence of interaction among Ig G molecules or among their polymers. Those aggregation circles of Ig G finally disappeared naturally.
Figure 3.
Aggregation images of Ig G1+Ig G2

Scanning scope: a. 7μm; b. 1μm
Figure 4.
Shapes of polymer self-assembled by several monomolecules

Scanning scopes: a. 2μm; b. 800nm; c. 600nm; d. 250nm
Discussion
Although the self-assembly of Ig G molecules had been studied, further aggregation had not been reported in the literature. Their further aggregation phenomena in aqueous solution were observed in this study as water evaporated and their solutions became more concentrated .The dispersed Ig G molecules deposited on mica in solution moved closer and formed polymers. The self-assembly and aggregation of Ig G molecules can be ascribed to monomolecular polarity and affinity, for example Van der Waals attraction forces caused by those chemical groups on the molecular surface, as well as hydrogen bonds, salt bridges, etc., which make the Ig G molecules aggregate closely and therefore the protein becomes more stable. On the other hand, the “Y” shape and loop structure [6] of Ig G should be main reason to make their self-assembly and aggregation easy. Ig G molecules can bind to their antigens extremely tightly, and in this process the loops allow a large number of chemical groups to surround a ligand (antigen) so that the protein can link to it with many weak bonds. Therefore, it is the loop structure that is mainly responsible for making Ig G very active and become an attack molecule. When Ig G molecules (including polymers) moved closer, they contact each other widely due to the “Y” shape of molecule instead of the globe conformation. Many chemical bonds between loops are formed, especially in the antigen binding site of Ig G, which may change its conformation to fit the ligand. These inter-attractions make monomolecules combine tightly to form several kinds of regular shapes as shown in Figure 4.
The phenomena seen in this study suggest that Ig G may attack the other molecule (antigen) easily. Polymers became more active and unstable because their molecular volume increases, so these polymers tend to aggregate to balancing the energy or to reach the lowest energy combination in the system. The aggregation behavior of Ig G polymers helps their stability to avoid the decomposition of the polymer structure, which is in agreement of our understanding of the process of the protein′s denaturing, precipitation, crystallization and so on. The circle is a system of lower energy, as we know, so this kind of aggregation appears in the Ig G polymers. In addition, these aggregations of protein molecules may be explained by the dissipative structure theory. The unstable macromolecules always tend to make themselves more stable. We present experimental results to show the interaction among Ig G molecules as seen in the study, and although we assume the “Y” shape and loops structure of Ig G to explain the aggregation of Ig G molecules, we don’t know whether new covalent linkages have formed between monomolecules or polymers. For that, we need further study to better understand the mechanism of aggregation of Ig G molecules.
Conclusions
Ig G molecules self-assemble in aqueous solution and further aggregations of these Ig G molecules are presented. Furthermore, the mechanism of Ig G molecule aggregation was explained by using the “Y” shape and loops structure of Ig G molecule.
Experimental
General
Mouse Ig G1 combined with the marker protein PE, and mixtures of Ig G1 and Ig G2 (Ig G1+Ig G2, the proportions of them being as same as in normal serum) were supplied by Becton, Dickinson and Company (both the same concentrations of 100mg/L). Ig G1 and Ig G1+Ig G2 were diluted respectively to 0.1mg/L with bacteria-free water. A sample of about 0.5μL was put on the surface of fresh mica, then the sample dispersed and dried gradually. The samples were imaged with AFM every day thereafter. AFM (Autoprobe CP Research, THERMO, USA) was performed at 25ºC, 50% humidity. Samples were measured with a 100μm scanner, high pressure NCM model and UL 20D silicon probe needle (microarm length 85μm, force constant 25N/m, needle tip r=10nm, data collection in constant force made). All images were treated with the Flatten Active software to only remove the lower-frequency noise in the scanning direction.
References and Notes
- Preininger, C.; Clausen-Schaumamn, H.; Ahluwalia, A.; De Rossi, D. Characterization of Ig G Langmuir-Blodgett films immobilized on funtionalized polymers. Talanta 2000, 52, 921–930. [Google Scholar] [PubMed]
- Disley, D.M.; Cullen, D.C.; You, H.-X.; Lowe, C.R. Covalent coupling of immunoglobulin G to self-assembled monolayers as a method for immobilizing the interfacial-recognition layer of a surface plasmon resonance immunosensor. Biosensors & Bioelectronics 1998, 13, 1213–1225. [Google Scholar] [CrossRef]
- Hansma, H.G.; Vesenka, J.; Siegerist, C.; Kelderman, G.; Morrett, H.; Shinsheimer, R.L.; Elings, V.; Bustamante, C.; Hansma, P.K. Reproducible Imaging and Dissection of Plasmid DNA Under Liquid With the Atomic Force Microscope. Science 1992, 256, 1180–1184. [Google Scholar]
- Drake, B.; Prater, C.B.; Weisenhorn, A.L.; Gould, S.A.C.; Albrecht, T.R.; Quate, C.F.; Cannell, D.S.; Hansma, H.G.; Hansma, P.K. Imaging crystals, polymers, and processes in water with the atomic force microscope. Science 1989, 243, 1586–1589. [Google Scholar]
- Keller, D. Reconstruction of STM and AFM images distorted by finite-size tips. Surf. Sci. 1991, 253, 353–364. [Google Scholar] [CrossRef]
- Alberts, B.; Bray, D.; Johnson, A.; Lewis, J.; Raff, M.; Roberts, K.; Walter, P. Essential Cell Biology; Garland Publishing, Inc.: New York & London, 1998; p. 157. [Google Scholar]
© 2003 by MDPI ( http://www.mdpi.org). Reproduction is permitted for noncommercial purposes.
Share and Cite
MDPI and ACS Style
Cai, J.; Chen, Y.; Xu, Q.; Chen, Y.; Zhao, T.; Wang, X.; Xia, K. Atomic Force Microscope Imaging of the Aggregation of Mouse Immunoglobulin G Molecules. Molecules 2003, 8, 86-91. https://doi.org/10.3390/80100086
AMA Style
Cai J, Chen Y, Xu Q, Chen Y, Zhao T, Wang X, Xia K. Atomic Force Microscope Imaging of the Aggregation of Mouse Immunoglobulin G Molecules. Molecules. 2003; 8(1):86-91. https://doi.org/10.3390/80100086
Chicago/Turabian StyleCai, Jiye, Yao Chen, Qingcai Xu, Yong Chen, Tao Zhao, Xiaoyan Wang, and Ke Xia. 2003. "Atomic Force Microscope Imaging of the Aggregation of Mouse Immunoglobulin G Molecules" Molecules 8, no. 1: 86-91. https://doi.org/10.3390/80100086