Article

Atom, Atom-Type, and Total Linear Indices of the “Molecular Pseudograph’s Atom Adjacency Matrix”: Application to QSPR/QSAR Studies of Organic Compounds

by
Yovani Marrero Ponce
1,*,
Juan Alberto Castillo Garit
2,
Francisco Torrens
4,
Vicente Romero Zaldivar
5 and
Eduardo A. Castro
6
1
Department of Pharmacy, Faculty of Chemical-Pharmacy, Central University of Las Villas, Santa Clara, 54830, Villa Clara, Cuba
2
Department of Drug Design, Chemical Bioactive Center, Central University of Las Villas, Santa Clara, 54830, Villa Clara, Cuba
3
Applied Chemistry Research Center, Central University of Las Villas, Santa Clara, 54830, Villa Clara, Cuba
4
Institut Universitari de Ciència Molecular, Universitat de València, Dr. Moliner 50, E-46100 Burjassot (València), Spain
5
Faculty of Informatics, University of Cienfuegos, Cienfuegos, Cuba
6
INIFTA, División Química Teórica, Suc.4, C.C. 16, La Plata 1900, Buenos Aires, Argentina
*
Author to whom correspondence should be addressed.
Molecules 2004, 9(12), 1100-1123; https://doi.org/10.3390/91201100
Submission received: 4 May 2004 / Accepted: 13 October 2004 / Published: 31 December 2004

Abstract

:
In this paper we describe the application in QSPR/QSAR studies of a new group of molecular descriptors: atom, atom-type and total linear indices of the molecular pseudograph’s atom adjacency matrix. These novel molecular descriptors were used for the prediction of boiling point and partition coefficient (log P), specific rate constant (log k), and antibacterial activity of 28 alkyl-alcohols and 34 derivatives of 2-furylethylenes, respectively. For this purpose two quantitative models were obtained to describe the alkyl-alcohols’ boiling points. The first one includes only two total linear indices and showed a good behavior from a statistical point of view (R2 = 0.984, s = 3.78, F = 748.57, q2 = 0.981, and scv = 3.91). The second one includes four variables [3 global and 1 local (heteroatom) linear indices] and it showed an improvement in the description of physical property (R² = 0.9934, s = 2.48, F = 871.96, q2 = 0.990, and scv = 2.79). Later, linear multiple regression analysis was also used to describe log P and log k of the 2-furyl-ethylenes derivatives. These models were statistically significant [(R² = 0.984, s = 0.143, and F = 113.38) and (R² = 0.973, s = 0.26 and F = 161.22), respectively] and showed very good stability to data variation in leave-one-out (LOO) cross-validation experiment [(q2 = 0.93.8 and scv = 0.178) and (q2 = 0.948 and scv = 0.33), respectively]. Finally, a linear discriminant model for classifying antibacterial activity of these compounds was also achieved with the use of the atom and atom-type linear indices. The global percent of good classification in training and external test set obtained was of 94.12% and 100.0%, respectively. The comparison with other approaches (connectivity indices, total and local spectral moments, quantum chemical descriptors, topographic indices and E-state/biomolecular encounter parameters) reveals a good behavior of our method. The approach described in this paper appears to be a very promising structural invariant, useful for QSPR/QSAR studies and computer-aided “rational” drug design.

Introduction

The graph-theory approach appears to be an important alternative to computer-aided molecular design methods. They provide for the discovery of new lead drugs at minimum cost [1]. The high cost of development of new bioactive molecular entities using traditional methods has led to the interest of the pharmaceutical industry in “rational” drug design assisted by computers. This is manifested by the gradually growing interest shown by these companies in quantitative studies of Structure-Activity/Property Relationships (QSAR/QSPR) directed to the rationalization of the search for new biologically active molecules. In this sense, rational combinatorial library design [2] and virtual screening [3] have emerged as important foci of attention in drug discovery research.
An important part of QSAR/QSPR research is the discovery of molecular descriptors applicable to physical, chemical and biological properties of interest. At present, there are a great number of molecular descriptors that can be used in QSAR/QSPR studies [4]. The so-called topological indices (TIs) are among the most useful molecular descriptors known nowadays [5,6,7,8,9,10]. TIs can be classified as “global” and “local”, according to the way in which they characterize the molecular structure [11]. However, most TIs known today can be considered as global molecular descriptors. One exception in this sense is the electrotopological state (E-state) index [12,13]. Other “global” molecular descriptors, such as the spectral moments of the edge adjacency matrix, can be obtained in local form [11]. The great success of the E-state and total and local spectral moments in QSPR/QSAR stimulated us to propose and validate here some novel local descriptors based on a topological characterization of the molecular structure.
In this sense, our research group has recently introduced the novel computer-aided molecular design scheme TOMOCOMD-CARDD (acronym of TOpological MOlecular COMputer Design-Computer Aided “Rational” Drug Design) [14,15,16]. This method has been developed to generate molecular descriptors based on the linear algebra theory. This approach has been successfully employed in QSPR/QSAR studies [15,16,17,18], including studies related to nucleic acid-drug interactions [19]. The approach describes changes in the electron distribution with time throughout the molecular backbone. The TOMOCOMD-CARDD strategy is very useful for the selection of novel subsystems of compounds having a desired property/activity, which can be further optimized by using some of the many molecular modeling methods at the disposition of the medicinal chemists. The method has also demonstrated flexibility in relation to many different problems. One of the applications involved the prediction of the anthelmintic activity of novel drugs [20]. More recently, the TOMOCOMD-CARDD approach has been applied to the fast-track experimental discovery of novel antimalarial compounds [21]. Codification of chirality and other 3D structural features constitutes another advantage of this method [22]. The latter opportunity has allowed the description of the significance-interpretation and the comparison to other molecular descriptors [16,23]. The features of the kth total and local linear and quadratic indices was illustrated by examples of various types of molecular structures, including chain-lengthening, branching, heteroatoms-content, and multiple bonds. Besides, the linear independence of the quadratic and linear indices to others 0D, 1D, 2D, and 3D molecular descriptors is demonstrated by using principal component analysis for several heterogeneous molecules [16,23].
The main objective of the present paper was to test the QSPR/QSAR applicability of the TOMOCOMD-CARDD approach; and in a second place, to compare the results obtained with other cheminformatic methods in order to assess it. For this purpose, we will develop quantitative models to describe the boiling points of alkyl alcohols and the partition coefficient (log P), specific rate constant (log k) and antibacterial activity of 34 derivatives of 2-furylethylenes.

Theoretical Approach

The current approach is based on the calculation of the linear indices of the molecular pseudograph’s atom (vertex) adjacency matrix. The general principle of this approach for small-to-medium size organic compounds has been explained in some detail elsewhere [16]. However, in this paper we offer a global consideration of this approach.
First, the molecular vector (X) is built to calculate the linear indices of a molecule, where the components of this vector are numeric values that represent a certain atomic property. These properties characterize each atom type in the molecule. Some of these properties can be the electronegativity, density, atomic radii, among others. For example the Mulliken electronegativity (XA) [24] of an atom A takes the values XH = 2.2 for Hydrogen, XC = 2.63 for Carbon, XN = 2.33 for Nitrogen, XO = 3.17 for Oxygen, XCl = 3.0 for Chlorine, and so on. Therefore, a molecule having 5, 10, 15,..., n atoms can be represented by means of vectors, with 5, 10, 15,..., n components, belonging to the spaces ℜ5, ℜ10, ℜ15,...,ℜn, respectively, where n is the dimension of the real sets (ℜn).
This focus allows us to code molecules like acetic acid (suppressed H-atoms) through the molecular vector X = [XC, XC, XO, XO] = [2.63, 2.63, 3.17, 3.17], in the XA-electronegativity scale [24]. This vector belongs to the product space of ℜ4. The use of other atomic properties defines other vectors. In this context, total (and local) linear indices include “bulk” properties and physicochemical properties (such hydrophobicity [25], molecular polar surface area [26], molar refractivity [27], molecular polarizability [28] and atomic charge summatory [29]), if some atomic physicochemical parameters (such as atomic Log P [25], surface contributions of polar atoms [26], atomic molar refractivity [27], atomic hybrid polarizabilities [28], and Gasteiger-Marsilli atomic charge [29], respectively) are consider as atom-property (atom-label) for build the n-dimensional molecular vector, X.

Local (Atom) Linear Indices of the “Molecular Pseudograph’s Atom (Vertex) Adjacency Matrix”

If we have a molecule composed by n atoms (vector ofn), then the kth atom linear indices, fk(xi), will be calculated as linear maps in ℜn [fk(xi): ℜn→ ℜn; thus fk(xi): End on ℜn ] in the canonical bases of this space as is shown in Eq. 1,
Molecules 09 01100 i001
where, kaij = kaji (symmetric square matrix), n is the number of atoms of the molecule, and Xj are the coordinates of the molecular vector (X) in a set of basis vectors of ℜn. One can choose the basis vectors; the coordinates of the same vector will be different [30,31,32,33]. The values of the coordinates depend thus in an essential way on the choice of the basis. With the so-called canonical (‘natural’) basis, ej denotes the n-tuple having 1 in the jth position and 0’s elsewhere. In the canonical basis, the coordinates of any vector X coincide with the components of this vector [30,31,32,33]. For this reason, those coordinates can be considered as weights (atom labels) of the vertices of the molecular pseudograph [15,16,17,18,19,20,21,22,23].
The coefficients kaij are the elements of the kth power of the matrix M(G) of the molecular pseudograph (G). The term pseudograph in chemical graph-theory was introduced by Frank Harary [34]. According to him, a pseudograph is a graph with multiple edges or loops between the same vertices or the same vertex. Loop-multigraph [35] or general graphs [36] are other terms also used in this research area [37].
Here, M(G) = M = [aij], denotes the matrix of fk(xi) with respect to the natural basis. In this matrix n is the number of vertices (atoms) of G and the elements aij are defined as follows [15,16,17,18,19,20,21,22,23]:
aij = Pij if ij and ∃ ek ∈ E(G)
= Lii if i = j
= 0 otherwise
where E(G) represents the set of edges of G. In this adjacency matrix M(G) the row i and column i correspond to vertex vi from G. Pij is the number of edges between vertices vi and vj, and Lii is the number of loops in vi.
Given that aij = Pij, the elements aij of this matrix represent the number of bonds between an atom i and other j. The matrix Mk provides the number of walks of length k that link the vertices vi and vj. For this reason, each edge in M1 represents 2 electrons belonging to the covalent bond between atoms vi and vj; e.g. the inputs of M1 are equal to 1, 2, or 3 when single, double or triple bonds appear between vertices vi and vj, respectively. On the other hand, molecules containing aromatic rings with more than one canonical structure are represented by a pseudograph. This happens for substituted aromatic compounds such as pyridine, naphthalene, quinoline, and so on, where the presence of PI(π) electrons are accounted for by means of loops in each atom of the aromatic ring. Conversely, aromatic rings having only one canonical structure, such as furan, thiophene, and pyrrole are represented by a multigraph.
It should be noted that atom’s linear indices are defined as a linear transformation fk(xi) on an molecular vector space ℜn. This map is a correspondence that assigns to every vector X in ℜn a vector f(x) in such a way that:
f1X1 + λ2X2) = λ1f(X1) + λ2f(X2)
for any scalar λ12 and any vector X1,X2 in ℜn. The defining equation (1) for fk(xi) may be written as the single matrix equation:
f k ( x i ) = [ X 1 ' X n ' ] k = [ a 11 a 1 n a n 1 a n n ] k [ X 1 X n ]
or in the more compact form,
fk(xi) = [X’]k = Mk[X]
where [X] is a column vector (a nx1 matrix) of the coordinates of X in the canonical basis of ℜn and Mk the kth power of the matrix M of the molecular pseudograph (map’s matrix).
It should also be noted that this approach is rather similar to the LCAO-MO (Linear Combinations of Atomic Orbitals-Molecular Orbitals) method. Reality, the approach (for k = 1) is a quite similar approximation to the extended Hückel MO method, due to the formalism each MO ψi is composed of n valence AOs of atoms in a molecule.
The main idea of the LCAO-MO method is that the electrons in a molecule are accommodated in definite MOs just as in an atom where they are accommodated in definite AOs. Normally MOs made up as LCAO of atoms composing the system, i.e. are written in the form,
ψ i = j = 1 n c i j φ j
where i is the number of the MO ψ [in our case, f1(xi)]; j are the numbers of atomic ϕ–orbitals (in our case, Xj); and cij (in our case, 1aij) are the numerical coefficients defining the contributions of individuals AOs into the given MO. Such a way of constructing a MO is based on the assumption that an atom represented by a definite set of orbitals remains distinctive in the molecule.
Table 1. Definition and Calculation of Total (whole-molecule) and Local (Atom) Linear Indices of the Molecular Pseudograph’s Atom Adjacency Matrix of the 2-Aminobenzaldehyde Molecule.
Molecules 09 01100 i002
2-Amino-benzaldehyde
MolecularStructure
Molecules 09 01100 i003
Molecular Pseudograph (G)
(hydrogen suppressed-pseudograph)
X = [O1, C2, C3, C4, C5, C6, C7, C8, N9]
Molecular Vector: X∈ℜ9
In the definition of the X, as molecular vector, the chemical symbol of the element is used to indicate the corresponding electronegativity value. That is: if we write O it means χ(O), oxygen Mulliken electronegativity or some atomic property, which characterizes each atom in the molecule. Therefore, if we use the canonical basis of 9, the coordinates of any vector X coincide with the components of that molecular vector
[X] = [3.17, 2.63, 2.63, 2.63, 2.63, 2.63, 2.63, 2.63, 2.33]
[X]: column vector of coordinates of X in the Canonical base of R9 (a nx1 matrix)
Molecules 09 01100 i004 Molecules 09 01100 i005
Atom linear indices of first order is a linear map; f1(xi): ℜn→ ℜn such that,
f1(O1, C2, C3, C4, C5, C6, C7, C8, N9) = (2C2, 2O1+1C3, 1C2 +1C3+1C4+1C8, 1C3+1C4+1C5, 1C4+1C5+1C6, 1C5+1C6+1C7, 1C6+1C7+1C8, 1C3+1C7+1C8+1N9, 1C8) = (5.26, 8.97, 10.52, 7.89, 7.89, 7.89, 7.89, 10.22, 2.63) and whole-molecule linear indices of first order is a linear functional;
Molecules 09 01100 i006=f1(O1) + f1(C2) + f1(C3) + f1(C4) + f1(C5) + f1(C6) + f1(C7) + f1(C8) + f1(N9)= 69.16
Local and total linear indices of order 0-5 (k = 0-5)
Atom (i)f0(xi)f1(xi)f2(xi)f3(xi)f4(xi)f5(xi)
O13.175.2617.9442.08146.96400.72
C22.638.9721.0473.48200.36676.25
C32.6310.5237.6116.2382.331193.57
C42.637.8926.387.57277.41894.29
C52.637.8923.6773.64234.55739.87
C62.637.8923.6773.34227.91721.81
C72.637.892680.93259.35820.73
C82.6310.2231.26105.08333.471080.23
N92.332.6310.2231.26105.08333.47
Total23.9169.16217.7683.582167.426860.94
It is useful to perform a calculation on a molecule to illustrate the steps in the procedure. For this, we use the 2-aminobenzaldehyde molecule. Table 1 depicts the calculation of the linear indices of the molecular pseudograph’s atom adjacency matrix for 2-aminobenzaldehyde. From Table 1, we extract the X-values (Mulliken electronegativity) [24] for each atom and the molecular vector X, for encoding whole-organic molecule, is obtained. Additionally, all valence-bond electrons ( σ - and π -networks) in one step are revealed in M1 matrix. Then, the local (and total) linear indices of first-order values, f1(xi), for each atom are calculated. Nevertheless, the kth (k = 0-5) local and total values are shown at the bottom of Table 1.

Total (Whole-Molecule) Linear Indices of the “Molecular Pseudograph’s Atom (Vertex) Adjacency Matrix”

Total linear indices are a linear functions [30,31,32,33] (some mathematicians use the term linear form, which means the same as linear functional) on ℜn. That is, the kth total linear indices is a linear map from ℜn to the scalar ℜ[ fk(x): ℜn→ ℜ]. The mathematical definition of these molecular descriptors is the following:
f k ( x ) = i = 1 n f k ( x i )
where n is the number of atoms and fk(xi) are the atom’s linear indices (linear maps) obtained by Eq. 1. Then, a linear form fk(x) can be written in the matrix form,
fk(x) = [u]t [X’]k
or
fk(x) = [u]t Mk[X]
for each molecular vector X∈ℜn. [u]t is a n-dimensional unitary row vector. As can be seen, the kth total linear index is calculated by summing the local (atom) linear index of all atoms in the molecule.

Local (Atom-type) Linear Indices of the “Molecular Pseudograph’s Atom (Vertex) Adjacency Matrix”

In addition to this, atom linear indices computed for each atom in the molecule, a local-fragment (atom-type) formalism can be developed. The kth atom-type linear index of the molecular pseudograph’s atom adjacency matrix is calculated by summing the kth atom linear indices of all atoms of the same type in the molecule.
Consequently, if a molecule is partitioned in Z molecular fragments, the total linear indices can be partitioned in Z local linear indices fkL(x), L = 1, …, Z. That is to say, the total linear indices of order k can be expressed as the sum of the local linear indices of the Z fragments of the same order:
f k ( x ) = L = 1 Z f k L ( x )
In the atom-type linear indices formalism, each atom in the molecule is classified into an atom-type (fragment), such as heteroatoms, H-bonding acceptor heteroatoms (O, N and S), halogens, aliphatic carbon chain, aromatic atoms (aromatic rings), an so on. For all data sets, including those with a common molecular scaffold as well as those with very diverse structure, the kth fragment (atom-type) linear indices provide much useful information.

Methods

Data Set for QSPR/QSAR studies

In order to illustrate the possibilities of the total and local (atom and atom-type) linear indices in the QSPR/QSAR studies, we have selected the following two series to be investigated: 1) boiling point of 28 alkyl-alcohols (see Table 2) firstly studied by Kier and Hall using E-state/biomolecular encounter parameters [13] and recently by Estrada and Molina [11] using the local spectral moments of the edge adjacency matrix, and 2) a set of 34 2-furylethylene derivatives previously studied using total and local spectral moments, 2D/3D connectivity indices (vertex and edge ones) and to quantum chemical descriptors to model their partition coefficient (log P), specific rate constant (log k) and antibacterial activity. These chemicals have different substituents at position 5 of the furan ring as well as at the β position of the exocyclic double bond [38,39]. The structures of these 34 furylethylene derivatives are given in Table 3.
The 2-furylethylene compounds have been well-known as antimicrobials, antitumoral, and cytotoxic during many years [40,41,42]. The values of the log k (for nucleophilic addition of the mercaptoacetic acid) and n-octanol/water log P of these compounds have been experimentally determined and reported in the literature [38]. Table 4 and Table 5 depict theses values, respectively. The antibacterial activity of these compounds was determined as the inverse of the concentration C that produces 50% of growth inhibition in E. coli at six different times and reported as log (1/C) [38]. This antibacterial activity was used to classify furylethylenes in two groups by Estrada and Molina [39]. The group of active compounds is composed of those compounds having values of log (1/C) < 3, while the rest formed group of inactive compounds. Table 6 illustrates the classification of 2-furylethylene derivatives as antibacterial according to this experimental cutoff value. This Table also depicts the antibacterial activity of a series of nine new 2-furylethylenes using by Estrada and Molina [39] like external prediction (test) set. These compounds have a NO2 group at position R3 and a Br or I at positions R1 and/or R2. All these compounds were shown to have antibacterial activity in different assays [42,43]. The structures of these compounds are given at bottom of the Table 3.

Computational Methods: TOMOCOMD-CARDD Approach

TOMOCOMD is an interactive program for molecular design and bioinformatics research [14]. It is a composite by four subprograms, each one of them allows one to draw the structures (drawing mode) and to calculate molecular 2D and 3D structures (calculation mode).The modules are named CARDD (Computed-Aided ‘Rational’ Drug Design), CAMPS (Computed-Aided Modeling in Protein Science), CANAR (Computed-Aided Nucleic Acid Research) and CABPD (Computed-Aided Bio-Polymers Docking). In this paper we outline the salient features of only one of these subprograms: CARDD. This subprogram was developed based on a user-friendly philosophy.
The calculation of total and local linear indices for any organic molecule was implemented in the TOMOCOMD-CARDD software [14]. The main steps for the application of this method in QSAR/QSPR can be briefly resumed as follows:
  • Draw the molecular pseudograph for each molecule of the data set, using the software drawing mode. This procedure is performed by selection of the active atom symbol belonging to different groups of the periodic table,
  • Use appropriate weights in order to differentiate the molecular atoms. In this work, we used as atomic property the Mulliken electronegativity [24] for each kind of atom,
  • Compute the total and local linear indices of the molecular pseudograph’s atom adjacency matrix. They can be carried out in the software calculation mode, where you can select the atomic properties and the family descriptor previously to calculate the molecular indices. This software generates a table in which the rows correspond to the compounds and columns correspond to the total and local linear indices or other family molecular descriptors implemented in this program,
  • Find a QSPR/QSAR equation by using mathematical techniques, such as multilinear regression analysis (MRA), Neural Networks (NN), Linear Discrimination Analysis (LDA), and so on. That is to say, we can find a quantitative relation between a property P and the linear indices having, for instance, the following appearance,
    P = a0f0(x) + a1f1(x) + a2f2(x) +….+ akfk(x) + c
    where P is the measurement of the property, fk(x) is the kth total linear indices, and the ak’s are the coefficients obtained by the linear regression analysis.
  • Test the robustness and predictive power of the QSPR/QSAR equation by using internal and external cross-validation techniques,
  • Develop a structural interpretation of obtained QSAR/QSPR model using total and local (atom and atom-type) linear indices as molecular descriptors.

Statistical Analysis

In describing Bp, log k, and log P the multiple linear regression analysis was used as statistical method. This experiment was performed with STATISTICA software package [44]. The tolerance parameter (proportion of variance that is unique to the respective variable) used was the default value for minimum acceptable tolerance, which is 0.01. Forward stepwise was fixed as the strategy for variable selection. The principle of parsimony (Occam's razor) was taken into account as strategy for model selection. In this connection, we select the model with higher statistical signification but having as few parameters (ak) as possible. The quality of the models was determined examining the regression’s statistic parameters and of the cross-validation procedures [45,46]. In this sense, the quality of models was determined by examining the regression coefficients (R), determination coefficients or squared regression coefficient (R2), Fisher-ratio’s p-level [p(F)], standard deviations of the regression (s) and the leave-one-out (LOO) press statistics (q2, scv).
On the other hand, linear discriminant analysis (LDA) was used to the classification of 34 2-furylethylene derivatives as antibacterial. This statistical analysis was performed using also STATISTICA software [44]. In order to test the quality of the discriminant function derived, we used the Wilks´ λ (U-statistic) and the Mahalanobis distance (D2). The Wilks´ λ statistical helpful to value the total discrimination and can take values between 0 (perfect discrimination) and 1 (no discrimination). The D2 indicates the separation of the respective groups. The statistical robustness and predictive power of the obtained model was assessed using an external prediction (test) set. In developing classification models the values of 1 and -1 were assigned to active and inactive compounds, respectively. To make the classification of compounds in both groups we preferred the use of the a posteriori probabilities instead of cutoff values. This is the probability that the respective case belongs to a particular group (active or inactive) and it is proportional to the Mahalanobis distance from that group centroid. In closing, the posterior probability is the probability, based on our knowledge of the values of others variables, that the respective case belongs to a particular group. An external test set of nine new compounds was used in order to assess the predictive ability of the obtained LDA model.

Results and Discussion

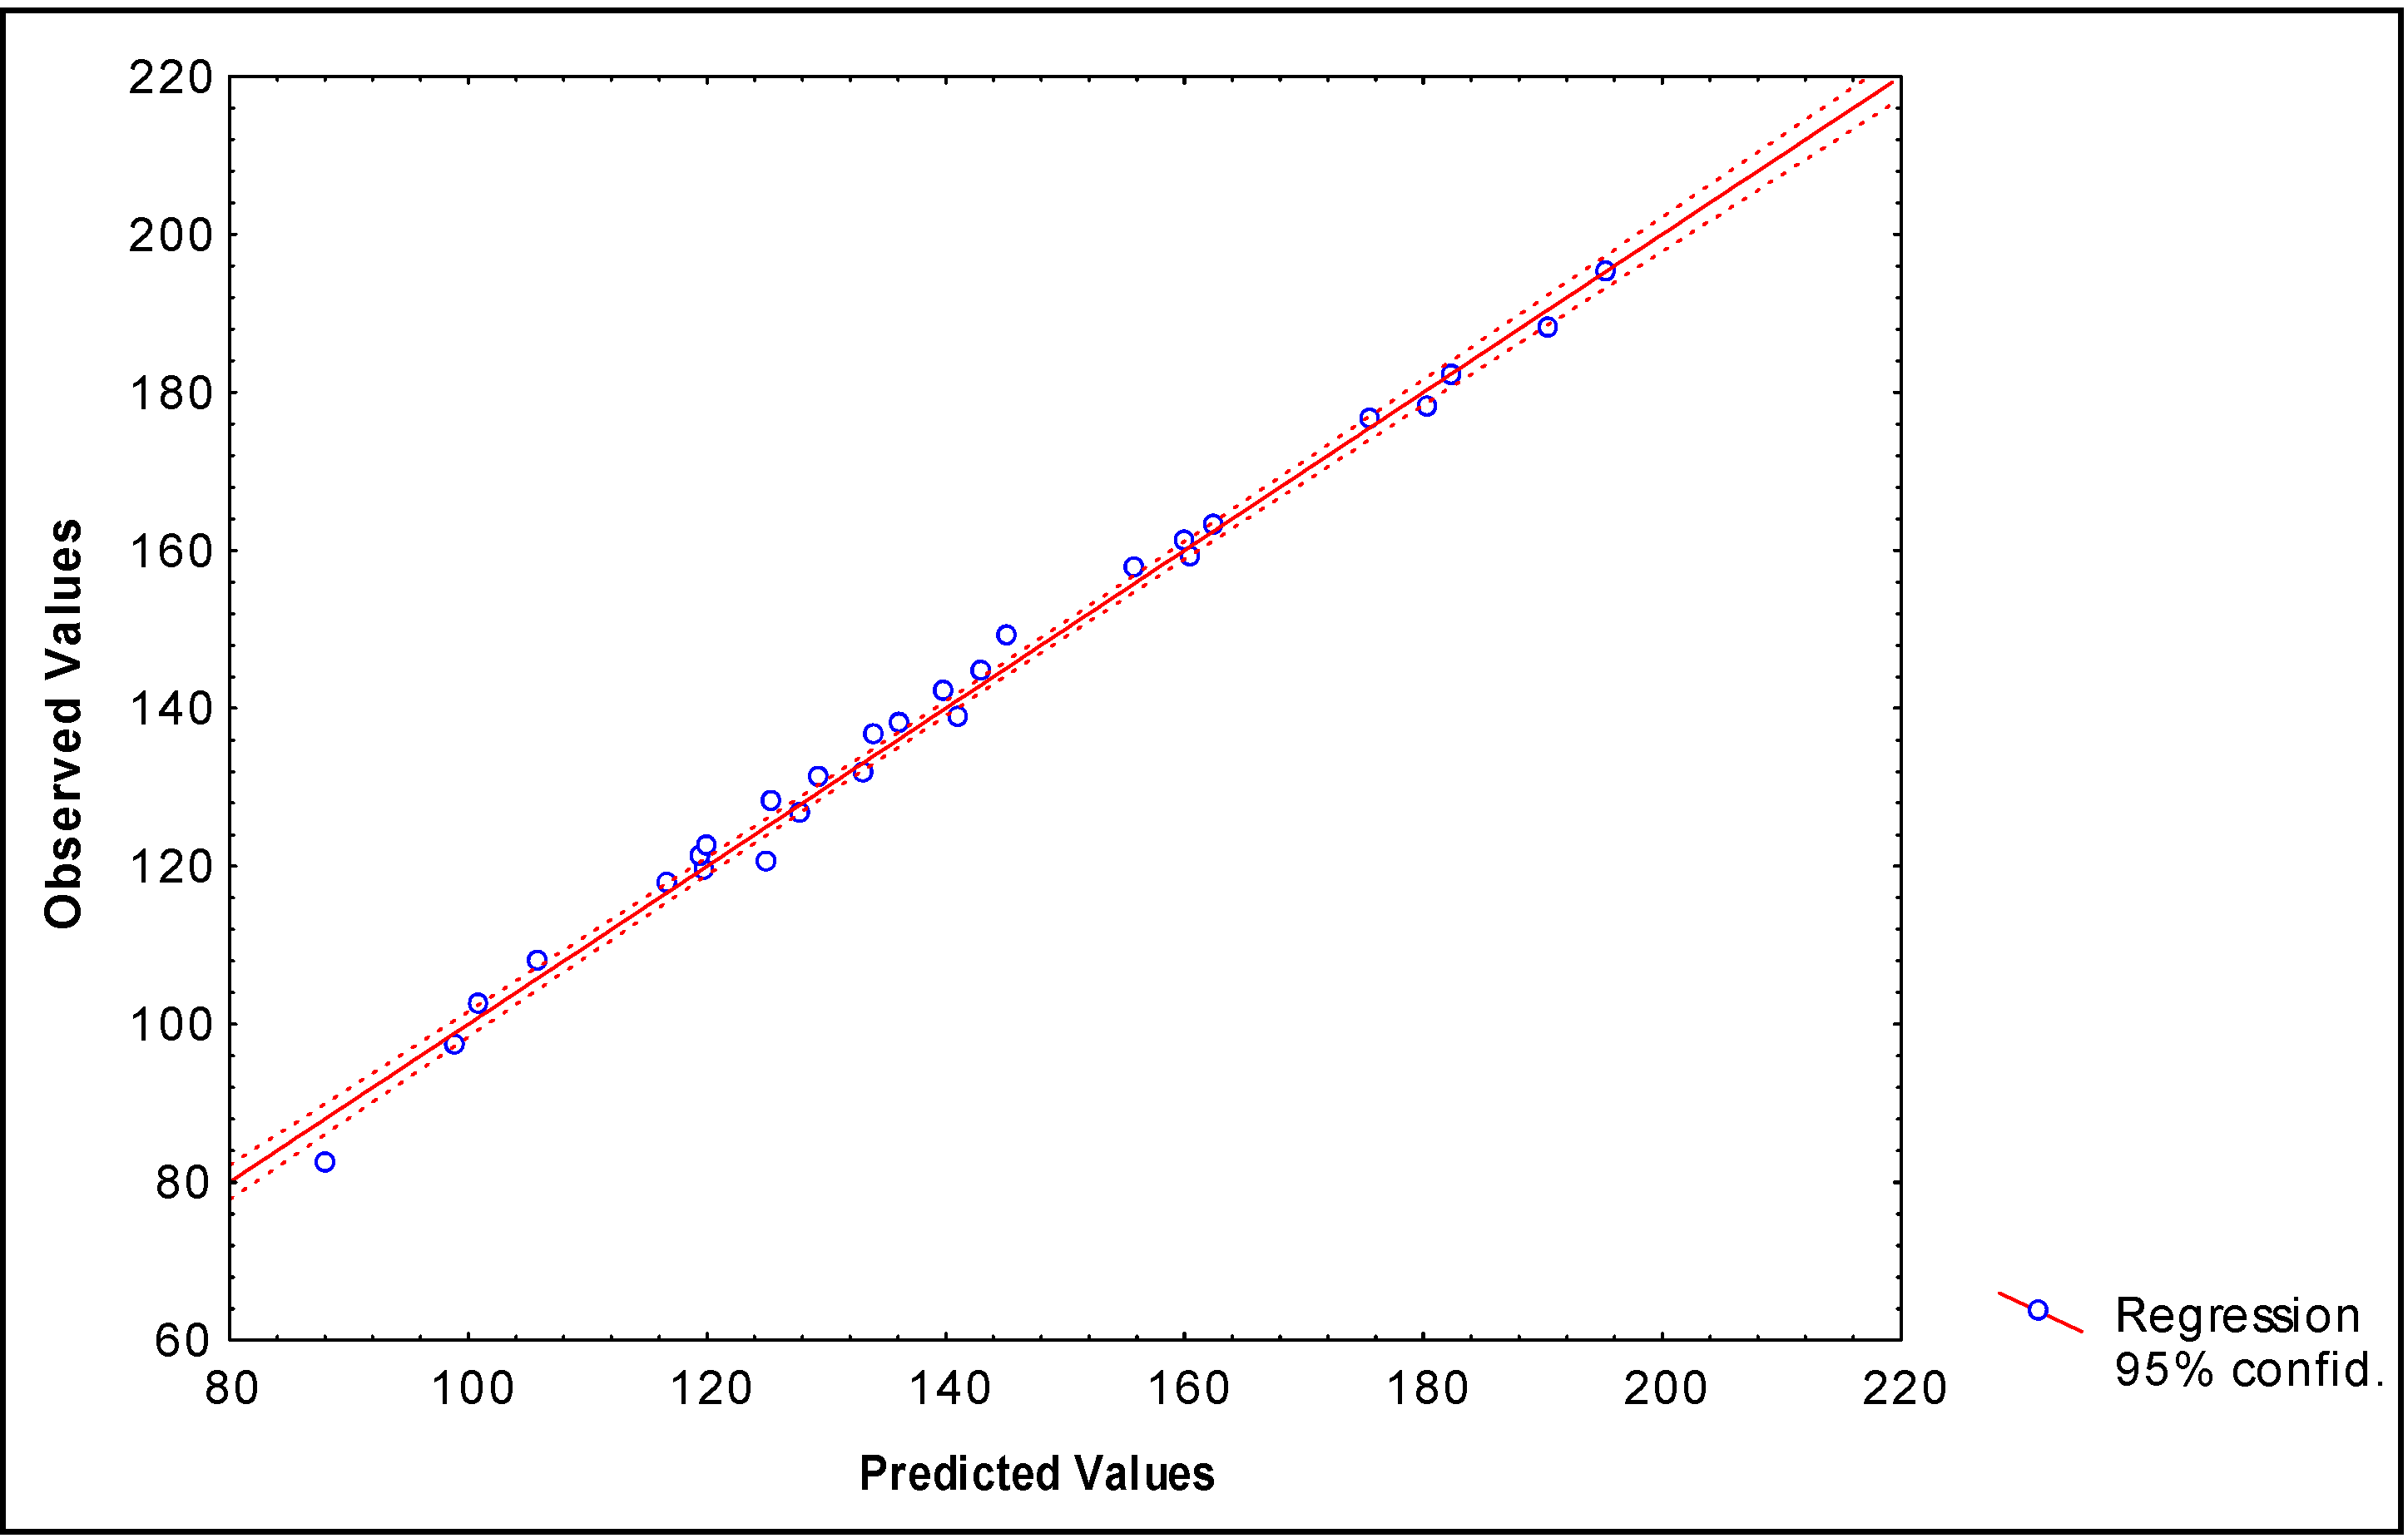
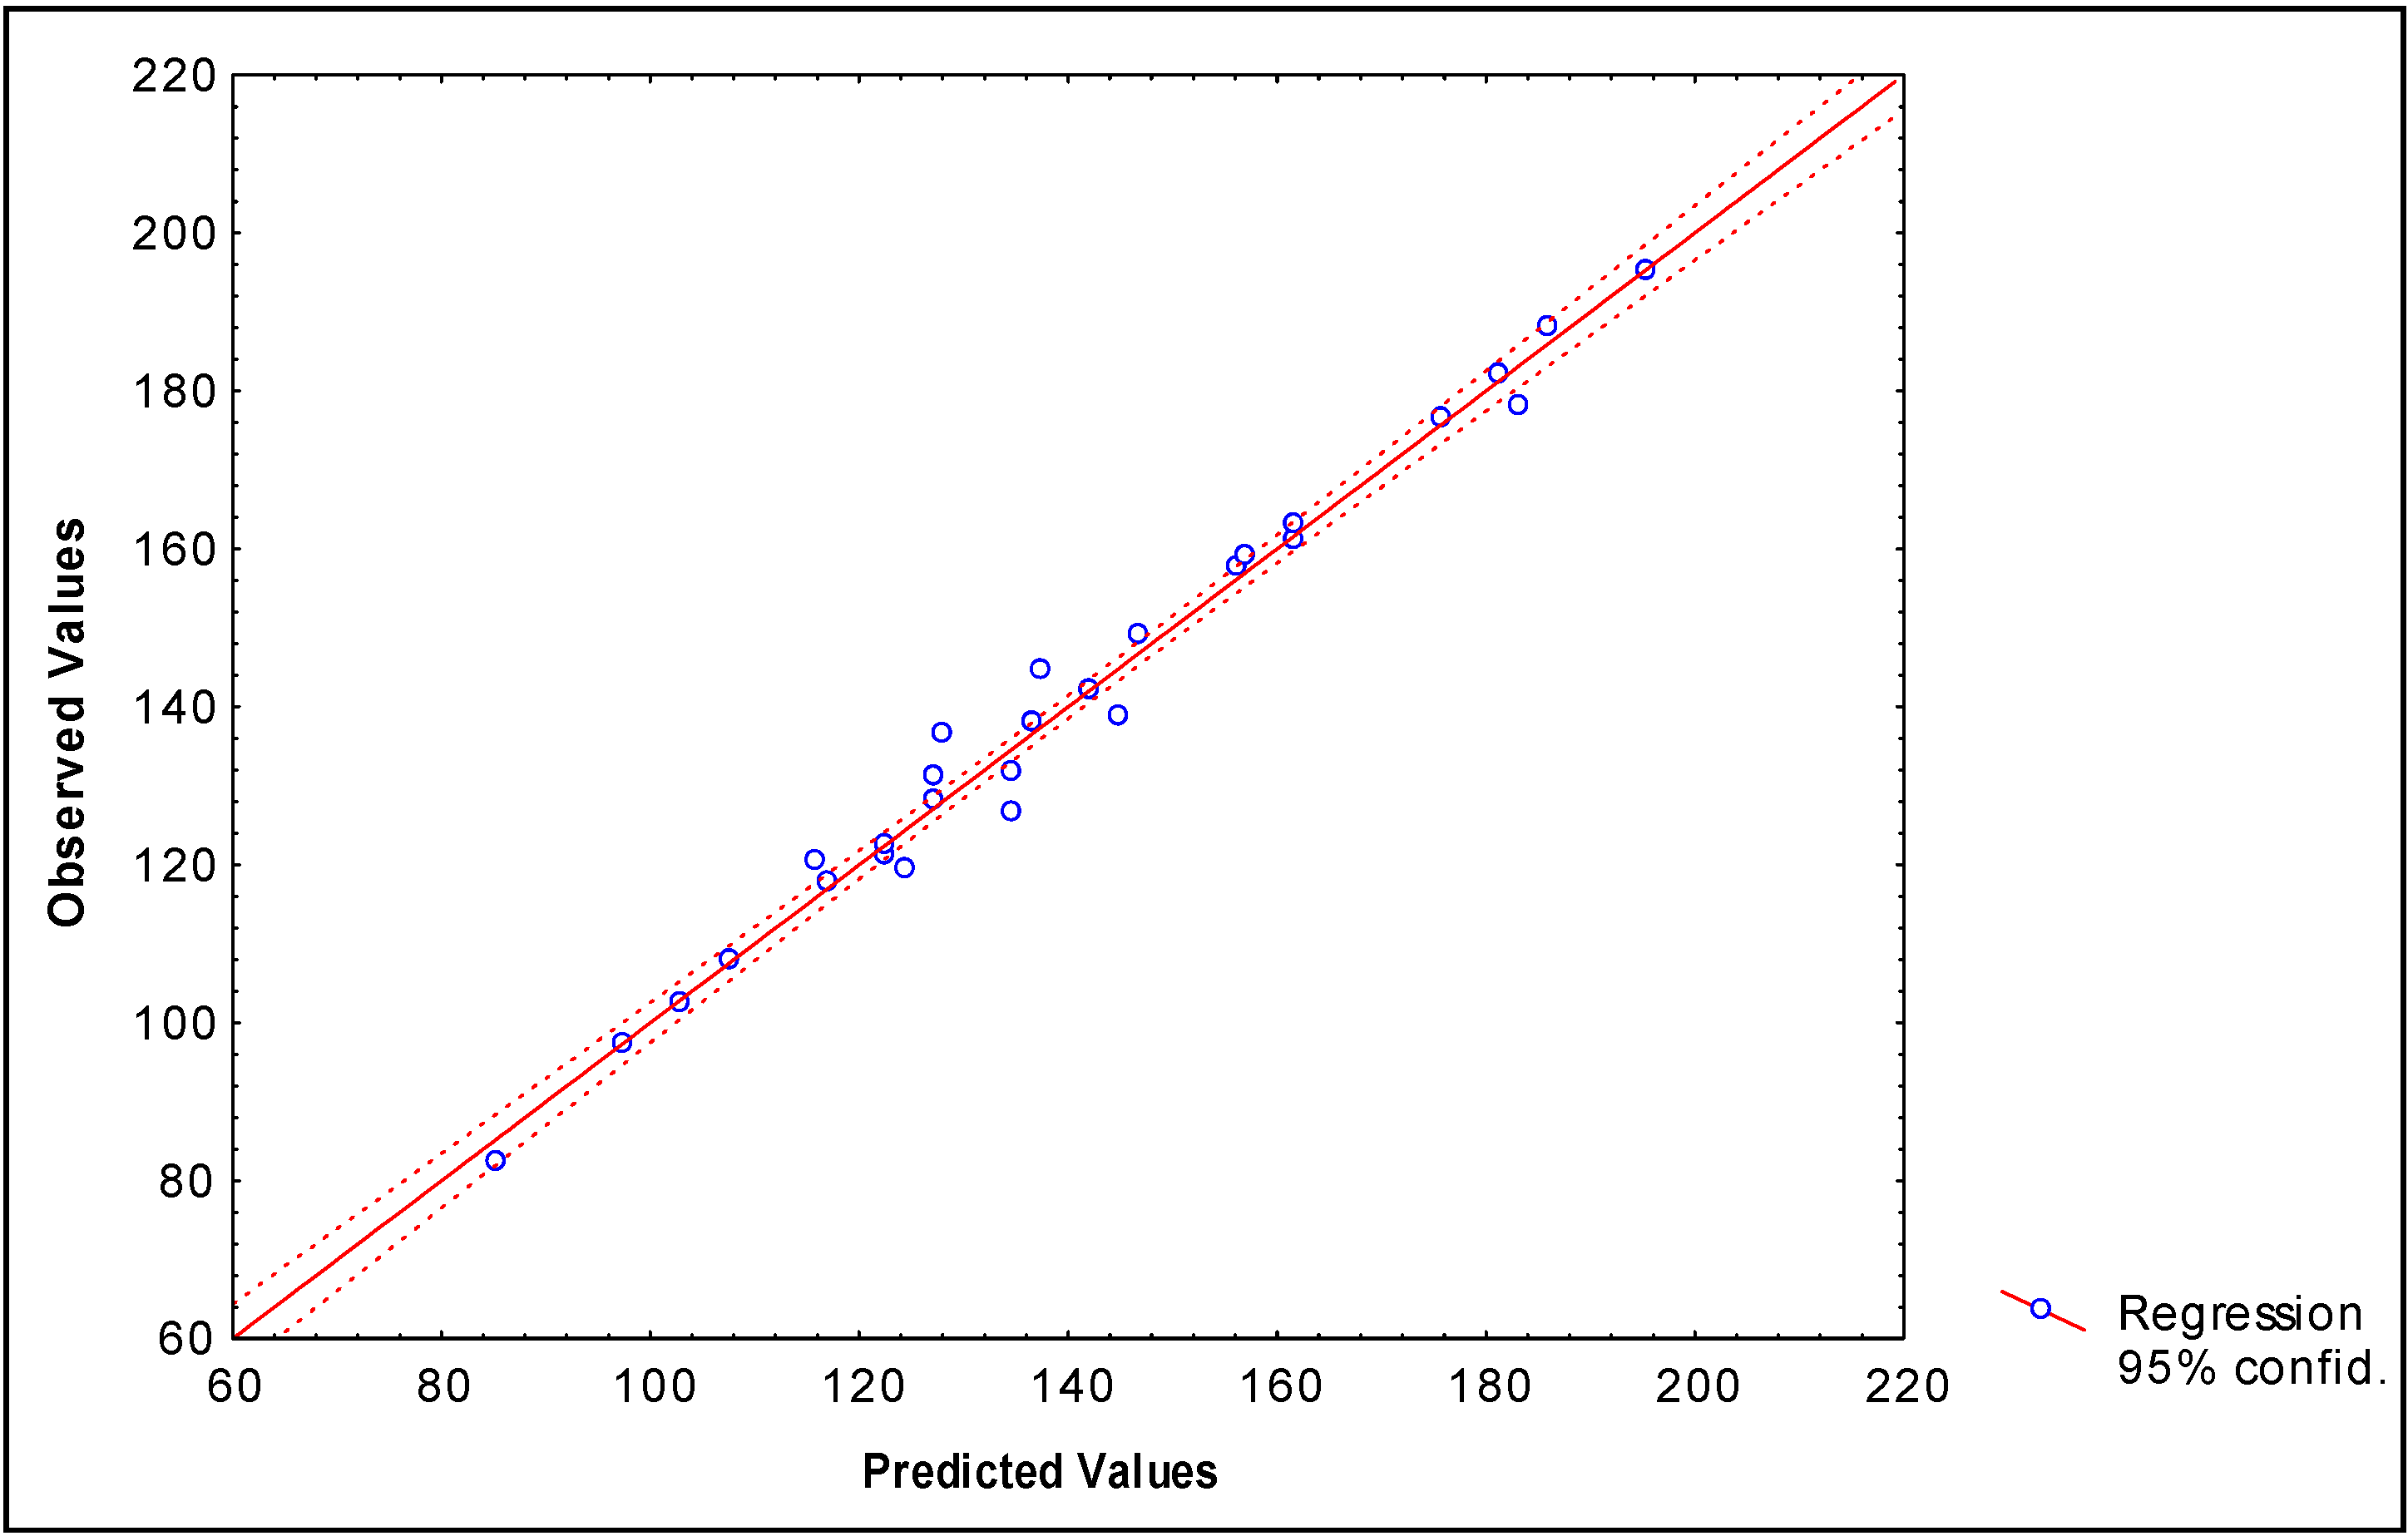
Describing boiling points of 28 alkyl alcohols

The first data set that will be studied here is composed by 28 alkyl alcohols (14 are primary, 6 secondary and 8 tertiary) for which the boiling point (Bp) has been reported previously [11]. The best linear regression model obtained to describe the Bp of these compounds using total linear indices is given below:
Bp (°C) = -145.135 (±10.853) +10.19656(±0.5680)fH2(x) -3.63852(±0.21036)fH3(x)
N = 28  R = 0.992  R² = 0.984  s = 3.78  q2 = 0.981  scv = 3.91  F (2,25) = 748.57
where, fH2(x) and fH3(x) are the total linear indices (2nd and 3rd order, respectively) calculated considering H-atoms in molecular pseudograph, and N is the number of compounds.
When a local (heteroatom) linear indices (fHL4(xO)) were included in the statistical analysis an improvement in the description of Bp was obtained:
Bp (°C) = 104.06(±9.9088) +0.2464(±0.009)fH3(x) -0.413(±0.044)f4(x)
-0.024(±0.003) f7(x) -0.9526(±0.118) f HL4(xO)
N = 28  R = 0.997  R²= 0.9934  s = 2.48  q2 = 0.990  scv = 2.79  F (4,23) = 871.96
The values of experimental and calculated values of the Bp for the data set (both models) are given in Table 2 and the linear relationships between them are illustrated in Figure 1 and Figure 2.
Table 2. Experimental and Predicted Values of the Boiling Point of Alcohols R-OH Used in This Study.
Alcohol-RBp (°C)aPredicted b Bp (°C)Predicted c Bp (°C)Predictedd Bp (°C)Predictede Bp (°C)
(CH3)2CH-82.385.488,282.991.1
CH3CH2CH2-97.297.599,096.097.4
CH3(CH2)3-117.7117.1116,8115.2113.6
CH3CH(CH3)CH2-107.8107.7106,0108.0109.0
CH3CH2C(CH3)2-102.4103.0101,0105.4112.4
CH3CH2CH2CH(CH3)-119.3124.6119,9114.4120.3
CH3CH(CH3)CH2CH2-131.1127.3129,5134.5127.4
CH3CH2CH(CH3)CH2-128.0127.3125,6127.3125.2
CH3(CH2)4-137.9136.7136,3134.3131.8
CH3C(CH3)2CH(CH3)-120.4116.0125,2129.3123.0
CH3(CH2)2C(CH3)2-121.1122.6119,6124.9128.9
(CH3CH2)2C(CH3)-122.4122.6120,2121.9126.3
CH3CH2C(CH3)2CH2-136.5128.1134,2142.5138.4
CH3CH(CH3)CH2CH(CH3)-131.6134.8133,3133.9133.4
CH3CH(CH3)CH(CH3CH2)-126.5134.8128,0121.9128.7
CH3CH(CH3)CH(CH3)CH2-144.5137.5143,1146.7138.3
CH3CH2CH2CH(CH3)CH2-149.0146.9145,3146.4143.4
CH3(CH2)5-157.6156.3155,9153.4169.8
(CH3CH(CH3))2CH-138.7145.0141,2136.4139.0
CH3CH(CH3)CH2CH(CH3)CH2-159.0157.1160,7165.5157.7
(CH3CH2)3C-142.0142.2140,0138.6138.5
CH3(CH2)6-176.4175.9175,7172.5172.2
(CH3CH2CH2)2(CH3)C-161.0161.8160,1160.9161.3
(CH3(CH2)3)(CH3CH2)(CH3)C-163.0161.8162,6160.5162.7
CH3CH(CH3)CH2(CH2)4-188.0186.1190,6191.6188.3
CH3(CH2)7-195.1195.5195,5191.6193.0
CH3(CH2)5C(CH3)2-178.0183.3180,5182.2188.4
(CH3CH2CH2)2(CH3CH2)C-182.0181.4182,5177.6177.0
aExperimental values of Bp. bPredicted values using total linear indices (Eq. 12). cPredicted values using total and local linear indices (Eq. 13). dPredicted values using spectral moments (Eq. 14). ePredicted values using E-state (Eq. 15).
These models (Eqs. 12 and 13) explain more than 98% and 99% of the variance of the experimental Bp values, respectively. Similar equations were reported by Estrada and Molina [11] and Kier and Hall [13] using spectral moment and E-state/ biomolecular encounter parameters as molecular descriptors, respectively. These equations are given bellow with their statistical parameters:
Bp (°C) = 96.555 +19.093n42.428µ2(C–O) +29.451µ3(C–O) –7.755µ4(C–O)
+0.0018µ8(C–O)
N = 28  R2 = 0.982  s = 4.2  F = 23.8
Bp (°C) = 198.02(±25.29) +0.08(±0.031) (H_H2) +4.602(±0.49) (H_O)
-22.413(±3.85)S(-OH)
N = 28  R2 = 0.926  s = 5.8  F = 204
where, n is a number of carbon atoms in the molecule, µk(C–O) are the kth spectral moment for C-O bond [11] and H_H2, H_O, S(-OH) are values of biomolecular encounter parameters and E-state, respectively [13].
These models (Eqs. 14 and 15) explain more than 98% and 92% of the variance of the experimental Bp values, respectively.
Predictability and stability of the obtained models using linear indices (Eqs. 12 and 13) to data variation is carried out here by means of LOO cross-validation. These models showed a cross-validation regression coefficient of 0.981 and 0.990 respectively.
Unfortunately, the authors (Estrada and Molina [11], and Kier and Hall [13]) do not report the result of the cross-validation. It is remarkable that one of our models (Eq 12) uses three variables less than the model obtained by Estrada and Molina [11] (Eq 14) and one variable less than the model obtained by Kier and Hall [13] (Eq 15). However, Eq. 12 explains a greater percent of the variance of the experimental Bp values than that the previously developed models do [11,13].
Figure 1. Correlation between experimental and calculated (by Eq. 12) Boiling point of 28 alcohols of the data set.
Molecules 09 01100 g001
Figure 2. Correlation between experimental and calculated (by Eq. 13) Boiling point of 28 alcohols of the data set.
Molecules 09 01100 g002

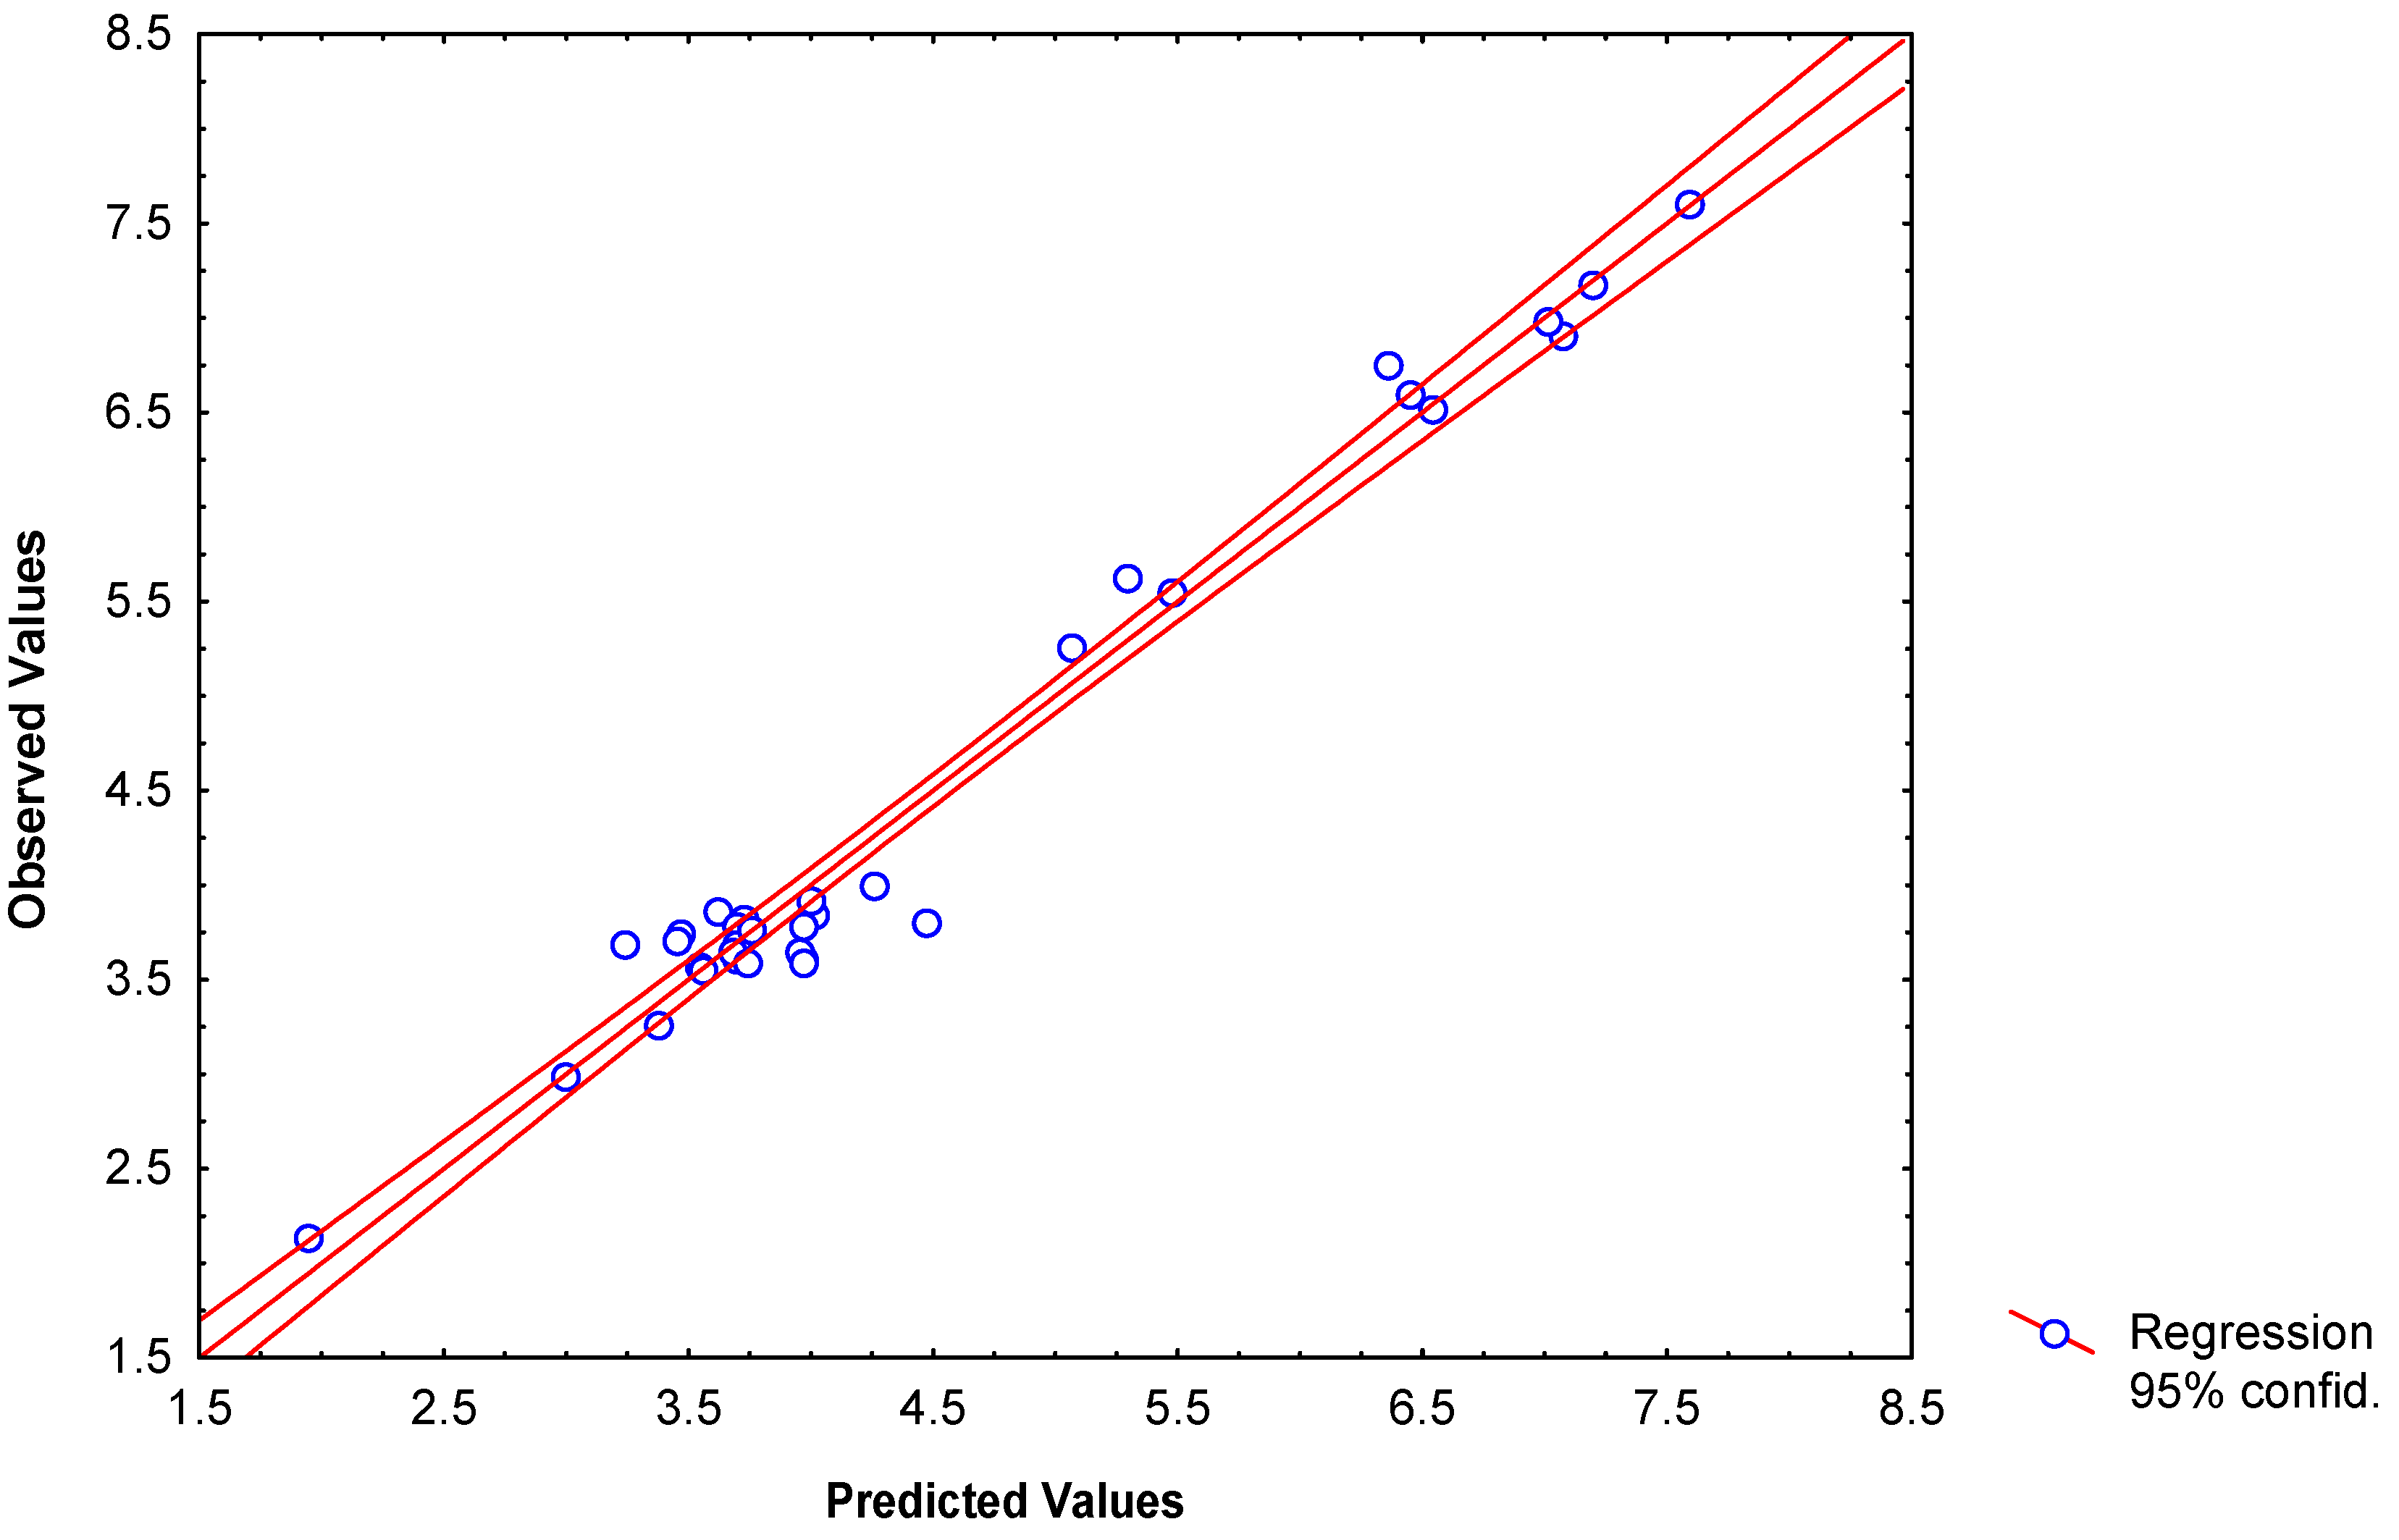
Modeling specific rate constants (log k) of 34 2-furylethylenes derivatives

Many topological descriptors are not useful to describe chemical reactions [11]. In order to prove the applicability of this new approach in the QSR(Reactivity)R studies, we select a data set of 34 derivatives of 2-furylethylene. The molecular structures of such compounds are depicted in Table 3.
Table 3. Chemical structures and numbering of atoms in the 2-furylethylene compounds used in this study.
Molecules 09 01100 i007
no.R1R2R3no.R1R2R3
1HNO2COOCH318NO2HCONHCH(CH3)C2H5
2CH3NO2COOCH319NO2HCONHC(CH3)3
3BrNO2COOCH320NO2HCONHCH2C(CH3)3
4INO2COOCH321NO2HCOOCH3
5COOCH3NO2COOCH322NO2HCOOC2H5
6NO2NO2COOCH323NO2HCOO(CH2)2CH3
7NO2COOC2H5COOC2H524NO2HCOOCH(CH3)2
8NO2HNO225NO2HCOO(CH2)3CH3
9HHNO226NO2HCOOCH2CH(CH3)2
10NO2HCONH227NO2HCOOCH(CH3)C2H5
11NO2HCONHCH328NO2HCOOC(CH3)3
12NO2HCON(CH3)229NO2HCOO(CH2)4CH3
13NO2HCONHC2H530NO2HBr
14NO2HCONH(CH2)2CH331NO2HCN
15NO2HCONHCH(CH3)232NO2HOCH3
16NO2HCONH(CH2)3CH333NO2HH
17NO2HCONHCH2CH(CH3)234NO2CNCOOCH3
Novel R1,R2-Substituted 2-Furylethylenes (R3 = NO2) used as external test set to assess the predictive power of the classification model for antibacterial activity
1BrBrNO26HINO2
2IINO27HCH3NO2
3BrHNO28BrCH3NO2
4HBrNO29ICH3NO2
5IHNO2
These compounds were studied by Estrada y Molina [11] to describe the specific rate constant k of nucleophilic addition of the mercaptoacetic acid using their total and local spectral moments, connectivity indices and quantum chemical local descriptors. All developed models had seven variables.
Table 4. Experimental and calculated values of the specific rate constant for the reaction of nucleophilic addition of thiols (log k) to the exocyclic double bond of the studied 2-furylethylenes
NumberExperimentalTIsTotal
moments
QCLocal
moments
Linear indices
16.5917.5326.2816.7806.6796.441
26.5186.9835.5836.6466.5636.540
36.9146.3526.8937.0216.9797.075
46.9826.9976.5546.9357.0697.015
57.1766.7507.3907.1377.2917.188
67.6026.6857.4107.4667.5727.589
75.2555.5335.0025.2124.9345.063
86.7634.9655.9626.7376.6626.353
95.6234.9974.8395.4545.5995.292
103.8134.8314.4553.6954.3184.468
113.8403.6364.8763.6164.0344.005
123.8744.1622.9113.5373.4483.610
133.8253.9164.2553.5623.8753.722
143.6233.7984.0323.5503.8413.698
153.7513.5283.2553.5223.7213.461
163.7843.1143.4373.5663.8423.693
173.6974.1753.4683.5703.8263.684
183.7053.9343.1573.5413.7113.443
193.6973.2643.6863.4823.7983.227
203.6503.5264.2693.5813.8513.683
214.0003.6935.1843.9853.7354.259
223.9203.9744.2023.9203.6173.993
233.7903.8564.4093.9263.5963.970
243.7633.8693.4383.8493.5523.749
253.6233.1723.8933.9213.6003.965
263.6504.2334.1783.9173.6103.957
273.5924.1933.6133.8733.5663.732
283.5844.0593.5963.8193.8813.532
293.5903.4783.2043.9183.6003.968
302.9873.4633.5343.2812.7852.997
313.2733.0703.7794.0893.6513.370
322.1403.0702.7942.2872.7511.941
333.5533.7802.7163.3383.4853.558
345.5575.1145.4744.9695.5245.465
The model obtained by these authors using the connectivity indices describes an 82% of the experimental values of log k, with a standard deviation of 0.681. In addition, these researchers obtained similar results using the global spectral moments as molecular descriptors in QSRR equation (R2 = 84% and s = 0.655) [11]. The use of local molecular descriptors such as quantum chemical or graph-theoretical (local spectral moments) produces a significant improvement in the statistical quality of the obtained models. In this sense, both models (quantum chemical and local spectral moments) explain more than 96% (96.8% and 96.4%) of the variance of the log k, with a standard deviation of 0.288 and 0.320, respectively.
The molecular descriptors included in these equations clearly pointed to the identification of the reaction centers involved in the studied chemical interaction. That is to say, the molecular indices calculated for the atoms 2, 6 and 7 or for the bonds defined by these atoms (C2-C6 and C6-C7) were included in the obtained models. These atoms are those involved in the exocyclic double bond of the 2-furylethylene and these are the “target” of the nucleophilic attack by thiol (mercapto) group.
Taking into account this logical result, we calculated the kth local linear indices for the atoms C2, C6 and C7 (bonds C2-C6 and C6-C7). The best obtained model, using these local linear indices as molecular descriptors, together with its statistical parameters is given below:
log k = 231.464(±14.586) -0.00183(±0.0008)f6(xC2-C6) -4.6054(±0.3103)fH2(xC2-C6)
-0.00107(±8.92x10⁻⁵)fH8(xC2-C6) +0.225923(±0.02621)fH4(xC2-C6)
+3.85x10⁻⁶(±4.53x10⁻⁷)f12(xC2-C6) +0.05(±0.0076)fH2(xC6-C7)
N = 34  R = 0.986  R² = 0.973  s = 0.26  q2 = 0.948  scv = 0.33  F(6,27) = 161.22
Note, that our model (Eq. 16) included only six variables (one less than the models object of comparison) and explained more than 97% of the variance (s = 0.26). These statistics are slightly better than those obtained previously.
Figure 3. Observed versus predicted log k of the specific rate constant for the reaction of nucleophilic addition of thiols to the exocyclic double bond of the 2-furylethylene derivatives.
Molecules 09 01100 g003
Table 4 depicts the experimental and calculated values of reactivity index (log k) from connectivity indices, total and local spectral moments, quantum chemical indices and local linear indices. Plots of observed versus calculated log k for data set of compounds are illustrated in Figure 3.

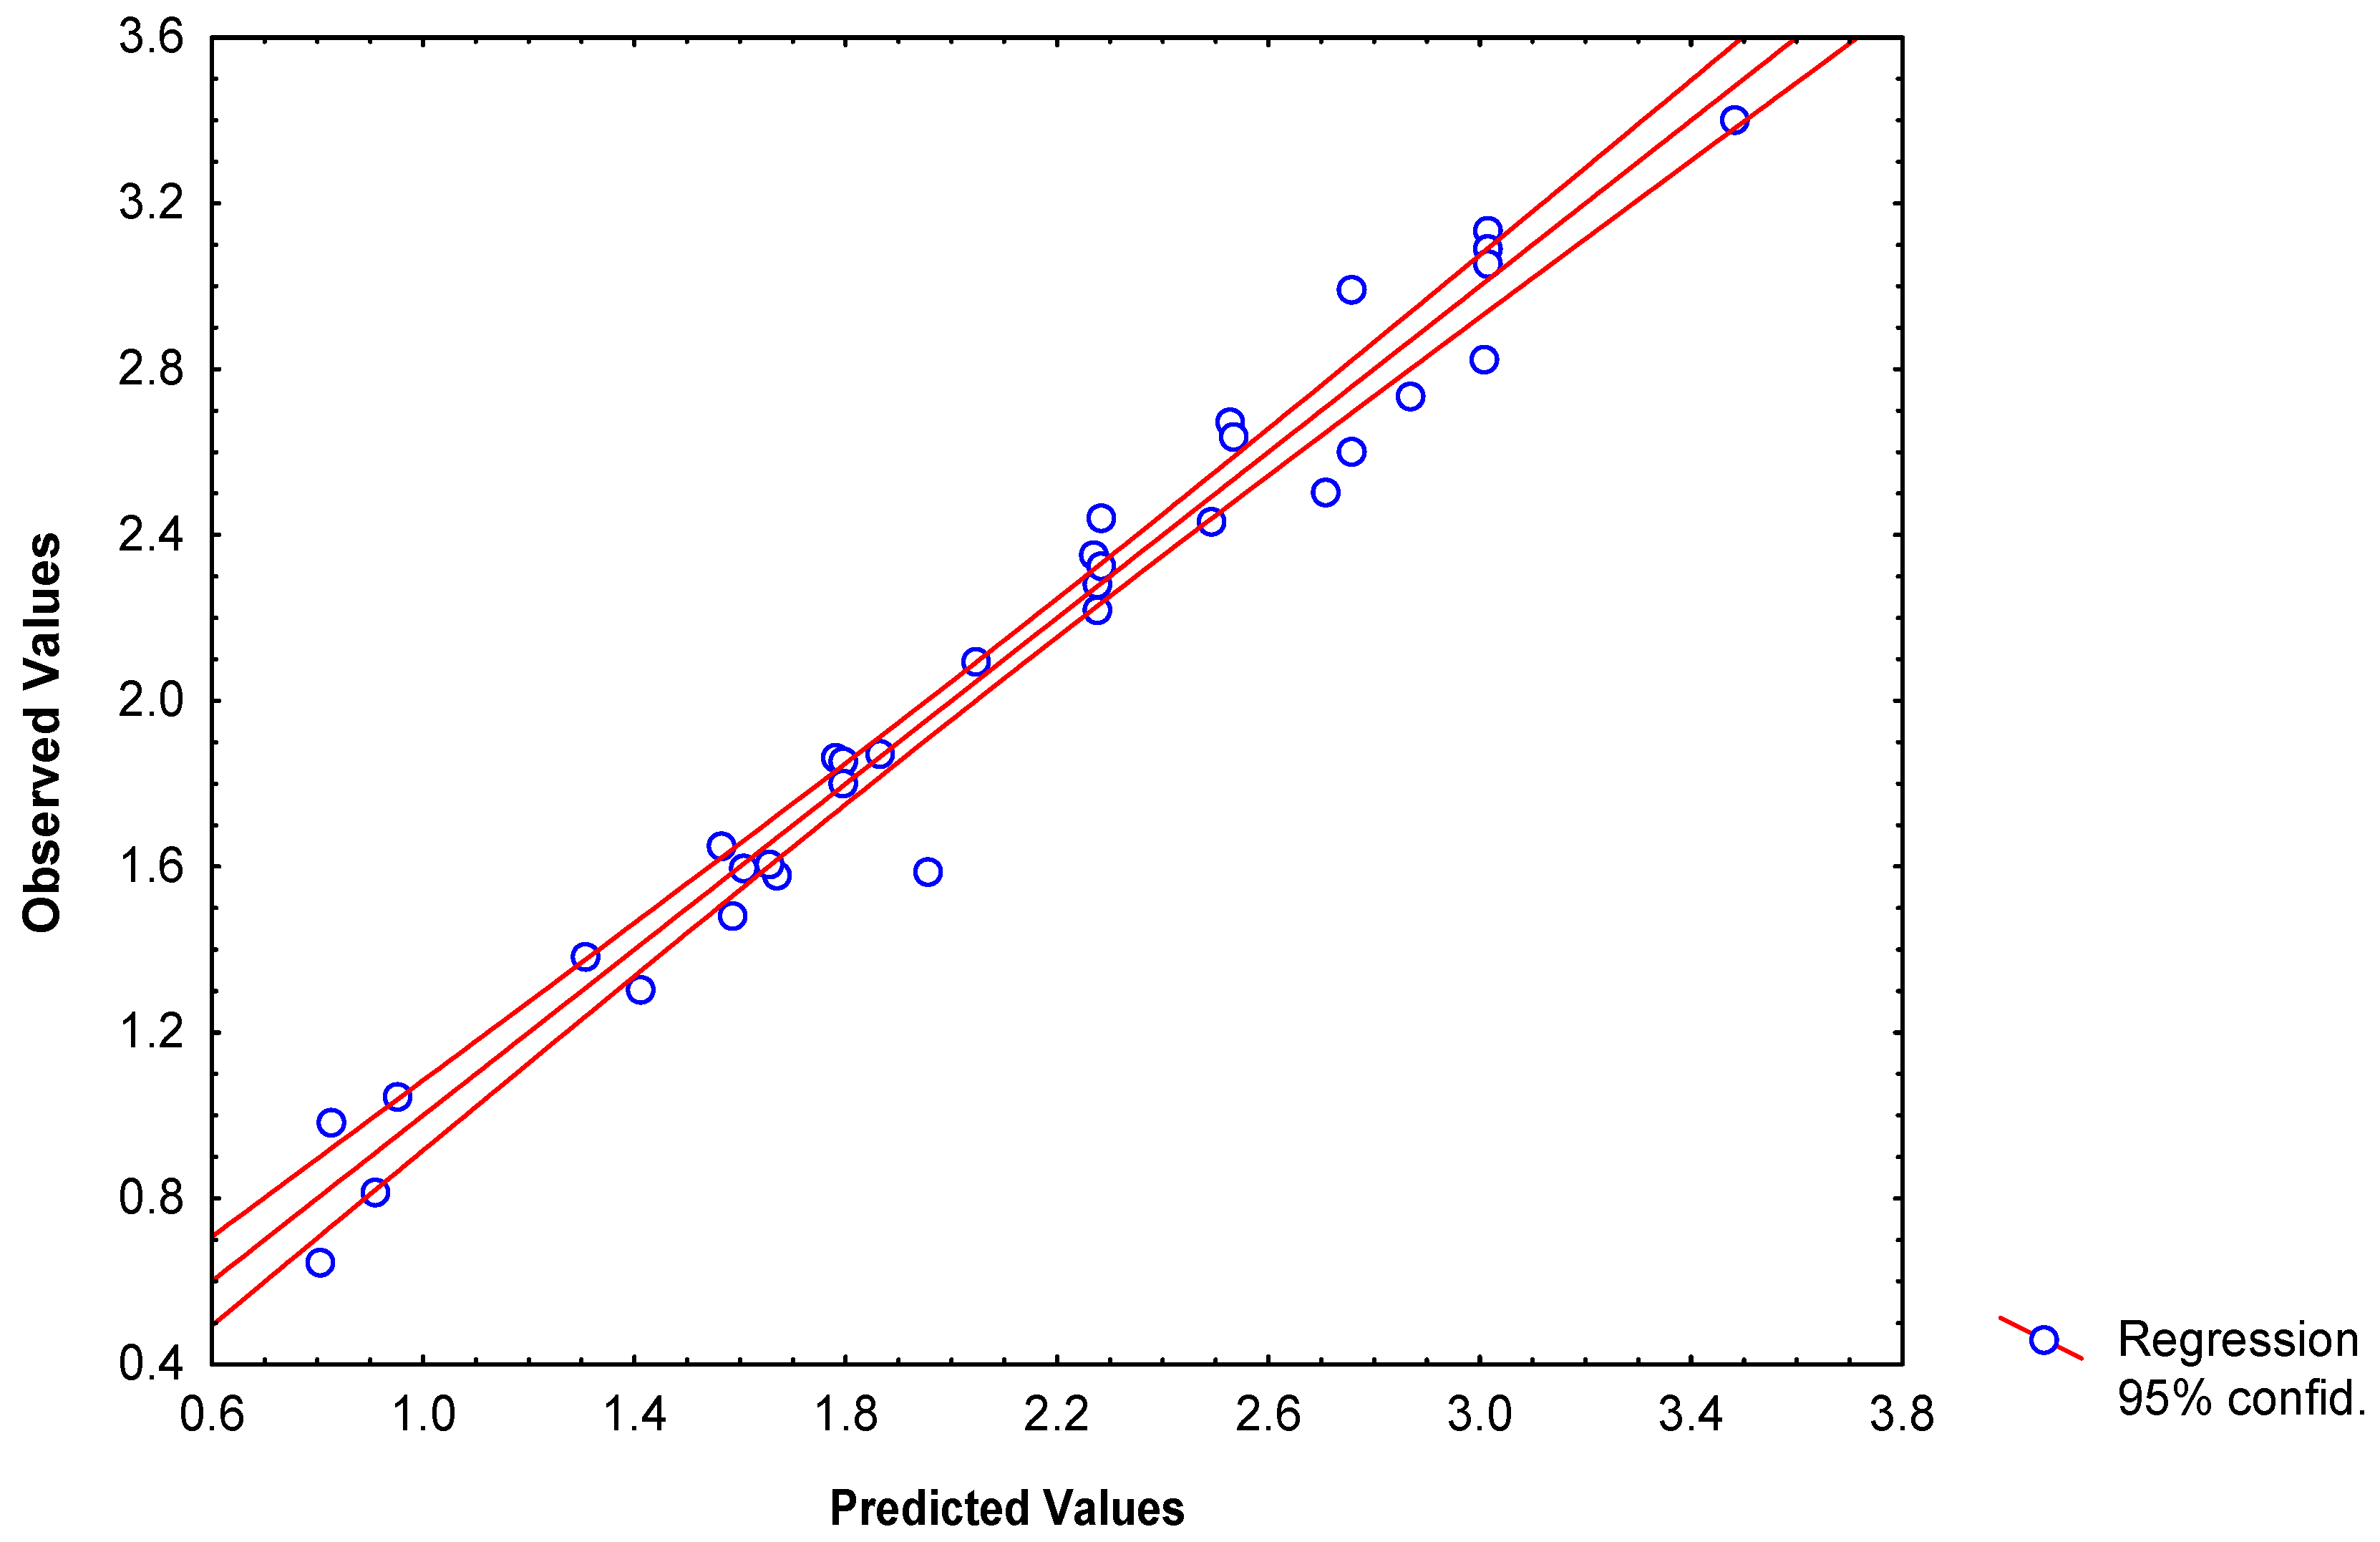
Modeling partition coefficients (log P) of 34 2-furylethylenes derivatives

It has been clear from structure-activity relationship studies that the lipophilicity of 2-furylethylenes derivatives is critical for the development of their antibacterial activity [38]. The partition coefficient n-octanol/water (log P) has an important role in the understanding of the biological behavior of these 2-furylethylene derivatives [38]. Consequently, we will study this parameter to compare the possibilities of molecular linear indices in QSPR and to compare this result to those obtained by Estrada and Molina [39] using 2D and 3D (topographic) connectivity indices (vertex and edge ones), and quantum chemical descriptors.
The best obtained model, using total and local linear indices as molecular descriptors, together with its statistical parameters is given below:
log P = -3.184(±0.488) +0.067(±0.002) fH0(x) +0.77659(±0.058) fHL0(xE)
-0.1576(±0.012)fHL2(xE) +0.00915(±0.0022) fHL3(xE) -0.069(±0.007)fHL2(xE-H)
+0.0026(±0.0007)fHL3(xC6-C7) +3.511x10⁻⁶(±6.23x10⁻⁶)fHL3(xC6-C7)
N = 34  R = 0.984  R² = 0.968  s = 0.143  q2 = 0.938  scv = 0.176  F(7,26) = 113.38
This equation explained 96.8% of the variance of both log P. This statistic is lightly better than those obtained previously [39]. The experimental and calculated values of log P obtained with 2D and 3D connectivity indices, quantum chemical descriptors, total and local spectral moments as well as molecular linear indices are show in Table 5. Plots of observed versus calculated log P according to the Eq. 17 are illustrated in Figure 4.
Finally, LOO cross-validation procedure was used in order to assess the predictive ability of developed model (17). Using this approach, the model 17 had a LOO q2 of 0.938. This value of q2 (q2 > 0.5) can be considered as a proof of the high predictive ability of the models [44,45,46,47]. In this sense, the equations obtained with the vertex and edge connectivity indices, with the topographic descriptors, and with the quantum chemical descriptors (Eqs. 10, 11, and 13 in Ref. 39) showed a smaller predictive abilities (scv of 0.247, 0.176, and 0.370, respectively) that the equation 17 (scv = 0.176), achieved with the total and local linear indices.

Classification of 34 2-furylethylene derivatives as antibacterial

Linear discriminant analysis (LDA) will be used here to obtain a classification model of 2-furyl-ethylene compounds according to their antibacterial activity. The classification model obtained is given below together with the statistical parameters of LDA:
Class = -107.731 +0.5155 fHL3(xC2-C6) -0.120 fH1(x) + 0.4099 fHL2(xE-H)
N = 34  λ = 0.304  D2 = 9.44  F(3,30) = 22.862  p<0.0000
where, λ is Wilk’s statistic, D2 is the squares of Mahalanobis distances, and F is the Fisher ratio. The statistical analysis showed that exist appropriate discriminatory power for differentiating between the two respective groups. The calculation of percentages of good classification in the data set and external prediction set permitted us to carry out the assessment of the models.
Table 5. Experimental and calculated values of the partition coefficient n-octanol/water (log P) for the furylethylenes studied.
no.Obsd.aPred.bRes.cRes-CVdtopol.etopog.fQCg
11.8791.860.020.021.8941.9551.836
22.4392.49-0.05-0.072.4822.3982.239
32.7392.86-0.13-0.202.7532.7482.405
42.9992.750.250.392.9052.8982.510
51.8691.780.090.131.7631.9301.976
61.5991.600.00-0.011.6191.5501.679
72.5042.71-0.20-0.272.7032.6402.706
81.3031.41-0.11-0.191.1911.3381.456
91.5831.67-0.09-0.121.4531.7831.583
100.6490.80-0.15-0.320.4330.3000.180
110.9840.820.160.200.9991.0911.076
120.8190.91-0.09-0.171.1600.8702.149
131.3861.310.080.091.5831.4231.482
141.8601.790.070.082.3111.9411.858
151.8031.790.010.011.9662.0841.906
162.3562.260.090.102.1682.3322.240
172.2252.27-0.05-0.052.4932.5262.241
182.2842.270.010.012.3842.3832.277
192.3332.280.060.072.3162.3162.346
202.6052.75-0.15-0.182.3822.5752.618
211.6521.560.090.101.3471.5851.830
222.0982.050.050.061.9841.9472.126
232.6732.530.150.162.7332.4592.504
242.6412.530.110.122.4842.6662.592
252.8273.00-0.18-0.192.7262.8372.902
263.1353.010.130.143.0523.0342.902
273.0913.010.080.093.0182.9522.943
283.0603.010.050.052.9943.0023.029
293.4043.48-0.07-0.093.2273.2523.266
302.4472.280.170.242.5102.4692.132
311.0500.950.100.241.3651.2581.344
321.5911.95-0.36-0.411.5101.5001.711
331.6111.65-0.04-0.071.7381.5151.590
341.4881.59-0.10-0.271.3091.4241.504
aExperimental values taken of the Ref. [39]; bPredicted values using total and local (atom and atom-type linear indices (Eq. 17); cResidual values: log P(Obsd)-log P(Pred); dResidual values of the LOO cross-validation experiment (Deleted Residual); ePredicted values using topological indices (vertex and edge connectivity indices) [39]. fPredicted values using topographic descriptors [39]. gPredicted values using quantum chemical molecular descriptors [39].
Figure 4. Linear correlations of observed versus calculated log P according to the model obtained from molecular linear indices.
Molecules 09 01100 g004
Model 18 classified correctly 94.12% of the compounds in the training data set (92.85% and 95.0% of good classification in active and inactive training data set, respectively), misclassifying only 2 compounds of a total of 34. The percentage of false actives as well as of the false inactive in this data set was only 2.94%.
The statistical analysis of three models obtained previously using 2D and 3D connectivity and quantum chemical descriptors showed quite similar results. In this case, the overall accuracy of the three models was 91.2%, 94.1%, and 88.2%, respectively [39].
The classification of all compounds in the complete training data set provides some assessment of the goodness of fit of the model, but it does not provide a thorough criterion of how the model can predict the biological properties of new compounds. To assess such predictive power, the use of an external test set is essential [45,46,47]. In this sense, the activity of the compounds in such set was predicted with the obtained discrimination function.
The overall accuracy for this group was 100.0%. Using this same external test set of nine new 2-furylethylenes, the QSAR models obtained with 2D and 3D connectivity and quantum chemical descriptors have also 100.0% of global good classification, including one NC (not-classified) compound [39]. The results of global classification of compounds in both, training and external prediction sets archived with all these approaches are shown in Table 6 (see also Table 7).
Table 6. Classification of 2-furylethylene derivatives as antibacterial according to the four models obtained with molecular linear indices, 2D and 3D connectivity as well as quantum chemical descriptors.
Compd.Obsd.[39]Linear Indices2D Conn. [39]3D Conn. [39]Quantum [39]
Class.Prob.Class.Prob.Class.Prob.Class.Prob.
1++99.99+95.43+99.49+99.72
2++99.97+91.67+95.83+99.86
3++100.00+84.95+96.22+98.31
4++100.00+79.65+95.78+97.67
5++99.58+99.72+99.63+99.66
6++99.96+99.85+99.98+98.91
7++88.62+94.29+91.77+98.57
8++90.32+74.81+57.81+92.50
9++98.47-9.86-8.11+77.08
10++99.82+99.13+99.28-32.29
11++85.96+88.24+57.28-9.46
12+-4.58+66.00+86.94-4.26
13++50.52+57.89+71.56-12.79
14--14.55-6.25-46.43-12.96
15--14.55-28.14-36.15-8.72
16--2.76-0.92-1.10-11.78
17--2.76-2.35-6.19-11.05
18--2.76-37.62-4.56-9.96
19--2.76-8.96-2.97-9.96
20--0.47-1.14-0.08-9.75
21--49.07+55.73+88.95-8.59
22--13.84-22.77-18.96-7.60
23--2.61-1.36-8.23-7.66
24--2.61-7.01-4.83-6.44
25--0.44-0.19-0.09-8.56
26--0.44-0.33-0.58-8.49
27--0.44-7.59-0.43-7.94
28--0.44-1.41-0.27-7.02
29--0.07-0.02-0.04-7.21
30--0.55-4.65-7.56-0.32
31-+52.57-29.58-37.61-3.04
32--1.05-23.67-14.96-5.30
33--0.33+58.87-14.08-0.42
34++99.69+97.13+97.50+62.36
Test set
1++99.26+88.53+95.81+87.18
2++99.04+86.87+94.59+85.53
3++98.77+59.01+65.00+54.95
4++99.07+96.35+99.59+96.12
5++98.67NC50.07+53.00NC50.01
6++98.89+96.72+99.51+97.68
7++99.99+95.92+99.62+94.76
8++99.99+86.38+96.06+84.27
9++99.99+81.75+95.74+79.29
Table 7. Statistical parameters of the QSPR/QSAR models obtained using different molecular descriptors.
indexnR2sq2sCVF
Boiling Point of 28 Alkyl-Alcohols
Linear indices (Eq. 12)20.9843.780.9813.91748.57
Linear indices (Eq. 13)40.9932.480.992.79871.96
Local spectral moments [11]50.9824.2**23.8
E-State/encounter parameters [13]30.9265.8**204
Reactivity (log k) of 34 2-Furylethylenes
Linear indices60.9730.2600.9480.33161.2
Conn. Indices [11] 70.8210.681**17.1
Global spectral moments [11]70.8430.655**18.8
Local spectral moments [11]70.9640.320**70.4
Quantum chemical descriptors [11]70.9680.288**112.2
Partition Coefficient n-Octanol/Water (log P) of 34 2-Furylethylenes
Linear indices70.9680.1430.9380.176113.38
Vertex and edge conn. Indices [39]70.9390.199*0.24756.9
Topographic descriptors [39]70.9640.155*0.17684.6
quantum chemical descriptors [39]used the Rogers and Cammarata approach 0.8750.319*0.37045.5
indexnλD2Accuracy
(Training)
Accuracy
(Test)
F
Classification of 34 2-Furylethylene Derivatives as Antibacterial
Linear indices30.309.4494.12%100%22.9
Vertex and edge conn. Indices [39]50.435.791.2%100%7.7
Topographic descriptors [39]50.386.794.1%100%9.1
quantum chemical descriptors [39]50.445.288.2%100%7.1
*Values are not reported in the literature
Finally, the improvement in the statistical parameters of our model (Eq. 18) compared to that using 2D and 3D connectivity indices as well as quantum chemical descriptors is easily detected by the decrease in the Wilk’s λ parameter and an increase in the Mahalanobis square distance (see Table 7).

Concluding Remarks

Although there have been many discoveries in the last years in the field of theoretical drug-design it is necessary to continue developing new molecular descriptors that can explain, by means of QSAR studies, different pharmacological properties of these substances. In this sense, the definition of molecular descriptors based on graph-theoretical invariants that contain important information on atoms (or bonds) in an explicit way is not only possible but also necessary [11]. In this context, total and local (atom and atom-type) linear indices of the molecular pseudograph’s atom adjacency matrix are promising total and local-level molecular descriptors.
We have shown here that total and local linear indices are useful molecular descriptors for modeling physicochemical and biological properties of organic compounds. The obtained models were statistically significant and better than other obtained previously using recognized methods (see Table 7). Taking into consideration those total and local spectral moments, connectivity indices, quantum chemical descriptors and E-state, which have been successfully applied in the QSAR/QSPR studies and drug design, the satisfactory comparative result showed that linear indices used here will be a novel chem-bioinformatic tool for the computer aided “rational” drug design (TOMOCOMD-CARDD).

Acknowledgements

Authors would like to offer our sincere thanks to the two anonymous referees for their critical opinions about the manuscript, which have significantly contributed to improving its presentation and quality. F. T. acknowledges financial support from the Spanish MCT (Plan Nacional I+D+I, Project No. BQU2001-2935-C02-01) and Generalitat Valenciana (DGEUI INF01-051, INFRA03-047 and OCYT GRUPOS03-173). Dr. Ivis Fernandez, Cuba, is acknowledged for language correction.

References

  1. Julián-Ortiz, J. V. Virtual Darwinian Drug Design: QSAR Inverse Problem, Virtual Combinatorial Chemistry, and Computational Screening. Comb. Chem. High Throughput Screen. 2001, 4, 295–310. [Google Scholar] [CrossRef] [PubMed]
  2. Dean, P.M.; Lewis, R.A. (Eds.) Molecular Diversity in Drug Design; Kluwer Academic Publishers: Amsterdam, 1999.
  3. Walters, W.P.; Stahl, M.T.; Murcko, M.A. Virtual screening: An overview. Drug Discovery Today 1998, 3, 160–178. [Google Scholar] [CrossRef]
  4. Karelson, M. Molecular Descriptors in QSAR/ QSPR; John Wiley & Sons: New York, 2000. [Google Scholar]
  5. Katritzky, A. R.; Gordeeva, E. V. Traditional Topological Indexes vs Electronic, Geometrical, and Combined Molecular Descriptors in QSAR/QSPR Research. J. Chem. Inf. Comput. Sci. 1993, 3, 835. [Google Scholar] [CrossRef]
  6. Kier, L. B.; Hall, L. H. Molecular Connectivity in Chemistry and Drug Research; Academic Press: London, 1976. [Google Scholar]
  7. Balaban, A. Topological and Stereochemical Molecular Descriptors for Databases Useful in QSAR, Similarity/Dissimilarity and Drug Design. SAR QSAR Environ. Res. 1998, 8, 1–21. [Google Scholar] [CrossRef]
  8. Estrada, E. On the Topological Sub-Structural Molecular Design (TOSS-MODE) in QSPR/QSAR and Drug Design Research. SAR QSAR Environ. Res. 2000, 11, 55–73. [Google Scholar] [CrossRef] [PubMed]
  9. Julian-Ortiz, J. V.; Gálvez, J.; Muños-Collado, C.; García- Domenech, R.; Gimeno-Cardona, C. Virtual Combinatorial Syntheses and Computational Screening of New Potential Anti-Herpes Compounds. J. Med. Chem. 1999, 42, 3308–3314. [Google Scholar]
  10. Estrada, E.; Uriarte, E. Recent Advances on the Role of Topological Indices in Drug Discovery Research. Curr. Med. Chem. 2001, 8, 1573–1588. [Google Scholar] [CrossRef] [PubMed]
  11. Estrada, E.; Molina, E. Novel Local (Fragment-Based) Topological Molecular Descriptors for QSPR/QSAR and Molecular Design. J. Mol. Graphics Mod. 2001, 20, 54–64. [Google Scholar] [CrossRef]
  12. Kier, L.B.; Hall, L.H. The electrotopological state: structure modeling for QSAR and data base analysis. In Topological Indices and Related Descriptors in QSAR and QSPR; Devillers, J., Balaban, A.T., Eds.; Gordon and Breach: Amsterdam, 1999; pp. 491–562. [Google Scholar]
  13. Kier, L.B.; Hall, L.H. MolecularStructure Description. The Electrotopological State; Academic Press: New York, 1999. [Google Scholar]
  14. Marrero-Ponce, Y.; Romero, V. TOMOCOMD software. Central University of Las Villas. 2002. TOMOCOMD (TOpological MOlecular COMputer Design) for Windows, version 1.0 is a preliminary experimental version; in the future a professional version will be available upon request from Y. Marrero: [email protected]; [email protected].
  15. Marrero-Ponce, Y. Total and Local Quadratic Indices of the Molecular Pseudograph’s Atom Adjacency Matrix: Applications to the Prediction of Physical Properties of Organic Compounds. Molecules 2003, 8, 687–726, http://www.mdpi.org. [Google Scholar]
  16. Marrero-Ponce, Y. Linear Indices of the “Molecular Pseudograph’s Atom Adjacency Matrix”: Definition, Significance-Interpretation and Application to QSAR Analysis of Flavone Derivatives as HIV-1 Integrase Inhibitors. J. Chem. Inf. Comput. Sci. [CrossRef]
  17. Marrero-Ponce, Y.; Cabrera, M.A.; Romero, V.; Ofori, E.; Montero, L. A. Total and Local Quadratic Indices of the “Molecular Pseudograph’s Atom Adjacency Matrix”. Application to Prediction of Caco-2 Permeability of Drugs. Int. J. Mol. Sci. 2003, 4, 512–536. [Google Scholar]
  18. Marrero-Ponce, Y.; Cabrera, M. A.; Romero, V.; González, D. H.; Torrens, F. A New Topological Descriptors Based Model for Predicting Intestinal Epithelial Transport of Drugs in Caco-2 Cell Culture. J. Pharm. & Pharm. Sci. 2004, 7, 186–199. [Google Scholar]
  19. Marrero-Ponce, Y.; Nodarse, D.; González-Díaz, H.; Ramos de Armas, R.; Romero-Zaldivar, V.; Torrens, F.; Castro, E. Nucleic Acid Quadratic Indices of the “Macromolecular Graph’s Nucleotides Adjacency Matrix”. Modeling of Footprints after the Interaction of Paromomycin with the HIV-1 Ψ-RNA Packaging Region. CPS: physchem/0401004.
  20. Marrero-Ponce, Y.; Castillo-Garit, J.A.; Olazabal, E.; Serrano, H. S.; Morales, A.; Castañedo, N.; Ibarra-Velarde, F.; Huesca-Guillen, A.; Jorge, E.; del Valle, A.; Torrens, F.; Castro, E.A. TOMOCOMD-CARDD, a Novel Approach for Computer-Aided “Rational” Drug Design: I. Theoretical and Experimental Assessment of a Promising Method for Computational Screening and in silico Design of New Anthelmintic Compounds. In J. Comput. Aided Mol. Des.; Submitted for publication.
  21. Marrero-Ponce, Y.; Iyarreta-Veitía, M.; Montero-Torres, A.; Romero-Zaldivar, C.; Brandt, C. A.; Ávila, P. E.; Kirchgatter, K. A Novel Approach for Computer-Aided “Rational” Drug Design: Theoretical and Experimental Assessment of a Promising Method for Virtual Screening and in silico Design of New Antimalarial Compounds. In J. Med. Chem.; Submitted for publication.
  22. Marrero-Ponce, Y.; González-Díaz, H.; Romero-Zaldivar, V.; Torrens, F.; Castro, E. A. 3D-Chiral Quadratic Indices of the “Molecular Pseudograph’s Atom Adjacency Matrix” and their Application to Central Chirality Codification: Classification of ACE Inhibitors and Prediction of σ-Receptor Antagonist Activities. Bioorg. Med. Chem. 2004, 12, 5331–5342. [Google Scholar] [CrossRef]
  23. Marrero-Ponce, Y. Total and Local (Atom and Atom-Type) Molecular Quadratic Indices: Significance-Interpretation, Comparison to Other Molecular Descriptors and QSPR/QSAR Applications. Bioorg. Med. Chem. [CrossRef]
  24. Cotton, F. A. Advanced Inorganic Chemistry; Ed. Revolucionaria: Havana (Cuba), 1970; p. 103. [Google Scholar]
  25. Wang, R.; Gao, Y.; Lai, L. Calculating Partition Coefficient by Atom-Additive Method. Perspect. Drug Discov. Des. 2000, 19, 47–66. [Google Scholar]
  26. Ertl, P.; Rohde, B.; Selzer, P. Fast Calculation of Molecular Polar Surface Area as a Sum of Fragment-Based Contributions and Its Application to the Prediction of Drug Transport Properties. J. Med. Chem. 2000, 43, 3714–3717. [Google Scholar] [CrossRef] [PubMed]
  27. Ghose, A. K.; Crippen, G. M. Atomic Physicochemical Parameters for Three-Dimensional-Structure-Directed Quantitative Structure-Activity Relationships. 2. Modeling Dispersive and Hydrophobic Interactions. J. Chem. Inf. Comput. Sci. 1987, 27, 21–35. [Google Scholar] [CrossRef] [PubMed]
  28. Millar, K. J. Additivity Methods in Molecular Polarizability. J. Am. Chem. Soc. 1990, 112, 8533–8542. [Google Scholar] [CrossRef]
  29. Gasteiger, J.; Marsilli, M. A New Model for Calculating Atomic Charge in Molecules. Tetrahedron Lett. 1978, 34, 3181–3184. [Google Scholar] [CrossRef]
  30. Browder, A. Mathematical Analysis. An Introduction; Springer-Verlag: New York, 1996; pp. 176–296. [Google Scholar]
  31. Axler, S. Linear Algebra Done Right; Springer-Verlag: New York, 1996; pp. 37–70. [Google Scholar]
  32. Ross, K. A.; Wright, C. R. B. Matemáticas discretas; Prentice Hall Hispanoamericana: Mexico D.F., 1990. [Google Scholar]
  33. Maltsev, A. I. Fundamentos del Álgebra Lineal; Mir: Moscow, 1976; pp. 68–262. [Google Scholar]
  34. Harary, F. Graph Theory; Addison-Wesley: Reading, MA, 1969; p. 10. [Google Scholar]
  35. Chartrand, G. Graph as Mathematical Models; Prindle, Weber & Schmidt: Boston, MA, 1977; p. 22. [Google Scholar]
  36. Wilson, R.J. Introduction to Graph Theory; Oliver & Boyd: Edinburgh, 1972; p. 10. [Google Scholar]
  37. Trinajstic, N. Chemical Graph TheoryCRC Press: Boca Raton, FL, 1992, 2nd edition; pp. 6–7. [Google Scholar]
  38. Balaz, S.; Sturdik, E.; Rosenberg, M.; Augustin, J.; Skara, B. Kinetics of Drug Activities as Influenced by Their Physicochemical Properties: Antibacterial Effects of Alkylating 2-furylethylenes. J. Theor. Biol. 1988, 131, 115–134. [Google Scholar] [CrossRef] [PubMed]
  39. Estrada, E.; Molina, E. 3D Conectivity Indices in QSPR/QSAR Studies. J. Chem. Inf. Comput. Sci. 2001, 41, 791–797. [Google Scholar] [CrossRef] [PubMed]
  40. Dore, J. Ch.; Viel, C. Antitumoral Chemoterapy. X. Cytotoxic and Antitumoral Activity of β-Nitrostyrenes and Nitrovinyl Derivatives. Farmaco. 1975, 30, 81–109. [Google Scholar]
  41. Sturdik, E.; Drobnica, L.; Balaz, S. Reaction of 2-Furylethylenes with Thiols in Vivo. Coll. Czch. Chem. Comm. 1985, 50, 470–480. [Google Scholar] [CrossRef]
  42. Blondeau, J. M.; Castañedo, N.; Gonzalez, O.; Medina, R.; Silveira, E. In Vitro Evaluation of G-1: A Novel Antimicrobial Compound. Antimicrob. Agents Chemother. 1999, 11, 1663–1669. [Google Scholar]
  43. Castañedo, N.; Goizueta, R.; Perez, J.; Gonzalez, J.; Silveira, E.; Cuesta, M.; Martinez, A.; Lugo, E.; Estrada, E.; Carta, A.; Navia, O.; Delgado, M. Cuban Pat. 22446, 1994; Can. Pat. 2,147,594, 1999.
  44. STATISTICA ver. 5.5, Statsoft, Inc. 1999.
  45. Wold, S.; Erikson, L. Statistical Validation of QSAR Results. Validation Tools. In Chemometric Methods in Molecular Design; van de Waterbeemd, H., Ed.; VCH Publishers: New York, 1995; pp. 309–318. [Google Scholar]
  46. Belsey, D. A.; Kuh, E.; Welsch, R. E. Regression Diagnostics; Wiley: New York, 1980. [Google Scholar]
  47. Cronin, M. T. D.; Schultz, T. W. Pitfalls in QSAR. J. Mol. Struct. (Theochem). 2003, 622, 39–51. [Google Scholar] [CrossRef]

