Article

Protein Quadratic Indices of the “Macromolecular Pseudograph’s α-Carbon Atom Adjacency Matrix”. 1. Prediction of Arc Repressor Alanine-mutant’s Stability

by
Yovani Marrero Ponce
1,*,
Ricardo Medina Marrero
3,
Eduardo A. Castro
4,
Ronal Ramos de Armas
2,
Humberto González Díaz
2,
Vicente Romero Zaldivar
5 and
Francisco Torrens
6
1
Department of Pharmacy, Faculty of Chemical-Pharmacy, Central University of Las Villas, Santa Clara, 54830, Villa Clara, Cuba
2
Department of Drug Design, Chemical Bioactive Center, Central University of Las Villas, Santa Clara, 54830, Villa Clara, Cuba
3
Department of Microbiology, Chemical Bioactive Center, Central University of Las Villas, Santa Clara, 54830, Villa Clara, Cuba
4
INIFTA, División Química Teórica, Suc.4, C.C. 16, La Plata 1900, Buenos Aires, Argentina
5
Faculty of Informatics, University of Cienfuegos, Cienfuegos, Cuba
6
Institut Universitari de Ciència Molecular, Universitat de València, Dr. Moliner 50, E-46100 Burjassot (València), Spain
*
Author to whom correspondence should be addressed.
Molecules 2004, 9(12), 1124-1147; https://doi.org/10.3390/91201124
Submission received: 2 June 2004 / Revised: 12 December 2004 / Accepted: 13 December 2004 / Published: 31 December 2004

Abstract

:
This report describes a new set of macromolecular descriptors of relevance to protein QSAR/QSPR studies, protein’s quadratic indices. These descriptors are calculated from the macromolecular pseudograph’s α-carbon atom adjacency matrix. A study of the protein stability effects for a complete set of alanine substitutions in Arc repressor illustrates this approach. Quantitative Structure-Stability Relationship (QSSR) models allow discriminating between near wild-type stability and reduced-stability A-mutants. A linear discriminant function gives rise to excellent discrimination between 85.4% (35/41) and 91.67% (11/12) of near wild-type stability/reduced stability mutants in training and test series, respectively. The model’s overall predictability oscillates from 80.49 until 82.93, when n varies from 2 to 10 in leave-n-out cross validation procedures. This value stabilizes around 80.49% when n was > 6. Additionally, canonical regression analysis corroborates the statistical quality of the classification model (Rcanc = 0.72, p-level <0.0001). This analysis was also used to compute biological stability canonical scores for each Arc A-mutant. On the other hand, nonlinear piecewise regression model compares favorably with respect to linear regression one on predicting the melting temperature (tm) of the Arc A-mutants. The linear model explains almost 72% of the variance of the experimental tm (R = 0.85 and s = 5.64) and LOO press statistics evidenced its predictive ability (q2 = 0.55 and scv = 6.24). However, this linear regression model falls to resolve tm predictions of Arc A-mutants in external prediction series. Therefore, the use of nonlinear piecewise models was required. The tm values of A-mutants in training (R = 0.94) and test (R = 0.91) sets are calculated by piecewise model with a high degree of precision. A break-point value of 51.32 oC characterizes two mutants’ clusters and coincides perfectly with the experimental scale. For this reason, we can use the linear discriminant analysis and piecewise models in combination to classify and predict the stability of the mutants’ Arc homodimers. These models also permit the interpretation of the driving forces of such a folding process. The models include protein’s quadratic indices accounting for hydrophobic (z1), bulk-steric (z2), and electronic (z3) features of the studied molecules. Preponderance of z1 and z3 over z2 indicates the higher importance of the hydrophobic and electronic side chain terms in the folding of the Arc dimer. In this sense, developed equations involve short-reaching (k ≤ 3), middle- reaching (3 < k ≤ 7) and far-reaching (k = 8 or greater) z1, 2, 3-protein’s quadratic indices. This situation points to topologic/topographic protein’s backbone interactions control of the stability profile of wild-type Arc and its A-mutants. Consequently, the present approach represents a novel and very promising way to mathematical research in biology sciences.

Introduction

Proteins are the major functional molecules of life whose properties are so useful that we employ them as therapeutic agents, catalysts, and materials. Many diseases stem from mutations in proteins that cause them to lose function; some 50% of human cancers are caused by mutations in the tumor suppressor p53 that primarily lower its stability [1,2]. Enzymes and receptors are the usual targets of drugs, either to restore function or to destroy infectious agents or cancers. The ultimate goal of protein science is to be able to predict the structure and activity of a protein de novo and how it will bind to ligands. When this is achieved, we will be able to design and synthesize novel catalysts, materials, and drugs that will eliminate disease and minimize ill health [1].
There are now significant advances toward this goal. Experimentalists are able to alter the activity and stability of proteins by protein engineering, and the first tentative steps in protein design are under way. The advent of this approach allows the structure of proteins to be modified in a manner similar to small molecules so that structure-(stability)-activity relationships may be studied. In addition, theoreticians are able to simulate many aspects of folding and catalysis with increasing detail and reliability [3,4]. In these studies, the data derived from protein engineering experiments are being used, to benchmark the computer calculations that will eventually be used for designing rational changes in protein stability and allow the modest redesign of proteins [1].
Anfinsen’s experiment with ribonuclease A and staphylococcal nuclease discovered that amino-acid sequence of these small proteins encode their final folded structure and also encode the information on how to get to the structures [5,6]. However, the “folding problem (prediction of the three-dimensional structure of a protein from its amino-acid sequence)” still remains as one of the greater unsolved problems of protein science. The folding problem is so important due to the large number of the genome sequences completed in recent years. This fact has provoked a large gap between the sharply increasing number of protein sequences entering into data banks and the slow accumulation of known structure. Thus, predicting the spatial structure based on a given protein primary-sequence information could play a significant role in conjunction with experimental methods [7].
Many researchers worldwide have worked on the development of models in order to predict the stability of mutants of a wild protein. For instance, Shortle has studied 118 mutants of Staphylococcal nuclease. Similarly, other researchers have modelled the stability of 145 mutants of T4 Lysozyme, 96 mutants of Barnase and 71 mutants of Chymotrypsin in what seems to be the models with the largest mutated proteins. Other important studies included modelling of the stability of 66 mutants of GeneV, 65 mutants of Human lysozyme and 58 mutants of protein L. In addition, they stand out the studies with 40 mutants of Trypsin inhibitor, 38 mutants of TNFn3 and 31 mutants of FKBP12. They have been also reported models for proteins with more than 10 mutants but less than 30 such as ACBP, Ribonuclease T1, Ribonuclease H, α Lactalbumin, hen Lysozime, Subtilisin inhibitor, U1A, ISO-1 cytochrome C, Trp synthase. Other less-mutated studied proteins are CD2, Calbindin, Apomyoglobin, Adrenodoxin, Cold shock, ribonuclease A, λ-CRO and so on. As summarized by Zhou and Zhou’s excellent work, a total of 35 proteins with their respective 1023 mutants have been studied including all the examples above. In this work, Zhou and Zhou not only do an excellent review of the topic but also use the data on the 1023-mutant stability to develop what seem to be one of the largest unified models up to date [8].
Much work is currently underway to determine the contribution of individual residues to the overall fold and stability of a protein [9,10,11,12,13]. This is a very challenging problem due to the complexity of both the native and unfolded states, and the transition between them. Robert Sauer has done some of the seminal work in this area on the Arc repressor [14,15]. This protein provides an attractive system in which to address this issue because it is small (53 AAs), and amenable to genetic and biophysical studies [16,17,18]. This is a homodimer protein with a globular domain formed by the intertwining of their monomers. It’s secondary structure consists on two anti-parallel β-sheets from residues 8-14, and α-helices formed by residues 15-30 and 32-48 [15]. Nevertheless, until our concern, neither Zhou and Zhou’s work nor other reported in the literature, predict the stability of Arc Repressors [8].
Recently, a novel scheme to the rational –in silico- molecular design (or selection/identification of chemicals) and to QSAR/QSPR studies has been introduced by one of the present authors. It is the so-colled TOpological MOlecular COMputer Design (TOMOCOMD) [19]. This method has been developed to generate molecular descriptors based on the linear algebra theory. In this sense, atom, atom-type and total quadratic and linear indices have been defined in analogy to the quadratic and linear mathematical maps, respectively [20,21]. This approach has been successfully employed in QSPR and QSAR studies [20,21,22,23,24,25,26,27,28,29,30], including studies related to nucleic acid-drug interactions [31]. The approach describes changes in the electron distribution with time throughout the molecular backbone.
The TOMOCOMD-CARDD (acronym of the Computed-Aided ‘Rational’ Drug Design) strategy is very useful for the selection of novel subsystems of compounds having a desired property/activity [24,28,29,30], which can be further optimized by using some of the many molecular modeling methods at the disposition of the medicinal chemists. The method has also demonstrated flexibility in relation to many different problems. In this sense, the TOMOCOMD-CARDD approach has been applied to the fast-track experimental discovery of novel anthelmintic [28,30] and antimalarials [29] compounds. The prediction of the physical, chem-physical and chemical properties of organic compounds is a problem that can also be addressed using this approach [20,25,27]. Codification of chirality and other 3D structural features constitutes another advantage of this method [26]. The latter opportunity has allowed the description of the significance-interpretation and the comparison to other molecular descriptors [21,25]. Additionally, promising results have been found in the modeling of the interaction between drugs and HIV packaging-region RNA in the field of bioinformatics using TOMOCOMD-CANAR (Computed-Aided Nucleic Acid Research) approach [31].
Therefore, describing an extended TOMOCOMD-CAMPS (Computed-Aided Modelling in Protein Science) approach to account for protein structure constitutes the main aim of this paper. In the present study, we propose a total and local definition of protein quadratic indices of the “macromolecular pseudograph’s α-carbon atom adjacency matrix”. In order to validate the method, protein’s total macromolecular indices were used to develop quantitative models. In this sense, protein stability effects are described for a complete set of alanine substitutions in Arc repressor. The present result allows us to predict the melting temperature referred to unfolding Arc dimer.

Computational Methods

Arc Dimer Structure and Melting Temperature of a Complete Set of A-Substitution Mutants

Arc is a homodimer in which each monomer intertwines with the other to form a single, globular domain with a well-defined core. Several side-chain hydrogen bond and salt bridge interactions are involved in the Arc crystal structure. An exhaustive representation of these interactions can be found in some detail elsewhere (see Figure 1b in Reference 15). Nevertheless, an overview of these electrostatic interactions in Arc repressor structure will be given. Hydrogen-bond interactions take place [15]:
i)
Between side chain in the same subunit (R16-D20, D20-R23, N29-E36, E36-R31, E36-R40, E43-K46, E43-K47) and; those between side chains in different subunits (E28-R50, R40-S44, R40-F48).
ii)
Between a side chain and main-chain atom intersubunit (W14-N34, N34-R13) and; those between a side chain and main-chain atom intrasubunits (E17-E17, S32-S35, S44-R40).
Table 1. Results of the ADL, PLR and LMR Analyses of the Arc A-Mutants in the Training and Test Sets.
ProteinClassbP% (P)cP% (H)cScoredtm(Obs)etm(Pred)fResgtm(Pred)hResg
1PA8-st6aH4.3195.691.4774.1(55.1) i19.056.8617.2
2SA35-st6H5.2594.751.3663.462.41.069.1-5.7
*3NA34-st11H59.4040.60-0.2363.061.21.852.610.4
4NA11-st6aH40.8959.110.1362.154.57.649.9512.1
5QA39-st11H9.2590.751.0761.459.71.762.7-1.3
*6GA52-st11H86.9413.06-0.9860.960.00.957.53.4
7KA6-st6aH8.7591.251.1059.655.04.660.83-1.2
8RA16-st6H0.4399.572.6159.556.33.257.61.9
9VA25-st6H11.4888.520.9559.357.32.056.42.9
10MA4-st6H12.4987.510.9059.258.11.160.1-0.9
11Arc-st6aH9.1190.891.085954.74.357.881.1
12EA27-st6H5.4294.581.3558.858.10.756.52.3
13KA2-st6H2.0997.911.8358.758.20.559.2-0.5
14QA9-st6H14.2885.720.8358.457.50.955.33.1
15GA3-st6H6.1293.881.2958.160.3-2.257.30.8
16MA1-st6aH12.8487.160.895855.03.059.41-1.4
*17Arc-st11H88.8011.20-1.0657.959.0-1.152.45.5
18SA5-st6H8.0991.911.1457.558.2-0.758.8-1.3
19RA13-st6H2.2897.721.7957.357.7-0.453.93.4
20KA46-st11H8.0491.961.1457.155.91.256.11.0
21EA17-st6aH4.5895.421.435755.81.256.900.1
22VA18-st6H6.2593.751.2856.958.1-1.255.41.5
23RA23-st11H18.5381.470.6756.757.7-1.051.84.9
24KA24-st11H29.5770.430.3856.357.9-1.649.37.0
25EA43-st6H2.0497.961.8456.157.6-1.554.71.4
26EA28-s11aH47.6652.340.0055.756.2-0.550.195.5
27MA7-st6H8.7591.251.1055.558.4-2.960.8-5.3
28DA20-st6H2.6897.321.7155.357.7-2.449.65.7
29IA51-st11P93.916.09-1.3950.940.410.547.73.2
30GA49-st11aP91.798.21-1.2348.747.01.740.718.0
*31LA19-st6P9.9990.011.0348.345.42.951.8-3.5
32GA30-st11P52.7847.22-0.1047.942.55.456.1-8.2
33RA50-st11P62.6837.32-0.3047.944.53.449.5-1.6
*34KA47-st11P20.1579.850.6247.250.0-2.840.76.5
35PA15-st11aP66.8833.12-0.3946.638.48.255.56-9.0
36SA44-st11P99.900.10-3.4246.344.32.037.09.3
37NA29-st11P80.9719.03-0.7645.347.7-2.449.6-4.3
38VA33-st11P94.465.54-1.4344.141.52.649.8-5.7
39EA48-st11P82.3717.63-0.8043.242.30.944.7-1.5
40LA12-st11P97.372.63-1.8142.344.3-2.043.2-0.9
*41FA10-st6aP31.2468.760.3440.645.8-5.249.41-8.8
42LA21-st11P90.689.32-1.1639.639.9-0.346.7-7.1
*43RA31-st11P15.1884.820.7937.141.6-4.545.8-8.7
44MA42-st11P84.0615.94-0.8635.637.5-1.935.60.0
45SA32-st11aP90.079.93-1.1333.534.2-0.761.35-27.8
46YA38-st11P90.779.23-1.1733.040.6-7.636.4-3.4
47WA14-st11P97.382.62-1.8231.538.8-7.336.6-5.1
48RA40-st11P98.441.56-2.0831.230.21.040.6-9.4
49VA22-st11P83.8516.15-0.85<20
50EA36-st11aP69.5830.42-0.45<20
51IA37-st11P91.538.47-1.21<20
52VA41-st11P95.814.19-1.58<20
53FA45-st11P99.520.48-2.66<20
*Mutants that are misclassified by model (10). aCompounds in test set. bExperimental stability of the Arc A-mutants: H, near wild-type stability mutants; P, reduced stability mutants. cPercentage of probability with which the mutants is predicted as reduced stability/near wild-type stability mutants, respectively. dCanonical scores predicted using canonical analysis (model 11). eExperimental Melting point (tm) values; taken from Milla et al., 1994. fCalculated tm values by the nonlinear piecewise regression model (13). gResiduals: tm(Obs) - tm(Pred). h Calculated tm values by the linear regression model (12). iStatistical outlier.
The data of Arc repressor mutant was taken from the literature [15]. In this paper, Alanine substitutions were constructed at each of the 51 non-alanine positions in the wild-type Arc sequence. To avoid intracellular proteolysis and purification difficulties, these authors constructed the alanine substitution mutant in backgrounds containing the carboxy-terminal extensions (His)6 (designated st6) or (His)6-Lys-Asn-Gln-His-Glu (designated st11) [18,32]. These tail sequences allow affinity purification, reduce degradation and cause no significant changes in protein stability [33].
Milla et al. subjected each purified mutant of Arc to thermal and urea denaturation experiments. Stability of the proteins was checked by melting temperature (tm) [15]. The values of tm for 53 Arc homodimers reported by these authors are given in Table 1 (see sixth column). In this Table, the Arc mutants are grouped into two categories: 1) mutants with near wild-type stability and, 2) mutants with reduced stability. The first group also includes one mutant with increased stability (PA8-st6). Otherwise, the second one includes five unfolded mutants, even at low temperatures (< 20oC) and absence of denaturant.
In equilibrium and kinetic unfolding-refolding studies only native Arc dimers and denatured monomers are significantly populated. Thus, folding and dimerization are concerted processes [15,16,17]. For this reason, it is important to remember that tm refers to unfolding of the Arc homodimer. Then, one must take into consideration that each single mutation changes two side chains in the Arc dimer, being stability effects roughly twice these observed for monomeric proteins. Moreover, changes in stability may arise due to mutation disrupts of a native interaction, when the native structure of the mutant undergoes relaxation, or because of the change on the properties of the denatured mutant protein [9,11,12,13,15].

Protein Quadratic Indices of the “Macromolecular Pseudograph’s α-Carbon Atom Adjacency Matrix”

The major constituent of proteins is an umbranched polypeptide chain consisting of L-α-amino acids linked by amide bonds between the α-carboxyl group of one residue and the α-amino group of the next. The sequence of the amino acids defines the primary structure [1,34,35,36,37,38]. As previously outlined, the genetically encoded sequence of a protein determines its three-dimensional structure [5,6]. That is to say, if the side chain of each amino acid within a protein is removed, the secondary structure of the protein is obtained. It is constructed around planar units of peptide bond. Closer examination reveals regions where the secondary structure is organized into repetitive and regular elements.
Afterwards, the side chains can be added back to the backbone, and it is then seen how the ternary structure of the proteins is formed by the packing of the regular elements of secondary structure by way of their side chains. For this reason, the structure of each protein can be expressed in a quantitative way by side chain amino-acid properties. Subsequently, Charton and Charton determined the dependence of protein conformation upon the side chain structure of the amino-acid residues using Chou-Fasman parameters [39].
In other approach about structure-activity studies, Hellberg et al. developed the so-called principal properties or z-values [40]. This peptide QSAR methodology is based on a parametrization of each amino-acid occurring in a peptide chain with three z-values, which are linear combinations of the original measured variables. These values are proposed to be related to hydrophilicity, bulk, and electronic properties. The principal properties have been successfully used to seek peptide QSARs [40,41,42]. Other descriptors used in peptides QSAR studies have been derived from the side-chain surface area and atomic charges of the amino acids [43].
On the other hand, the general principles of the quadratic indices of the “molecular pseudograph`s atom adjacent matrix” for small-to-medium sized organic compounds have been explained in some detail elsewhere [20,22,23,24,25,26,28,31]. However, an extended overview of this approach will be given in this work.
First, in analogy to the molecular vector X used to represent organic molecules we introduce here the macromolecular vector (Xm). The components of this vector are numeric values, which represent a certain side-chain amino-acid property. These properties characterize each kind of amino-acid (R group) within the protein. Such properties can be z-values [40], side-chain isotropic surface area (ISA) and atomic charges (ECI) of the amino acid [43], and so on. For instance, the z1(AA) scale of the amino acid AA takes the values z1(V) = -2.69 for valine, z1(A) = 0.07 for alanine, z1(M) = 2.49 for methionine and so on [40,43]. Table 2 depicts descriptors scales z1, z2, and z3 for the natural amino acids.
Table 2. Descriptor Scales z1, z2 and z3 for the Natural Amino Acids [40,43].
  Amino Acidsz1z2z3
AlaA0.07-1.730.09
ValV-2.69-2.53-1.29
LeuL-4.19-1.03-0.98
IleI-4.44-1.68-1.03
ProP-1.220.882.23
PheF-4.921.300.45
TrpW-4.753.650.85
MetM-2.49-0.27-0.41
LysK2.841.41-3.14
ArgR2.882.52-3.44
HisH2.411.741.11
GlyG2.23-5.360.30
SerS1.96-1.630.57
ThrT0.92-2.09-1.40
CysC0.71-0.974.13
TyrY-1.392.320.01
AsnN3.221.450.84
GlnQ2.180.53-1.14
AspD3.641.132.36
GluE3.080.39-0.07
Thus, a peptide (or protein) having 5, 10, 15,..., n amino acids can be represented by means of vectors, with 5, 10, 15,..., n components, belonging to the spaces 5, 10, 15,..., n, respectively. Where n is the dimension of the real sets ( n).
This approach allows us encoding peptides such as VALVGLFVL through out the macromolecular vector Xm = [-2.69 0.07 -4.19 -2.69 2.23 -4.19 -4.92 -2.69 -4.19], in the z1-scale (see Table 2). This vector belongs to the product space 9. The use of other scales defines alternative macromolecular vectors.
If a protein consists of n amino acids (vector of n), then the kth (k = 10) protein’s total quadratic indices, qk(xm) are defined by a q application (q: n ). Where, Xm can be expressed by a linear combination Xm = x1a1+...+xnan, being the vectors (ai)1≤in a base of n [20,22,23,24,25,26,28,31]. In this context, the k-th protein’s total quadratic indices qk(xm) are calculated afterwards from this macromolecular vector as Eq. 1 shows,
q k ( x m ) = i = 1 n j = 1 n k a i j m X i m X j
where, kaij = kaji (symmetric square matrix), n is the number of amino acids of the protein (α-carbon atom in the protein’s backbone) and mX1,…,mXn are the coordinates of the macromolecular vector Xm in the base ai. In this case, the canonical base of n {e1,…,en} is used as the quadratic form’s base. Thereafter, the coordinates of any vector Xm coincide with the components of this vector. For that reason, such coordinates can be considered as weights of the vertices (α-carbon atoms) of the pseudograph of the protein’s backbone. The coefficients kaij are the elements of the kth power of the macromolecular matrix M(Gm) of the protein’s pseudograph (Gm). The term pseudograph in chemical graph-theory was introduced by Frank Harary [44]. According to him, a pseudograph is a graph with multiple edges or loops between the same vertices or the same vertex. Loop-multigraph [45] or general graphs [46] are other terms also used in this research area [47].
Here, M(Gm) = [aij], where n is the number of α-carbon atoms in protein’s backbone. The elements aij are defined as follows:
aij = 1 if ij and ek ∊ E(Gm)
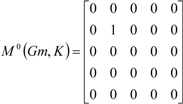
= 1 if i = j and the amino acid i has a hydrogen bond between its side chain and
its main-chain atom
= 0 otherwise
where, E(Gm) represents the set of edges of Gm. In this adjacency matrix M(Gm) the row i and column i correspond to vertex vi from Gm. The elements aii = 1 are loops in vi. On the other hand, the element aij of this matrix represents a bond between an α-carbon atom i and other j. Here, we consider only covalent interaction (peptidic bond) and hydrogen-bond interaction (within a chain as well as between chains). As a first approximation, we considered both interactions equivalent, taking into account the “connectivity of the protein”. The matrix Mk(Gm) provides the number of walks of length k linking the α-carbon atom of the amino acids i and j. Additionally, proteins containing amino acids that present hydrogen bond between its side chain and its main-chain atom are represented like a pseudograph. Specifically, the Arc repressor presents this kind of interaction for the amino acid E17, where the presence of this intrasubunit hydrogen bond is accounted by means of a loop in its α-carbon atom of the protein’s backbone [15].
We can obtain qk(xm) by means of the matrix expression qk(xm) = [mX]t Mk(Gm) [mX] (k10). Being, [mX] the column vector (an nx1 matrix) of the coordinates of Xm in the canonical base of n, [mX]t the transpose of [mX] (an 1xn matrix) and Mk(Gm) the kth power of the matrix M(Gm) (quadratic form’s matrix). Table 3 exemplifies the calculation of qk(xm) for bradykinin-potentiating pentapeptides previously used in QSAR studies [43].
In addition to total protein quadratic indices, computed for the whole-molecule, local-fragment (both aminoacid and aminoacid-type) formalisms can be developed. The qkL(xm) are graph-theoretical invariants for a given fragment (FR), where FR is a connected subgraph and represents a specific group or set of amino acids in a protein. The definition of these descriptors is as follows:
q k L ( x m ) = i = 1 m j = 1 m k a i j L m X i m X j
where m is the number of amino acids (α-carbon atoms) of the fragment of interest and kaijL is the element of the file i and column j of the matrix MkL(Gm). This matrix is extracted from Mk(Gm) and contains information referred to the vertices of the specific protein fragments (FR) and also of the molecular environment.
The matrix MkL(Gm) = [kaijL] with elements kaijL is defined as follows:
kaijL = kaij if both vi and vj are vertices (amino-acid) contained within FR
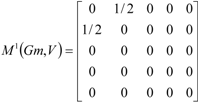
= 1/2 kaij if vi or vj are vertices (amino-acid) contained within FR but not both
= 0 otherwise
where, the kaij are the elements of the kth power of M(Gm). These local analogues can also be expressed in matrix form by the expression:
qkL(xm) = [mX]tMkL(Gm) [mX]
Note that for every partition of a protein into Z macromolecular fragments there will be Z local macromolecular-fragment matrices. That is to say, if a protein is partitioned into Z macromolecular fragments, the matrix Mk(Gm) can be partitioned into Z local matrices MkL(Gm), L = 1,... Z. The kth power of the matrix M(Gm) is exactly the sum of the kth power of the local Z matrices.
M k ( G m ) = L = 1 Z M L k ( G m )
In the same way, Mk(Gm) = [kaij] where,
k a i j = L = 1 Z k a i j L
and the total protein’s quadratic indices are the sum of the macromolecular quadratic indices of the Z molecular fragments (see Table 3),
q k ( x m ) = L = 1 Z q k L ( x m )
Aminoacid and aminoacid-type quadratic indices are specific cases of local protein quadratic indices. In this sense, the kth aminoacid quadratic indices are calculated by summing the kth aminoacid quadratic indices of all aminoacids of the same aminoacid type in the protein. In the aminoacid-type quadratic indices formalism, each aminoacid in the molecule is classified into an aminoacid-type (fragment), such as apolar, polar uncharged, positive charged, negative charged, aromatic, and so on. For all data sets, including those with a common molecular scaffold as well as those with very diverse structure, the kth aminoacid-type quadratic indices provide important information.
Any local protein’s quadratic index has a particular meaning, especially for the first values of k, where the information about the structure of the fragment FR is contained. Higher values of k relate to the environment information of the fragment FR considered within the macromolecular pseudograph (Gm).
In any case, a complete series of indices performs a specific characterization of the chemical structure. The generalization of the matrices and descriptors to “superior analogues” is necessary for the evaluation of situations where only one descriptor is unable to bring a good structural characterization [48,49]. The local macromolecular indices can also be used together with total ones as variables for QSAR/QSPR modeling of properties or activities that depend more on a region or a fragment than on the macromolecule as a whole.
Table 3. Definition and Calculation of Three (k = 0-2) Total and Local (Side Chain Amino Acid) Protein Quadratic Indices of the “Macromolecular Pseudograph’s α-Carbon Atom Adjacency Matrix” of a Bradykinin-Potentiant Pentapeptide.
Molecules 09 01124 i001
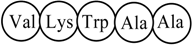
Pentapeptide Structure (sequence)
Molecules 09 01124 i002
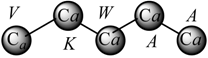
Macromolecular ‘Pseudograph’ (Gm) of the α-Carbon Atoms (Polypeptide’s backbone)
Molecules 09 01124 i003Amino acid residue (side chain R)
Here, we consider only covalent interaction (peptidic bond), but non-covalent interaction (hydrogen-bond and salt bridge interaction) can be taken into consideration (within a chain as well as between chains)
Macromolecular Vector: Xm = [V K W A A] ℜ5
In the definition of the Xm, as macromolecular vector, the one letter symbol of the amino acids indicates the corresponding side-chain amino-acid property, e.g., z1-values. That is to say, if we write V it means z1(V), z1-values or some amino acid property, which characterizes each side chain in the polypeptide. Therefore, if we use the canonical bases of R5, the coordinates of any vector Xm coincide with the components of that macromolecular vector

[mX]t = [-2.69 2.84 -4.75 0.07 0.07]
[mX]t = transposed of [mX] and it means the vector of the coordinates of Xm in the canonical basis of R5 (an 1x5 matrix)
[mX]: vector of coordinates of Xm in the canonical basis of R5 (an 5x1matrix)
Molecules 09 01124 i004
Molecules 09 01124 i005
Molecules 09 01124 i006
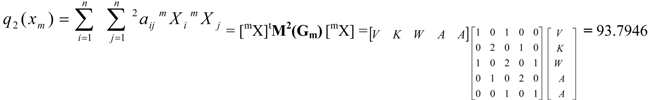
Total (whole molecule) protein quadratic indices of zero, first and second order are a quadratic maps; qk(xm): ℜn→ ℜ such that,
q0(V, K, W, A, A) = (V2+K2+W2+A2+A2) = 37.874
q1(V, K, W, A, A) = (2VK+KW+2WA+2AA) = -42.9144
q2(V, K, W, A, A) = (A2+V2+2K2+2W2+2A2+2WV+2AW) = 93.7946
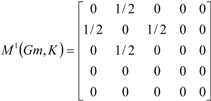
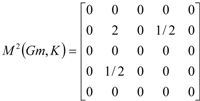
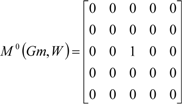
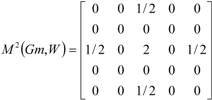
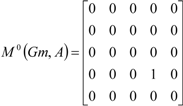
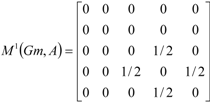
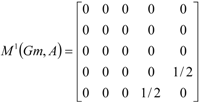
If the peptide is partitioned into each (5) amino acid, the matrix Mk(Gm) can be partitioned into 5 local matrices MkL(Gm), L = 1,... 5. The kth power of the matrix M(Gm) is exactly the sum of the kth power of the local (5) matrices: Molecules 09 01124 i007
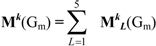
The zero, first and second powers of the local (amino-acid) matrix
Molecules 09 01124 i008 Molecules 09 01124 i009 Molecules 09 01124 i010
Molecules 09 01124 i011 Molecules 09 01124 i012 Molecules 09 01124 i013
Molecules 09 01124 i014 Molecules 09 01124 i015 Molecules 09 01124 i016
Molecules 09 01124 i017 Molecules 09 01124 i018 Molecules 09 01124 i019
Molecules 09 01124 i020 Molecules 09 01124 i021 Molecules 09 01124 i022
and the total (whole-molecule) quadratic indices are the sum of the macromolecular quadratic indices of the 5 amino-acids, qk(xm) = Molecules 09 01124 i023
Amino Acid (AA)q0L(xm, AA)q1L(xm, AA)q2L(xm, AA)q3L(xm, AA)q4L(xm, AA)
Val (V)7.2361-7.639620.0136-15.467552.6164
Lys (K)8.0656-21.129616.33-55.550441.1232
Trp (W)22.5625-13.822557.57-41.4675172.71
Ala (A)0.0049-0.32760.2086-1.1760.8197
Ala (A)0.00490.0049-0.32760.2086-1.176
Pentapeptide37.874-42.914493.7946-113.453266.0933

TOMOCOMD Software

TOMOCOMD is an interactive program for molecular design and bioinformatics research [19]. The program is composed by four subprograms, each one of them dealing with drawing structures (drawing mode) and calculating 2D and 3D molecular descriptors (calculation mode). The modules are named CARDD (Computed-Aided ‘Rational’ Drug Design), CAMPS (Computed-Aided Modelling in Protein Science), CANAR (Computed-Aided Nucleic Acid Research) and CABPD (Computed-Aided Bio-Polymers Docking). In this paper we outline salient features concerned with only one of these subprograms: CAMPS. This subprogram was developed based on a user-friendly philosophy without prior knowledge of programming skills.
The calculation of total and local macromolecular quadratic indices for any peptide or protein was implemented in the TOMOCOMD-CAMPS software [19]. The main steps for the application of this method in QSAR/QSPR can be briefly resumed as follows:
  • Draw the macromolecular pseudographs for each protein of the data set, using the software’s drawing mode. This procedure is carried out by a selection of the active aminoacid symbol belonging to ‘natural’ aminoacid code. Here, we consider only covalent interaction (peptidic bond) and hydrogen-bond interaction (within a chain as well as between chains). Afterward, we draw the mutants by changing an AA for alanine and considering that this change only affect the possibility of this region of the protein to form polar interaction (because we suppressed the hydrogen interaction if the former AA had it).
  • Use appropriated amino acid weights in order to differentiate the side chain of each amino acid. In this work, we used as amino-acid property the three z-values [40,43].
  • Compute the protein quadratic indices of the “macromolecular pseudograph’s α-carbon atom adjacency matrix”. They can be performed in the software calculation mode, in which one can select the side chain properties and the family descriptor previously to calculate the molecular indices. This software generates a table in which the rows and columns correspond to the compounds and the qk(xm), respectively.
  • Find a QSPR/QSAR equation by using statistical techniques, such as multilinear regression analysis (MRA), Neural Networks (NN), Linear Discrimination Analysis (LDA), and so on. That is to say, we can find a quantitative relation between a property P and the qk(xm) having, for instance, the following appearance,
    P = a0q0(x) + a1q1(x) + a2q2(x) +….+ akqk(x) + c
    where P is the measurement of the property, qk(xm) [or qkL(xm)] is the kth total [or local] macromolecular quadratic indices, an the ak’s are the coefficients obtained by the statistical analysis.
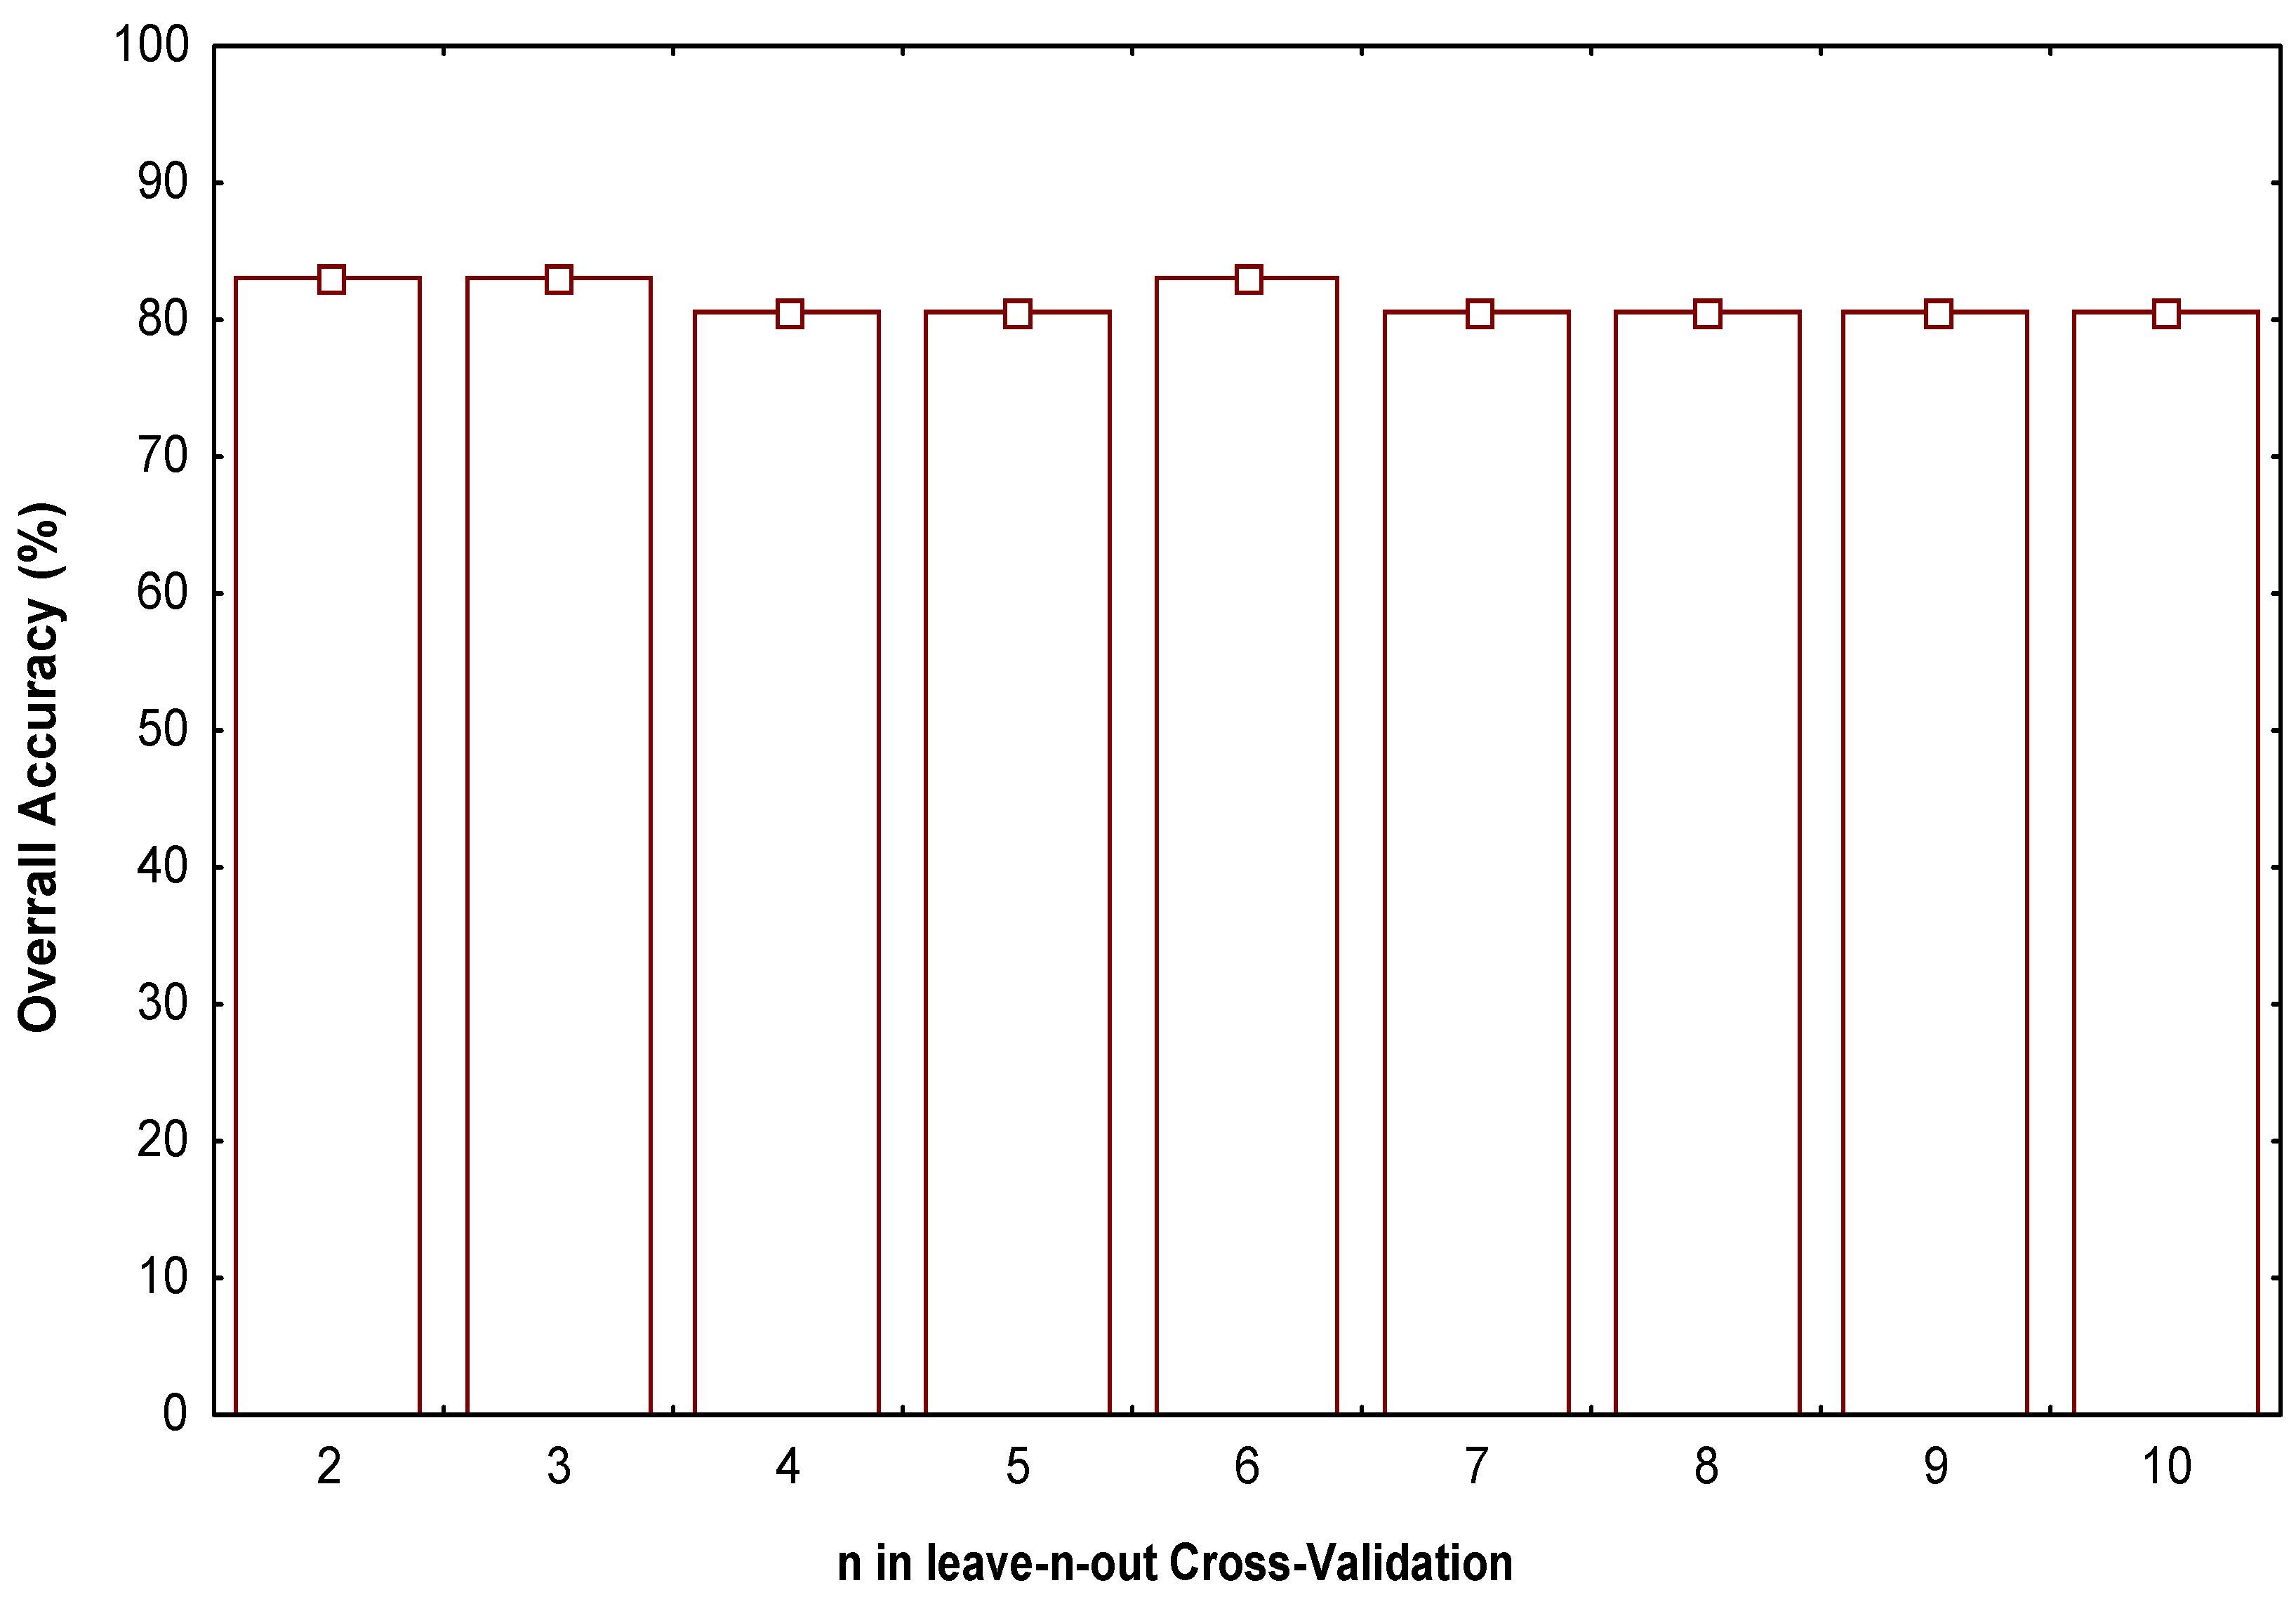
  • Test the robustness and predictive power of the QSPR/QSAR equation by using internal and external cross-validation techniques,
  • Develop a structural interpretation of the obtained QSAR/QSPR model using macromolecular quadratic indices as molecular descriptors.

Statistical Analysis

Linear Discrimination Analysis (LDA), Linear Multiple Regression (LMR) and the nonlinear estimation analysis, Piecewise Linear Regression (PLR) were used to obtain quantitative models. These statistical analyses were carried out with the STATISTICA software package [50]. Forward stepwise was fixed as the strategy for variable selection in the case of LDA and LMR analysis. The tolerance parameter (proportion of variance that is unique to the respective variable) used was the default value for minimum acceptable tolerance, which is 0.01.
LDA is used in order to generate the classifier function on the basis of the simplicity of the method [51]. To test the quality of the discriminant functions derived we used the Wilks’ λ and the Mahalanobis distance. The Wilks’ λ statistic for overall discrimination can take values in the range of 0 (perfect discrimination) to 1 (no discrimination). The Mahalanobis distance indicates the separation of the respective groups. It shows whether the model possesses an appropriate discriminatory power for differentiating between the two respective groups. The classification of cases was performed by means of the posterior classification probability, which is the probability that the respective case belongs to a particular group, i. e., mutants with near wild-type stability (H) or mutants with reduced stability (P) (see Table 1, second column). In developing this classification function the values of 1 and -1 were assigned to H and P mutants. The quality of the ADL-model was also determined by examining the percentage of good classification and the proportion between the cases and variables in the equation. We also consider the linear discriminant canonical analysis statistics such as: canonical regression coefficient (Rcanc), chi-squared and p-level [p2)]. Validation of the discriminant function was corroborated by means of leave-n-out cross-validation procedures.
A simple linear and other more complex nonlinear model was obtaining using LMR and PLR as statistic techniques, respectively. The quality of the models was determined examining the statistic parameters of multivariable comparison of regression and cross-validation procedures. In this sense, the quality of models was determined by examining the regression coefficients (R), determination coefficients (R2), Fisher-ratio’s p-level [p(F)], standard deviations of the regression (s) and the leave-one-out (LOO) press statistics (q2, scv) [52]. In recent years, the LOO press statistics (e.g., q2) have been used as a means of indicating predictive ability. Many authors consider high q2 values (for instance, q2 > 0.5) as indicator or even as the ultimate proof of the high-predictive power of a QSAR model. In a recent paper, Golbraikh and Tropsha demonstrated that a high value of LOO q2 appears to be a necessary but not the sufficient condition for the model to have a high predictive power [53].
In addition, to assess the robustness and predictive power of the found models, external prediction (test) sets were also used. This type of model validation is very important, if we take into consideration that the predictive ability of a QSAR model can only be estimated using an external test set of compounds that was not used for building the model [52,53].

Results and Discussion

Classification Model

The development of a discriminant function that permits the classification of mutants as near wild-type stability or reduced stability is a key of the present approach to describe the protein stability effects of a complete set of alanine substitutions in Arc repressor. The overall performance of the current method critically depends on the selection of cases of the training set used to build the classifier model. Here we consider a general data set of 53 A-mutants, 28 of them having near wild-type stability (1-28) and the rest being mutants with reduced stability (29-53). This data set was randomly divided into two subsets, one containing 41 mutants (21 having near wild-type stability and 20 reduced stability) was used as a training set, and the other containing 12 mutants (7 having near wild-type stability and 5 reduced stability) was used as a test set. These mutants were never considered in the development of the quantitative model.
The principle of parsimony (Occam's razor) was taken into account as strategy for model selection. In its original form, the Occam’s razor states that “Numquam ponenda est pluritas sin necessitate”, which can be translated as “Entities should not be multiplied beyond necessity” [54]. In this case simplicity is loosely equated with the number of parameters in the model. If we understand predictive error to be the error rate for unseen examples, the Occam’s razor can be stated for the selection of QSAR/QSPR models as (“QSAR/QSPR Occam’s Razor”): Given two QSAR/QSPR models with the same predictive error, the simpler one should be preferred because simplicity is desirable in itself [54]. In this connection, we select the functions with higher statistical signification but having as few parameters (ak) as possible. Equation (10) shows the linear classification model obtained together with the LDA’s statistical parameters:
Class Arc Mutant = 25.89459 +0.1008749.Z3q0(xm) -9.3942x10⁻⁵.Z2q7(xm)
-0.0170188.Z1q1(xm) +0.0132179.Z2q2(xm)
N = 41 λ = 0.476  D2 = 4.40  F(4,36) = 9.8965 p(F) < 0.0001
where N is the number of mutants, λ is the Wilks’s statistic, D2 is the squared Mahalanobis distance and F is the Fisher ratio.
These statistics indicate that model (10) is appropriate for the discrimination of near wild-type stability/reduced stability mutants studied here. It classifies correctly 85.0% (18/21) of near wild-type stability mutants and 85.7% (17/20) of reduced stability mutants in the training set, for a global good classification of 85.4% (35/41). The percentages of false mutants in training set are the same for both groups: 7.32% (3/41). False near wild-type stability mutants are those reduced-stability mutants that model classifies as near wild-type stability mutants, and the false reduced-stability mutants are near wild-type stability mutants classified as reduced-stability mutants by the model. In Table 1 we give the classification of mutants in the training set together with their posterior probabilities calculated from the Mahalanobis distance.
To assess the predictability of the classification model (10), a leave-n-out cross-validation was carried out using the classification tree module. The selected conditions for the validation procedure were the following: discriminant-based linear combination as split method, prune on misclassification error as stopping rule and the same prior probabilities than in equation (10) (proportional to group size). Once the selected conditions were applied to the classification tree module, the equation (10) was obtained and varying the folding parameter of the cross-validation, a leave-n-out routine could be developed. This model shown an 82.93, 82.93, 80.49, 80.49, 82.93, 80.49, 80.49, 80.49, 80.49 and 80.49% of global good classification when n varied from 2 to 10 in the leave-n-out cross validation procedures. The model was stabilized around 80.49% when n was > 6 (see Figure 1).
Figure 1. Behavior of the global or total percentage of good classification (accuracy) in different n-fold cross-validation analysis.
Molecules 09 01124 g001
The most important criterion to accept or not of a discriminant model, such as model (10), is based on the statistics for the test set. Model (10) classifies correctly 11 of 12 mutants, for a global classification of 91.67%. In Table 1, we give the classification of mutants in the test set. If we considered the data set and the test set (full set) the percentage of good classification was 86.79% (46/53).
Canonical analysis is used here to test both the ability of protein’s quadratic indices to discriminate between the two groups of Arc A-mutants and to order these mutants accordingly with their stability profile.
Protein’s quadratic indices & LDA Arc A-Mutant stability canonical analysis principal root:
Arc Mutants-root = 12.60697079 -0.049301889.Z3q0(xm) -4.59135x10⁻⁵.Z2q7(xm)
-0.008317831.Z1q1(xm) +0.006460173.Z2q2(xm)
N = 41 λ = 0.476 Rcanc = 0.72 χ2 = 27.44 Mean (+) = 0.998 Mean (-) = -1.048
The canonical transformation of the LDA results yields one canonical root with a good canonical regression coefficient (0.72). Chi-squared test permits us to test the statistical signification of this analysis with a p-level <0.0001. This means that we can accept that canonical analysis describes correctly the ‘Class Arc A-Mutant’ with a 99.99% of confidence [55,56].
When LDA analysis is applied to solve the two-group classification problem we ever find two classification functions [55,56]. Medicinal chemists used to report the function obtained by taking the difference between these two functions when develop QSAR studies [57,58,59,60,61,62,63].
However, we cannot use these two classification functions to evaluate all the compounds and obtain a bivariate stability map because they are not orthogonal [55,56]. To solve this problem we used canonical analysis in this case the dimensional reduction caused by canonical analysis makes possible to obtain a one-dimension stability map [56].
That is the same that we can order all compounds taking into account its canonical scores. The canonical scores of all A-mutants of Arc repressor appear in Table 1 (fifth column). We can detect an overall ascendant tendency of canonical scores when they are plotted in the same order in which stability (tm) increases (see Figure 2). As it is expected, the over all mean of canonical root scores for the group of near wild-type stability mutants has an opposite sign (+) with respect to the other group (-) [56].
Figure 2. Overall ascendant tendency of canonical scores plotted in the same order in which tm increases. Blocks I and III contain misclassified Arc A-mutants.
Molecules 09 01124 g002

Quantitative Structure-Stability Relationships (QSSP) Study

To develop QSSR lineal models that permit to predicting the melting temperature (tm) of A-mutants of Arc repressor we used RLM as statistical technique. This model together with its statistical parameters is given below:
tm (oC) = 19.398(±25.535) -7.523x10⁻⁴(±3.227x10⁻⁴).Z2q8(xm) -0.0581(±0.016).Z1q3(xm)
0.121(±0.048).Z1q1(xm) +8.89x10⁻⁵(±3.18x10⁻⁵).Z2q10(xm)
-1.369x10⁻⁵(±4.11x10⁻⁶).Z1q10(xm) +5.998x10⁻⁴(±2.157x10⁻⁴).Z1q7(xm)
+0.026(±0.014).Z1q2(xm) +3.99x10⁻⁵(±3.44x10⁻⁵).Z3q8(xm)
N = 41 R = 0.85 R2 = 0.72 s = 5.64 q2 = 0.55 scv = 6.24 F(8.28) = 9.0425 p < 0.0001
where N is the size of the data set, R is the regression coefficient, s is the standard deviation of the regression, F is the Fischer ratio and q2, scv are the squared correlation coefficient and the standard deviation of the cross validation performed by the LOO procedure, respectively. With the exception of five A-mutants (49-53), the same training and test sets used in classification model (10) were taken in this QSSR study. These A-mutants were extracted due to its non-accurate tm values (< 20 oC), which is not useful for RLM analysis. In Table 1 we give the values of the observed and calculated tm by model (12) for both training and test sets.
Model (12) explains almost 72% of the variance of the experimental tm. The predictive ability of model (12) is evidenced by the value of the LOO press statistics (for example q2 > 0.5 and scv, which is only 10.64% higher than that of the regression model) [52]. Taken into account that a high value of LOO q2 (for instance, q2 > 0.5) appears to be a necessary but not a sufficient condition for the model to have a high predictive power [53], a test set was also used to access the predictive ability of the equation (12). When linear regression model (12) was applied to resolve tm predictions of Arc A-mutants in the prediction set, poor results were found (see Table 1; the last two columns). Thus, this model (12) has a low predictive power.
Different protein folding may be the reason for the lack of linear regression between protein’s quadratic indices and stability (tm); leading to a nonlinear dependence between tm and protein’s quadratic indices. In this case other terms should be taken into consideration such as cooperative salt-bridges and hydrogen-bonds formation, hydrophobic forces, steric terms, and so on. In this sense, far from strong quantitative correlations between stability and structural factors have been obtained in previous study [15]. For example, when the set of tm values were tested for linear correlations with fractional side-chain solvent accessibility, with changes in buried surface area, with average side-chain B-factors, and with the number of side-chain atoms or total atoms within 6 Å of the atoms deleted by the alanine substitution, the pairwise correlation coefficient (r2) ranges from 0.21 to 0.38 [15]. Thus, even though most substitution of alanine for hydrophobic-core residues are destabilizing, there is no simple relationship between the size of the replaced core residue and the destabilizing effect [15].
Therefore, the use of other nonlinear models was required; a nonlinear model that retains linearity in the equation, but uses nonlinear methods to fit them. This is the piece-wise method [50], which produces two linear equations by clustering observations into two groups according to their absolute magnitude. The best fitted piecewise model was:
tm (oC)<BKPT = 14.3409 +0.2014.Z1q3(xm) -0.1198.Z1q5(xm) +0.0197.Z1q7(xm)
-9.4481x10⁻⁴.Z1q9(xm) -0.03023.Z3q3(xm) +0.01565.Z3q6(xm)
-0.0037.Z3q8(xm) +0.2131x10⁻³.Z3q10(xm)
tm (oC)>BKPT = 44.547 +0.0232.Z1q3(xm) -0.0159.Z1q5(xm) +3.046x10⁻³.Z1q7(xm)
-1.6594x10⁻⁴.Z1q9(xm) + 2.5765.Z3q3(xm) +0.0106.Z3q6(xm) -2.3478.Z3q8(xm)
+1.2647x10⁻⁴.Z3q10(xm)
N = 41  R = 0.94  R2 = 88.15  Bkpt = 51.32  p < 0.0001
where R (piecewise regression coefficient) for gradual variance explanation, takes values in the range from 0 (non-piecewise regression) to 1 (explanation of 100% of variance). The probability of error after acceptance of the piecewise hypothesis p was checked for an absolute value >0.05. The parameter break-point (Bkpt) is the tm value, which mark the frontier between the two groups. The resultant regression coefficient suggested a highly significant piecewise non-linear correlation between observed and predicted values (p <0.05).
As we previously pointed out, the quality of a QSAR/QSPR model is mainly expressed by its predictive power, measured to a test set of mutants not included in the training set. In Table 1, we depicted the observed, predicted, and residual values of tm for the training and test set. As can be appreciated, the piecewise model found to describe the stability of Arc A-mutants has a rather good predictive power (R = 0.91, R2 = 0.82, s = 4.249). In developing this model only one mutant (1PA8-st6) was detected as statistical outlier. This is a logic result because only this mutant (PA8) is significantly more stable than wild type. The tm of this mutant protein is about 15 oC higher than that of the wild-type parent (see Table 1), and the free energy of unfolding is increased by 2.9 kcal mol-1 compared with wild type [15].
The main difficulty of the regression non-linear piecewise, is its limitation in the prediction of neither new mutants whose profiles of stability are nor known. The problem here is: which equation should be applied to a new mutant not considered in this study? The Bkpt value (51.32), perfectly agrees with an experimental scale previously proposed [15]. The same scale was used for grouping mutants into the two studied groups in our ADL approach. For this reason, we can use the ADL and piecewise models in combination to classify and to predict the stability of the mutans’ Arc homodimers.

Interpretation of Obtained Models

At present it is known that the folding of Arc repressor is influenced by different kinds of interactions [14,15,16,18,22,23]. An overwhelming role is played by the Van der Waals forces [15]. The hydrophobic interaction is another factor influencing the stability due to the hydrophobic nature of the Arc wild-type core [15,16,17]. Another factor is related to electrostatic force, mainly due to intra and intersubunit salt bridges and hydrogen bonds [15,16,17].
However, most of these factors are interrelated to each other, and it is difficult to determine the contribution of each one by separate. For instance, hydrophobic interaction is intimately related to van der waals forces, and the electrostatic interactions are also related to dispersion interactions, which are part of the Van der Waals forces. In addition, Arc wild-type and its mutants showed a cooperative behaviour in folding/dimerization processes [15,16,17].
As can be observed in the obtained models, the included variables are related with the factors that influence on the stability and this one with the structural features of Arc dimer. In this sense, the protein’s quadratic indices calculated using z1, z2, or z3 values, as amino-acid (side-chain) properties are included in most of the developed models. These z-values are related to hydrophilicity, bulk, and electronic properties, respectively. For this reason, it is possible to determine the nature of the driving forces of the Arc repressor folding, e.g., hydrophobic, steric, or electronic.
The preponderance of hydrophobic and electronic effects in the obtained equations (10-13) over other types of protein’s quadratic indices clearly indicates the importance of the hydrophobic and electronic side chain factor in the folding of Arc dimer.
It must be pointed out that developed equations (10-13) involve short-reaching (k ≤ 3), middle-reaching (3 < k ≤ 7) and far-reaching (k = 8 or greater) protein’s quadratic indices. This situation means that the stability profile of wild-type Arc and its A-mutants results in topologic/topographic-controlled protein’s backbone interactions.

Conclusions

In this study a new set of macromolecular descriptors relevant to protein QSAR/QSPR studies is present. These descriptors, total and local protein’s quadratic indices, are calculated from the macromolecular pseudograph’s α-carbon atom adjacency matrix using z-values and canonical bases as side chain of amino-acid property and quadratic form’s bases, respectively. Their derivation is straightforward, and it is easy to interpret the QSARs/QSPRs that include them. The total protein’s quadratic indices and LDA, LMR and PLR have been used in QSSR studies of 53 Arc A-mutants. The resulting quantitative models are significant from a statistical point of view. A LOO cross-validation procedure (internal validation) and an external predicting series (external validation) revealed that the QSSR models had a good predictability.
The models found to describe the stability profile of wild type Arc and its A-mutants include protein’s quadratic indices accounting for hydrophobic (z1), bulk-steric (z2), and electronic (z3) features of the studied molecules. These models using such combination of molecular descriptors are better than any other model that can be found by using only one type of the studied descriptors. We interpret these results as suggesting that many of the Arc mutations affect stability in more than one way and: by disrupting specific electronic interaction, by changing hydrophobic burial, and/or by changing the structure of the native or the denatured protein [9,10,11,12,13]. Thus, we have proved that the combined use of z1, 2, 3-protein’s quadratic indices is an appropriate approach to QSSR studies. These models are not only good enough to predict thermodynamic parameter of the folding of mutants of Arc dimer repressor, but also permit the interpretation of the driving forces of such folding processes.
The approach described here represents a novel and very promising way to bioinformatics research. We would expect computational protein science to have a similar effect on the search for new vaccines, receptors, drugs, and so on as molecular modelling and QSAR have had on the search for new drugs.

Acknowledgements

We would like to offer our sincere thanks to the two unknown referees for their critical opinions about the manuscript, which have significantly contributed to improving its presentation and quality. Marrero-Ponce, Y. would like to express his gratitude to Drs. David Whithey (England), David Livingstone (England), James Devillers (France), Johann Gasteiger (Germany), Klaus L. E. Kaiser (Canada), Lauren Dury (Belgium), Laurence Leherte (Belgium), Ernesto Estrada (Spain), David B. Silverman (USA) and Douglas Klein (USA) for sending him several reprints of their papers on molecular design. F. T. acknowledges financial support from the Spanish MCT (Plan Nacional I+D+I, Project No. BQU2001-2935-C02-01). Last but not least, M-P is also indebted to the journal’s Managing Editor, Dr. Derek J. McPhee and Editor-in-Chief, Dr. Shu-Kun Lin, for their kind attention.

References and Notes

  1. Fersht, A. Structure and mechanism in protein science: A guide to enzyme catalysis and protein folding; W. H. Freeman and Company: New York, 1999. [Google Scholar]
  2. Sidransky, D.; Hollstein, M. Clinical Implications of the p53 Gene. Ann. Rev. Med. 1996, 47, 285–301. [Google Scholar] [CrossRef] [PubMed]
  3. Grace, J. B. Bioinformatics: Mathematical Challenges and Ecology. Science 1996, 275, 1861c–1865c. [Google Scholar] [CrossRef]
  4. Marshall, E. Bioinformatics: Hot Property: Biologists Who Compute. Science 1996, 272, 1730–1732. [Google Scholar]
  5. Anfinsen, C. B. Principles that Govern the Folding of Protein Chains. Science 1973, 181, 223–230. [Google Scholar] [CrossRef] [PubMed]
  6. Anfinsen, C. B.; Haber, E.; Sela, M.; White, F. H. The Kinetics of Formation of Native Ribonuclease During Oxidation of the Reduced Polypeptide Chain. Proc. Natl. Acad. Sci. USA 1961, 47, 1309–1314. [Google Scholar] [CrossRef] [PubMed]
  7. Zhang, S.–W.; Pan, Q.; Zhang, H.–C.; Wu, Y.–H.; Shi, J.–Y. Support Vector Machines for Predicting Protein Homo–Oligomers by Incorporating Pseudo–Amino Acid Composition. Internet Electron. J. Mol. Des. 2003, 2, 392–402, http://www.biochempress.com. [Google Scholar]
  8. Zhou, H.; Zhou, Y. Stability Scale and Atomic Solvation Parameters Extracted from 1023 Mutation Experiment. Proteins: Prot. Struc. Funct. Gen. 2002, 49, 483–492. [Google Scholar] [CrossRef]
  9. Alber, T. Mutational Effects on Protein Stability. Annu. Rev. Biochem. 1989, 58, 765–798. [Google Scholar] [CrossRef] [PubMed]
  10. Dill, K. A.; Shortle, D. Denatured State of Proteins. Annu. Rev. Biochem. 1991, 60, 795–825. [Google Scholar] [CrossRef] [PubMed]
  11. Goldenberg, D. P. Genetic Studies of Proteins Stability and Mechanisms of Folding. Annu. Rev. Biophys. Biophys. Chem. 1988, 17, 481–507. [Google Scholar] [CrossRef] [PubMed]
  12. Matthews, B. W. Structural and Genetic Analysis of Protein Stability. Annu. Rev. Biochem. 1993, 62, 139–160. [Google Scholar] [CrossRef] [PubMed]
  13. Shortle, D. Denature States of Proteins and Their Roles in Folding and Stability. Curr. Opin. Struct. Biol. 1993, 3, 66–74. [Google Scholar] [CrossRef]
  14. Knight, K. L.; Bowie, J. U.; Vershon, A. K.; Kelley, R. D.; Sauer, R. T. The Arc and Mnt Repressors: a New Class of Sequence Specific DNA-Binding Protein. J. Biol. Chem. 1989, 264, 3639–3642. [Google Scholar] [PubMed]
  15. Milla, M. E.; Brown, M. B.; Sauer, R. T. Protein Stability Effects of a Complete Set of Alanine Substitutions in Arc Repressor. Struct. Biol. 1994, 1, 518–523. [Google Scholar] [CrossRef]
  16. Bowie, J. U.; Sauer, R. T. Equilibrium Dissociation and Unfolding of the Arc Repressor Dimmer. Biochemistry 1989, 28, 7139–7143. [Google Scholar] [CrossRef] [PubMed]
  17. Milla, M. E.; Saber, R. T. P22 Arc Repressor: Folding Kinetics of a Single Domain, Dimeric Protein. Biochemistry 1994, 33, 1125–1133. [Google Scholar] [CrossRef] [PubMed]
  18. Vershon, A. K.; Bowie, J. U.; Karplus, T. M.; Sauer, R. T. Isolation and Analysis of Arc Repressor Mutants: Evidence for an Unusual Mechanism of DNA Binding. Proteins 1986, 1, 302–311. [Google Scholar] [CrossRef]
  19. Marrero-Ponce, Y.; Romero, V. TOMOCOMD software. Central University of Las Villas. 2002. TOMOCOMD (TOpological MOlecular COMputer Design) for Windows, version 1.0 is a preliminary experimental version; in the future a professional version will be available upon request from Y. Marrero: [email protected]; [email protected].
  20. Marrero-Ponce, Y. Total and Local Quadratic Indices of the “Molecular Pseudograph`s Atom Adjacency Matrix”: Applications to the Prediction of Physical Properties of Organic Compounds. Molecules 2003, 8, 687–726. [Google Scholar] [CrossRef]
  21. Marrero-Ponce, Y. Linear Indices of the “Molecular Pseudograph’s Atom Adjacency Matrix”: Definition, Significance-Interpretation and Application to QSAR Analysis of Flavone Derivatives as HIV-1 Integrase Inhibitors. J. Chem. Inf. Comput. Sci. 2004, 44, 2010–2026. [Google Scholar]
  22. Marrero-Ponce, Y.; Cabrera, M.; Romero, V.; Ofori, E.; Montero, L. A. Total and Local Quadratic Indices of the “Molecular Pseudograph’s Atom Adjacency Matrix”. Application to Prediction of Caco-2 Permeability of Drugs. Int. J. Mol. Sci. 2003, 4, 512–536. [Google Scholar]
  23. Marrero-Ponce, Y.; Cabrera, M. A.; Romero, V.; González, D. H.; Torrens, F. A New Topological Descriptors Based Model for Predicting Intestinal Epithelial Transport of Drugs in Caco-2 Cell Culture. J. Pharm. Pharm. Sci. 2004, 7, 186–199. [Google Scholar] [PubMed]
  24. Marrero-Ponce, Y.; Huesca-Guillen, A.; Ibarra-Velarde, F. Quadratic Indices of the “Molecular Pseudograph’s Atom Adjacency Matrix” and Their Stochastic Forms: A Novel Approach for Virtual Screening and in silico Discovery of New Lead Paramphistomicide Drugs-like Compounds. J. Theor. Chem. (THEOCHEM). [CrossRef]
  25. Marrero-Ponce, Y. Total and Local (Atom and Atom-Type) Molecular Quadratic Indices: Significance-Interpretation, Comparison to Other Molecular Descriptors and QSPR/QSAR Applications. Bioorg. Med. Chem. 2004, 12, 6351–6369. [Google Scholar] [PubMed]
  26. Marrero-Ponce, Y.; González-Díaz, H.; Romero-Zaldivar, V.; Torrens, F.; Castro, E. A. 3D-Chiral Quadratic Indices of the “Molecular Pseudograph’s Atom Adjacency Matrix” and their Application to Central Chirality Codification: Classification of ACE Inhibitors and Prediction of σ-Receptor Antagonist Activities. Bioorg. Med. Chem. 2004, 12, 5331–5342. [Google Scholar]
  27. Marrero-Ponce, Y.; Castillo-Garit, J. A.; Torrens, F.; Romero-Zaldivar, V.; Castro, E. Atom, Atom-Type and Total Linear Indices of the “Molecular Pseudograph’s Atom Adjacency Matrix”: Application to QSPR/QSAR Studies of Organic Compounds. Molecules. in press.
  28. Marrero-Ponce, Y.; Castillo-Garit, J.A.; Olazabal, E.; Serrano, H. S.; Morales, A.; Castañedo, N.; Ibarra-Velarde, F.; Huesca-Guillen, A.; Jorge, E.; del Valle, A.; Torrens, F.; Castro, E.A. TOMOCOMD-CARDD, a Novel Approach for Computer-Aided “Rational” Drug Design: I. Theoretical and Experimental Assessment of a Promising Method for Computational Screening and in silico Design of New Anthelmintic Compounds. J. Comput. Aided Mol. Des. Accepted for publication.
  29. Marrero-Ponce, Y.; Montero-Torres, A.; Romero-Zaldivar, C.; Iyarreta-Veitía, I.; Mayón Peréz, M.; García Sánchez, R. Non-Stochastic and Stochastic Linear Indices of the “Molecular Pseudograph’s Atom Adjacency Matrix”: Application to “in silico” Studies for the Rational Discovery of New Antimalarial Compounds. Bioorg. Med. Chem. [CrossRef]
  30. Marrero-Ponce, Y.; Castillo-Garit, J.A.; Olazabal, E.; Serrano, H. S.; Morales, A.; Castañedo, N.; Ibarra-Velarde, F.; Huesca-Guillen, A.; Jorge, E.; Sánchez, A. M.; Torrens, F.; Castro, E. A. Atom, Atom-Type and Total Molecular Linear Indices as a Promising Approach for Bioorganic & Medicinal Chemistry: Theoretical and Experimental Assessment of a Novel Method for Virtual Screening and Rational Design of New Lead Anthelmintic. Bioorg. Med. Chem. [CrossRef]
  31. Marrero-Ponce, Y.; Nodarse, D.; González-Díaz, H.; Ramos de Armas, R.; Romero-Zaldivar, V.; Torrens, F.; Castro, E. Nucleic Acid Quadratic Indices of the “Macromolecular Graph’s Nucleotides Adjacency Matrix”. Modeling of Footprints after the Interaction of Paromomycin with the HIV-1 Ψ-RNA Packaging Region. Int. J. Mol. Sci. 2004, 5, 276–293, (see also CPS: physchem/0401004). [Google Scholar]
  32. Bowie, J. U.; Sauer, R. T. Identifying Determinants of Folding and Activity for a Protein of Unknown Structure. Proc. Natl. Acad. Sci. USA 1989, 86, 2152–2156. [Google Scholar] [CrossRef] [PubMed]
  33. Milla, M. E.; Brown, M. B.; Sauer, R. T. P22 Arc Repressor: Enhanced Expression of Unstable Mutants by Addition of Polar C-Terminal Sequences. Protein Sci. 1993, 2, 2198–2205. [Google Scholar] [CrossRef] [PubMed]
  34. Alberts, B.; Bray, D.; Lewis, J.; Raff, M.; Roberts, K.; Watson, J. D. Molecular Biology of the Cell; Garland: New York and London, 1994.
  35. Freifelder, D. Molecular biology. A Comprehesive Introduction to Prokariotes and Eukaryotes; Editorial Revolucionaria: Havana, 1983. [Google Scholar]
  36. Lehninger, A. L.; Nelson, D. L.; Cox, M. M. Principles of Biochemistry; Worth Publishers: New York, 1993. [Google Scholar]
  37. Mathews, C. K.; van Holde, K. E.; Ahern, K. G. Biochemistry; Addison Wesley Longman: San Francisco, 2000. [Google Scholar]
  38. Stryer, L. W. H. Biochemistry; W. H. Freeman and Company: New York, 1995. [Google Scholar]
  39. Charton, M.; Charton, B. I. The Dependence of the Chou-Fasman Parameters on Amino Acid Side Chain Structure. J. Theor. Biol. 1983, 102, 121–134. [Google Scholar] [CrossRef] [PubMed]
  40. Hellberg, S.; Sjöström, M.; Skagerberg, B.; Wold, S. Peptide Quantitative Structure-Activity Relationship, a Multivariate Approach. J. Med. Chem. 1987, 30, 1126–1135. [Google Scholar] [CrossRef] [PubMed]
  41. Hellberg, S.; Sjöström, M.; Wold, S. The Prediction of Bradykinin Potentiating Potency of Pentapeptides. An Example of a Peptide Quantitative Structure-Activity Relationship. Acta Chem. Scand., Sect. B 1986, 135–140. [Google Scholar]
  42. Jonsson, J.; Eriksson, L.; Hellberg, S.; Sjöström, M.; Wold, S. Multivariate Parametrization of 55 Coded and Non-Coded Amino Acid. Quant. Struct. Act. Relat. 1989, 8, 204–209. [Google Scholar] [CrossRef]
  43. Collantes, E. R.; Dunn III, W. J. Amino Acid Side Chain Descriptors for Quantitative Structure-Activity Relationship Studies of Peptide Analogues. J. Med. Chem. 1995, 38, 2705–2713. [Google Scholar]
  44. Harary, F. Graph Theory; Addison-Wesley: Reading, MA, 1969; p. 10. [Google Scholar]
  45. Chartrand, G. Graph as Mathematical Models; Prindle, Weber & Schmidt: Boston, MA, 1977; p. 22. [Google Scholar]
  46. Wilson, R. J. Introduction to Graph Theory; Oliver & Boyd: Edinburgh, 1972; p. 10. [Google Scholar]
  47. Trinajstic, N. Chemical Graph Theory, 2nd edition; CRC Press: Boca Raton, FL, 1992; pp. 6–7. [Google Scholar]
  48. Todeschini, R.; Consonni, V. Handbook of molecular descriptors; Wiley VCH: Weinheim, Germany, 2000. [Google Scholar]
  49. Randić, M. Generalized Molecular Descriptors. J. Math. Chem. 1991, 7, 155–168. [Google Scholar] [CrossRef]
  50. STATISTICA version. 5.5; Statsoft, Inc.: Tulsa, OK, USA, 1999.
  51. McFarland, J. W.; Gans, D. J. Linear Discrminant Analysis and Cluster Significance Analysis. In Comprehesive Medicinal Chemistry; Hansch, C., Sammes, P. G., Taylor, J. B., Eds.; Pergamon Press: Oxford, 1990; pp. 667–689. [Google Scholar]
  52. Wold, S.; Erikson, L. Statistical Validation of QSAR Results. Validation Tools. In Chemometric Methods in Molecular Design; van de Waterbeemd, H., Ed.; VCH Publishers: New York, 1995; pp. 309–318. [Google Scholar]
  53. Golbraikh, A.; Tropsha, A. Beware of q2! J. Mol. Graphics. Mod. 2002, 20, 269–276. [Google Scholar] [CrossRef]
  54. Estrada, E.; Patlewicz, G. On the Usefulness of Graph-theoretic Descriptors in Predicting Theoretical Parameters. Phototoxicity of Polycyclic Aromatic Hydrocarbons (PAHs). Croat. Chem. Acta. 2004, 77, 203–211. [Google Scholar]
  55. van de Waterbeemd, H. Discriminant Analysis for Activity Prediction, In Chemometric Methods in Molecular Design; van de Waterbeemd, H., Ed.; VCH Publishers: New York, 1995; pp. 265–282. [Google Scholar]
  56. Ford, M.-G.; Salt, D.-W. The Use of Canonical Correlation Analysis. In Chemometric Methods in Molecular Design; van de Waterbeemd, H., Ed.; VCH Publishers: New York, 1995; pp. 283–292. [Google Scholar]
  57. Estrada, E.; Peña, A. In Silico Studies for the Rational Discovery of Anticonvulsant Compounds. Bioorg. Med. Chem. 2000, 8, 2755–2770. [Google Scholar] [CrossRef] [PubMed]
  58. Estrada, E.; Peña, A.; García-Domenech, R. Designing Sedative/Hynotic Compounds from a Novel Substructural Graph-Theoretical Approach. J. Comput.–Aided Mol. Des. 1998, 12, 583–595. [Google Scholar]
  59. Estrada, E.; Uriarte, E.; Montero, A.; Teijeira, M.; Santana, L.; De Clercq, E. A. Novel Approach for the Virtual Screening and Rational Design of Anticancer Compounds. J. Med. Chem. 2000, 4, 1975–1985. [Google Scholar]
  60. González, D. H.; Marrero-Ponce, Y.; Hernández, I.; Bastida, I.; Tenorio, E.; Nasco, O.; Uriarte, E.; Castañedo, N.; Cabrera, M. A.; Aguila, E.; Marrero, O.; Morales, A.; Pérez, M. 3D-MEDNEs: an Alternative "in silico" Technique for Chemical Research in Toxicology. 1. Prediction of Chemically Induced Agranulocytosis. Chem. Res. Toxicol. 2003, 16, 1318–1327. [Google Scholar]
  61. González, H.; Ramos, R.; Molina, R. Markovian Negentropies in Bioinformatics. 1. A Picture of Footprints after the Interaction of the HIV-1 ψ-RNA Packaging Region with Drugs. Bioinformatics 2003, 16, 2079–2087. [Google Scholar]
  62. González, H.; Ramos, R.; Molina, R. Vibrational Markovian Modelling of Footprints after the Interaction of Antibiotics with the Packaging Region of HIV Type 1. Bull. Math. Biol. 2003, 65, 991–1002. [Google Scholar] [CrossRef] [PubMed]
  63. Gozalbes, R.; Gálvez, J.; Moreno, A.; Garcia-Domenech, R. Discovery of New Antimalarial Compoundss by Use of Molecular Connectivity Techniques. J. Pharm. Pharmacol. 1999, 51, 111–117. [Google Scholar] [CrossRef] [PubMed]

