Article

Using Variable and Fixed Topological Indices for the Prediction of Reaction Rate Constants of Volatile Unsaturated Hydrocarbons with OH Radicals

by
Matevž Pompe
1,*,
Marjan Veber
1,
Milan Randić
2 and
Alexandru T. Balaban
3
1
Faculty of Chemistry and Chemical Technology, University of Ljubljana, Aškerčeva 5, 1000 Ljubljana, Slovenia
2
National Institute of Chemistry, Hajdrihova 19, 1000 Ljubljana, Slovenia
3
Texas A&M University at Galveston, 5007 Avenue U, Galveston, TX 77551, USA
*
Author to whom correspondence should be addressed.
Molecules 2004, 9(12), 1160-1176; https://doi.org/10.3390/91201160
Submission received: 5 August 2004 / Revised: 1 December 2004 / Accepted: 1 December 2004 / Published: 31 December 2004

Abstract

:
Volatile organic compounds (VOCs) play an important role in different photochemical processes in the troposphere. In order to predict their impact on ozone formation processes a detailed knowledge about their abundance in the atmosphere as well as their reaction rate constants is required. The QSPR models were developed for the prediction of reaction rate constants of volatile unsaturated hydrocarbons. The chemical structure was encoded by constitutional and topological indices. Multiple linear regression models using CODESSA software was developed with the RMSCV error of 0.119 log units. The chemical structure was encoded by six topological indices. Additionally, a regression model using a variable connectivity index was developed. It provided worse cross-validation results with an RMSCV error of 0.16 log units, but enabled a structural interpretation of the obtained model. We differentiated between three classes of carbon atoms: sp2-hybridized, non-allylic sp3-hybridized and allylic sp3-hybridized. The structural interpretation of the developed model shows that most probably the most important mechanisms are the addition to multiple bonds and the hydrogen atom abstraction at allylic sites.

Introduction

The reactions of volatile organic compounds (VOCs) of biogenic and anthropogenic origin play an important role in different atmospheric photochemical processes. The major degradation pathway of VOCs in the atmosphere is reaction with hydroxyl radicals. Although extensive experimental work has been carried out during the last several years on measurement of kinetic parameters, experimental reaction rate constants are only available for approximately 500 VOCs [1,2,3]. In order to reduce analysis time and costs of such measurements it would be useful to develop a prediction model to estimate these values. Recently, several quantitative structure property relationship (QSPR) prediction models were developed to predict reaction rate constants for the reaction of OH radicals with different organic species. These models estimated reaction rate constants based on empirical fragment contribution technique [4,5,6], bond dissociation energy [7,8,9], NMR chemical shift data [10], ionization potentials [11,12,13], molecular orbital calculations [14,15,16,17,18,19,20,21] and various structural descriptors [22,23,24,25,26,27]. A comprehensive overview [28] of these method and their partial evaluations were recently published [29]. These methods offered models with, at least, moderate prediction capabilities. However, their use was mostly restricted because of a limited knowledge about the reaction pathways, limited databases with experimental molecular properties, or due to the extensive computations necessary for ab initio molecular orbital calculations. All these drawbacks are bypassed in QSPR models using molecular structural descriptors.
Constitutional, topological, geometric, electronic, and quantum chemical indices have been already used for the prediction of different chemical or physical properties [30,31]. Among them topological indices represent a very promising group of structural descriptors, not only because they are easy to calculate, but because in most cases they offer good correlations with the modeled property. Wiener [32] and Platt [33] did the pioneering work in the field of topological indices in late 1940s, however it was not until the early 1970’s that the idea of representing chemical structures by graph invariants was resurrected and further developed by several authors [34,35,36,37,38]. Because of their ability to yield good prediction models [39,40], in more recent years we have seen a rapid expansion of novel molecular descriptors derived from molecular graphs. The question can be raised whether there is a true need for hundreds of topological descriptors even though they may represent different structural features of the molecule in view that many of them are highly interrelated. Typically half a dozen descriptors are used to obtain satisfactory regressions. An alternative to this was suggested a decade ago [41,42] but only recently has been re-employed. Instead of using a large pool of descriptors to extract half a dozen of topological indices for the prediction models, a single index or very few indices involving variable parameters were constructed and optimized during the modeling procedure [43,44]. We should also mention here the work of Pogliani [45], who used limited combinations of dozen generalized connectivity indices also involving variable parameters.
In this work we have tested the coding abilities of topological indices in prediction of gas-phase reaction rate constants for the reaction of different organic compounds with OH radical. A multiple linear regression (MLR) model was used as a modeling technique. In addition, the prediction ability of the variable connectivity index (χ1f) was tested. The final prediction results were compared with previously published data.

Experimental

Data set (Unsaturated Hydrocarbons)

In this study we considered a data set taken from the literature [26], which contains 58 unsaturated acyclic and cyclic organic compounds with three to ten carbon atoms (Table 1). The reaction rate constants were obtained at a temperature of 298 K. The listed numerical values are the negative logarithm of the reaction rate constant (kOH) reported in cm3 molecule-1 s-1. The test set compounds are marked by asterisk. We have selected the same test set as in the literature [26] in order to compare prediction capabilities of the models.
Table 1. Experimental, cross-validated and predicted -log kOH values (n=58)
IDNameExperimentalCalculated
MLR
Calculated χ1f
(model 1)
Calculated χ1f
(model 2)
1α-terpinene9.449.519.499.59
2α-phellandrene9.509.739.579.72
3trans-β-ocimene9.609.549.589.50
4terpinolene*9.659.499.649.65
5myrcene9.679.709.619.53
62,5-dimethyl-2,4-hexadiene9.689.719.859.78
7γ-terpinene9.759.559.579.60
8Δ-limonene9.779.729.829.69
9β-phellandrene9.789.949.699.86
101,3-cyclohexadiene9.799.889.869.93
11trans,trans-2,4-hexadiene9.879.9410.0610.03
12trans –4-methyl-1,3-pentadiene9.8810.0410.0610.03
132,3-dimethyl-1,3-butadiene*9.919.8110.0510.13
142,5-dimethyl-1,5-hexadiene9.929.839.959.84
15bicyclo[2.2.1]-2,5-heptadiene9.929.999.909.85
16trans –1,3-hexadiene9.9510.0910.0910.11
17trans –1,3,5-hexatriene9.969.929.929.97
18cis-1,3,5-hexatriene9.969.939.929.97
192,3-dimethyl-2-butene9.969.9610.1810.09
201,3-pentadiene10.0010.0410.0510.17
212-methyl-1,3-butadiene10.0010.1010.1610.16
221,4-cyclohexadiene10.009.939.969.94
231,3,5-cycloheptatriene10.019.569.709.72
242-methyl-1,5-hexadiene10.0210.0810.059.96
25trans -1,4-hexadiene10.0410.1110.1210.06
262-methyl-2-pentene*10.0510.0010.2210.13
27Δ3-carene10.0610.0910.0910.09
282-methyl-2-butene10.0610.0910.2910.22
29β-pinene10.1010.2310.1510.11
30cycloheptene10.1310.1810.2510.22
31trans -4-octene10.1610.1010.1310.22
32trans -2-heptene10.1710.1210.2010.26
33cyclohexene10.1710.1810.2810.24
34cyclopentene10.1710.2610.3110.26
35trans -2-pentene10.1810.1410.3310.30
361,3-butadiene10.1810.3410.2610.28
37cis -2-pentene10.1810.1510.3310.30
38trans -2-butene10.1910.2810.3910.34
392-methyl-1-pentene10.2010.1310.2610.28
401,5-hexadiene10.2110.3610.1510.09
412-methyl-1-butene10.2210.1310.3210.30
42trans -4-methyl-2-pentene10.2210.1310.2610.26
433-methyl-1,2-butadiene10.2510.3310.2210.19
44cis -2-butene10.2510.2910.3910.34
45α-pinene10.2710.0210.0110.01
461,4-pentadiene*10.2710.3510.2210.13
47camphene10.2710.1610.1410.06
482-methylpropene*10.2910.2510.3810.13
491-heptene10.3910.3810.2310.37
501-hexene10.4310.3710.2910.39
511,2-pentadiene10.4510.4210.2510.27
523-methyl-1-butene10.5010.4010.3510.38
531-pentene10.5010.4010.3510.41
541-butene10.5010.4410.4210.42
553,3-dimethyl-1-butene10.5510.4810.2910.34
561,2-butadiene10.5810.5710.3110.31
57propadiene11.0110.7610.3910.44
58sabinene9.9310.0610.0910.11
* test set

Calculation and selection of topological indices using CODESSA software

All molecular structures were created using HyperChemTM. By using the CODESSA software [46,47] 76 invariants were calculated for the structures, which were either informational or topological molecular descriptors. These descriptors contain information about the connectivity between atoms, molecular branching and molecular symmetry, and are sensitive to variation in shape between molecules of similar size.
The CODESSA software was also used for the selection of best subset of structural descriptors by minimizing the error in cross-validation using MLR model. Descriptors with no variation between structures, descriptors that did not cover the whole modeling space, and descriptors with very low coefficient of determination when used as single variable were omitted from the further consideration. We excluded descriptors giving the coefficient of determination (r2), where r is the coefficient of the regression, smaller than 0.01. Subsequently we also eliminated highly inter-correlated descriptors on the basis that they represent duplication. Thus, if the squared pair-wise correlation coefficient for two descriptors exceeded 0.99, one of the descriptors was omitted. Both conditions for omitting descriptors (the low coefficient of determination and the high inter-correlation) are somewhat arbitrary, and as it is known may filter out otherwise useful descriptors [48]. As a result the selected combinations that under such conditions CODESSA generate may not be unique, but will produce acceptable regression equations.
The descriptors that passed the selection process were sorted in the decreasing order of r2 when used in a simple linear regression model. In this way the best ten descriptors were selected. To these pre-selected descriptors a new descriptor was added from the set of the remaining descriptors if it did not show pair-wise correlation higher than 0.8. Finally the ten best two parameter models showing the highest Fisher ration in the two-parameter models were selected and used as the working set. New descriptors were added until an MLR model with the prescribed number of variables was obtained. During each step of the formation of the MLR model a new descriptor is added to the working set if it does not correlate with the descriptors already included and produces higher normalized Fisher ratio F. Again we accepted a descriptor if r2 is below 0.8 and if Fnew > n/(n+1)•Fold, where n is the number of descriptors in the new working set. In this way through stepwise addition procedure we arrived to the final ten correlations with the highest r2. The derived correlations were tested for their cross-validation capabilities by leave-one-out cross validation procedure. The model with the highest q2 (squared correlation coefficient in cross-validation) was selected as the best n-parameter MLR model. In order to test significance of descriptors selected to the prediction model a t-test and partial-F statistics were calculated for each parameter of the model. A more detailed description of stepwise selection procedure can be found in CODESSA manual [47]. Prediction capability of final models was evaluated by using test set.
We feel that very low limits for elimination that were chosen, that is, one parameter and pair-wise correlation coefficient were less than 0.01 and greater than 0.8, respectively, offer considerable assurance that important descriptors would not been omitted in the selection process. As mentioned it was already reported in the literature that linear correlation of highly correlated parameters, which individually do not correlate well with the studied property, can yield a very good correlation [48]. But at the same time the limits of elimination are strict enough that the chances of obtaining insignificant coefficients in MLR model are low.

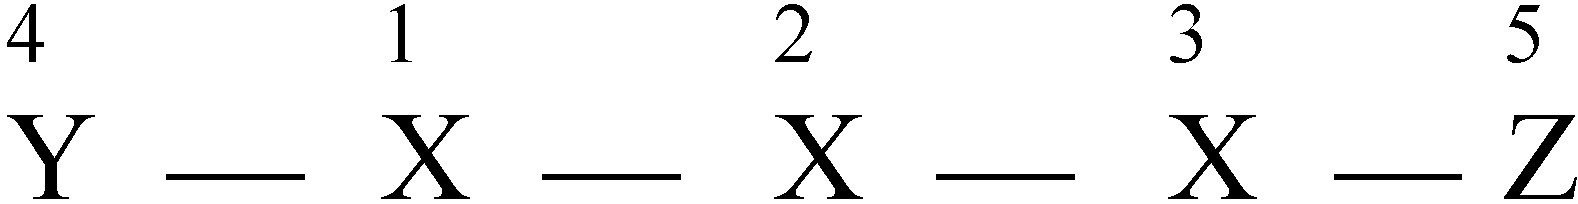
The variable connectivity index (χ1f)

Only rarely is a single descriptor capable of describing sufficiently well the molecular structure to allow a simple regression to be used for the modeling of chosen property. As a rule, additional descriptors are needed to get regression equations if one hopes to obtain satisfactory prediction of molecular properties. In constructing MLR basically two alternative approaches are possible. One can apply statistical methods to select information-rich significant descriptors from a large pool of descriptors or one can use a smaller set of well-selected structurally related descriptors that form a basis that sufficiently well covers the structure-property space for molecules and properties considered. The first approach, which does not require a critical examination of descriptors, is often used, but it offers a limited interpretation of the derived regression model. The second approach, based on combinations of structurally related descriptors received a limited attention [49,50], except perhaps when confined to the connectivity index [35] (1χ) and the higher order connectivity indices mχ [51], including also the valence connectivity indices of Kier and Hall [38,52]. Such an approach enables less cumbersome structural interpretation of the regression analysis. Both these approaches, the use of a pool of descriptors and the use of basis descriptors, could dramatically improve the quality of the regression analysis if the selected descriptors were designed specifically for the particular application. One of the possibilities is to modify or adjust an already available descriptor for the particular property.
One of apparent disadvantages of the original connectivity index 1χ is its inability to differentiate between different types of atoms and bonds. Kier and Hall recognized a need for the modification of the connectivity indices to describe molecules with heteroatoms. Similar modifications have been introduced since then for other graph theoretical descriptors that were initially designed for hydrocarbons [53]. In these modifications one assigns different weights to heteroatoms and multiple bonds. However, when prescribing relative contribution of heteroatoms or multiple bonds such approaches involve some degree of arbitrary decisions. Although in a number of applications the valence connectivity indices gave better results than would be otherwise the case, in some cases discrimination of heteroatoms by the use of valence connectivity indices produce even worse results than the results based on the ordinary connectivity index. An example, already illustrated in the book of Kier and Hall [38] was the case of water solubility of aliphatic ethers, which is represented better with the simple connectivity index 1χ (that does not differentiate between carbon and oxygen atoms) than the valence connectivity index 1χv. Dozens of similar correlations involving selected properties of ethers and alcohols have been listed in brief review on the developments involving the connectivity index after its 25 years of use [54]. At that time apparently not much attention was given to this anomaly, which implied that different properties might require different optimal weights to be used when discriminating among heteroatoms. It was only with the development of the variable connectivity index that this has been recognized, even though such results could have been expected because individual heteroatoms influence different properties of the molecule in different ways.
The idea behind the variable connectivity index, where contributions of different atoms or different kind of bonds are varied during the optimization process, is to allow relative contributions of different atoms and bonds to be adjusted so to produce the smallest standard error for the regression. Hence, instead of screening a large pool of descriptors in order to select few for describing regression, variable molecular descriptors allow one to construct relatively small number of relevant descriptors, from which the best are selected. Calculation of the variable connectivity index, for which we use symbol with superscript f to suggest that it is a function rather than a constant, hence (χ1f), for a hypothetical linear molecule YX3Z (Figure 1) is illustrated in Table 2.
Figure 1. Hypothetical linear molecule YX3Z
Molecules 09 01160 g001
Table 2. Augmented adjacency matrix for the hypothetical compound YX3Z
12345Row sum
1y10101+y
21x1002+x
301x012+x
4100x02+x
50010z1+z
Molecules 09 01160 i001
First we augment the adjacency matrix of a graph by introduction of non-zero diagonal entries. The variables x, y, and z on the diagonal of the matrix will alter the atomic contributions to the connectivity index. In general one can assign individual weights to every atom present in the molecule, but this would lead to a large number of variables that need to be determined. Such an optimization would require large data sets, and besides being computationally intensive, it may produce non-general models in which there may be less significant differences among structurally similar molecular fragments. To avoid these problems one should try to construct models in which structurally similar fragments (atoms and bonds in similar immediate environment, in particular) should be described by the same variable parameters, which will consequently maintain the number of variables rather low.
As has been illustrated in the literature [41,42,43,44,55,56,57,58,59,60,61,62,63,64], by using variable descriptors the quality of correlations can be significantly improved. Equally important is that use of variable descriptors may allow a novel structural interpretation of the results when the optimized weights could be related to other physico-chemical properties of compounds. For instance, the connectivity index is a bond additive quantity in which the bond contributions are given by (m•n)-1/2. As a consequence primary, secondary, tertiary, and quaternary carbon atoms make different contributions to bond-additive properties. Here m and n represents row sums in adjacency matrix of the atoms, which are forming bonds. By a close evaluation of the influence of optimized weights on the connectivity index we can get information on which structural features of the molecule may play more important role for the particular structure-property study.

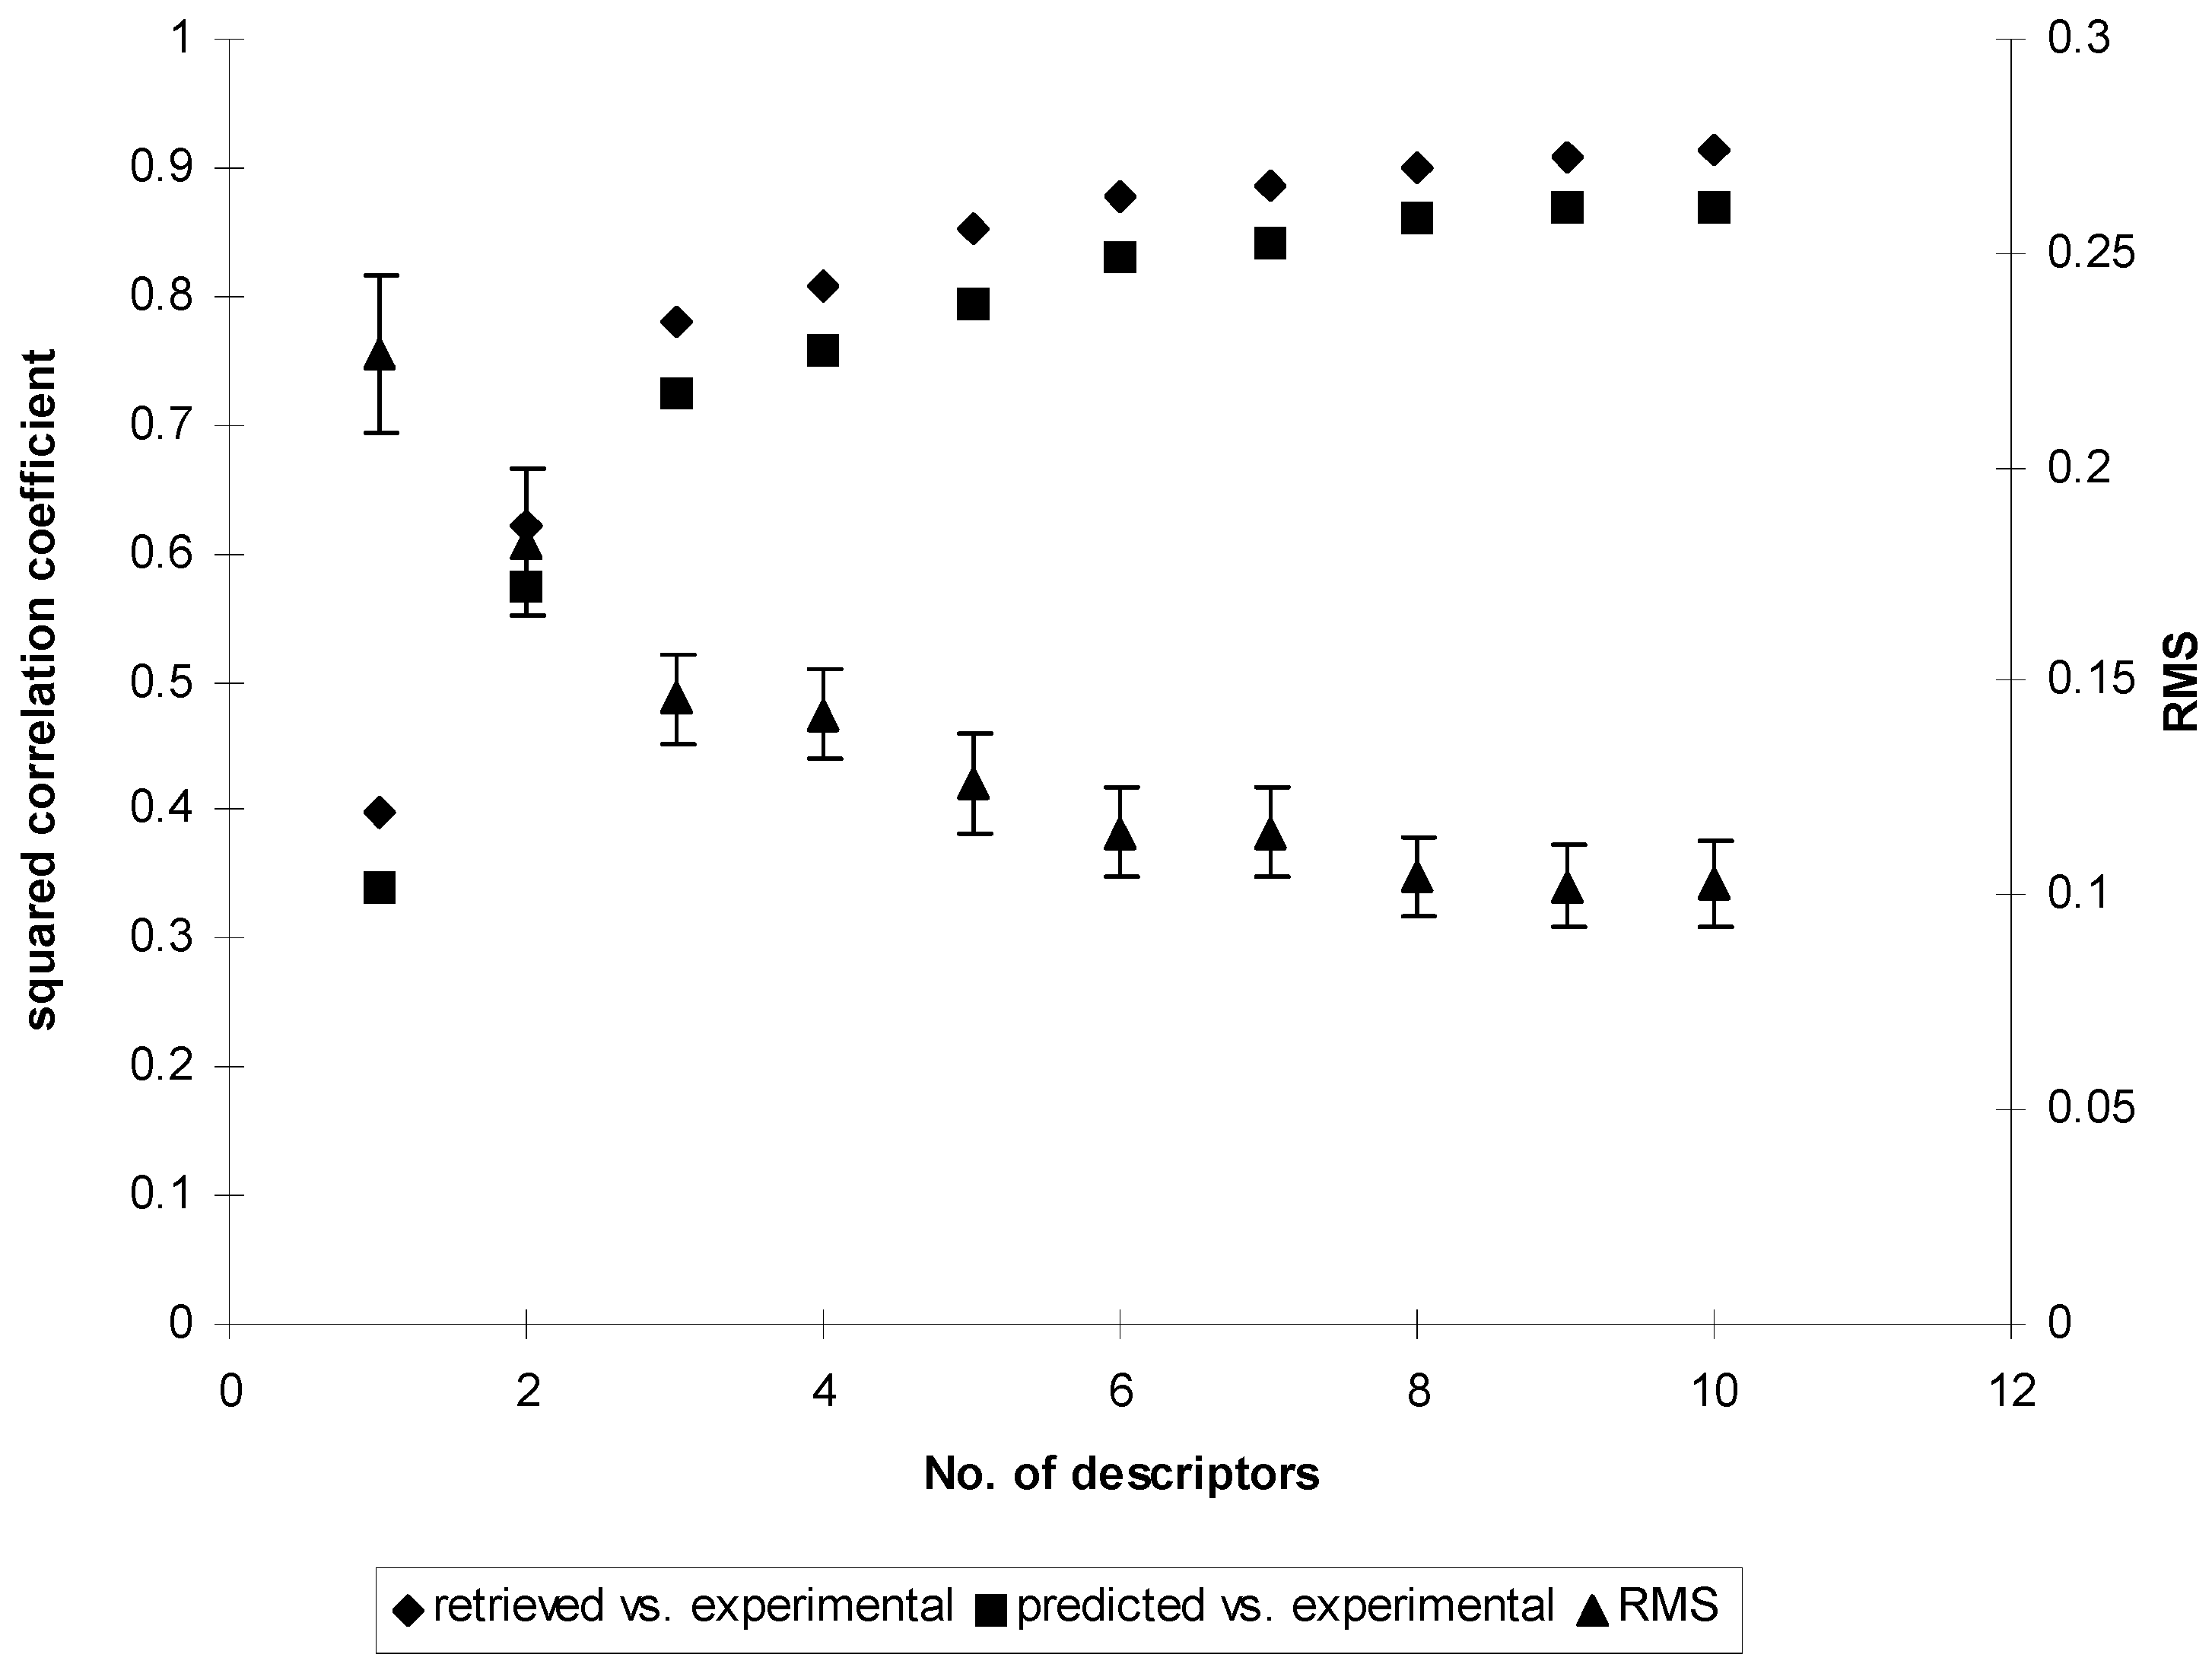
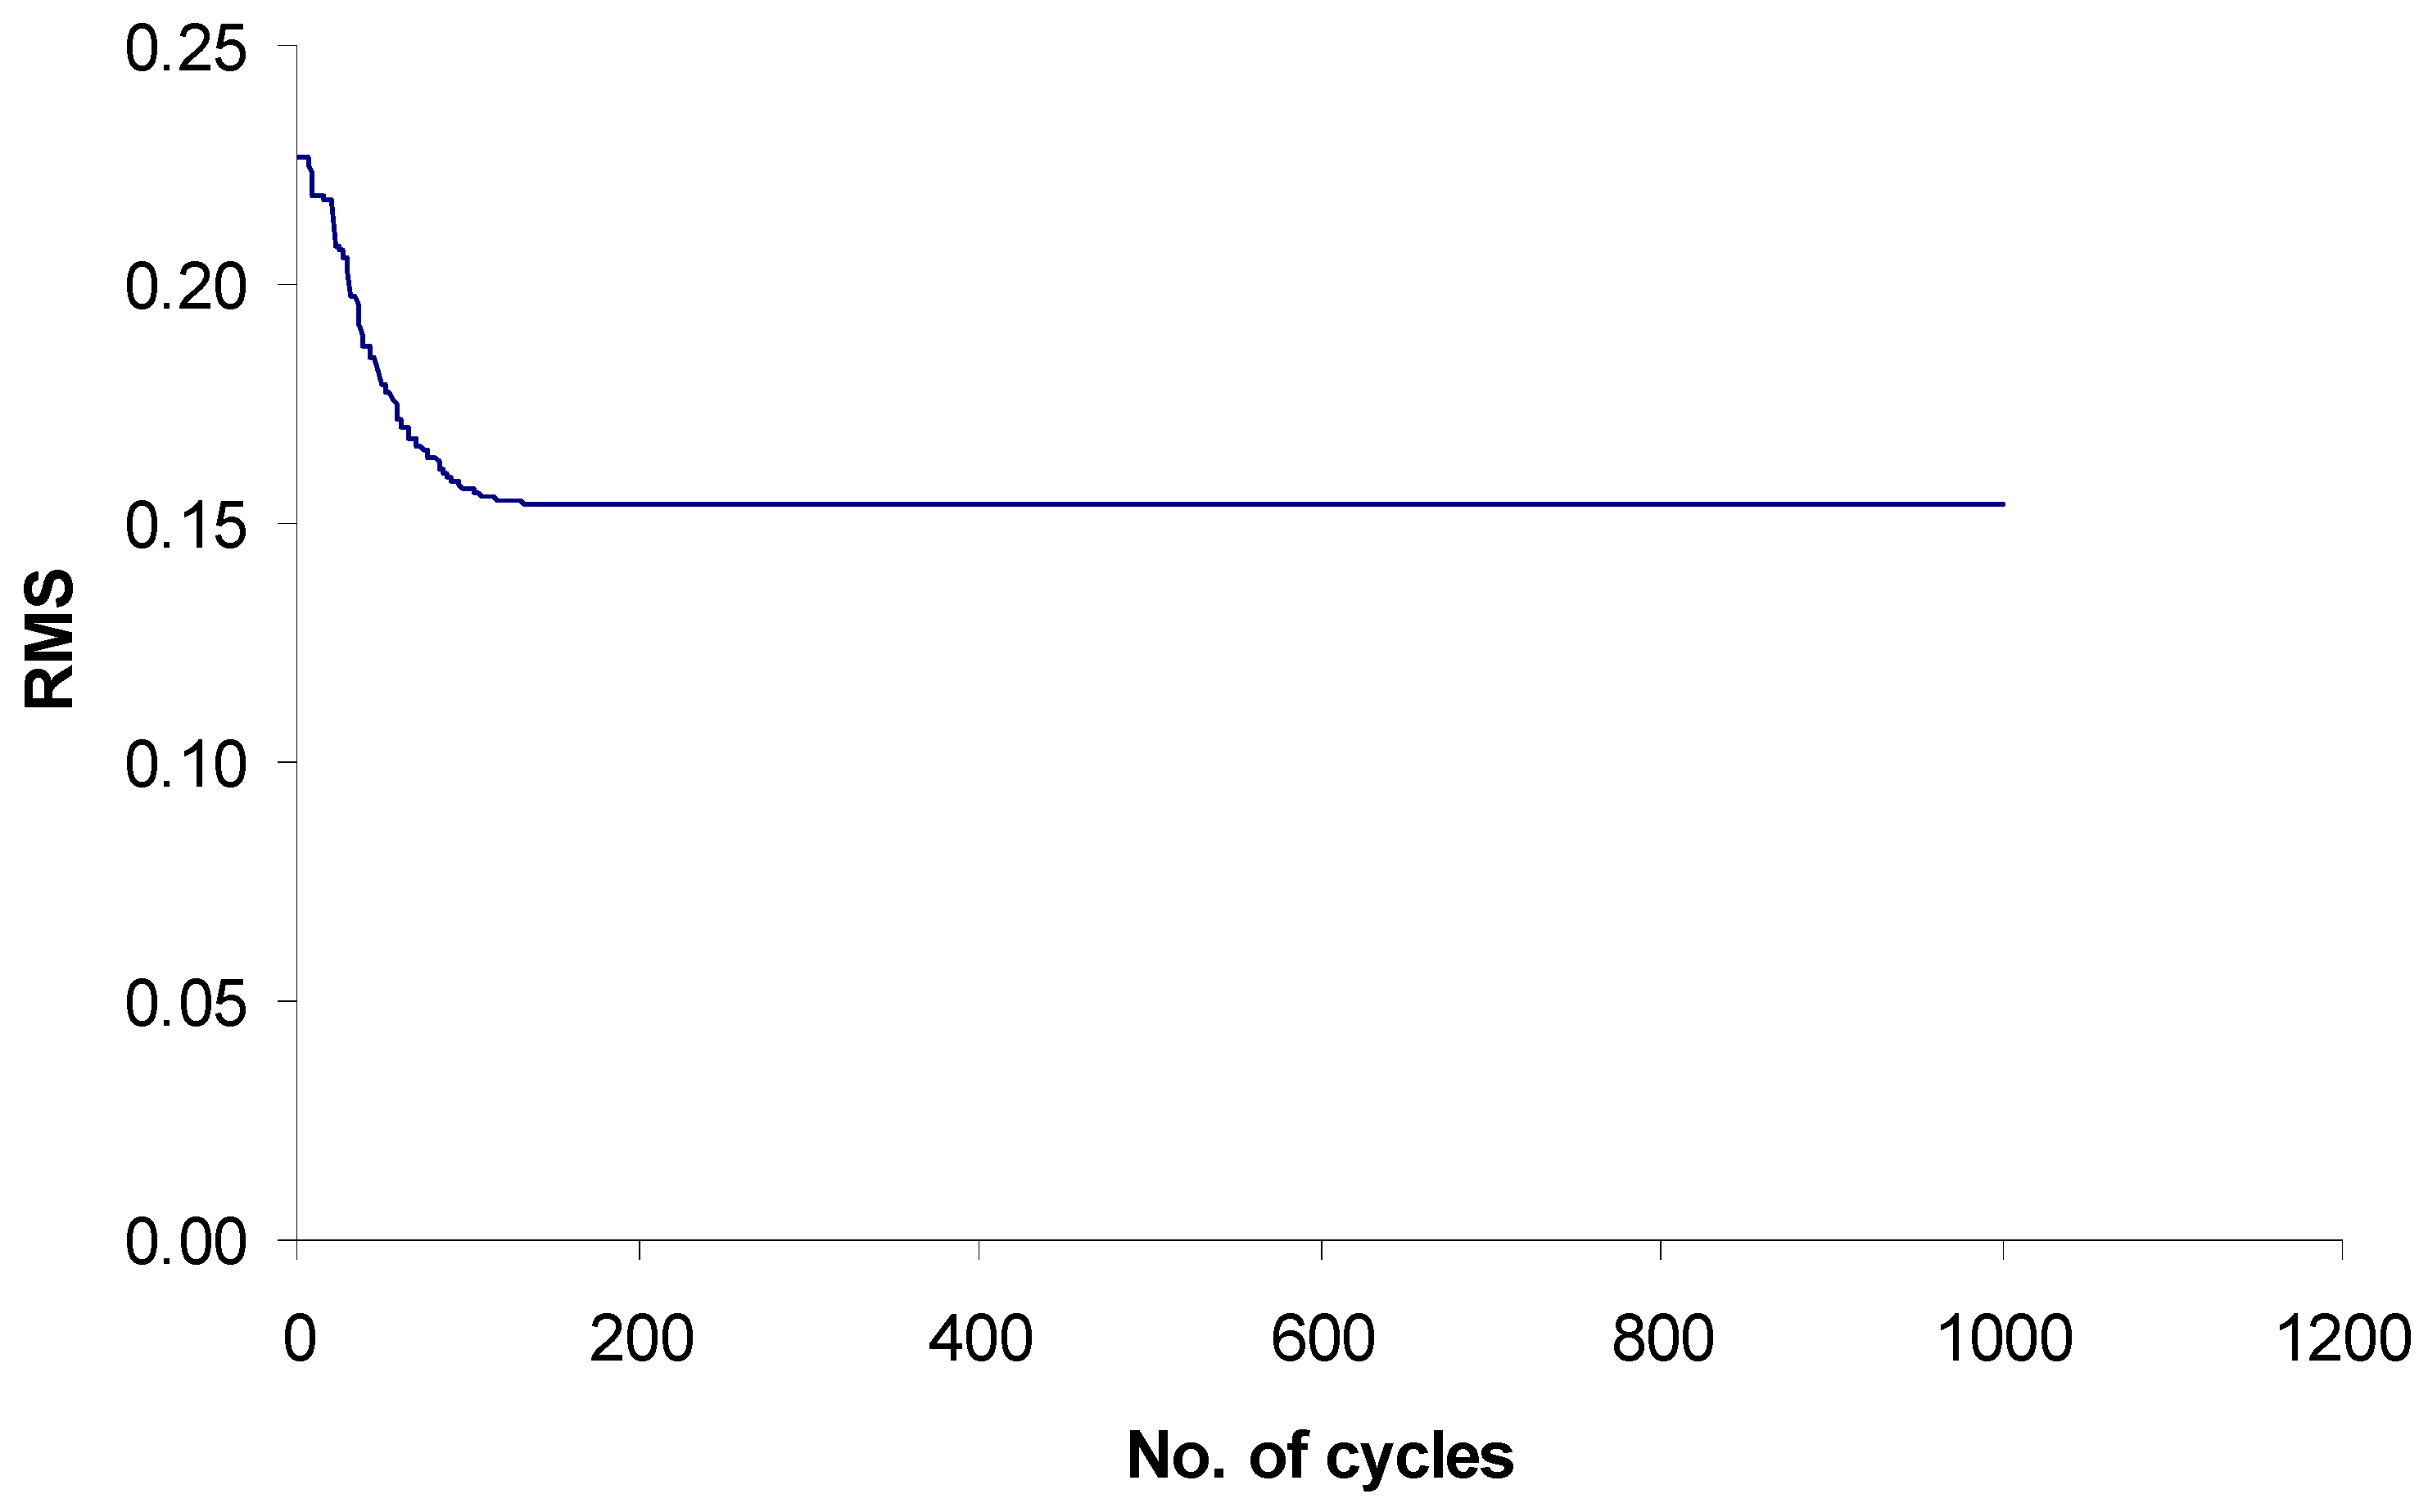
Search for optimal weights in χ1f and evaluation of quality of the models

Optimal values of weights used in calculation of χ1f were obtained using a Simplex [65] optimization procedure. At the start of optimization one assigns to various weights in the augmented adjacency matrices random values, which however are subject to certain limits to avoid occurrence of complex numbers. The Simplex algorithm was used to find the weights that would minimize the standard error in a linear correlation log kOH = a f(χ1f) + b. As is known the Simplex optimization may rest in any of present local minima, rather than total minimum. In order to reduce chance of selecting local minima, the simplex optimization was performed several times starting with different set of random numbers.
The generality of the obtained model was evaluated by leave-one-out cross validation procedure. The root-mean-squared (RMS) error of test set served as an estimate of prediction capabilities of the linear regression model created from optimized connectivity index.

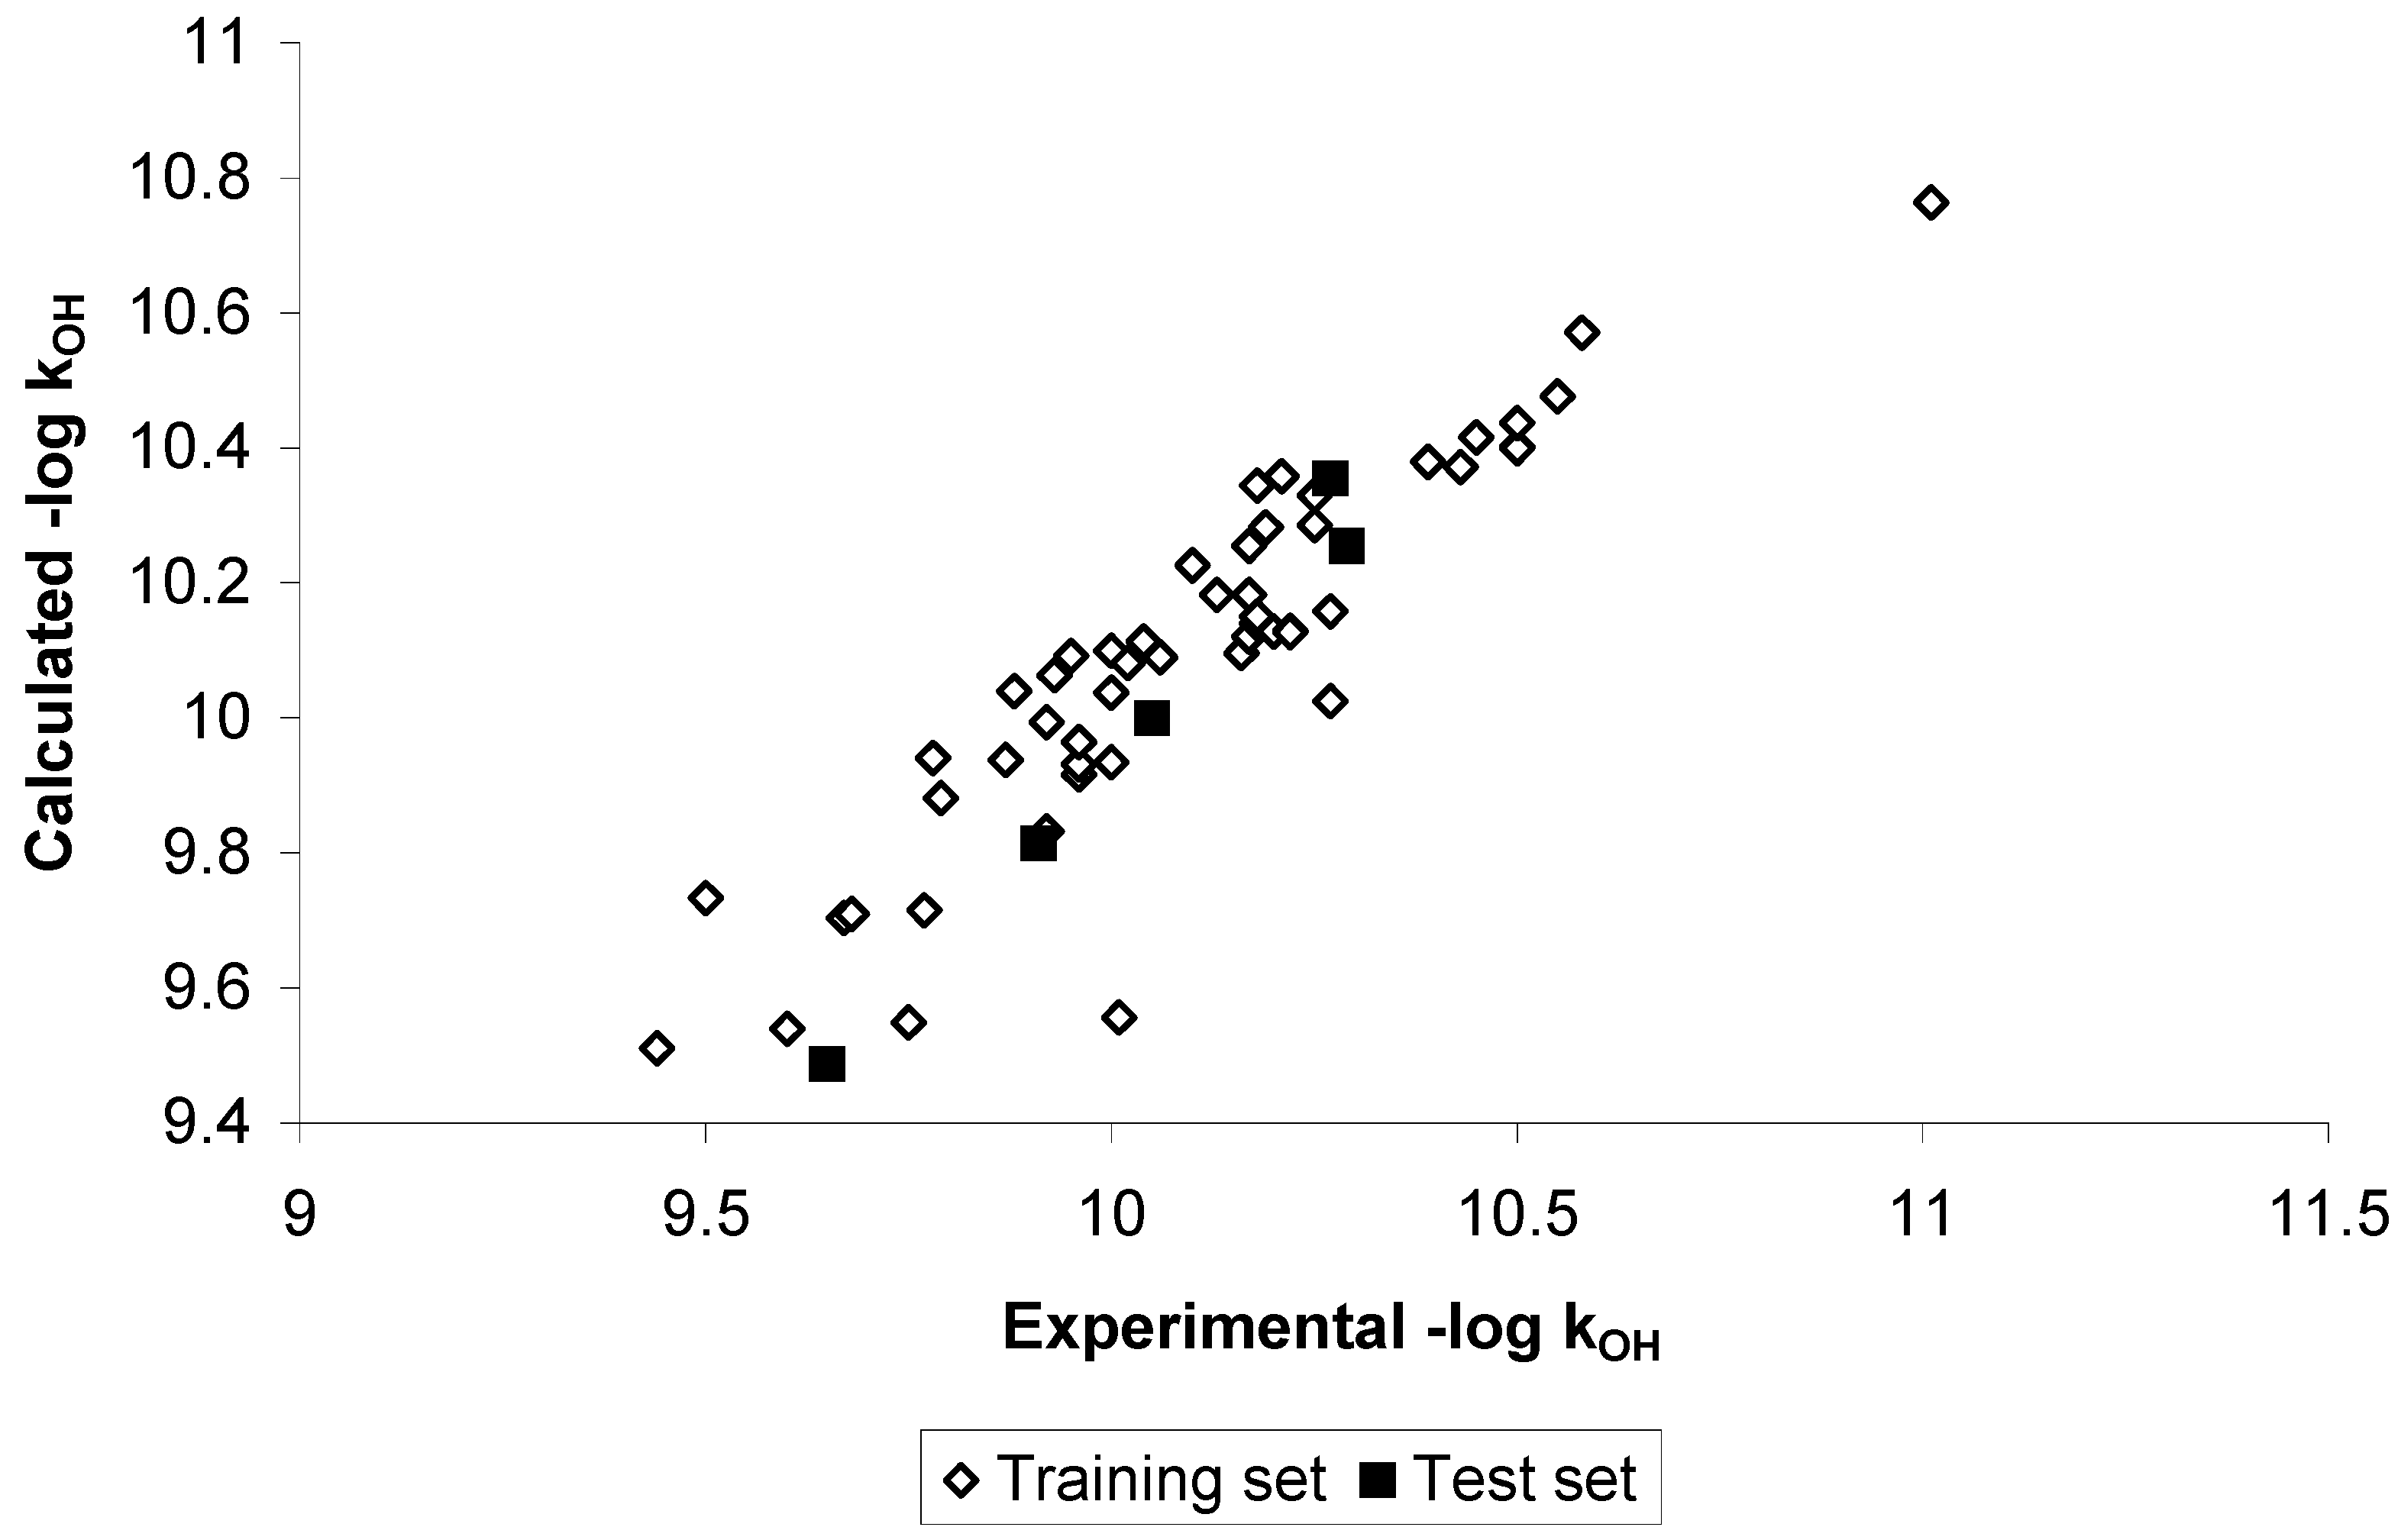
Results and Discussion

Hydroxyl radical reactions are grouped into four reaction classes: (1) hydrogen atom abstraction, (2) addition to multiple bonds, (3) addition to aromatic rings, and (4) reaction to aromatic rings [1,6]. Since all 58 compounds contained one or more C=C double bonds, all reactions belong to second class of reactions with OH radicals, that is, the radical addition to multiple bonds. Training set compounds were used during model creation.
Figure 2. The influence of the number of selected parameters of the MLR model on r2, q2 and RMSCV values
Molecules 09 01160 g002
At the beginning 76 informational and topological descriptors for each compound were calculated using CODESSA software. After elimination of descriptors that did not satisfy our criteria on being of sufficient interest we were left with a pool of 34 descriptors to be tested in the step-wise selection for selection of optimal combination of descriptors. The MLR models with up to 10 parameters were selected based on the best cross-validation capabilities obtained by leave-one-out cross-validation procedure. The influence of the number of selected descriptors of the MLR model on r2, q2, and RMSCV values is shown in Figure 2.
We can see that r2 and q2 increase from about 0.4 and 0.35 respectively, the values for single descriptor, to the asymptotic values close to 0.90 and 0.85, respectively as the number of descriptors has increased from one to ten. In the same figure we also illustrated the decrease of the RMSCV values. The error bars in Figure 2 for RMSCV represent calculated standard deviation of estimates. Though the increase of both r2 and q2 and the decrease of RMSCV continues until we use nine descriptors, we can see that probably only the first half a dozen descriptors make the dominant contributions. It would be difficult to argue that the small improvements in q2 and RMSCV values beyond the contributions of the first six descriptors are significant in view of possible fluctuations in the calculations if experimental values are slightly altered (with experimental errors limits). We can see a significant improvement in RMSCV until six descriptors are included in the model. Fluctuations beyond this point are within one standard deviation limit suggesting that RMSCV becomes approximately constant from that point on. Additional descriptors would lead to overfitting of the model and will decrease the signal to noise ratio for the model. Taken into account these conditions we have decided to use 6-parameter MLR model for the prediction of log kOH values. The selected structural descriptors together with coefficients of the a 6-parameter MLR model are shown in Table 3. The regression parameters presented in Table 4 were obtained from the MLR model constructed with 53 unsaturated hydrocarbons, which are present in the training set.
Table 3. Structural descriptors for the best MLR model r2 = 0.878, F = 55.02, RMS = 0.115
No.CoefficientsStandard Errort-testPartial FName of the descriptor
 012.230.17968.374674Intercept
 1-1.0180.104-9.7494.9Randic index (order 2)
 21.3980.098814.14200.1Kier & Hall index (order 2)
 3-0.5550.0993-5.5931.2Average Complementary
Information content (order 0)
 40.4050.04898.2968.8Kier shape index (order 1)
 5-0.7530.109-6.9047.6Kier & Hall index (order 0)
 60.0007420.0002333.1910.2Gravitation index (all pairs)
We arrived at the result that a 6-dimensional vector, the components of which were six topological indices, characterizes a chemical structure. Most of the selected topological indices encode information on molecular size and the branching pattern. This is in particular the case with the Randić index, the Kier & Hall indices and Kier’s kappa shape index. Indirectly these indices store information on steric properties of molecules, which are one of the determining factors of the reaction rate. In order to test the significance of individual descriptor a t-test and partial F factor were calculated. Both tests show significance of all descriptors included in model.
The cross-validation capability of the developed six-descriptor MLR model was tested by leave-one-out cross-validation procedure. The RMSCV error was found to be 0.119 log units. On the other hand test set was used to determine prediction ability of developed model. The obtained RMS value was 0.097 log units. The graph of the calculated versus the experimental log kOH values is shown in Figure 3.
Figure 3. Calculated vs. experimental -log(kOH) values obtained by six parameter MLR model
Molecules 09 01160 g003
Visual inspection of the plot shows 1,3,5-cycloheptatriene (compound 23 in Table 1) as a potential outlier. The difference between the experimental log (kOH) and the calculated value for this compound exceeds 0.45 log units. Its removal visibly reduced the RMS error (about 17 %). Because the studied data set was already quite small the likely outlier was not removed from the study. The large resulting error need not to be due to an experimental nature but due to limitations of coding capabilities of descriptors used. Another reason to keep the outlier was that we wanted to compare our model with other QSPR studies on the same data set [6,16,24,26], where 1,3,5-cycloheptatriene was included in the modeling procedure. Finally without a further close scrutiny it cannot be decided whether the large error accompanying outliers of experimental nature or is due to limitations of coding capabilities of descriptors used.
A direct comparison of calculated results with the literature data is difficult. The models discussed in the literature used residual sum of squares (RSS) for the model validation. Some of the predicted values represent true predicted values, but on the other hand the remaining data are actually retrieved values, that is, they were used for the model creation as well as prediction. Therefore the calculated RSS value slightly overestimates the prediction abilities of the model. In order to compare our results to three types of models reported by Bakken and Jurs [26] where also classical training/test set procedure was used, the RSS value as well as the RMS values for training and test set as well were calculated for the first 57 compounds. Corresponding values are 0.101, 0.0965 and 0.569 log units, respectively. Our six-descriptor MLR had similar training capabilities to the five descriptors MLR model of Jurs and Bakken. On the other hand the RSS value and RMS prediction value compare favorably with the literature MLR model, where corresponding values were 0.676 and 0.139 log units, respectively.
Introduction of non-linear modeling technique, like artificial neural networks (ANN), improved the reported calculation capabilities of log kOH. Both reported ANN models with RMSCV errors of 0.074 and 0.065 log units outperformed our MLR model. In both ANN cases five descriptors were used for encoding the chemical structure.
We want finally to compare calculation ability of our MLR model with the simple regression model based on a single variable molecular descriptor (χ1f). We assigned four weights to diagonal elements of the connectivity matrix for the contribution of cyclic or acyclic sp2-hybridized or sp3-hybridized carbon atoms. In this way we have differentiated the influence of cyclic structures as well as between contributions of CC single and CC double bonds. Using the training set, weights were optimized by the Simplex method to get the lowest RMS value for the retrieved data. The changes of RMS value during optimization procedure are shown in Figure 4.
Figure 4. Optimization of variable connectivity index 1χv
Molecules 09 01160 g004
The optimization of χ1f changes the calculation performance of regression model substantially. The r2, q2 and cross-validated RMS improved from 0.399, 0.340, and 0.23 log units, respectively, when ordinary connectivity index (χ1) was used, to 0.716, 0.692, and 0.16 log units, respectively when the variable index was used. At the same time RMS error for the prediction set also decreased from 0.16 to 0.11 log units. The calculated –log kOH values are shown in Figure 5. The calculation performance of the single variable connectivity index is better than MLR model with two descriptors and slightly worse than when three descriptors were used for model creation. Although the calculation ability of variable connectivity index is worse than the best MLR model, its biggest advantage is the possibility of a structural interpretation of the model.
During the creation of the first model carbon atoms were differentiated into four classes, that is, acyclic sp3-hybridized, acyclic sp2-hybridized, cyclic sp3-hybridized and cyclic sp2-hybridized. Their corresponding optimal weights were 9.5039.104, 3.6066.104, 21.788.104 and 2.5304.104, respectively (Model 1 in Table 1). We can see that the smallest influence on compounds reactivity have both cyclic and acyclic sp3-hybridized carbon atoms. On the other hand cyclic sp2-hybridized carbon atoms show a slightly higher reactivity that the corresponding atoms in acyclic structure, which is again in agreement with the experimental observations.
Figure 5. Calculated vs. experimental -log(kOH) values using variable connectivity index (Model 1)
Molecules 09 01160 g005
Alkenes can undergo halogenation with Cl2 or Br2 either by a heterolytic mechanism (resulting in addition which yields vicinal dihaloalkanes) or by a homolytic mechanism (resulting in substitution in allylic position). As an example for the latter type of reaction, when isobutene and one of the two above halogens react at 400ºC, the substitution product is methallyl halide. A milder reagent for allylic bromination is N-bromosuccnimide.
Similarly, oxidation of alkenes with oxygen (“autoxidation”) proceeds homolytically by substitution affording allylic hydroperoxides. The reaction with OH radicals also follows the same course starting with hydrogen abstraction from an allylic position.
The reason for this regioselectivity favoring substitution in an allylic position is the different bond dissociation energy (BDE) for various types of C–H bonds. The approximate BDE values (in kJ/mol) are: (i) 445 for sp2 C–H bonds; (ii) 400 for non-allylic sp3 C–H bonds; and (iii) 360 for allylic sp3 C–H bonds. These energy values are due to the remaining lone electron after hydrogen atom abstraction, which would be: (i) a σ-electron in an sp2-hybridized orbital; (ii) a π-electron in the non-hybridized p-orbital; and, respectively, (iii) a π-electron in a delocalized molecular orbital extending over three atoms with sp2-hybridzation. Of course, the allylic hydrogen atom with the lowest BDE will be abstracted by a halogen atom or an OH free radical.
Therefore we considered that allylic versus non-allylic positions are more important than cyclic/acyclic constitution, and we differentiated in model 2 between three classes of carbon atoms: sp2-hybridized, non-allylic sp3-hybridized, and allylic sp3-hybridized. The optimized weights for corresponding C atoms were 6.2731.104, 5.0000.105 and 9.6063.104, respectively. The calculated –log k values are shown in Fig 6 and as Model 2 in Table 1.
Figure 6. Calculated vs. experimental -log(kOH) values using variable connectivity index (Model 2)
Molecules 09 01160 g006
The r2, q2 and cross-validated RMS improved slightly to 0.721, 0.694 and 0.1598. Allthough the improvements are not significant, we reduced the number of weights from four to three. At the same time by choosing different parametrisation of weights we have gained additional information about the nature of the reaction. We can see that sp2-hybridized C atoms are still the most important contributors to overall reactivity, but the contribution of allylic sp3-hybridized carbon atoms is closer to sp2-hybridized than to non-allylic sp3-hybridized. This means that most probably the addition to multiple bonds is still most important mechanism but hydrogen atom abstraction at the allylic site can not be neglected.

Conclusions

The aim of this work was to investigate the coding capabilities of constitutional and topological descriptors for a QSPR study for predicting gas-phase reaction rate constants of organic compounds with OH radical. A very simple chemical representation was selected in order to enable even a non-specialist in theoretical chemistry to use these predictive models. The data set contained unsaturated hydrocarbons where OH radical addition is the dominant reaction pathway.
Initially, MLR model was developed for the prediction of log kOH values from molecular structure. Chemical structure was presented by six-dimensional vector that contained classical topological indices. The cross-validation capability of MLR model was tested by leave-one-out cross-validation procedure. RMSCV error was 0.119 log units. The obtained prediction results were compared with previous literature studies. Our model gave better prediction results than reported MLR model, but was outperformed by non-linear models where artificial neural networks were used.
Beside standard structural indices, the coding capability of a single variable connectivity index was tested. The single variable connectivity index provided better cross-validation results than the MLR models with two descriptors. The biggest advantage of variable connectivity index is possibility of its structural interpretation. Carbon atoms were differentiated into four classes. Both cyclic and acyclic sp3-hybridized carbon atoms have the smallest influence on reactivity. The cyclic sp2-hybridized carbon atoms show slightly higher reactivity that the corresponding atoms in acyclic structure.
Additional model using variable connectivity index was developed where carbon atoms were differentiated between three classes: sp2-hybridized, non-allylic sp3-hybridized, and allylic sp3-hybridized. The model with just three weights give the same calculation results than the model with four weights. Additionally, the structural interpretation of the model shown that most probably the addition to multiple bonds is most important mechanism but hydrogen atom abstraction at the allylic site cannot be neglected

Acknowledgements

The authors would like to acknowledge the financial support by the Ministry of Education, Science and Sport of the Republic of Slovenia (Grants L1-6709 and P1-0017).

References and Notes

  1. Atkinson, R. Gas-Phase Reactions of the Hydroxyl Radicals. Chem. Rev. 1986, 86, 69–201. [Google Scholar]
  2. Atkinson, R. Kinetics and mechanisms of the gas-phase reactions of the hydroxyl radical with organic compounds. J. Phys. Chem. Ref. Data Monograph 1 1989, 1–246. [Google Scholar]
  3. Atkinson, R. Gas-phase tropospheric chemistry of organic compounds. J. Phys. Chem. Ref. Data Monograph 2 1994, 1–216. [Google Scholar]
  4. Darnall, K.R.; Atkinson, R.; Pitts, J.N., Jr. Rate Constants for the Reaction of the OH Radical with Selected Alkanes at 300 K. J. Phys. Chem. 1978, 82, 1581–1584. [Google Scholar]
  5. Atkinson, R. A Structure-activity relationship for the estimation of rate constants for the gas-phase reactions of OH radicals with organic compounds. Int. J. Chem. Kinet. 1987, 19, 799–828. [Google Scholar] [CrossRef]
  6. Atkinson, R. Estimation of Gas-Phase Hydroxyl Radical Rate Constants for Organic Chemicals. Environ. Toxicol. Chem. 1988, 7, 435–442. [Google Scholar]
  7. Heickler, J. The correlation of Rate Coefficients for H-Atom Abstraction by OH Radicals with C-H Bond Dissociation Enthalpies. Int. J. Chem. Kinet. 1981, 13, 651–665. [Google Scholar]
  8. Jolly, G.S.; Paraskevopoulos, G.; Singleton, D.L. Rates of OH radical reactions. XII. The reaction of OH with c-C3H6, c-C5H10, and c-C7H14. Correlation of hydroxyl rate constants with bond dissociation energies. Int. J. Chem. Kinet. 1984, 17, 1–10. [Google Scholar] [CrossRef]
  9. Cohen, N. The Use of Transition-State Theory to Extrapolate Rate Coefficients for Reaction of OH with Alkanes. Int. J. Chem. Kinet. 1982, 14, 1339–1362. [Google Scholar] [CrossRef]
  10. Hodson, J. The estimation of the photodegradation of organic compounds by hydroxyl radical reaction rate constants obtained from nuclear magnetic resonance spectroscopy chemical shift data. Chemosphere 1988, 17, 2339–2348. [Google Scholar]
  11. Grosjean, D.; Williams, E.L. II Environmental persistence of organic compounds estimated from structure-reactivity and linear free-energy relationships-unsaturated aliphatics. Atmos. Environ. 1992, 26A, 1395–1405. [Google Scholar]
  12. Gaffney, J.S.; Levine, S.Z. Predicting gas-phase organic molecule reaction rates using linear free-energy correlations. I. O(3P) and OH addition and abstraction reactions. Int. J. Chem. Kinet. 1979, 11, 1197–1209. [Google Scholar] [CrossRef]
  13. Rinke, M.; Wahner, A.; Zetzsch, C.Z. Dependence of the Rate of OH Addition to Aromatics on the Ionization Potential: A Predictive Tool for Rate Constants. J. Photochem. 1981, 17, 142. [Google Scholar] [CrossRef]
  14. Sekušak, S.; Güsten, H.; Sabljić, A. An ab initio investigation on transition state and reactivity of chloroethane with OH radical. J. Chem. Phys. 1995, 102, 7504–7518. [Google Scholar]
  15. Sekušak, S.; Güsten, H.; Sabljić, A. An ab initio study on reactivity of chloro ethane with hydroxyl radical: Application of G2 theory. J. Phys. Chem. 1996, 100, 6212–6224. [Google Scholar]
  16. Klamt, A. Estimation of gas-phase hydroxyl radical rate constants of organic compounds from molecular orbital calculations. Chemosphere 1993, 26, 1273–1289. [Google Scholar]
  17. Klamt, A. Estimation of gas-phase hydroxyl radical rate constants of oxygenated compounds based on molecular orbital calculations. Chemosphere 1996, 32, 717–726. [Google Scholar]
  18. Francisco, J.S. Reaction of OH radicals with CH3C(O)H and CF3C(O)H. J. Chem. Soc. Faraday Trans. 1992, 8, 1943–1947. [Google Scholar]
  19. Melissas, V.S.; Truhlar, D.G. Interpolated variational transition-state theory and semi-classical tunneling calculations of the rate constant of the reaction OH + C2H6 at 200-3000 K. J. Phys. Chem. 1994, 98, 875–886. [Google Scholar]
  20. King, M.D.; Canosa-Mas, C.E.; Wayne, R.P. Fronier molecular orbital correlations for predicting rate constants between alkenes and the tropospheric oxidants NO3, OH and O3. Phys. Chem. Chem. Phys. 1999, 1, 2231–2238. [Google Scholar]
  21. King, M.D.; Canosa-Mas, C.E.; Wayne, R.P. A structure-activity relationship (SAR) for predicting rate constants for the reaction of NO3, OH and O3 with monoalkenes and conjugated dienes. Phys. Chem. Chem. Phys. 1999, 1, 2239–2246. [Google Scholar]
  22. Tosato, M.L.; Chiorboli, C.; Eriksson, L.; Jonsson, L. Multivariate modelling of the rate constant of the gas-phase reaction of haloalkanes with the hydroxyl radical. Sci. Total. Environ. 1991, 109/110, 307–325. [Google Scholar]
  23. Eriksson, L.; Rännar, S.; Sjöström, M.; Hermens, J.L.M. Multivariate QSARs to model the hydroxyl radical rate constant for halogenated aliphatic hydrocarbons. Environmetrics 1994, 5, 197–208. [Google Scholar]
  24. Medven, Z.; Güsten, H.; Sabljić, A. Comparative QSAR study on hydroxyl radical reactivity with unsaturated hydrocarbons: PLS versus MLR. J. Chemomet. 1996, 10, 135–147. [Google Scholar]
  25. Gramatica, P.; Consonni, V.; Todeschini, R. QSAR study on the tropospheric degradation of organic compounds. Chemosphere 1999, 38, 1371–1378. [Google Scholar]
  26. Bakken, G.A.; Jurs, P.C. Prediction of hydroxyl radical rate constants from molecular structure. J. Chem. Inf. Comput. Sci. 1999, 39, 1064–1075. [Google Scholar] [CrossRef]
  27. Gramatica, P.; Pilutti, P.; Papa, E. Validated QSAR prediction of OH tropospheric degradation of VOCs: Splitting into training – test set and consensus modeling. J. Chem. Inf. Comput. Sci. 2004, 44, 1794–1802. [Google Scholar] [PubMed]
  28. Güsten, H. Predicting the abiotic degradability of organic pollutants in the troposphere. Chemosphere 1999, 38, 1361–1370. [Google Scholar]
  29. Güsten, H.; Medven, Z.; Sekušak, S.; Sabljić, A. Predicting Tropospheric Degradation of Chemicals: From Estimation to Computations. SAR QSAR Environ. Res. 1995, 4, 197–209. [Google Scholar] [PubMed]
  30. Todeschini, R.; Consonni, V. The Handbook of Molecular Descriptors; in the Series of Methods and Principles in Medicinal Chemistry; Vol. 11; Mannhold, R., Kubinyi, H., Timmerman, H., Eds.; Wiley-VCH: New York, 2000; p. 680. [Google Scholar]
  31. Katritzky, A.R.; Maran, U.; Lobanov, V.S.; Karelson, M. Structurally diverse quantitative structure-property relationship correlations of technologically relevant physical properties. J. Chem. Inf. Comput. Sci. 2000, 40, 1–18. [Google Scholar] [CrossRef] [PubMed]
  32. Wiener, H. Structural Determination of Paraffin Boiling Points. J. Am. Chem. Soc. 1947, 69, 17. [Google Scholar] [PubMed]
  33. Platt, J.R. Influence of neighbor bonds on additive bond properties in paraffins. J. Chem. Phys. 1947, 15, 419. [Google Scholar]
  34. Hosoya, H. Topological Index. A newly Proposed Quantity Characterizing The Topological Nature of structural Isomers of Saturated Hydrocarbons. Bull. Chem. Soc. Jpn. 1971, 44, 2332–2339. [Google Scholar]
  35. Randić, M. Characterisation of molecular branching. J. Am. Chem. Soc. 1975, 97, 6609–6615. [Google Scholar]
  36. Balaban, A.T. Chemical Applications of Graph Theory; Academic Press: London, 1976; p. 389. [Google Scholar]
  37. Bonchev, D.; Trinajstić, N. Information-theory, distance matrix, and molecular branching. J. Chem. Phys. 1977, 67, 4517. [Google Scholar]
  38. Kier, L.B.; Hall, L.H. Molecular Connectivity in Structure-Activity Analysis; Wiley: New York, 1986. [Google Scholar]
  39. Balaban, A.T.; Ivanciuc, O. Historical development of topological indices, in: Topological Indices and Related Descriptors in QSAR and QSPR; Devillers, J., Balaban, A.T., Eds.; Gordon and Breach: Amsterdam, The Netherlands, 2000; pp. 21–51. [Google Scholar]
  40. Randić, M. Topological Indices. In The Encyclopedia of Computational Chemistry; Schleyer, P.v.R, Allinger, N.L., Clark, T., Gasteiger, J., Kollman, P.A., Schaefer III, H.F., Schreiner, P.R., Eds.; John Wiley & Sons: Chichester, U.K, 1998; pp. 3018–3032. [Google Scholar]
  41. Randić, M. On Computation of optimal parameters for multivariate analysis of structure-property relationship. J. Comput. Chem. 1991, 12, 970–980. [Google Scholar]
  42. Randić, M. Novel graph theoretical approach to heteroatoms in QSAR. Chemometrics & Intel. Lab. Systems 1991, 10, 213–227. [Google Scholar] [CrossRef]
  43. Randić, M.; Dobrowolski, J.Cz. Optimal molecular connectivity descriptor for nitrogen-containing molecules. Int. J. Quantum Chem. 1998, 70, 1209–1215. [Google Scholar] [CrossRef]
  44. Randić, M.; Plavšić, D.; Lerš, N. Variable connectivity index for cycle-containing structures. J. Chem. Inf. Comput. Sci. 2001, 41, 657–662. [Google Scholar] [PubMed]
  45. Pogliani, L. From molecular connectivity indices to semiempirical connectivity terms: Recent trends in graph theoretical descriptors. Chem. Rev. 2000, 100, 3827–3858. [Google Scholar] [CrossRef] [PubMed]
  46. Karelson, M.; Lobanov, V.S.; Katritzky, A.R. Qunatum-chemical descriptors in QSAR/QSPR studies. Chem. Rev. 1996, 96, 1027–1043. [Google Scholar] [PubMed]
  47. Katritzky, A.R.; Lobadov, V.S.; Karelson, M.; CODESSA Training Manual, University of Florida, Gainesville, FL. 1995.
  48. Randić, M. On characterization of chemical structure. J. Chem. Inf. Comput. Sci. 1997, 37, 672–687. [Google Scholar] [CrossRef]
  49. Klein, D. J. Chemical graph-theoretic cluster expansions. Int. J. Quantum Chem. 1986, S20, 153–183. [Google Scholar] [CrossRef]
  50. Randić, M. On the representation of molecular graphs by basis graphs. J. Chem. Inf. Comput. Sci. 1992, 32, 57–69. [Google Scholar]
  51. Keir, L.B.; Wallace, W.J.; Randić, M.; Hall, L.H. Molecular connectivity. V. Connectivity series applied to density. J. Pharm. Sci. 1975, 65, 1226–1230. [Google Scholar]
  52. Keir, L.B.; Hall, L.H. Molecular connectivity. VII. Specific treatement of heteroatoms. J. Pharm. Sci. 1975, 65, 18066–18090. [Google Scholar]
  53. See for example: Balaban, A.T. Chemical graphs 48. Topological index J for hetero-atom containing molecules taking into account periodicities of element properties. Math. Chem (MATCH) 1986, 21, 115–122. [Google Scholar]
  54. Randić, M. The connectivity index 25 years after. J. Mol. Graphics Modelling 2001, 20, 19–35. [Google Scholar]
  55. Randić, M.; Pompe, M. On characterization of the CC double bond in alkenes. SAR & QSAR in Environ. Res. 1999, 10, 451–471. [Google Scholar] [CrossRef]
  56. Randić, M.; Basak, S.C. Multiple regression analysis with optimal molecular descriptors. SAR & QSAR in Environ. Res. 2000, 11, 1–23. [Google Scholar] [CrossRef]
  57. Randić, M. High quality structure-property regressions. Boiling points of smaller alkanes. New J. Chem. 2000, 24, 165–171. [Google Scholar] [CrossRef]
  58. Randić, M.; Basak, S.C. On construction of high quality structure-property-activity regressions: The boiling points of sulfides. J. Chem. Inf. Comput. Sci. 2000, 40, 899–905. [Google Scholar] [PubMed]
  59. Randić, M. On the variable connectivity index and other variable molecular descriptors. In 220th ACS Meeting, Washington D. C., August 20-243, 2000.
  60. Randić, M.; Mills, D.; Basak, S.C. On use of variable connectivity index for characterization of amino acids. Int. J. Quantum Chem. 2000, 80, 1199–1209. [Google Scholar] [CrossRef]
  61. Randić, M.; Pompe, M. On variable molecular descriptors based on distance related matrices. J. Chem. Inf. Comput. Sci. 2001, 41, 575–581. [Google Scholar] [PubMed]
  62. Randić, M.; Basak, S.C. On use of the variable connectivity index 1χf in QSAR: Toxicity of aliphatic ethers. J. Chem. Inf. Comput. Sci. 2001, 41, 614–618. [Google Scholar] [PubMed]
  63. Randić, M.; Pompe, M. The variable connectivity index 1χf versus the traditional molecular descriptors: A comparative study of 1χf against descriptors of CODESSA. J. Chem. Inf. Comput. Sci. 2001, 41, 631–638. [Google Scholar] [PubMed]
  64. Randić, M.; Plavšić, D.; Lerš, N. Variable connectivity index for cycle-containing structures. J. Chem. Inf. Comput. Sci. 2001, 41, 657–662. [Google Scholar] [PubMed]
  65. Massart, D.L.; Vandeginste, D.G.M.; Deming, S.M.; Michotte, Y.; Kaufman, L. Chemometrics: A textbook, Data handling in science and technology; Vol 2; Elsevier: Amsterdam, The Netherlands, 1988. [Google Scholar]

