Sharp Phylogeographic Breaks and Patterns of Genealogical Concordance in the Brine Shrimp Artemia franciscana

Abstract
:1. Introduction
2. Results
2.1. Mitochondrial Loci
2.2. Nuclear Loci
2.3. Phylogenetic Inference and Population Structure
3. Discussion
3.1. Mitochondrial Genealogy
3.2. Nuclear Genealogy
4. Experimental Section
4.1. Populations Analyzed and Data Assembly
4.2. Sequence Analysis and Phylogenetic Reconstruction
Acknowledgments
References and Notes
- Avise, JC. Phylogeography: The History and Formation of Species, 2nd Ed ed; Harvard University Press: Cambridge, MA, USA, 2000. [Google Scholar]
- Avise, JC. Molecular Markers, Natural History, and Evolution, 2nd Ed ed; Sinauer Associates, Inc: Sunderland, MA, USA, 2004. [Google Scholar]
- Bernardi, G; Sordino, P; Powers, DA. Concordant mitochondrial and nuclear DNA phylogenies for populations of the teleost fish Fundulus heteroclitus. Proc. Natl. Acad. Sci. USA 1993, 90, 9271–9274. [Google Scholar]
- Burton, RS; Lee, B-N. Nuclear and mitochondrial gene genealogies and allozyme polymorphism across a major phylogeographic break in the copepod Tigriopus californicus. Proc. Natl. Acad. Sci. USA 1994, 91, 5197–5201. [Google Scholar]
- Willett, CS; Ladner, JT. Investigations of fine-scale phylogeography in Tigriopus californicus reveal historical patterns of population divergence. BMC Evol. Biol 2009, 9, 139. [Google Scholar]
- Mills, S; Lunt, DH; Gómez, A. Global isolation by distance despite strong regional phylogeography in a small metazoan. BMC Evol. Biol 2007, 7, 225. [Google Scholar]
- Adamowicz, SJ; Petrusek, A; Colbourne, JK; Hebert, PDN; Witt, JDS. The scale of divergence: A phylogenetic appraisal of intercontinental allopatric speciation in a passively dispersed freshwater zooplankton genus. Mol. Phylogenet. Evol 2009, 50, 423–436. [Google Scholar]
- Gajardo, GM; Sorgeloos, P; Beardmore, JA. Inland hypersaline lakes and the brine shrimp Artemia as simple models for biodiversity analysis at the population level. Saline Syst 2006, 2, 14. [Google Scholar]
- Green, AJ; Sánchez, MI; Amat, F; Figuerola, J; Hontoria, F; Ruiz, O; Hortas, F. Dispersal of invasive and native brine shrimps Artemia (Anostraca) via waterbirds. Limnol. Oceanogr 2005, 50, 737–742. [Google Scholar]
- Mayr, E. Animal Species and Evolution; Belknap Press: Cambridge, MA, USA, 1963. [Google Scholar]
- Baxevanis, AD; Kappas, I; Abatzopoulos, TJ. Molecular phylogenetics and asexuality in the brine shrimp Artemia. Mol. Phylogenet. Evol 2006, 40, 724–738. [Google Scholar]
- Kappas, I; Baxevanis, AD; Maniatsi, S; Abatzopoulos, TJ. Porous genomes and species integrity in the branchiopod Artemia. Mol. Phylogenet. Evol 2009, 52, 192–204. [Google Scholar]
- de Gelas, K; de Meester, L. Phylogeography of Daphnia magna in Europe. Mol. Ecol 2005, 14, 753–764. [Google Scholar]
- King, JL; Hanner, R. Cryptic species in a “living fossil” lineage: Taxonomic and phylogenetic relationships within the genusLepidurus (Crustacea: Notostraca) in North America. Mol. Phylogenet. Evol 1998, 10, 23–36. [Google Scholar]
- Lee, CE. Global phylogeography of a cryptic copepod species complex and reproductive isolation between genetically proximate “populations”. Evolution 2000, 54, 2014–2027. [Google Scholar]
- Witt, JDS; Hebert, PDN. Cryptic species diversity and evolution in the amphipod genus Hyalella within central glaciated North America: A molecular phylogenetic approach. Can. J. Fish. Aquat. Sci 2000, 57, 687–698. [Google Scholar]
- Gómez, A; Serra, M; Carvalho, GR; Lunt, DH. Speciation in ancient cryptic complexes: Evidence from the molecular phylogeny of Brachionus plicatilis (Rotifera). Evolution 2002, 56, 1431–1444. [Google Scholar]
- Papakostas, S; Triantafyllidis, A; Kappas, I; Abatzopoulos, TJ. The utility of the 16S gene in investigating cryptic speciation within the Brachionus plicatilis species complex. Mar. Biol 2005, 147, 1129–1139. [Google Scholar]
- De Meester, L; Gómez, A; Okamura, B; Schwenk, K. The Monopolization Hypothesis and the dispersal–gene flow paradox in aquatic organisms. Acta Oecol 2002, 23, 121–135. [Google Scholar]
- Triantaphyllidis, GV; Abatzopoulos, TJ; Sorgeloos, P. Review of the biogeography of the genus Artemia (Crustacea, Anostraca). J. Biogeogr 1998, 25, 213–226. [Google Scholar]
- van Stappen, G. Zoogeography. In Artemia: Basic and Applied Biology, 1st Ed; Abatzopoulos, TJ, Beardmore, JA, Clegg, JS, Sorgeloos, P, Eds.; Kluwer Academic Publishers: Dordrecht, The Netherlands, 2002; pp. 171–224. [Google Scholar]
- Lenz, PH. Ecological studies on Artemia: A review. In Artemia Research and Its Applications. Ecology, Culturing, Use in Aquaculture; Sorgeloos, P, Bengtson, DA, Decleir, W, Jaspers, E, Eds.; Universa Press: Wetteren, Belgium, 1987; Volume 3, pp. 5–18. [Google Scholar]
- Abatzopoulos, TJ; Beardmore, JA; Clegg, JS; Sorgeloos, P. Artemia: Basic and Applied Biology, 1st Ed ed; Kluwer Academic Publishers: Dordrecht, The Netherlands, 2002. [Google Scholar]
- Abatzopoulos, TJ; Kappas, I; Bossier, P; Sorgeloos, P; Beardmore, JA. Genetic characterization of Artemia tibetiana (Crustacea: Anostraca). Biol. J. Linn. Soc 2002, 75, 333–344. [Google Scholar]
- Lenz, PH; Browne, RA. Ecology of Artemia. In Artemia Biology, 1st Ed; Browne, RA, Sorgeloos, P, Trotman, CAN, Eds.; CRC Press: Boca Raton, FL, USA, 1991; pp. 237–253. [Google Scholar]
- Kappas, I; Abatzopoulos, TJ; Van Hoa, N; Sorgeloos, P; Beardmore, JA. Genetic and reproductive differentiation of Artemia franciscana in a new environment. Mar. Biol 2004, 146, 103–117. [Google Scholar]
- Bowen, ST; Fogarino, EA; Hitchner, KN; Dana, GL; Chow, VHS; Buoncristiani, MR; Carl, JR. Ecological isolation in Artemia: Population differences in tolerance of anion concentrations. J. Crust. Biol 1985, 5, 106–129. [Google Scholar]
- Camara, MR. Dispersal of Artemia franciscana Kellogg (Crustacea; Anostraca) populations in the coastal saltworks of Rio Grande do Norte, northeastern Brazil. Hydrobiologia 2001, 466, 145–148. [Google Scholar]
- Maniatsi, S; Baxevanis, AD; Abatzopoulos, TJ. The intron 2 of p26 gene: A novel genetic marker for discriminating the two most commercially important Artemia franciscana subspecies. J. Biol. Res. (Thessalon.) 2009, 11, 73–82. [Google Scholar]
- Thompson, JD; Gibson, TJ; Plewniak, F; Jeanmougin, F; Higgins, DG. The ClustalX windows interface: Flexible strategies for multiple sequence alignment aided by quality analysis tools. Nucleic Acids Res 1997, 25, 4876–4882. [Google Scholar]
- Tamura, K; Dudley, J; Nei, M; Kumar, S. MEGA4: Molecular Evolutionary Genetics Analysis (MEGA) software version 4.0. Mol. Biol. Evol 2007, 24, 1596–1599. [Google Scholar]
- Posada, D; Crandall, KA. Modeltest: Testing the model of DNA substitution. Bioinformatics 1998, 14, 817–818. [Google Scholar]
- Swofford, DL. PAUP* Phylogenetic Analysis Using Parsimony (* and Other Methods) Version 4; Sinauer Associates: Sunderland, MA, USA, 1998. [Google Scholar]
- Jensen, JL; Bohonak, AJ; Kelley, ST. Isolation by distance, web service. BMC Genet 2005, 6, 13. [Google Scholar]
- Librado, P; Rozas, J. DnaSP v5: A software for comprehensive analysis of DNA polymorphism data. Bioinformatics 2009, 25, 1451–1452. [Google Scholar]
- Hundson, RR; Boos, DD; Kaplan, NL. A statistical test for detecting geographic subdivision. Mol. Biol. Evol 1992, 9, 138–151. [Google Scholar]
- Abreu-Grobois, FA. Population Genetics of Artemia, Ph.D. Thesis; University of Wales: Swansea, UK, 1983.
- Beardmore, JA; Abreu-Grobois, FA. Taxonomy and evolution in the brine shrimp Artemia. In Protein Polymorphism: Adaptive and Taxonomic Significance; Oxford, GS, Rollinson, D, Eds.; Academic Press: London, UK, 1983; pp. 153–164. [Google Scholar]
- Gajardo, G; Da Conceicao, M; Weber, L; Beardmore, JA. Genetic variability and interpopulational differentiation of Artemia strains from South America. Hydrobiologia 1995, 302, 21–29. [Google Scholar]
- Gajardo, G; Crespo, J; Triantafyllidis, A; Tzika, A; Baxevanis, AD; Kappas, I; Abatzopoulos, TJ. Species identification of Chilean Artemia populations based on mitochondrial DNA RFLP analysis. J. Biogeogr 2004, 31, 547–555. [Google Scholar]
- Tizol-Correa, R; Maeda-Martínez, AM; Weekers, PHH; Torrentera, L; Murugan, G. Biodiversity of the brine shrimp Artemia from tropical salterns in southern México and Cuba. Current Sci 2009, 96, 81–87. [Google Scholar]
- Muñoz, J; Gómez, A; Green, AJ; Figuerola, J; Amat, F; Rico, C. Phylogeography and local endemism of the native Mediterranean brine shrimp Artemia salina (Branchiopoda: Anostraca). Mol. Ecol 2008, 17, 3160–3177. [Google Scholar]
- Gómez, A; Carvalho, GR; Lunt, DH. Phylogeography and regional endemism of a passively dispersing zooplankter: mtDNA variation of rotifer resting egg banks. Proc. R. Soc. Lond. B 2000, 267, 2189–2197. [Google Scholar]
- Gregory-Wodzicki, KM. Uplift history of the Central and Northern Andes: A review. Geol. Soc. Am. Bull 2000, 112, 1091–1105. [Google Scholar]
- Ramírez, CC; Salazar, M; Palma, RE; Cordero, C; Mezabasso, L. Phylogeographical analysis of neotropical Rhagoletis (Diptera: Tephritidae): Did the Andes uplift contribute to current morphological differences? Neotrop. Entomol 2008, 37, 651–661. [Google Scholar]
- Knowlton, N; Weigt, LA. New dates and new rates for divergence across the Isthmus of Panama. Proc. R. Soc. Lond. B 1998, 265, 2257–2263. [Google Scholar]
- Templeton, AR. Nested clade analyses of phylogeographic data: Testing hypotheses about gene flow and population history. Mol. Ecol 1998, 7, 381–397. [Google Scholar]
- Templeton, AR. Using phylogeographic analyses of gene trees to test species status and processes. Mol. Ecol 2001, 10, 779–791. [Google Scholar]
- Palumbi, SR; Baker, SC. Contrasting population structure from nuclear intron sequences and mtDNA of humpback whales. Mol. Biol. Evol 1994, 11, 426–435. [Google Scholar]
- Ryder, OA. Species conservation and the dilemma of subspecies. Trends Ecol. Evol 1986, 1, 9–10. [Google Scholar]


| Individuals | 16S | COI | ITS1 |
|---|---|---|---|
| SFB8 | FJ007826a | X69067 | DQ201292b |
| GSL1 | FJ007825a | GU248372 | DQ201300b |
| LVI6, LVI7 | FJ007833a, FJ007834a | GU248379, GU248380 | -, FJ004929a |
| CEJ6, CEJ7 | FJ007831a, FJ007832a | GU248375, GU248376 | FJ004925a, FJ004935a |
| CHA6, CHA8 | FJ007829a, FJ007830a | GU248377, GU248378 | FJ004928a, FJ004926a |
| LLA6, LLA7 | FJ007820a, FJ007821a | GU248365, GU248366 | -, FJ004939a |
| CON6, CON9 | FJ007823a, FJ007822a | GU248363, GU248364 | FJ004941a, FJ004942a |
| IQU1, IQU8 | FJ007827a, FJ007828a | GU248373, GU248374 | DQ201296a, FJ004927a |
| MAC13 | GU248382 | GU248371 | GU252102 |
| ABG20 | GU248383 | GU248369 | GU252103 |
| GAL22 | GU248384 | GU248370 | GU252104 |
| CHI21 | GU248385 | GU248362 | GU252105 |
| LTU19 | GU248386 | GU248368 | GU252106 |
| SET3 | GU248387 | GU248367 | GU252107 |
p26 | |||
| 2000 bp | 1500 bp | 1400 bp | |
| GSL_Ac | SFBc | CON13B (GU248398) | LLA7 (GU248402) |
| CEJ5 (GU248389) | SFB10 (GU248391) | CON7A (GU248397) | CON7B (GU248401) |
| CON13A (GU248388) | GSL_Bc | IQU3 (GU248396) | CON10 (GU248405) |
| LVI8 (GU248393) | MAC13 (GU248406) | CHI21 (GU248404) | |
| CEJ9 (GU248399) | ABG20 (GU248392) | LTU13 (GU248400) | |
| CEJ1 (GU248395) | GAL22 (GU248390) | SET15 (GU248403) | |
| CHA9 (GU248394) | |||
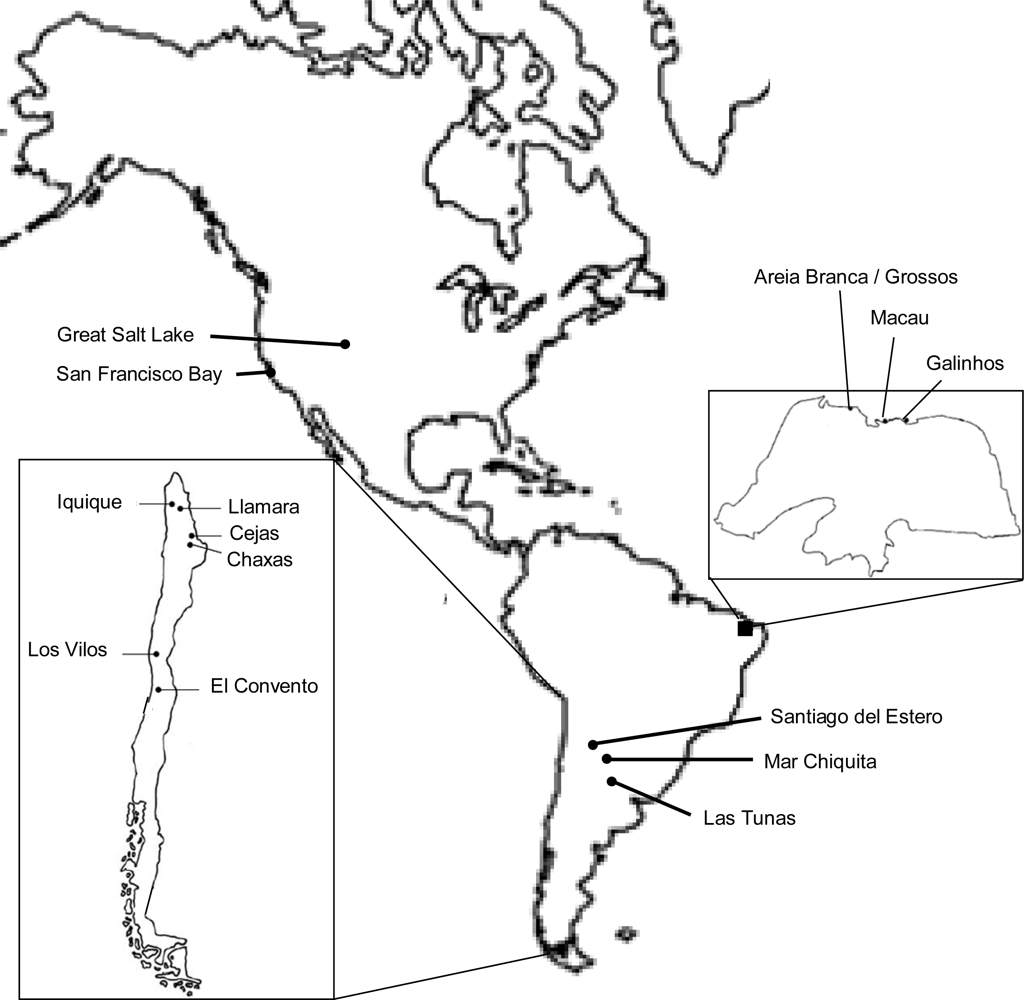
| Population (abbreviation) | Country | Geographic coordinates |
|---|---|---|
| San Francisco Bay (SFB) | USA | 37°28′N 122°30′W |
| Great Salt Lake (GSL) | USA | 40°59′N 112°24′W |
| Macau (MAC) | Brazil | 5°06′S 36°38′W |
| Areia Branca/Grossos (ABG) | Brazil | 4°57′S 37°08′W |
| Galinhos (GAL) | Brazil | 5°07′S 36°23′W |
| Los Vilos (LVI) | Chile | 31°58′S 71°25′W |
| Cejas (CEJ) | Chile | 23°02′S 68°13′W |
| Chaxas (CHA) | Chile | 22°47′S 67°58′W |
| Llamara (LLA) | Chile | 21°18′S 69°37′W |
| El Convento (CON) | Chile | 33°52′S 71°44′W |
| Iquique (IQU) | Chile | 20°40′S 70°15′W |
| Mar Chiquita (CHI) | Argentina | 30°39′S 62°36′W |
| Las Tunas (LTU) | Argentina | 33°45′S 62°19′W |
| Santiago del Estero (SET) | Argentina | 27°21′S 64°13′W |
© 2009 by the authors; licensee Molecular Diversity Preservation International, Basel, Switzerland. This article is an open-access article distributed under the terms and conditions of the Creative Commons Attribution license (http://creativecommons.org/licenses/by/3.0/).
Share and Cite
Maniatsi, S.; Kappas, I.; Baxevanis, A.D.; Farmaki, T.; Abatzopoulos, T.J. Sharp Phylogeographic Breaks and Patterns of Genealogical Concordance in the Brine Shrimp Artemia franciscana. Int. J. Mol. Sci. 2009, 10, 5455-5470. https://doi.org/10.3390/ijms10125455
Maniatsi S, Kappas I, Baxevanis AD, Farmaki T, Abatzopoulos TJ. Sharp Phylogeographic Breaks and Patterns of Genealogical Concordance in the Brine Shrimp Artemia franciscana. International Journal of Molecular Sciences. 2009; 10(12):5455-5470. https://doi.org/10.3390/ijms10125455
Chicago/Turabian StyleManiatsi, Stefania, Ilias Kappas, Athanasios D. Baxevanis, Theodora Farmaki, and Theodore J. Abatzopoulos. 2009. "Sharp Phylogeographic Breaks and Patterns of Genealogical Concordance in the Brine Shrimp Artemia franciscana" International Journal of Molecular Sciences 10, no. 12: 5455-5470. https://doi.org/10.3390/ijms10125455