Dietary Protection Against Free Radicals: A Case for Multiple Testing to Establish Structure-activity Relationships for Antioxidant Potential of Anthocyanic Plant Species


Abstract
:1. Introduction
2. Results and Discussion
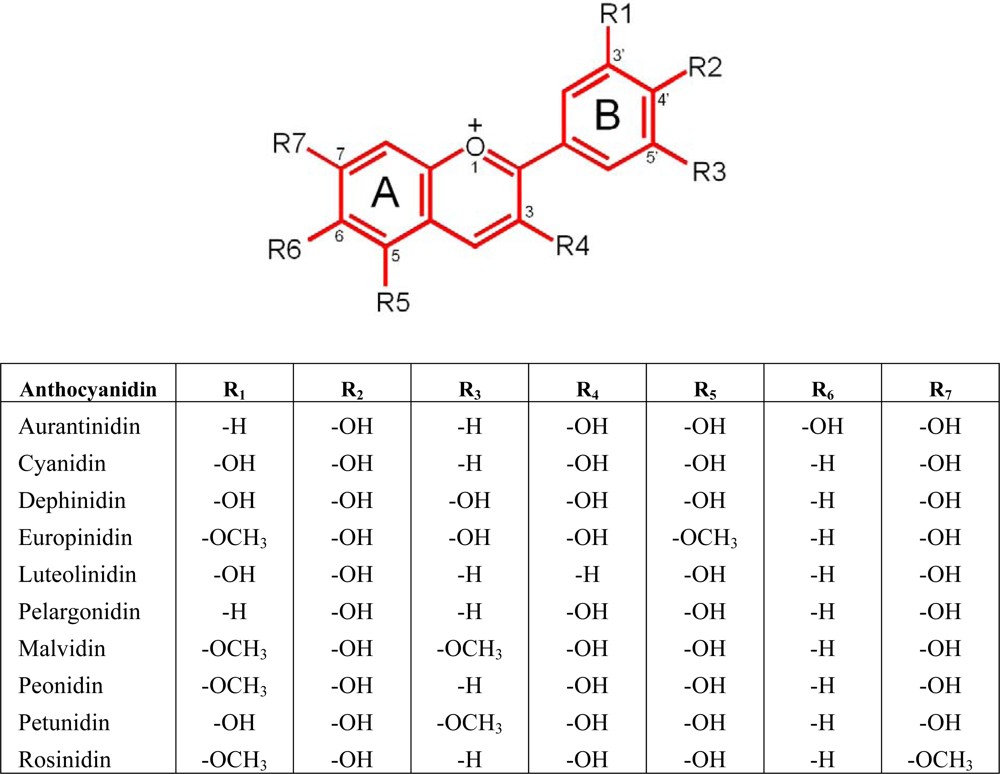
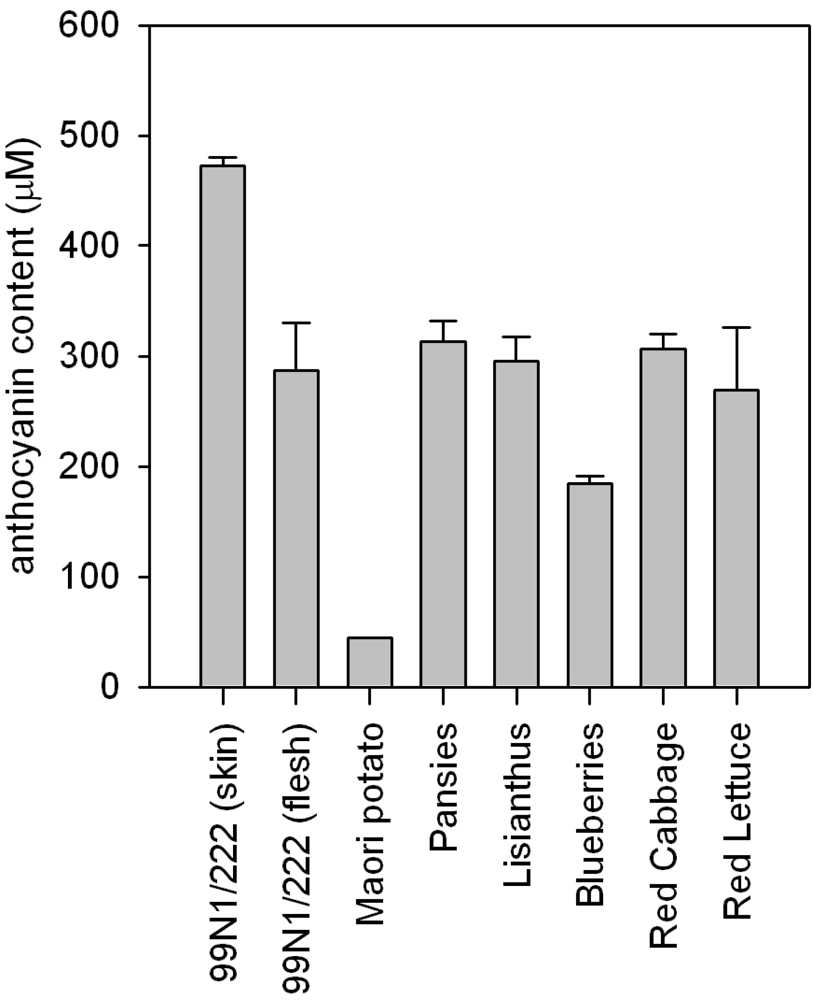
2.1. Anthocyanin levels
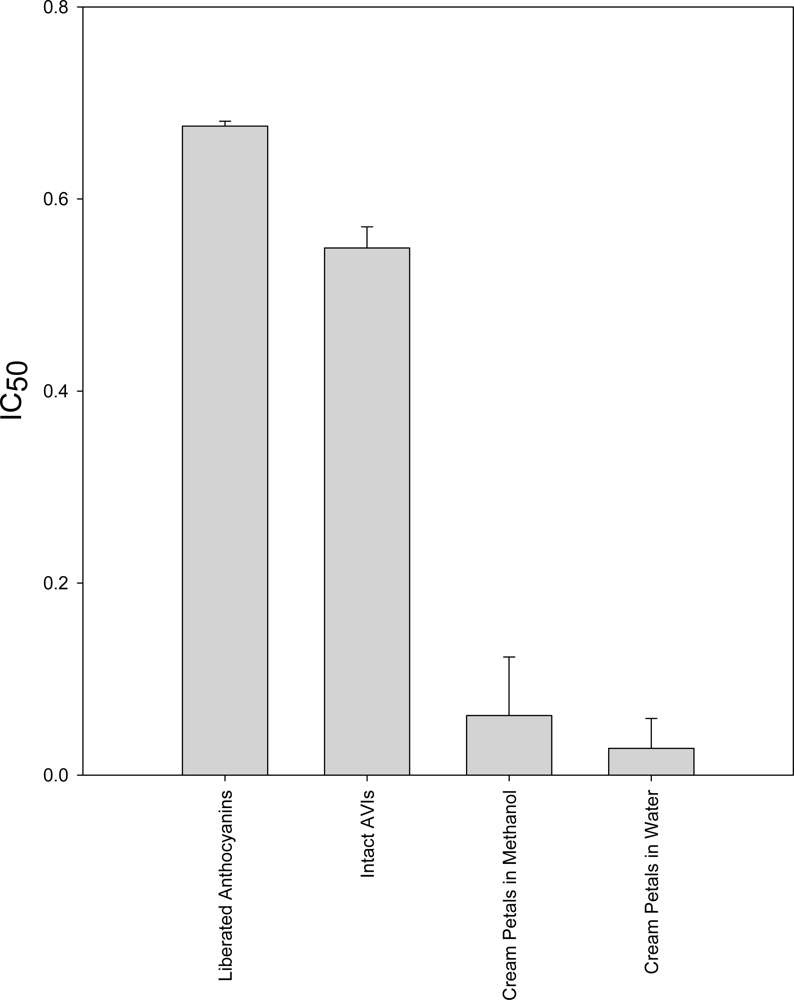
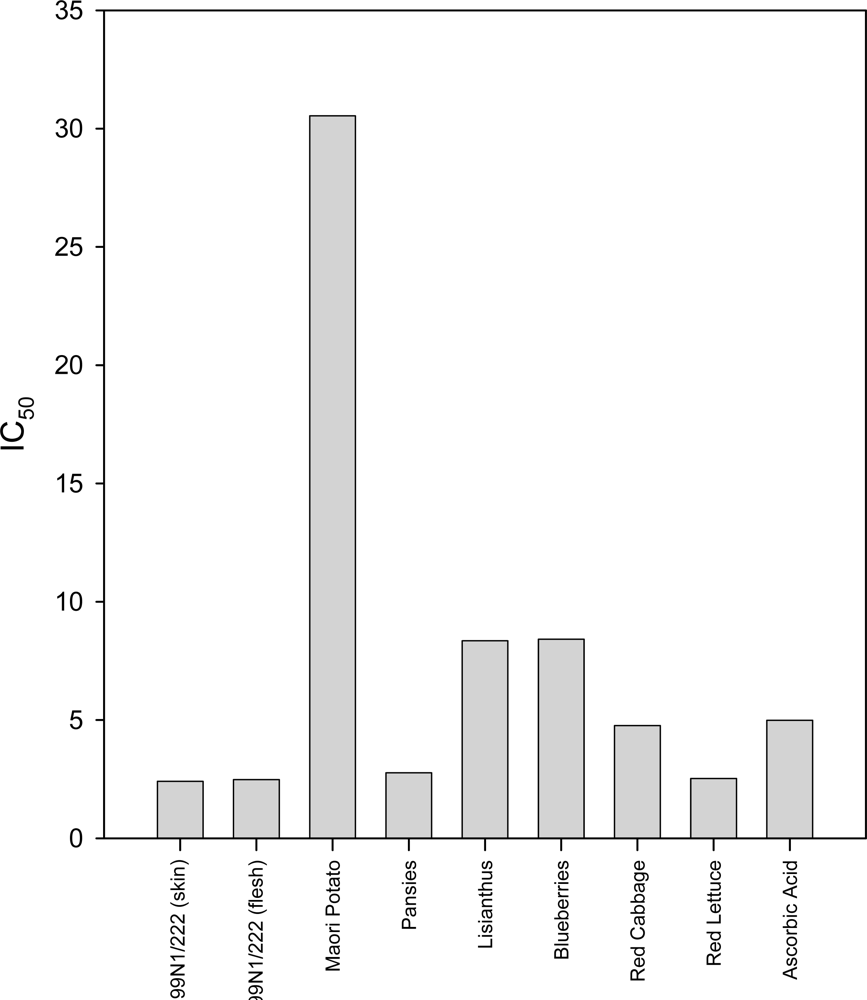
2.2. DPPH Assay
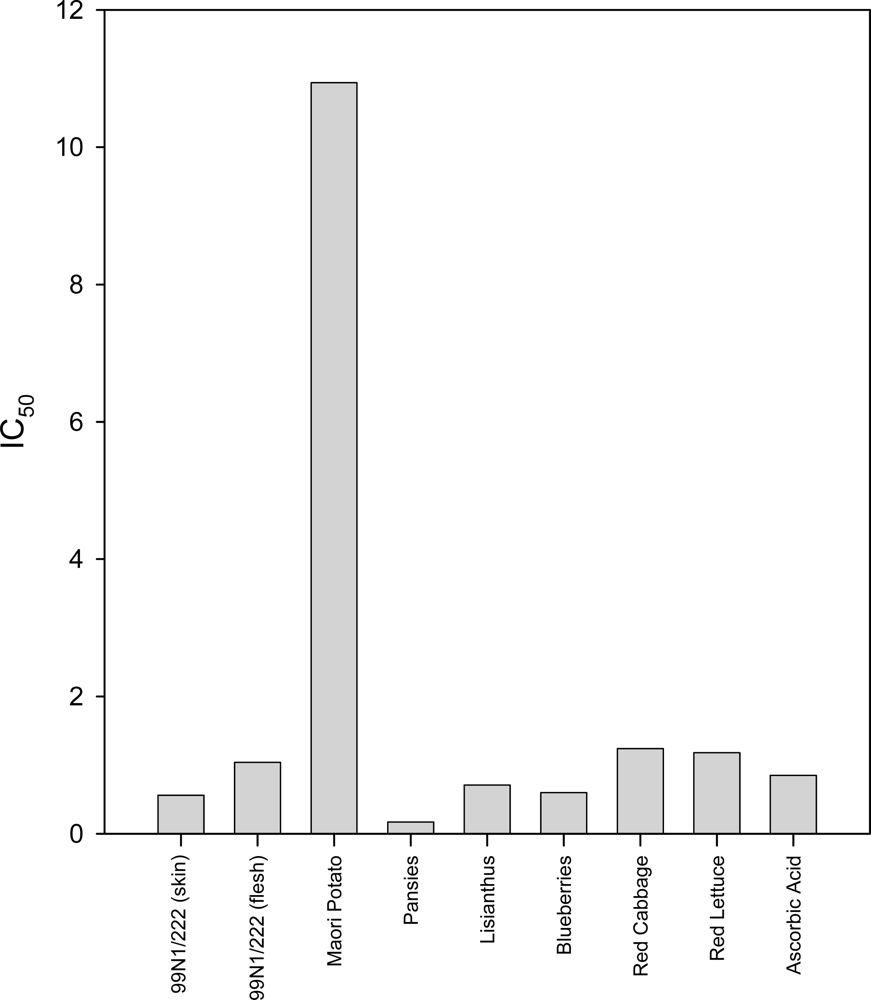
2.3. TRAP Assay
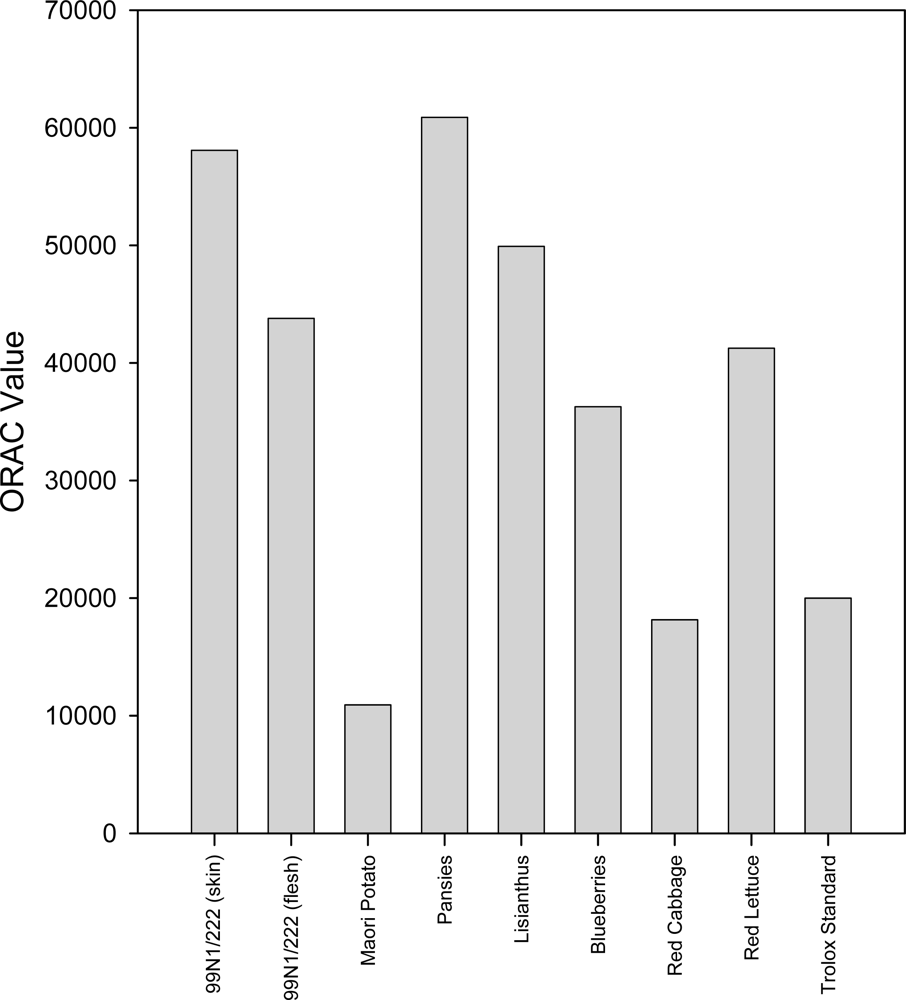
2.4. ORAC Assay
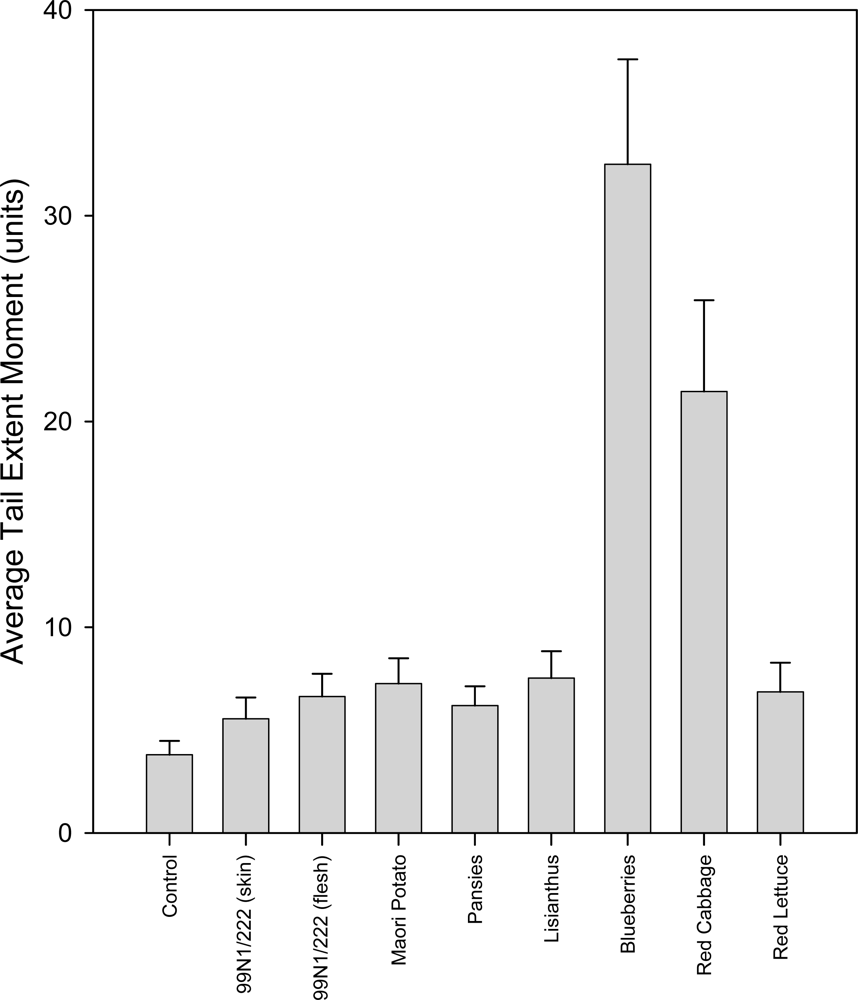
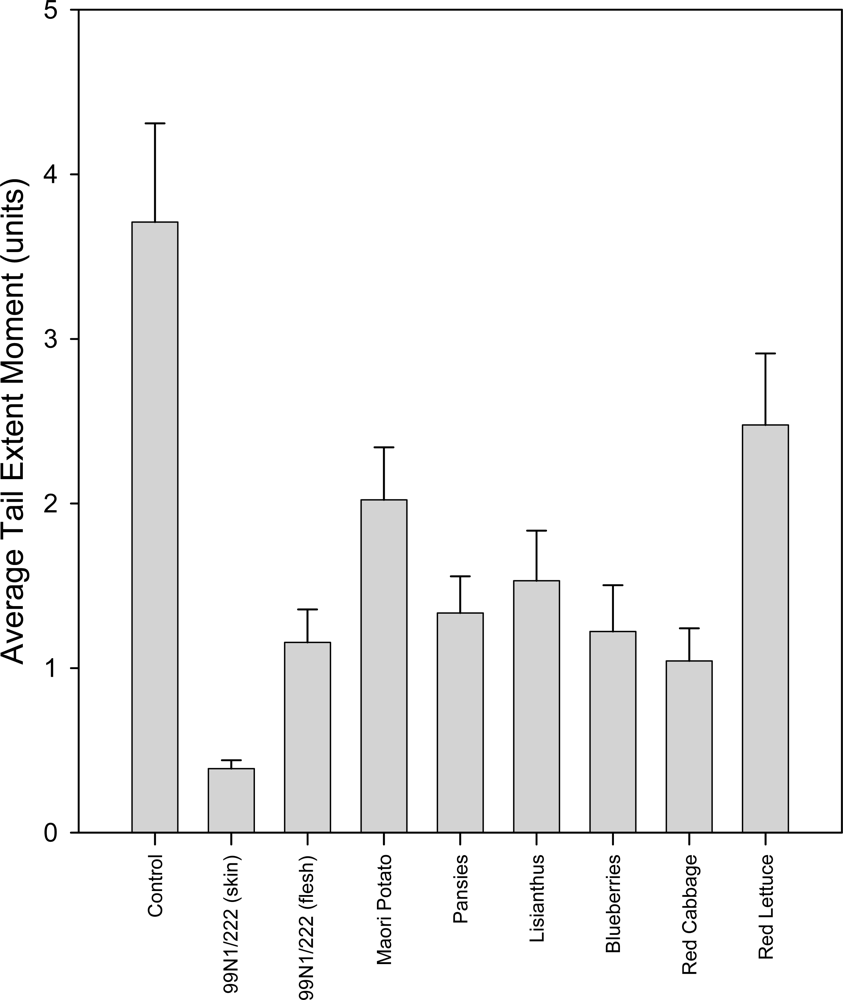
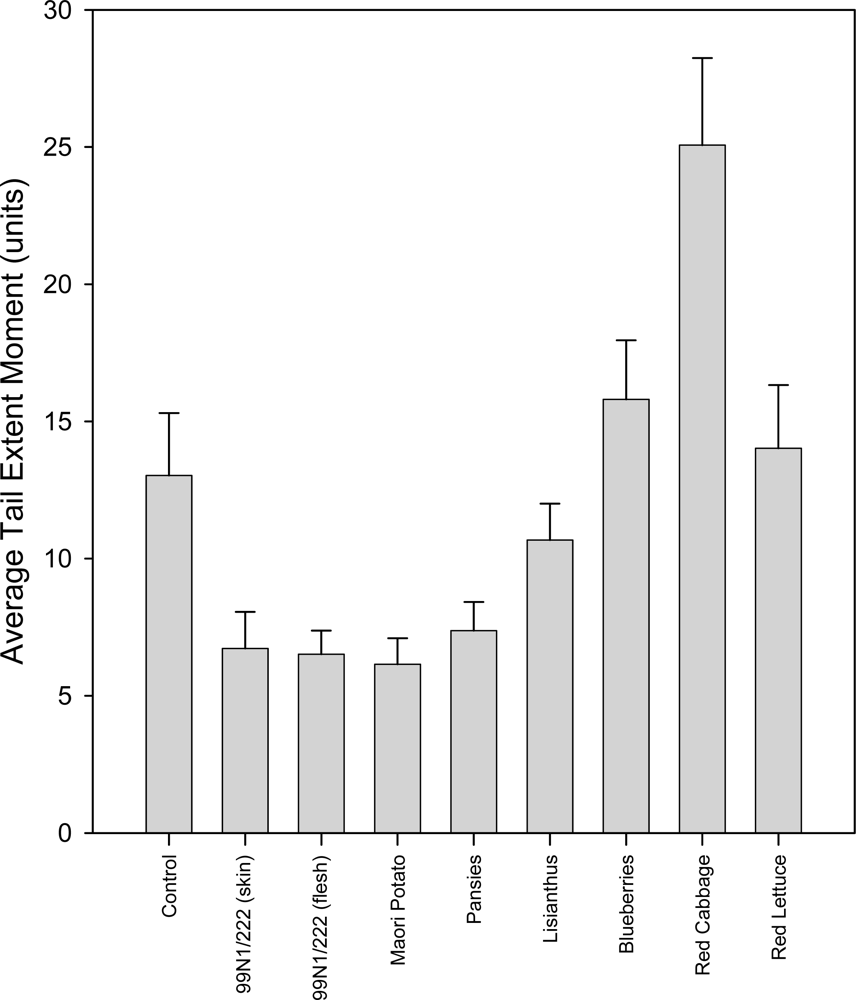
2.5. Comet Assay
2.5.1. Untreated Group
2.5.2. 0 °C Hydrogen Peroxide Treatment Group
2.5.3. 37 ºC Hydrogen Peroxide Treatment Group
2.5.4. Comparison of 0 ºC and 37 ºC Hydrogen Peroxide Treatment Groups
2.6. Discussion
3. Experimental Section
3.1. Materials
3.2. Extract preparation
3.3. DPPH Assay
3.4. Total Reactive Antioxidant Potential (TRAP) Assay
3.5. Oxygen Radical Absorbance Capacity (ORAC) Assay
3.6. Single cell gel electrophoresis (Comet) Assay
3.7. Statistical Analysis
4. Conclusions
Acknowledgments
References and Notes
- Halliwell, B. Effect of diet on cancer development: is oxidative DNA damage a biomarker? Free Radic. Biol. Med 2002, 32, 968–974. [Google Scholar]
- Ames, BN; Shigenaga, MK; Hagen, TM. Oxidants, antioxidants, and the degenerative diseases of aging. Proc. Natl. Acad. Sci. USA 1993, 90, 7915–7922. [Google Scholar]
- Simon, PW. Plant pigments for color and nutrition. HortScience 1997, 32, 12–13. [Google Scholar]
- Mori, T; Maruyama, N; Nishizawa, K; Higasa, T; Yagasaki, K; Harbone, JB; Grayer, RJ. The anthocyanins. In The Flavanoids; Harbone, JB, Ed.; Chapman & Hall: London, UK, 1988; pp. 1–20. [Google Scholar]
- Mazza, G; Fukumoto, L; Delaquis, P; Girard, B; Ewert, B. Anthocyanins, phenolics, and color of Cabernet Franc, Merlot, and Pinot Noir wines from British Columbia. J. Agric. Food Chem 1999, 47, 4009–4017. [Google Scholar]
- Wang, H; Cao, G; Prior, R. Total antioxidant capacity of fruits. J. Agric. Food Chem 1996, 44, 701–705. [Google Scholar]
- Tsuda, T. Regulation of adipocyte function by anthocyanins; possibility of preventing the metabolic syndrome. J. Agric. Food Chem 2008, 56, 642–646. [Google Scholar]
- Rice-Evans, CA; Miller, NJ; Bolwell, PG; Bramley, PM; Pridham, JB. The relative antioxidant activities of plant-derived polyphenolic flavonoids. Free Radical Res 1995, 22, 375–383. [Google Scholar]
- Cotelle, N; Bernier, JL; Catteau, JP; Pommery, J; Wallet, JC; Gaydou, EM. Antioxidant properties of hydroxy-flavones. Free Rad. Biol. Med 1996, 20, 35–43. [Google Scholar]
- Zhang, H; Wang, L; Deroles, S; Bennett, R; Davies, K. New insight into the structures and formation of anthocyanic vacuolar inclusions in flower petals. BMC Plant Biology 2006, 6, 1–14. [Google Scholar]
- Joseph, JA; Shukitt-Hale, B; Denisova, NA; Bielinski, D; Martin, A; McEwen, JJ; Bickford, PC. Reversals of age-related declines in neuronal signal transduction, cognitive, and motor behavioral deficits with blueberry, spinach, or strawberry dietary supplementation. J. Neurosci 1999, 19, 8114–8121. [Google Scholar]
- Jin-Yuarn, L; Chia-Yuan, L; I-Farn, H. Characterisation of the pigment components in red cabbage (Brassica oleracea L. var.) juice and their anti-inflammatory effects on LPS-stimulated murine splenocytes. Food Chem 2008, 109, 771–781. [Google Scholar]
- Joseph, JA; Shukitt-Hale, B; Lau, FC. Fruit polyphenols and their effects on neuronal signaling and behavior in senescence. Anns New York Acad Sci 2007, 1100. [Google Scholar]
- Philpott, M; Gould, KS; Markham, KR; Lewthwaite, SL; Ferguson, LR. Enhanced coloration reveals high antioxidant potential in new sweetpotato cultivars. J. Sci. Food Agric 2003, 83, 1076–1082. [Google Scholar]
- Philpott, M; Gould, KS; Lim, C; Ferguson, LR. In Situ and In Vitro Antioxidant Activity of Sweetpotato Anthocyanins. J. Agric. Food Chem 2004, 52, 1511–1513. [Google Scholar]
- Lewis, CE; Walker, JRL; Lancaster, JE; Sutton, KH. Determination of anthocyanins, flavanoids and phenolic acids in potatoes. I: Coloured cultivars of Solanum tuberosum L. J. Sci. Food Agric 1998, 77, 45–57. [Google Scholar]
- Lewis, CE; Walker, JRL; Lancaster, JE. Changes in anthocyanin, flavonoid and phenolic acid concentrations during development and storage of coloured potato (Solanum tuberosum L) tubers. J. Sci. Food Agric 1999, 79, 311–316. [Google Scholar]
- Cao, G; Sofic, E; Prior, RL. Antioxidant and prooxidant behavior of flavonoids: Structure-activity relationships. Free Rad. Biol. Med 1997, 22, 749–760. [Google Scholar]
- Gould, KS; Markham, KR; Smith, RH; Goris, JJ. Functional role of anthocyanins in the leaves of Quintinia serrata A. Cunn. J. Exp. Bot 2000, 51, 1107–1115. [Google Scholar]
- Kitts, DD; Hu, C. Biological and chemical assessment of antioxidant activity of sugar-lysine model maillard reaction products. Annals New York Acad. Sci 2005, 1043, 501–512. [Google Scholar]
- Singh, NP; McCoy, MT; Tice, RR; Schneider, EL. A simple technique for quantitation of low levels of DNA damage in individual cells. Exp. Cell Res 1988, 175, 184–191. [Google Scholar]
- Frankel, EN. In search of better methods to evaluate natural antioxidants and oxidative stability in food lipids. Trends Food Sci. Tech 1993, 4, 220–225. [Google Scholar]
- Frankel, EN; Meyer, AS. The problems of using one-dimensional methods to evaluate multifunctional food and biological antioxidants. J. Sci. Food Agric 2000, 80, 1925–1941. [Google Scholar]
- Rice-Evans, CA; Miller, NJ; Paganga, G. Antioxidant properties of phenolic compounds. Trends Plant Sci 1997, 2, 152–159. [Google Scholar]
- Prior, RL; Cao, G; Martin, A; Sofic, E; McEwen, OB; Lischner, N; Mainland, CM. Antioxidant Capacity as Influenced by Total Phenolic and Anthocyanin Content, Maturity, and Variety of Vaccinium Species. J. Agric. Food Chem 1998, 46, 2686–2693. [Google Scholar]
- Cao, G; Alessio, H; Cutler, R. Oxygen-radical absorbance capacity assay for antioxidants. Free Rad. Biol. Med 1993, 14, 303–311. [Google Scholar]
- Cao, G; Verdon, C; Wu, A; Wang, H; Prior, R. Automated oxygen radical absorbance capacity assay using the COBAS FARA II. Clin. Chem 1995, 413, 1738–1744. [Google Scholar]
- Ostling, O; Johanson, KJ. Microelectrophoretic study of radiation-induced DNA damages in individual mammalian cells. Biochem. Biophys. Res. Commun 1984, 123, 291–298. [Google Scholar]
- Martin, RF; Kelly, DP; Roberts, M; Green, A; Denison, L; Rose, M; Reum, M; Pardee, M. Comparative studies of UV-induced DNA cleavage by structural isomers of an iodinated DNA ligand. Int. J. Radiation Oncol. Biol. Physics 1993, 29, 549–553. [Google Scholar]
- Olive, PL; Wlodek, D; Durand, RE; Banath, JP. Factors influencing DNA migration from individual cells subjected to gel electrophoresis. Exp. Cell Res 1992, 198, 259–267. [Google Scholar]
- Halliwell, B; Clement, MV; Ramalingam, J; Long, LH. Hydrogen peroxide. Ubiquitous in cell culture and in vivo? IUBMB Life 2000, 50, 251–257. [Google Scholar]
- Aruoma, OI. Free radicals, oxidative stress, and antioxidants in human health and disease. J. Am. Oil Chemists Soc 1998, 75, 199–212. [Google Scholar]
- Rice-Evans, CA; Miller, NJ; Paganga, G. Structure-antioxidant activity relationships of flavonoids and phenolic acids. Free Rad. Biol. Med 1996, 20, 933–956. [Google Scholar]
- Arapitsas, P; Turner, C. Pressurized solvent extraction and monolithic column-HPLC/DAD analysis of anthocyanins in red cabbage. Talanta 2008, 74, 1218–1223. [Google Scholar]
- Cao, G; Russell, RM; Lischner, N; Prior, RL. Serum antioxidant capacity is increased by consumption of strawberries, spinach, red wine or vitamin C in elderly women. J. Nutr 1998, 128, 2383–2390. [Google Scholar]
- Mazza, G; Kay, CD; Cottrell, T; Holub, BJ. Absorption of anthocyanins from blueberries and serum antioxidant status in human subjects. J. Agric. Food Chem 2002, 50, 7731–7737. [Google Scholar]
- Ramirez-Tortosa, C; Andersen, OM; Gardner, PT; Morrice, PC; Wood, SG; Duthie, SJ; Collins, AR; Duthie, GG. Anthocyanin-rich extract decreases indices of lipid peroxidation and DNA damage in vitamin E-depleted rats. Free Rad. Biol. Med 2001, 31, 1033–1037. [Google Scholar]
- Philpott, M; Ferguson, LR; Gould, KS; Harris, PJ. Anthocyanidin-containing compounds occur in the periderm cell walls of the storage roots of sweet potato (Ipomoea batatas). J Plant Physiol 2009. [Google Scholar]


| Common name | Botanical name | Anthocyanidin[s] | References |
|---|---|---|---|
| Red lettuce | Lactuca sativa L. var. Lollo Rosso | Cyanidin | [12] |
| Red cabbage | Brassica oleracea L. var. capitata f. rubra | Cyanidin | [12] |
| Blueberry | Vaccinium corymbosum L. | Delphinidin, cyanidin, petunidin, peonidin, and malvidin | [11,13] |
| Maori potato (flesh) | Solanum tuberosum L. var Ureniki | Petunidin, malvidin. | [16,17] |
| Kumara var. “Rascal” (flesh) | Ipomoea batatas L. var 99N1/222 | Cyanidin, peonidin. | [14,15] |
| Kumara var. “Rascal” (skin) | Ipomoea batatas L. var 99N1/222 | Cyanidin, peonidin. | [14,15] |
| Deep purple pansy | Viola x wittrockiana | Delphinidin. | [10] |
| Deep purple lisianthus | Eustoma grandiflorum | Delphinidin, Cyanidin | [10] |
| Control | 99N1/222 (skin) | 99N1/222 (flesh) | Maori Potato | Pansies | Lisianthus | Blueberries | Red Cabbage | Red Lettuce | |
|---|---|---|---|---|---|---|---|---|---|
| Control | |||||||||
| 99N1/222 (skin) | 0.000 | ||||||||
| 99N1/222 (flesh) | 0.000 | 0.000 | |||||||
| Maori Potato | 0.014 | 0.000 | 0.023 | ||||||
| Pansies | 0.000 | 0.000 | 0.552 | 0.079 | |||||
| Lisianthus | 0.001 | 0.000 | 0.304 | 0.266 | 0.603 | ||||
| Blueberries | 0.000 | 0.004 | 0.848 | 0.062 | 0.755 | 0.457 | |||
| Red Cabbage | 0.000 | 0.002 | 0.690 | 0.010 | 0.331 | 0.181 | 0.604 | ||
| Red Lettuce | 0.098 | 0.000 | 0.006 | 0.400 | 0.020 | 0.076 | 0.016 | 0.003 |
| Control | 99N1/222 (skin) | 99N1/222 (flesh) | Maori Potato | Pansies | Lisianthus | Blueberries | Red Cabbage | Red Lettuce | |
|---|---|---|---|---|---|---|---|---|---|
| Control | |||||||||
| 99N1/222 (skin) | 0.018 | ||||||||
| 99N1/222 (flesh) | 0.008 | 0.893 | |||||||
| Maori Potato | 0.006 | 0.724 | 0.776 | ||||||
| Pansies | 0.025 | 0.704 | 0.527 | 0.387 | |||||
| Lisianthus | 0.373 | 0.037 | 0.009 | 0.006 | 0.053 | ||||
| Blueberries | 0.376 | 0.000 | 0.000 | 0.000 | 0.001 | 0.044 | |||
| Red Cabbage | 0.002 | 0.000 | 0.000 | 0.000 | 0.000 | 0.000 | 0.017 | ||
| Red Lettuce | 0.759 | 0.007 | 0.003 | 0.002 | 0.009 | 0.210 | 0.572 | 0.005 |
| Control | 99N1/222 (skin) | 99N1/222 (flesh) | Maori Potato | Pansies | Lisianthus | Blueberries | Red Cabbage | Red Lettuce | |
|---|---|---|---|---|---|---|---|---|---|
| Control | |||||||||
| 99N1/222 (skin) | 0.159 | ||||||||
| 99N1/222 (flesh) | 0.029 | 0.473 | |||||||
| Maori Potato | 0.015 | 0.288 | 0.705 | ||||||
| Pansies | 0.039 | 0.642 | 0.762 | 0.492 | |||||
| Lisianthus | 0.012 | 0.262 | 0.601 | 0.881 | 0.407 | ||||
| Blueberries | 0.000 | 0.000 | 0.000 | 0.000 | 0.000 | 0.000 | |||
| Red Cabbage | 0.000 | 0.001 | 0.001 | 0.002 | 0.001 | 0.003 | 0.104 | ||
| Red Lettuce | 0.002 | 0.166 | 0.543 | 0.863 | 0.326 | 0.998 | 0.000 | 0.002 |
| Extract | P-Value |
|---|---|
| Control | 0.000 |
| 99N1/222 (skin) | 0.485 |
| 99N1/222 (flesh) | 0.932 |
| Maori Potato | 0.475 |
| Pansies | 0.402 |
| Lisianthus | 0.092 |
| Blueberries | 0.003 |
| Red Cabbage | 0.508 |
| Red Lettuce | 0.010 |
© 2009 by the authors; licensee Molecular Diversity Preservation International, Basel, Switzerland. This article is an open-access article distributed under the terms and conditions of the Creative Commons Attribution license ( http://creativecommons.org/licenses/by/3.0/). This article is an open-access article distributed under the terms and conditions of the Creative Commons Attribution license ( http://creativecommons.org/licenses/by/3.0/).
Share and Cite
Philpott, M.; Lim, C.C.; Ferguson, L.R. Dietary Protection Against Free Radicals: A Case for Multiple Testing to Establish Structure-activity Relationships for Antioxidant Potential of Anthocyanic Plant Species. Int. J. Mol. Sci. 2009, 10, 1081-1103. https://doi.org/10.3390/ijms10031081
Philpott M, Lim CC, Ferguson LR. Dietary Protection Against Free Radicals: A Case for Multiple Testing to Establish Structure-activity Relationships for Antioxidant Potential of Anthocyanic Plant Species. International Journal of Molecular Sciences. 2009; 10(3):1081-1103. https://doi.org/10.3390/ijms10031081
Chicago/Turabian StylePhilpott, Martin, Chiara Cheng Lim, and Lynnette R. Ferguson. 2009. "Dietary Protection Against Free Radicals: A Case for Multiple Testing to Establish Structure-activity Relationships for Antioxidant Potential of Anthocyanic Plant Species" International Journal of Molecular Sciences 10, no. 3: 1081-1103. https://doi.org/10.3390/ijms10031081