Article

Co-localization of Carbonic Anhydrase and Phosphoenol-pyruvate Carboxylase and Localization of Pyruvate Kinase in Roots and Hypocotyls of Etiolated Glycine max Seedlings

1
Department of Agricultural Biotechnology, Agricultural University of Athens, Iera Odos 75, 11855 Botanikos, Athens, Greece
2
Institute of Biology, Splaiul Independentei 296, Bucharest 060031, Romania
*
Author to whom correspondence should be addressed.
Int. J. Mol. Sci. 2009, 10(7), 2896-2910; https://doi.org/10.3390/ijms10072896
Submission received: 12 May 2009 / Revised: 17 June 2009 / Accepted: 26 June 2009 / Published: 29 June 2009
(This article belongs to the Section Biochemistry)

Abstract

:
We investigated the presence of carbonic anhydrase in root and hypocotyl of etiolated soybean using enzymatic, histochemical, immunohistochemical and in situ hybridization approaches. In parallel, we used in situ hybridization and immunolocalization to determine the expression pattern and localization of phosphoenolpyruvate carboxylase. Their co-localization in the root tip as well as in the central cylinder, suggests that a large fraction of the CO2 may be re-introduced into C4 compounds. GmPK3 expression, coding for a cytoplasmic isoform of pyruvate kinase, was detected in all different root cell types, suggesting that both phosphoenolpyruvate-utilizing enzymes are involved in phosphoenolpyruvate metabolism in etiolated soybean roots; a case indicative of the necessary flexibility plant metabolism has to adopt in order to compensate various physiological conditions.

1. Introduction

Carbonic anhydrase (CA; EC: 4.2.1.1) is a zinc-containing enzyme that catalyzes the reversible of CO2 to HCO3 and has been found in the three domains of life: archaea, bacteria and eukarya. So far, four distinct CA classes have been reported namely α-, β-, γ- and δ-CA [1,2]. A fifth class, named ɛ-CA, is found in several marine cyanobacteria and chemolithoautotrophic bacteria [3] but recent studies indicated that this class is a variant of β-CA [4]. In plants, all known CAs belong to classes α, β and γ, with the β class being the predominant [57].
In photosynthetic organisms, the carbonic anhydrases are involved in diverse physiological processes such as ion exchange, acid/base balance, carboxylation/decarboxylation reactions and inorganic carbon diffusion between the cell and its environment as well as within the cell [8]. In C3 plants, most CA activity is localized to the chloroplast stroma of the mesophyll cells and may be responsible for maintaining adequate concentrations of CO2 around ribulose-bisphosphate carboxylase (Rubisco, EC 4.1.1.39) by facilitating the diffusion of CO2 across the chloroplast envelope or by rapidly dehydrating bicarbonate to CO2 [9,10]. In contrast, a cytoplasmic β-CA facilitates the hydration of atmospheric CO2 to bicarbonate, the substrate of phosphoenolpyruvate carboxylase (PEPC; EC 4.1.1.31), the primary carboxylating enzyme for C4 or CAM photosynthesis [1113].
PEPC catalyzes the β-carboxylation of PEP, in the presence of Mg2+, to yield oxaloacetate and inorganic phosphate [12]. The active enzyme acts as a homotetramer, of approximately 400 kDa, in the cytoplasm of plant cells and is encoded by small gene families whose members show differential expression in plant organs [14]. C4 and CAM plants, apply PEPC for the initial fixation of atmospheric CO2, while in leaves of C3 plants; the enzyme is involved in the anaplerotic replenishment of tricarboxylic acid cycle intermediates [15]. Furthermore, PEPC isoforms, also known as C3 or root isoforms are highly expressed in non-green tissues of C3 plants such as roots and legume root nodules [1619]. These isoforms evolved from the anaplerotic (C3) enzyme, but show different expression levels and tissue specificities. Also, they differ in their catalytic properties concerning substrate affinity and allosteric regulation by metabolic intermediates [20].
In such nonphotosynthetic tissues, respiration is considered an important source of CO2 to supply the PEPC catalyzed reaction. Nevertheless, if the uncatalyzed rate of CO2 conversion to HCO3 is not sufficiently high, enzymatic hydration of CO2 to HCO3 by carbonic anhydrases is necessary [21]. A temporal and spatial association of cytoplasmic β-CA with PEPC expression supports their functional coupling into refixing the respired CO2 in highly respiring non-green tissues, such as legume seeds and young nodules [15,16,22,23].
Even though, PEPC has been considered as the main plant anaplerotic enzyme [24], pyruvate kinase (PK, EC 2.7.1.40) can, as well, utilize PEP converting it to pyruvate, which is a key metabolic intermediate of many pathways, such as energy production and the biosynthesis of amino acids, organic acids and fatty acids [25]. PK exists as cytosolic and plastidic isoforms with diverse physical, immunological and kinetic characteristics [25]. Tissue-specific cytosolic PK isoforms have been demonstrated considerable differences in their kinetic and regulatory properties reflecting the particular metabolic requirements of the respective tissues [26].
Roots and hypocotyls of etiolated seedlings are actively growing and highly respiring heterotrophic tissues where the possible association of CA with PEPC could be further studied. Although it has been considered that a PEPC mediated CO2 fixation is taking place in C3 plant roots [18,27,28]; and the presence of CA has been confirmed there [7,29,30], even if in some cases CA activity could not be detected [31], the precise cellular localization of both enzymes still has not been adequately investigated. In the present study, the presence of CA in roots and hypocotyls of etiolated soybean seedlings was examined using enzymatic, histochemical, immunohistochemical and in situ hybridization approaches, while the cellular localization of PEPC was investigated using both immunohistochemical and in situ hybridization approaches. In addition, the temporal and spatial gene expression patterns of pyruvate kinase (GmPK3) were investigated as the enzyme utilizes the same substrate with PEPC.

2. Results

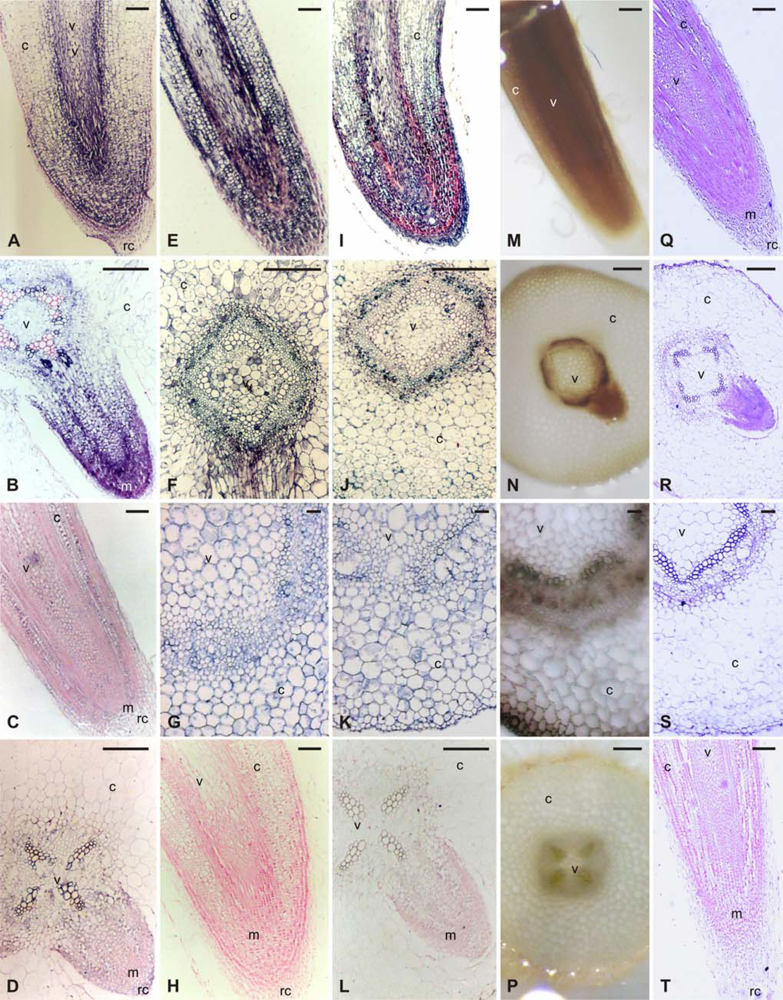
2.1. CA activity and histochemical localization of CA activity in etiolated G. max seedlings

The presence of CA enzyme activity, in soybean roots and etiolated hypocotyls, was investigated spectrophotometrically. The data indicated that CA activity was observed in most tissues examined, with significantly higher levels detected in roots of etiolated soybean plants as compared to that observed in hypocotyls (p<0.05, Table 1).
The spatial distribution of CA activity was visualized by an in situ staining for activity in fresh sections of G. max roots and hypocotyls. Activity of the enzyme is coupled to the formation of a black precipitate. High levels of CA activity were detected at the meristematic zone of the primary and lateral root (Figures 1M and N). Less staining was detected in metaxylem vessels but also in phloem and in the middle enlarging cortical cells for both root and hypocotyls (Figures 1N and O). As a negative control, the histochemical assay was performed in the absence of NaHCO3 (Figure 1P).

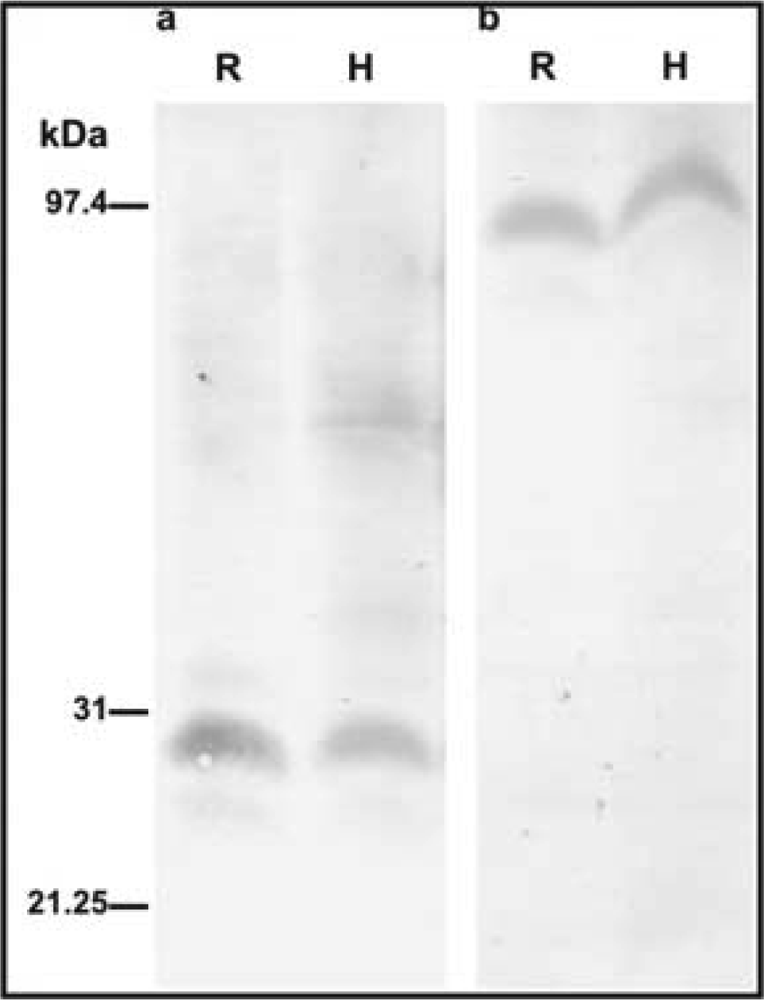
2.2. Immunohistochemical detection of CA and PEPC protein

Extracts from roots and hypocotyls of etiolated seedlings were analyzed by Western blot using the polyclonal antibodies raised against GmCA1 coding for a beta-type cytoplasmic CA and GmPEPC7 coding for a cytoplasmic PEPC [16]. Both antibodies detected a polypteptide of about 29 and 100kDa respectively, in both roots and hypocotyls (Figure 2). Using the polyclonal antibody raised against GmCA1, CA was previously localized in the cytoplasm of the inner cortical cells and the cell walls of the endodermal cells of mature soybean nodules [32].
The spatial distribution of CA and PEPC protein in the different cell types of roots and hypocotyls of etiolated seedlings was examined by immunohistochemical localization. Transverse and longitudinal root sections as well as transverse hypocotyls sections were incubated with polyclonal antibodies raised against GmCA1 and GmPEPC7. It was observed that the PEPC protein was detected in all tissues. However, the signal was higher in cells of the region of cell division, but in the region of elongation it was restricted at the vascular cylinder and in a few neighboring cell layers (Figure 1E). The localization of CA protein essentially followed the patterns of localization of PEPC protein, with higher expression in developing metaxylem vessels, sieve elements and enlarging cortical cells, for both root and hypocotyls (Figure 1J and K). Furthermore, high signal was detected at the root apical meristem (Figure 2I). When sections were incubated with pre-immune serum, as a negative control, no significant signal was detected (Figure 1L).

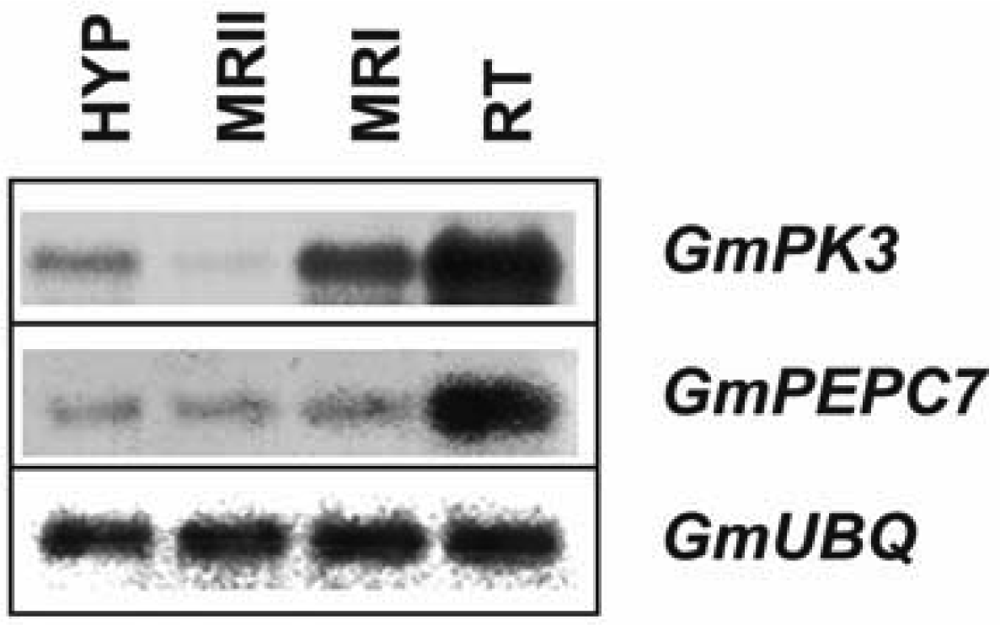
2.3. Spatial patterns of GmCA1, GmPEPC7 and GmPK3 transcripts in primary and lateral roots of etiolated G. max seedlings

To confirm the presence of GmPEPC7 and GmPK3 gene transcripts in roots (the root region of cell division, elongation, and the root region of laterals emergence) and hypocotyls of 8-days old etiolated soybean seedlings, we used a semi quantitative reverse transcription-PCR approach. A housekeeping gene coding for ubiquitin was used as an internal control. As shown in Figure 3, GmPEPC7 gene transcripts were detected in all parts of the root examined and hypocotyls, with the highest levels of accumulation to be detected in the root tip region of 8-day old etiolated seedlings. GmPK3 transcript accumulation was observed in all tissues tested with the highest levels in the root tip region (RT) of 8-day old etiolated seedlings while very low levels compared to the other tissues, were detected in the root region of laterals emergence (MRII).
Having established the presence of GmPK3 and GmPEPC7 gene transcripts, their spatial localization during root development was investigated using an in situ hybridization method. Longitudinal sections of primary and lateral roots of 8-day old etiolated soybean seedlings were hybridized with 11-digoxigenin-rUTP-labeled RNA probes transcribed from GmPK3 and GmPEPC7 cDNA clones. GmPK3 (Figure 1C and D) and GmPEPC7 (Figures 1A and B) expression was detected in the root tip region and mostly in the developing cortex parenchyma of root tip and in the central root cap region of the primary and lateral roots. Levels of both transcripts, in the vascular tissue and in a few cell layers neighbouring the vascular tissue, gradually increased from the region of cell division to the region of elongation and then decreased in the region of laterals emergence. GmPK3 and GmPEPC7 transcripts were detected in most cells in the region of cell division of lateral roots, but as the cells differentiated; GmPK3 and GmPEPC7 expression was confined to the vascular cylinder (Figures 1B and D). Moreover, the signal for both gene transcripts was very high in developing xylem vessels. As a negative control, sections were hybridized to sense RNA probes transcribed from the corresponding cDNAs. In that case, no significant signal was detected (Figure 1H).
Subsequently, the GmCA1 gene expression pattern was studied using the in situ hybridization method. Essentially, GmCA1 transcripts localization followed the patterns of localization of CA protein and activity, with higher expression in developing metaxylem vessels, sieve elements and enlarging cortical cells, for both root and hypocotyls (Figures 1R and S). Furthermore, high signal was detected at the root apical meristem (Figure 1Q) the root epidermis and some underlying cell layers (Figures 1R and S). When sections were incubated with sense probe for the GmCA1 gene, as a negative control, no significant signal was detected (Figure 1T).

3. Discussion

Although it has been suggested that the uncatalyzed hydration of CO2 occurs at rates sufficient to support the activities of root PEPC [21], inhibitors of CA activity inhibited respiratory O2 consumption and DI14C (DIC: dissolved inorganic carbon, CO2+HCO3) incorporation by tomato roots [33]. Furthermore, the in vitro rates of CA activity found in tomato roots were higher than the in vitro rates of PEPC activity [34] agreeing with the in vivo results in maize root tips [27].
In the present study, our histochemical and immunohistochemical data showed that CA activity and protein, as well as GmCA1 gene expression pattern studied with in situ hybridization, coincide to tissues with the highest metabolic activity, such as the root apical meristem where cell division occurs, the middle layer of cortical parenchyma of root and hypocotyls where the cells are elongating and enlarging and the metaxylem and phloem vessels of root and hypocotyls which are still maturing. The co-localization of PEPC and CA suggests that a large fraction of the respired CO2 in the root and hypocotyls tissue may be re-introduced into C4 compounds. Zeeman and up Rees [35] reported a rate of carbon dioxide release of 0.028 μmol sucrose equivalents min−1·g−11 fresh weight from Arabidopsis roots. Furthermore, tobacco shows characteristics of C4 photosynthesis in cells of stem and petioles that surround the xylem and phloem while these cells are supplied with carbon for photosynthesis from the vascular system and not from stomata. These photosynthetic cells possess high activities of enzymes characteristic of C4 photosynthesis, which allow the decarboxylation of four-carbon organic acids from the xylem and phloem, thus releasing CO2 for photosynthesis [36]. Similarly, organic acids produced by PEPC activity in soybean roots and hypocotyls may translocate through the vascular system to other plant organs where they could be decarboxylated and the released CO2 may be reassimilated to form carbohydrates.
Our data indicated that high signal of CA activity and protein as well as GmCA1 gene transcripts, were visible in the vascular tissue of roots and hypocotyls. A close examination of the expression patterns of different CAs in different cell types revealed that two gene loci of Arabidopsis encoding two distinct carbonic anhydrases are expressed at high levels in the stele [37]. In root steles, in which the vascular tissue is embedded in, low oxygen concentrations have been reported [38], while results from recent studies show that oxygen concentration is low inside the transport phloem in planta [39]. The meristematic and the root region of elongation have the greatest demand for O2 [40] so under low oxygen conditions, CA may facilitate oxygen diffusion inside the root, in ways similar to those suggested in legume nodules [41]. The joint action of CA and PEPC would increase malate production, resulting in increased cell osmotic potential, water influx, increased cell turgor and increased oxygen diffusion especially among cortex cells. Alternatively, CA may be involved in the control of bicarbonate/CO2 equilibrium across the different root cell layers playing a major role in the transport of O2 wherever there is gas-space continuum.
The relative activity of PEPC and PK has been compared in different growing tissues and seems to be highly variable. In sugar-fed maize root tips [42,43] and developing soybean seeds [44] as in tomato cells in exponential phase [45], three-fourths of triose-P provided by glycolysis have been found to be directed to tricarboxylic acid cycle through the PK. This slowing down of the PEPC flux could be compared with the interruption of this flux observed in corn root tips after 6h of carbon starvation [46]. This observation suggests that the PEPC activity was related to the supply of sugars to the cell. Roots of etiolated seedlings are actively growing and highly respiring heterotrophic tissues, in which a significant proportion of the carbon entering the glycolytic pathway is incorporated into numerous compounds such as amino acids, nucleic acids, fatty acids, and secondary metabolites [47]. Our temporal and spatial gene expression studies revealed that GmPK3 and GmPEPC7 are co-expressed in meristematic tissues of the root tip as well as in the central cylinder of etiolated soybean roots, suggesting that both PK and PEPC are involved in PEP metabolism in these tissues. Although accurate conclusions about which enzyme activity predominates can not be concluded from the present results, fine regulation of the PEP branch point may provide the plant with the necessary flexibility under a wide variety of physiological conditions.

4. Conclusions

In conclusion, our data showed that the pattern of cellular CA protein and activity localization as well as GmCA1 spatial expression pattern in roots and hypocotyls of etiolated G. max seedlings essentially follows the spatial pattern of PEPC protein; suggesting that CA functions in accelerating carbon assimilation ensuring a continuous supply of bicarbonate to PEPC, which is able to reintroduce CO2 produced in respiration into metabolic intermediates. Furthermore, GmPK3 expression, coding for a cytoplasmic isoform of PK, sharing the same substrate with PEPC, was detected in all different root cell types, indicating the necessary flexibility plant metabolism has to adopt in order to compensate various physiological conditions.

5. Experimental Section

5.1. Plant material and growth conditions

Soybean (Glycine max cv. Williams) seeds were pre-germinated on two sheets of moist paper, in Petri dishes, in darkness, at 26 °C, for 8 days. RNA was isolated from hypocotyls (HYP), and different parts of roots, representing the region of cell division (RT), the root region of elongation (MRI) and the root region of laterals emergence (MRII). The different parts of the root were determined using a stereoscope. For in situ hybridization, histochemical detection of enzyme activity and immune-histochemical detection of proteins, the roots from the 8-day old seedlings were used.

5.2. Characterization of a cDNA clone coding for GmPK3

By performing BLAST searches [48] among the soybean EST databases, many cDNA clones coding for a cytoplasmic isoform of PK were identified, obtained from ResGen, Invitrogen Corp., and their nucleotide sequences were determined. Alignment of these sequences allowed the identification of a distinct cDNA clone encoding a cytoplasmic isoenzyme of PK. As a part of its 5′ end was missing, total RNA was extracted from the roots of 8-day old seedlings [49] and a 5′ RACE-PCR was performed with the SMART 5′ RACE kit from Clontech (Westburg, NL). The amplified fragment was cloned into the pBlueScriptKS+ plasmid vector (Stratagene) and fully sequenced. The full-length cDNA clone was designated as GmPK3 (NCBI accession number: CAI53675). The Clustal procedure was used for both analysis of the sequence data and determination of the relatedness of the deduced polypeptide to related sequences from other species.

5.3. RT-PCR analysis of GmPK3 and GmPEPC7 transcript levels

Semi-quantitative RT-PCR analysis was performed using total RNA extracted from the tissues of interest as described above and quantified by spectrophotometry and agarose gel electrophoresis. All RNA samples were treated with DNase I (Promega) according to the manufacturer’s instructions, to eliminate DNA contamination. In each case, the RT-PCR reactions were performed, according to the manufacturer’s directions (Qiagen) using gene-specific oligonucleotides as primers (GmPK3F: 5′-GGAGCTACTGATGTTGCC-3′, GmPK3R: 5′-CATGAGAAGCTCTAGCAG-3′, GmPEPC7F: 5′-ACCAGTTTGGATGCTGGG-3′, GmPEPC7R: 5′-ATCTGTACGGAAGGCAGC-3′). GmPEPC7 cDNA has been isolated and characterized previously [16]. RNase inhibitor was obtained from Promega. For normalization of the different RNA preparations, a fragment of GmUBQ was amplified, using two gene-specific oligonucleotides as primers (GmUBQF: 5′-GGGTTTTAAGCTCGTTGT-3′, GmUBQR: 5′-GGACACATTGAGTTCAAC-3′). The reverse transcriptase reactions were performed in a thermal cycler at 50 °C for 30 min, followed by PCR amplification of 25-30 cycles at 94 °C for 1 min, 54 °C for 1 min and 72 °C for 1 min. A complete final extension for the PCR products was performed at 72 °C for 10 min. Amplified products were separated on 1.5% agarose gels, blotted on to nylon membranes and hybridized with the respective digoxigenin-11-rUTP labeled cDNA probes.

5.4. In situ hybridization

In situ hybridization of root segments was carried out essentially as described [50]. Root segments (5 mm) were fixed in 4% (w/v) paraformaldehyde supplemented with 0.25% (v/v) glutaraldehyde in 10mM sodium phosphate buffer (pH 7.4), for 1h, in a vacuum aspirator, dehydrated with ethanol, and then exchanged with xylene before embedding in paraffin. Sections (8 μm) were mounted on poly-l-lysine slides, digested with proteinase K for 30min at 37°C, treated with acetic anhydride, dried in ethanol, and then hybridized with appropriate gene specific digoxigenin-labeled probes overnight, at 42 °C. After washing with 4xSSC containing 5mM dithiothreitol, the slides were treated with RNase A for 30 min, at 37 °C, washed again at 37 °C with RNase A buffer (500 mM NaCl, 1 mM EDTA, 10 mM Tris-HCl, pH 7.5) containing 5mM dithiothreitol, and then processed for developing the digoxigenin antigen. This involved blocking with blocking reagent (0.5% blocking reagent in 100mM Tris-HCl, 150 mM NaCl, pH 7.5) for 30 min and BSA (1%BSA in 100 mM Tris-HCl, 150 mM NaCl, pH 7.5 containing 0.5% blocking reagent), followed by incubation with an anti-digoxigenin antibody conjugated to alkaline phosphatase (dilution 1:500 in 100 mM Tris-HCl, 150 mM NaCl, pH 7.5) for 2 h, and washing with blocking reagent (1%BSA in 100 mM Tris-HCl, 150 mM NaCl, pH 7.5 containing 0.5% blocking reagent) for 1h. The color was revealed by incubation in NBT and BCIP as long as necessary and the reactions were stopped with water, slides dehydrated, air-dried, and then mounted in DPX before viewing. Antisense and sense probes labeled with digoxigenin-11-rUTP (Roche) were used in parallel hybridizations. The sections were examined using a ZEISS Axiolab (Carl Zeiss, Jena, Germany) microscope and pictures were taken with SONY DSC-S75 38P/45 (SONY Corporation, Japan) digital camera system.

5.5. Histochemical localization of CA activity

CA activity was histochemically localized in G. max tissues as previously described [16]. Approximately 1–5 mm free-hand sections of G. max fresh roots and hypocotyls were cutted and fixed in 2% (w/v) paraformaldehyde, 2% (w/v) polyvinilopyrolidone (PVP) and 1 mM dithiothreitol (DTT) for 30 min at room temperature. The sections were washed in distilled H2O overnight at 4 °C and then incubated in the reaction mixture for 30 min. The reaction mixture was prepared fresh immediately before use by quickly mixing 17 mL of solution A containing 12 mM NiSO4, 180 mM H2SO4 and 39 mM KH2PO4 with 40 mL of solution B containing 220 mM NaHCO3. After incubation the sections were washed for 10 min in 0.67 mM phosphate buffer (pH 5.9). The developing of the histochemical color was performed by transferring the sections in 0.5% (v/v) (NH4)2SO4.

5.6. Total CA activity of G. max organ extracts

Freshly harvested tissues were homogenized in liquid nitrogen. Total CA activity was determined spectrophotometrically using a modification of the pH-indicator method [51]. Tissue extracts were mixed with 200 μL of reaction buffer [190 μL of 0.1M phosphate buffer pH: 6.5 and 10 μL of 0.1% (v/v) bromothymol blue] and 700 μL of 0.1M NaHCO3 and the increase in absorbance at 615 nm was monitored at 4 °C using a HITACHI U-2800 spectrophotometer. The observed rate was converted to equivalent μmol H+ consumed by comparison with a calibration established by titrating the reaction buffer with NaOH. The protein concentration was determined by the procedure of Bradford [52]. Data were analysed by one-way ANOVA.

5.7. Protein extraction from G. max tissues and Western blot of PEPC and CA

Approximately 0.5 g of soybean roots or hypocotyls were grounded in a mortar containing liquid nitrogen and the powder was mixed with equal volume of extraction buffer (125 mM Tris-HCl pH 6.8, 20% glycerol, 6% SDS) and centrifuged. Approximately 20 μg of total proteins were separated by sodium dodecyl sulfate-polyacrylamide gel electrophoresis (SDS-PAGE; 15% polyacrylamide) and then electrotransfered to nitrocellulose (Hybond-C extra; Amersham). Nonspecific binding sites on the membranes were blocked by 30 min incubation in TBST (20 mm Tris-HCl, pH 8.0, containing 150 mm NaCl, 0.05% Tween 20 and 1% BSA). The blots were probed with the antiserum raised against GmPEPC7 and GmCA1 [16] at a 1/2.500 dilution, in the blocking buffer, at room temperature, for 30 min. Blots were washed three times in TBST and then incubated with secondary antibody (alkaline phosphatase conjugated anti-rabbit IgG at dilution 1:1000 in TBST). Blots were again washed three times in TBST and the color was revealed by incubation in NBT and BCIP as long as necessary and the reactions were stopped with water.

5.8. Immunohistochemical detection of PEPC and CA

Approximately 5 mm root segments were embedded in paraffin and sectioned as described for the in situ hybridization method. 8 μm sections were blocked as previously reported and incubated overnight with antiserum raised against GmPEPC7 and GmCA1 [16]. Briefly, sections were incubated in 3% BSA in TBST (20 mM Tris-HCl, 150 mM NaCl, 0.05% Tween20, pH 7.5) for 1h and then in the antibody solutions (pre-immune serum and immune serum were used at dilution of 1:1500 in TBST) for 14 h. Sections were washed with TBST for 15 min and then incubated with secondary antibody (alkaline phosphatase conjugated anti-rabbit IgG at dilution 1:500 in 1% BSA in TBST). Sections incubated with pre-immune serum were used as control. The color was revealed by incubation in NBT and BCIP as long as necessary and the reactions were stopped with water. The sections were examined using a ZEISS Axiolab (Carl Zeiss, Jena, Germany) microscope and pictures were taken with SONY DSC-S75 38P/45 (SONY Corporation, Japan) digital camera system.

References and Notes

  1. Tripp, BC; Smith, K; Ferry, JG. Carbonic anhydrase: New insights for an ancient enzyme. J. Biol. Chem 2001, 276, 48615–48618. [Google Scholar]
  2. Lane, TW; Morel, FM. Regulation of carbonic anhydrase expression by zinc, cobalt, and carbon dioxide in the marine diatom Thalassiosira weissflogii. Plant Physiol 2000, 123, 345–352. [Google Scholar]
  3. So, AK-C; Aspie, GS; Williams, EB; Sively, JM; Heinhorst, S; Cannon, GC. A novel evolutionary lineage of carbonic anhydrase (ɛ class) is a component of the carboxysome shell. J. Bacteriol 2004, 186, 623–630. [Google Scholar]
  4. Sawaya, MR; Cannon, GC; Heinhorst, S; Tanaka, S; Williams, EB; Yeates, TO; Kerfeld, CA. The structure of beta-carbonic anhydrase from the carboxysomal shell reveals a distinct subclass with one active site for the price of two. J. Biol. Chem 2006, 281, 7546–7555. [Google Scholar]
  5. Rowlett, RS; Tu, C; Murray, PS; Chamberlin, JE. Examination of the role of Gln-158 in the mechanism of CO2 hydration catalyzed by beta-carbonic anhydrase from Arabidopsis thaliana. Arch. Biochem. Biophys 2004, 425, 25–32. [Google Scholar]
  6. Parisi, G; Perales, M; Fornasari, MS; Colaneri, A; Gonzalez-Schain, N; Gomez-Casati, D; Zimmermann, S; Brennicke, A; Araya, A; Ferry, JG; Echave, J; Zabaleta, E. Gamma carbonic anhydrases in plant mitochondria. Plant Mol. Biol 2004, 55, 193–207. [Google Scholar]
  7. Fabre, N; Reiter, IM; Becuwe-Linka, N; Genty, B; Rumeau, D. Characterization and expression analysis of genes encoding alpha and beta carbonic anhydrases in Arabidopsis. Plant Cell Environ 2007, 30, 617–629. [Google Scholar]
  8. Moroney, JV; Bartlett, SG; Samuelsson, G. Carbonic anhydrases in plants and algae. Plant Cell Environ 2001, 24, 141–153. [Google Scholar]
  9. Price, GD; von Caemmerer, S; Evans, JR; Yu, JW; Lloyd, J; Oja, V; Kell, P; Harrison, K; Gallagher, A; Badger, MR. Specific reduction of chloroplast carbonic anhydrase activity by antisense RNA in transgenic tobacco has a minor effect on photosynthetic CO2 assimilation. Planta 1994, 193, 331–340. [Google Scholar]
  10. Jebanathirajah, JA; Coleman, JR. Association of carbonic anhydrase with a Calvin cycle enzyme complex in Nicotiana tabacum. Planta 1998, 204, 177–182. [Google Scholar]
  11. Burnell, JN; Hatch, MD. Low bundle sheath carbonic anhydrase is apparently essential for effective C4 pathway operation. Plant Physiol 1988, 86, 1252–1256. [Google Scholar]
  12. Chollet, R; Vidal, J; O’Leary, MH. Phosphoenolpyruvate carboxylase: A ubiquitous, highly regulated enzyme in plants. Annu. Rev. Plant Physiol. Plant Mol. Biol 1996, 47, 273–298. [Google Scholar]
  13. Von Caemmerer, S; Quinn, V; Hancock, NC; Price, GD; Furbank, RT; Ludwig, M. Carbonic anhydrase and C4 photosynthesis: A transgenic analysis. Plant Cell Environ 2004, 27, 697–703. [Google Scholar]
  14. Sánchez, R; Cejudo, FJ. Identification and expression analysis of a gene encoding a bacterial-type phosphoenolpyruvate carboxylase from Arabidopsis and rice. Plant Physiol 2003, 132, 949–957. [Google Scholar]
  15. Huppe, HC; Turpin, DH. Integration of carbon and nitrogen metabolism in plant and algal cells. Annu. Rev. Plant Physiol. Plant Mol. Biol 1994, 45, 577–607. [Google Scholar]
  16. Kavroulakis, N; Flemetakis, E; Aivalakis, G; Katinakis, P. Carbon metabolism in developing soybean root nodules: The role of carbonic anhydrase. Mol. Plant Microbe Interact 2000, 13, 14–22. [Google Scholar]
  17. Flemetakis, E; Dimou, M; Cotzur, D; Aivalakis, G; Efrose, RC; Kenoutis, C; Udvardi, M; Katinakis, P. A Lotus japonicus beta-type carbonic anhydrase gene expression pattern suggests distinct physiological roles during nodule development. Biochim Biophys. Acta 2003, 1628, 186–194. [Google Scholar]
  18. González, MC; Sanchez, R; Cejudo, FJ. Abiotic stresses affecting water balance induce phosphoenolpyruvate carboxylase expression in roots of wheat seedlings. Planta 2003, 216, 985–992. [Google Scholar]
  19. Sullivan, S; Jenkins, GI; Nimmo, HG. Roots, Cycles and Leaves. Expression of the Phosphoenolpyruvate Carboxylase Kinase Gene Family in Soybean. Plant Physiol 2004, 135, 2078–2087. [Google Scholar]
  20. Svensson, P; Blasing, OE; Westhoff, P. Evolution of C4 phosphoenolpyruvate carboxylase. Arch. Biochem. Biophys 2003, 414, 180–188. [Google Scholar]
  21. Raven, JA; Newman, JR. Requirement for carbonic anhydrase activity in processes other than photosynthetic inorganic carbon assimilation. Plant Cell Environ 1994, 17, 123–130. [Google Scholar]
  22. Coba de la Peña, T; Frugier, F; McKhann, HI; Bauer, P; Brown, S; Kondorosi, A; Crespi, MA. Carbonic anhydrase gene is induced in the nodule primordium and its cell-specific expression is controlled by the presence of Rhizobium during development. Plant J 1997, 11, 407–420. [Google Scholar]
  23. Aivalakis, G; Dimou, M; Flemetakis, E; Plati, F; Katinakis, P; Drossopoulos, JB. Immunolocalization of carbonic anhydrase and PEPC in developing seeds of Medicago sativa. Plant Physiol. Biochem 2004, 42, 181–186. [Google Scholar]
  24. Lance, C; Rustin, P. The central role of malate in plant metabolism. Physiol Veg 1984, 22, 625–641. [Google Scholar]
  25. Plaxton, WC. The organization and regulation of plant glycolysis. Annu. Rev. Plant Physiol. Plant Mol. Biol 1996, 47, 185–214. [Google Scholar]
  26. Turner, WL; Plaxton, WC. Purification and characterization of cytosolic pyruvate kinase from banana fruit. Biochem J 2000, 352, 875–882. [Google Scholar]
  27. Chang, K; Roberts, JKM. Quantitation of rates of transport, metabolic fluxes, and cytoplasmic levels of inorganic carbon in maize root tips during K+ ion uptake. Plant Physiol 1992, 99, 291–297. [Google Scholar]
  28. Uhde-Stone, C; Gilbert, G; Johnson, JM-F; Litjens, R; Zinn, KE; Temple, SJ; Vance, CP; Allan, DL. Acclimation of white lupin to phosphorus deficiency involves enhanced expression of genes related to organic acid metabolism. Plant Soil 2003, 248, 99–116. [Google Scholar]
  29. Demir, N; Demir, Y; Yildirim, A. Carbonic anhydrases from leaves and roots of Daucus carota. Phytochemistry 1997, 44, 1247–1250. [Google Scholar]
  30. Tetu, SG; Tanz, SK; Vella, N; Burnell, JN; Ludwig, M. The Flaveria bidentis β-Carbonic anhydrase gene family encodes cytosolic and chloroplastic isoforms demonstrating distinct organ-specific expression patterns. Plant Physiol 2007, 144, 1316–1327. [Google Scholar]
  31. Majeau, N; Coleman, JR. Correlation of carbonic anhydrase and ribulose-1,5-bisphosphate carboxylase/oxygenase expression in pea. Plant Physiol 1994, 104, 1393–1399. [Google Scholar]
  32. Kavroulakis, N; Flemetakis, E; Aivalakis, G; Dahiya, P; Brewin, NJ; Fasseas, K; Hatzopoulos, P; Katinakis, P. Tissue distribution and subcellular localization of carbonic anhydrase in mature soybean root nodules indicates a role in CO2 diffusion. Plant Physiol. Biochem 2003, 41, 479–484. [Google Scholar]
  33. van der Westhuizen, MM; Cramer, MD. The influence of elevated root-zone dissolved inorganic carbon concentrations on respiratory O2 and CO2 flux in tomato roots. J. Exp. Bot 1998, 49, 1977–1985. [Google Scholar]
  34. Viktor, A; Cramer, MD. The influence of root assimilated inorganic carbon on nitrogen acquisition/assimilation and carbon partitioning. New Phytol 2005, 165, 157–169. [Google Scholar]
  35. Zeeman, SC; up Rees, T. Changes in carbohydrate metabolism and assimilate export starch-excess mutants of Arabidopsis. Plant Cell Environ 1999, 22, 1445–1453. [Google Scholar]
  36. Hibberd, JM; Quick, WP. Characteristics of C4 photosynthesis in stems and petioles of C3 flowering plants. Nature 2002, 415, 451–454. [Google Scholar]
  37. Birnbaum, K; Shasha, DE; Wang, JY; Jung, JW; Lambert, GM; Galbraith, DW; Benfey, PN. A gene expression map of the Arabidopsis root. Science 2003, 302, 1956–1960. [Google Scholar]
  38. Drew, MC. Oxygen deficiency and root metabolism: injury and acclimation under hypoxia and anoxia. Annu. Rev. Plant Physiol. Plant Mol. Biol 1997, 48, 223–250. [Google Scholar]
  39. van Dongen, JT; Schurr, U; Pfister, M; Geigenberger, P. Phloem metabolism and function have to cope with low internal oxygen. Plant Physiol 2003, 131, 1529–1543. [Google Scholar]
  40. Armstrong, W; Beckett, PM; Justin, SHFW; Lythe, S. Modeling and other aspects of root aeration by diffusion. In Plant Life under Oxygen Deprivation; Jackson, MB, Davies, DD, Eds.; SPB Academic Publishing: The Hague, The Netherlands, 1991; pp. 267–282. [Google Scholar]
  41. Gálvez, S; Hirsch, AM; Wycoff, KL; Hunt, S; Layzell, DB; Kondorosi, A; Crespi, M. Oxygen regulation of a nodule-located carbonic anhydrase in alfalfa. Plant Physiol 2000, 124, 1059–1068. [Google Scholar]
  42. Dieuaide-Noubhani, M; Raffard, G; Canioni, P; Pradet, A; Raymond, P. Quantification of compartmented metabolic fluxes in maize root tips using isotope distribution from 13C- or 14C-labeled glucose. J. Biol. Chem 1995, 270, 13147–13159. [Google Scholar]
  43. Katz, J; Rognstad, R. The labeling of pentose phosphate from glucose-14C and estimation of the rates of transaldolase, transketolase, the contribution of the pentose cycle, and ribose phosphate synthesis. Biochemistry 1967, 6, 2227–2247. [Google Scholar]
  44. Adams, CA; Broman, TH; Rinne, RW. Use of [3,4-14C] glucose to assess in vivo competition for phosphoenolpyruvate between phosphoenolpyruvate carboxylase and pyruvate kinase in developing soybean seeds. Plant Cell Phyiol 1982, 23, 959–965. [Google Scholar]
  45. Rontein, D; Dieuaide-Noubhani, M; Dufourc, EJ; Raymond, P; Rolin, D. The metabolic architecture of plant cells. Stability of central metabolism and flexibility of anabolic pathways during the growth cycle of tomato cells. J Biol Chem 2002, 277, 43948–43960. [Google Scholar]
  46. Dieuaide-Noubhani, M; Canioni, P; Raymond, P. Sugar-starvation-induced changes of carbon metabolism in excised maize root tips. Plant Physiol 1997, 115, 1505–1513. [Google Scholar]
  47. Plaxton, WC. The organization and regulation of plant glycolysis. Annu. Rev. Plant Physiol. Plant Mol. Biol 1996, 47, 185–214. [Google Scholar]
  48. Altschul, SF; Madden, TL; Schaffer, AA; Zhang, J; Zhang, Z; Miller, W; Lipman, DJ. Gapped BLAST and PSI-BLAST: A new generation of protein database search programs. Nucleic Acids Res 1997, 25, 3389–3402. [Google Scholar]
  49. Brusslan, JA; Tobin, EM. Light-independent developmental regulation of cab gene expression in Arabidopsis thaliana seedlings. Proc. Natl. Acad. Sci. USA 1992, 89, 7791–7795. [Google Scholar]
  50. Dimou, M; Flemetakis, E; Delis, C; Aivalakis, G; Spyropulos, KG; Katinakis, P. Co-expression of two sugar transporters in primary and lateral roots of etiolated Glycine max seedlings. Plant Growth Regul 2005, 35, 259–266. [Google Scholar]
  51. Khalifah, RG. The carbon dioxide hydration activity of carbonic anhydrase. Stop-flow kinetic studies on the native human isoenzymes B and C. J. Biol. Chem 1971, 246, 2561–2573. [Google Scholar]
  52. Bradford, M. A rapid and sensitive method for the quantitation of microgram quantities of protein utilizing the principle of protein-dye binding. Anal. Biochem 1976, 72, 248–254. [Google Scholar]
Figure 1. In situ localization of GmPK3, GmPEPC7 and GmCA1 gene transcripts, immunohistochemical localization of PEPC and CA proteins and histochemical localization of total CA activity in primary and lateral roots of 8-days old etiolated soybean seedlings. In situ hybridization and immunohistochemical signals are visible as blue-purple precipitate. Histochemical localization signal is observed as brown-black signal.(A) Longitudinal section from the root tip region hybridized with the antisense probe for the GmPEPC7 gene. (B) Cross section of the primary root bearing the lateral root primordia (approximately 4.5 cm from the primary root tip) hybridized with the antisense probe for the GmPEPC7 gene. (C) Longitudinal section from the root tip region hybridized with the antisense probe for the GmPK3 gene. (D) Cross section of the primary root bearing the lateral root primordia (approximately 4.5 cm from the primary root tip) hybridized with the antisense probe for the GmPK3 gene. (H) Longitudinal section from the root tip region hybridized with the sense probe for the GmPK3 gene. (Q) Longitudinal section from the root tip region hybridized with the antisense probe for the GmCA1 gene. (R) Cross section of the primary root bearing the lateral root primordia (approximately 4.5 cm from the primary root tip) hybridized with the antisense probe for the GmCA1 gene. (S) Cross section from the hypocotyls hybridized with the antisense probe for the GmCA1 gene. (T) Longitudinal section from the root tip region hybridized with the sense probe for the GmCA1 gene. (E) Immunohistochemical localization of PEPC protein using polyclonal antibodies raised against GmPEPC7 in longitudinal section from the root tip region. (F) Immunohistochemical localization of PEPC protein using polyclonal antibodies raised against GmPEPC7 in cross section of the primary root bearing the lateral root primordia (approximately 4.5cm from the primary root tip). (G) Immunohistochemical localization of PEPC protein using polyclonal antibodies raised against GmPEPC7 in cross section from the hypocotyl. (I) Immunohistochemical localization of CA protein using polyclonal antibodies raised against GmCA1 in longitudinal section from the root tip region. (J) Immunohistochemical localization of CA protein using polyclonal antibodies raised against GmCA1 in cross section of the primary root bearing the lateral root primordia (approximately 4.5 cm from the primary root tip). (K) Immunohistochemical localization of CA protein using polyclonal antibodies raised against GmCA1 in cross section from the hypocotyl. (L) In immunolocalization control reaction cross section of the primary root bearing the lateral root primordia (approximately 4.5 cm from the primary root tip) was incubated with pre-immune serum. (M) Histochemical localization of CA activity in longitudinal section from the root tip region. (N) Histochemical localization of CA activity in cross section of the primary root bearing the lateral root primordia (approximately 4.5 cm from the primary root tip). (O) Histochemical localization of CA activity in cross section from the hypocotyl. (P) In histochemical assay control reaction cross section of the primary root (approximately 4.5 cm from the primary root tip) was incubated with the reaction mix in the absence of NaHCO3. rc, root cap; v, vascular cylinder; m, meristem; c, cortex. Scale bars: 200 μm.
Ijms 10 02896f1
Figure 2. Western blots of G. max CA and PEPC proteins. G. max root (R) and hypocotyls (H) proteins were separated by 15% SDS-PAGE, transferred to nitrocellulose, and probed with polyclonal antibodies raised against GmCA1 coding for a beta-type cytoplasmic CA (a) and GmPEPC7 coding for a cytoplasmic PEPC (b). Molecular mass markers are shown in kDa.
Ijms 10 02896f2
Figure 3. Semi-quantitative reverse transcription polymerase chain reaction analysis of the expression profiles of GmPK3 and GmPEPC7 genes. Total RNA from hypocotyls (HYP), and different parts of roots, representing the region of cell division (RT), the root region of elongation (MRI) and the root region containing the lateral root primordia (MRII) of 8-days old etiolated seedlings was subjected to reverse transcription polymerase chain reaction analysis. The RT-PCR product of the GmUBQ was used as an internal control. Amplified products were separated on 1.5% agarose gels, blotted on nylon membranes and hybridized with the respective digoxigenin-11-rUTP labeled cDNA probes.
Ijms 10 02896f3
Table 1. Carbonic anhydrase activity for plumule, hypocotyls and roots of 8-day old etiolated soybean seedlings.
CA activitiy [μmole H+min−1 (mg protein)−1]
plumulehypocotylroot
ND (a)85.527±8.785 (b)216.363±51.969 (c)
Means±STADEV are shown (n=3).
(a)ND: not detected.
(b,c)Values with different letters are significantly different at p<0.05 (one-way ANOVA).

