Isothermal Microcalorimetry to Investigate Non Specific Interactions in Biophysical Chemistry


Abstract
:1. Introduction: Specific Versus Non-specific Interactions, What Is the Best Criterion?
- a lipid vesicle (with a known chemical composition) even in the presence of phase boundaries (the so called “rafts”),
- on the surface of a mineral oxide,
- along a polyelectrolyte chain,
- along a single stranded oligonucleotide,
- NMR,
- other spectroscopic methods like fluorescence spectroscopy,
- sedimentation velocity and equilibrium,
- equilibrium dialysis [22] (which can be used only when the two binding partners have very different hydrodynamic radii and when one of them is able to diffuse across the pores of the dialysis membrane),
- chromatography,
- capillary electrophoresis
- even electrospray mass spectrometry, ESI [23] (ESI measures the mass increase of the guest molecule upon binding in the dry state, which means that all the contribution of hydrophobic interactions are not taken into account)
- and of course, titration calorimetry [24].
- self assembly of amphiphiles,
- interactions between peptides-drugs with lipid membranes,
- proteins with surfaces,
- peptides with DNA as well as proteins or DNA with polyelectrolytes.
2. Some Other Fundamental Relationships and the Need to Measure the Enthalpy Change Independently from the Binding Constant
3. Some Selected Examples of the Use of ITC to Investigate the Thermodynamics and Kinetics of Biophysical “Unspecific” Processes
- the interactions between amphiplilic molecules
- the interactions between small ions with polyelectrolytes as well as between polyelectrolytes
- the interactions between drugs, peptides and viruses with lipid assemblies
- the interactions between proteins and solid surfaces.
- the investigation of the global thermal effect of metabolic processes.
3.1. Investigation of the Interaction between Amphiphiles and between Amphiphiles and Polymers
3.2. Investigation of the Interactions between Small Ions and Polyelectrolytes as well as between Polyelectrolytes
3.3. Investigation of the Interactions between Drugs, Peptides and Viruses with Lipid Assemblies
3.4. Investigation of the Interactions between Proteins and Solid Surfaces
3.5. Investigation of the Global Thermal Effect of Metabolic Processes
4. Conclusions and Perspectives
References and Notes
- Ruben, AJ; Kiso, Y; Freire, E. Overcomming roadblocks in lead optimization:a thermodynamic perspective. Chem. Biol. Drug Des 2006, 67, 2–4. [Google Scholar]
- Cantor, CR; Shimmel, PR. Biophysical Chemistry. Part III. The behavior of biological macromolecules; W.H. Freeman and Company: New York, NY, USA, 1980; Chapter 15. [Google Scholar]
- di Cera, E. di Cera, E. Thermodynamic dissection of cooperativity in ligand recognition. In Thermodynamics in Biology; Oxford University Press: New York, NY, USA, 2000; Chapter 2. [Google Scholar]
- Lehn, JM. Supramolecumar Chemistry; Wiley-VCH. Weinheim: Berlin, Germany, 1995. [Google Scholar]
- Alberts, B; Bray, D; Lewis, J; Kaff, M; Roberts, K; Watson, JD. Molecular Biology of the Cell, 3rd Ed ed; Garland Publishing Inc: New York, NY, USA, 1993. [Google Scholar]
- Lyklema, J. Quest for ion-ion correlations in electric double layers and overcharging phenomena. Adv Colloid Interface Sci 2009, 147–148, 205–213. [Google Scholar]
- Lambert, J-F. Adsorption and polymerization of amino acids on mineral surfaces: a review. Origins Life Evol. Biosphere 2008, 38, 211–242. [Google Scholar]
- Qiu, T; Barteau, MA. STM study of glycine on TiO2 (110) single crystal surfaces. J. Colloid Interface Sci 2007, 303, 229–235. [Google Scholar]
- Lyklema, J. Electrical double layer on silver iodide. Influence of temperature and application to sol stability. Discuss. Faraday Soc 1966, 42, 81–90. [Google Scholar]
- Manning, GSQ. The molecular theory of polyelectrolyte solutions with applications to the electrostatic properties of polynucleotides. Rev. Biophys 1978, 11, 179–246. [Google Scholar]
- Kunz, W; Lo Nostro, P; Ninham, BW. The present state of affairs with Hofmeister effects. Curr. Opin. Colloid Interface Sci 2004, 9, 1–18. [Google Scholar]
- Houk, KN; Leach, AG; Kim, SP; Zhang, X. Binding affinities of host-guest, protein-ligand, and protein-transition state complexes. Angew. Chem. Int. Ed 2003, 42, 4872–4897. [Google Scholar]
- Jones, S; Thornton, JM. Principles of protein-protein interactions. Proc. Natl. Acad. Sci 1996, 93, 13–20. [Google Scholar]
- Gerschel, A. Liaisons intermoléculaires. Les forces mises en jeu dans la matière condensée; Inter Editions/CNRS Editions Ed: Paris, France, 1995. [Google Scholar]
- Ball, V. Adsorption behaviour of different polypeptides in the 3 kDa molecular weight range at an Si0.8Ti0.2 O2-aqueous solution interface from low ionic strength solution. Colloids Surf., B: Biointerfaces 2004, 33, 129–142. [Google Scholar]
- Latour, RA. Molecular simulation of protein-surface interactions: Benefits, problems, solutions, and future directions. Biointerphases 2008, 3, FC2–FC12. [Google Scholar]
- Schaaf, P; Voegel, J-C; Senger, B. From random sequential adsorption to ballistic deposition: a general view of irreversible deposition processes. J. Phys. Chem. B 2000, 104, 2204–2214. [Google Scholar]
- Smith, R; Tanford, C. Hydrophobicity of long chain n-alkyl carboxylic acids, as measured by their distribution between heptane and aqueous solutions. Proc. Natl. Acad. Sci. USA 1973, 70, 289–293. [Google Scholar]
- Hamacek, J; Borkovec, M; Piguet, C. Simple thermodynamics for unravelling sophisticated self-assembly processes. Dalton Trans 2006, 12, 1473–1490. [Google Scholar]
- Rekharsky, MV; Inoue, Y. Complexation thermodynamics of cyclodextrins. Chem Rev 1998, 98, 1875–1918. [Google Scholar]
- Jelesarov, I; Bosshard, HR. Isothermal titration calorimetry and differential scanning calorimetry as complementary tools to investigate the energetics of biomolecular recognition. J. Mol. Recognit 1999, 12, 3–18. [Google Scholar]
- Harding, SE; Chowdry, BZ (Eds.) Protein-ligand interactions: hydrodynamics and calorimetry; Practical Approach Series, Oxford University Press: New York, NY, USA, 2001; Chapters 2-7.
- Rogniaux, H; Sanglier, S; Strupat, K; Azza, S; Roitel, O; Ball, V; Tritsch, D; Branlant, G; van Dorsselaer, A. Mass spectrometry as a novel approach to probe cooperativity in multimeric enzymatic systems. Anal. Biochem 2001, 291, 48–61. [Google Scholar]
- O’Brien, R; Ladbury, JE; Chowdhry, BZ. Isothermal titration calorimetry of biomolecules. In “Protein-ligand interactions: hydrodynamics and calorimetry”; Practical Approach Series; Harding, SE, Chowdhry, BZ, Eds.; Oxford University Press: New York, NY, USA, 2001. [Google Scholar]
- Schuck, P. Use of surface plasmon resonance to probe the equilibrium and dynamic aspects of interactions between biological macromolecules. Annu. Rev. Biophys. Biomol. Struct 1997, 26, 541–566. [Google Scholar]
- Winzor, DJ; Jackson, CM. Interpretation of the temperature dependence of equilibrium and rate constants. J. Mol. Recognit 2006, 19, 389–407. [Google Scholar]
- Liu, Y; Sturtevant, JM. Significant discrepancies between van’t Hoff and calorimetric enthalpies. Protein Sci 1995, 4, 2559–2561. [Google Scholar]
- Pfeil, W; Privalov, PL. Thermodynamic investigations of proteins. II. Calorimetric study of lysozyme denatured by guanidinium hydrochmoride. Biophys. Chem 1976, 4, 33–40. [Google Scholar]
- Privalov, PL; Tiktopulo, EI; Venyaminov, SY; Griko, YV; Makhatadze, GI; Khechinashvili, NN. Heat capacity and conformation of proteins in the denatured state. J. Mol. Biol 1989, 205, 737–750. [Google Scholar]
- Kauzmann, W. Some factors in the interpretation of protein denaturation. Adv. Protein Chem 1959, 14, 1–63. [Google Scholar]
- Israelachvili, J. Intermolecular and Surface forces; Academic Press: San Diego, CA, USA, 1991. [Google Scholar]
- Tanford, C. The hydrophobic effect: formation of micelles and biological membranes, 2nd ed; Krieger Publishing Company: Malabar, FL, USA, 1991. [Google Scholar]
- Shimokhina, N; Bronowska, A; Homans, SW. Contribution of ligand desolvation to binding thermodynamics in a ligand-protein interaction. Angew. Chem. Int. Ed 2006, 45, 6374–6376. [Google Scholar]
- Bingham, RJ; Findlay, JBC; Hsieh, SY; Kalverda, AP; Kjellberg, A; Perrazolo, C; Phillips, SEV; Seshadry, K; Trinh, CH; Turnbull, WB; Bodenhausen, G; Homans, SW. Thermodynamics of binding of 2-methoxy-3-isopropylpirazine and 2-methoxy-3-isobutyl pirazine to the major urinary protein. J. Am. Chem. Soc 2006, 126, 1675–1681. [Google Scholar]
- Lumry, R. Uses of enthalpy-entropy compensation in protein research. Biophys. Chem 2003, 105, 545–557. [Google Scholar]
- Markova, N; Sparr, E; Wadsö, L; Wennerström, H. A calorimetric study of phospholipid hydration. Simultaneous monitoring of enthalpy and free energy. J. Phys. Chem. B 2000, 104, 8053–8060. [Google Scholar]
- Groszek, AJ. Flow adsorption microcalorimetry. Thermochim. Acta 1998, 312, 133–143. [Google Scholar]
- Fubini, B. Adsorption calorimetry in surface chemistry. Thermochim. Acta 1988, 135, 19–29. [Google Scholar]
- Wiseman, T; Williston, S; Brandts, J-F; Lin, L-N. Rapid measurement of binding constants and heats of binding using a new titration calorimeter. Anal. Biochem 1989, 179, 131–137. [Google Scholar]
- Morin, PE; Freire, E. Direct calorimetric analysis of the enzymic activity of yeast cytochrome c oxydase. Biochemistry 1991, 30, 8494–8500. [Google Scholar]
- Todd, MJ; Gomez, J. Enzyme kinetics determined using calorimetry: a general assay for enzyme activity? Anal. Biochem 2001, 296, 179–187. [Google Scholar]
- Henzler, K; Haupt, B; Ballauff, M. Enzymatic activity of immobilized enzyme determined by isothermal titration calorimetry. Anal. Biochem 2008, 378, 184–189. [Google Scholar]
- Privalov, PL; Potekhin, SA. Scanning microcalorimetry in studying temperature-induced changes in proteins. Methods Enzymol 1986, 131, 4–51. [Google Scholar]
- Freire, E. Differential scanning calorimetry. Methods Mol. Biol 1995, 40, 191–218. [Google Scholar]
- Johnson, CM. Differential scanning calorimetry: theory and practice, MicroCal Application note.
- Lin, LN; Brandts, JF; Brandts, JM; Plotnikov, V. Determination of the volumetric properties of proteins and other solutes using pressure perturbation calorimetry. Anal. Biochem 2002, 302, 144–160. [Google Scholar]
- Gosule, LC; Schellman, JA. Compact form of DNA induced by spermidine. Nature 1976, 259, 333–335. [Google Scholar]
- Wilson, RW; Bloomfield, VA. Counterion-induced condensation of desoxyribonucleic acid: a light scattering study. Biochemistry 1978, 18, 2192–2196. [Google Scholar]
- Bloomfield, VA. DNA condensation by multivalent cations. Biopolymers 1998, 44, 269–282. [Google Scholar]
- Raspaud, E; Delacruz, MO; Sikorav, JL; Livolant, F. Precipitation of DNA by polyamines-a polyelectrolyte behavior. Biophys. J 1998, 74, 381–393. [Google Scholar]
- Schaffer, DV; Fidelman, NA; Dan, N; Lauffenburger, DA. Vector unpacking as a potential barrier for receptor-mediated polyplex gene delivery. Biotechnol. Bioeng 2000, 67, 598–606. [Google Scholar]
- Tosteson, MT; Holmes, SJ; Razin, M; Tosteson, DC. Mellitin lysis of red cells. J. Membr. Biol 1985, 87, 35–44. [Google Scholar]
- Llanos, GR; Sefton, MV. Heparin-poly(ethylene glycol)-poly(vinyl alcohol) hydrogel: preparation and assessment of thrombogenicity. Biomaterials 1992, 13, 421–424. [Google Scholar]
- Haynes, CA; Norde, W. Structures and stabilities of adsorbed proteins. J. Colloid Interface Sci 1995, 169, 313–328. [Google Scholar]
- Noinville, S; Chich, JF; Rezaei, H. Misfolding of the prion protein: linking biophysical and biological approaches. Vet. Res 2008, 39, 48. [Google Scholar]
- Stefani, M. Prorein Folding and misfolding on surfaces. Int. J. Mol. Sci 2008, 9, 2515–2542. [Google Scholar]
- Dobson, CM. Protein folding and misfolding. Nature 2003, 426, 884–891. [Google Scholar]
- Hartl, FU; Hayer-Hartl, M. Molecular chaperones in the cytosol: from nascent chain to folded protein. Science 2002, 295, 1852–1858. [Google Scholar]
- Newbery, JE. The variation of the critical micelle concentration of sodium dodecyl sulphate with ionic strength monitored by selective-ion membrane electrodes. Colloid Polym. Sci 1979, 257, 773–775. [Google Scholar]
- Birdi, KS. Calorimetric determination of the enthalpy of micelle formation in aqueous media. Colloid Polym. Sci 1983, 261, 45–48. [Google Scholar]
- Spink, CH; Chaires, JB. Thermodynamics of the binding of a cationic lipid to DNA. J. Am. Chem. Soc 1997, 119, 10920–10928. [Google Scholar]
- Blokzijl, W; Engberts, JBFN. Hydrophobic effects. Opinion and facts. Angew. Chem. Int. Ed 1993, 32, 1545–1579. [Google Scholar]
- Bijma, K; Engberts, JBFN; Haandrikman, G; van Os, N; Blandamer, MJ; Butt, MD; Cullis, PM; Last, PM. Thermodynamics of micelle formation by 1-methyl-4-alkylpyridinium halides. Langmuir 1994, 10, 2578–2582. [Google Scholar]
- van Os, N; Daane, GJ; Haandrikman, G. The effect of chemical structure upon the thermodynamics of micellization of model alkylarenesulfonates: III. Determination of the critical micelle concentration and the enthalpy of demicellization by means of microcalorimetry and a comparison with the phase separation model. J. Colloid Interface Sci 1991, 141, 199–217. [Google Scholar]
- de Gooijer, JM; Engberts, JBFN; Blandamer, MJ. A titration microcalorimetric study of the effects of halide counterions on vesicle-forming aggregation in aqueous solution of branched chain alkylpyridinium surfactants. J. Colloid Interface Sci 2000, 224, 4–10. [Google Scholar]
- Bangar Raju, B; Winnik, FM; Morishima, Y. A look at the thermodynamics of the association of amphiphilic polyelectrolytes in aqueous solutions: strenghts and limitations of isothermal titration calorimetry. Langmuir 2001, 17, 4416–4421. [Google Scholar]
- Sidhu, J; Bloor, DM; Couderc-Azouani, S; Penfold, J; Holzwarth, JF; Wyn-Jones, E. Interactions of Poly(amidoamine) dendrimers with the surfactants SDS, DTAB, and C12EO6: An equilibrium and structural study using a SDS selective electrode, isothermal titration calorimetry, and small angle neutron scattering. Langmuir 2004, 20, 9320–9328. [Google Scholar]
- Antunes, FE; Marques, EF; Miguel, MG; Lindman, B. Polymer-vesicle association. Adv Colloid Interface Sci 2009, 147–148, 18–35. [Google Scholar]
- Ladbrooke, BD; Chapman, D. Thermal analysis of lipids, proteins, and biological membranes: A review ans summary of some recent studies. Chem. Phys. Lipids 1969, 3, 304–356. [Google Scholar]
- Chapman, D; Urbina, J. Biomembrane phase transitions. Studies of lipid-water systems using differential scanning calorimetry. J. Biol. Chem 1974, 249, 2512–2521. [Google Scholar]
- Heerklotz, H; Seelig, J. Application of Pressure Perturbation Calorimetry to Lipid Bilayers. Biophys. J 2002, 82, 1445–1452. [Google Scholar]
- Heerklotz, H. Triton promotes domain formation in Lipid raft mixtures. Biophys. J 2002, 83, 2693–2701. [Google Scholar]
- Nebel, S; Ganz, P; Seelig, J. Heat changes in lipid membranes under sudden osmotic stress. Biochemistry 1997, 36, 2853–2859. [Google Scholar]
- Manning, GS. Limiting laws and counterion condensation in polyelectrolyte solutions. I Colligative properties. J. Chem.Phys 1969, 51, 924–933. [Google Scholar]
- Acar, N; Tulun, T. Studies on the interaction of poly(4-vinypyridinium chloride) with poly(sodium phosphate) in an aqueous solution by conductometry. J. Polym. Sci. A. Polym.Chem 1996, 34, 1251–1260. [Google Scholar]
- Webster, L; Huglin, MB; Robb, ID. Complex formation between polyelectrolytes in dilute aqueous solution. Polymer 1997, 38, 1373–1380. [Google Scholar]
- Nguyen, TT; Grosberg, AY; Shklovskii, BI. Macroions in salty water with multivalent ions: giant inversion of charge. Phys. Rev. Lett 2000, 85, 1568–1571. [Google Scholar]
- Kleimann, J; Gehin-Deval, C; Auweter, H; Borkovec, M. Super stoechiometric neutralization in particle – polyelectrolyte systems. Langmuir 2005, 21, 3688–3698. [Google Scholar]
- de Kruif, CG; Weinbreck, F; de Vries, R. Complex coacervation of proteins and anionic polysaccharides. Curr. Opin. Colloid Interface Sci 2004, 9, 340–349. [Google Scholar]
- Hallberg, RK; Dubin, PL. Effect of pH on the binding of β-Lactoglobulin to sodium polystyrene sulfonate. J. Phys. Chem. B 1998, 102, 8629–8633. [Google Scholar]
- Dautzenberg, H; Jaeger, W. Effect of charge density on the formation and salt stability of polyelectrolyte complexes. Macromol. Rapid Commun 2002, 203, 2095–2102. [Google Scholar]
- Trukhanova, ES; Izumrudov, VA; Litmanovich, AA; Zelikin, AN. Recognition and selective binding of DNA by ionenes of different charge density. Biomacromolecules 2005, 6, 3198–3201. [Google Scholar]
- Mattison, KW; Dubin, PL; Brittain, IJ. Complex formation between bovine serum albumin and strong polyelectrolytes: effect of polymer charge density. J. Phys. Chem. B 1998, 102, 3830–3836. [Google Scholar]
- Strand, SP; Danielsen, S; Christensen, BE; Vårum, KM. Influence of chitosan structure on the formation and stability of DNA-chitosan polyelectrolyte complexes. Biomacromolecules 2005, 6, 3357–3366. [Google Scholar]
- Dautzenberg, H. Polyelectrolyte complex formation in highly aggregating systems. 1. Effect of salt: polyelectrolyte complex formation in the presence of NaCl. Macromolecules 1997, 30, 7810–7815. [Google Scholar]
- Cousin, F; Gummel, J; Ung, D; Boué, F. Polyelectrolyte-protein complexes: structure and conformation of each specie revealed by SANS. Langmuir 2005, 21, 9675–9688. [Google Scholar]
- Wang, X; Li, Y; Wang, Y-W; Lal, J; Huang, Q. Microstructure of β-Lactoglobulin/pectin coacervates studied by small angle neutron scattering. J. Phys. Chem. B 2007, 111, 515–520. [Google Scholar]
- Kiriy, A; Yu, J; Stamm, M. Interpolyelectrolyte complexes: a single-molecule insight. Langmuir 2006, 22, 1800–1803. [Google Scholar]
- Stanić, V; Arntz, Y; Richard, D; Affolter, C; Nguyen, I; Crucifix, C; Schultz, P; Baehr, C; Frisch, B; Ogier, J. Filamentous condensation of DNA induced by pegylated poly-L-lysine and transfection efficiency. Biomacromolecules 2008, 9, 2048–2055. [Google Scholar]
- Leisner, D; Imae, T. Strutural evolution of an interpolyelectrolyte complex of charged dendrimers with poly-L-glutamic acid. J. Phys. Chem. B 2004, 108, 1798–1804. [Google Scholar]
- Menjoge, AR; Kayitmazer, AB; Dubin, PL; Jaeger, W; Vasenkov, S. Heterogeneity of polyelectrolyte diffusion in polyelectrolyte-protein coacervates: a 1H pulsed field gradient NMR study. J. Phys.Chem. B 2008, 112, 4961–4966. [Google Scholar]
- Lindhoud, S; Norde, W; Cohen Stuart, MA. Reversibility and relaxation behavior of polyelectrolyte complex micelle formation. J. Phys. Chem. B 2009, 113, 5431–5439. [Google Scholar]
- Izumrudov, VA; Zhiryakova, MV; Kudaibergenov, SE. Controllable stability of DNA containing polyelectrolyte complexes in water salt solutions. Biopolymers 1999, 52, 94–108. [Google Scholar]
- Izumrudov, VA; Zhiryakova, MV. Stability of DNA containing interpolyelectrolyte complexes in water salt solutions. Macromol. Chem. Phys 1999, 200, 2533–2540. [Google Scholar]
- Zelikin, A; Trukhanova, ES; Putnam, D; Izumrudov, VA; Litmanovich, AA. Competitive reactions in solution of Poly-L-histidine, Calf thymus DNA, and synthetic polyanions: determining the binding constants of polyelectrolytes. J. Am. Chem. Soc 2003, 125, 13693–13699. [Google Scholar]
- Křiž, J; Dautzenberg, H. Cooperative interactions of unlike macromolecules. 2: NMR and theoretical study of electrostatic binding of sodium poly(stryrenesulfonate)s to copolymers with variably distributed cationic groups. J. Phys. Chem. A 2001, 105, 3846–3854. [Google Scholar]
- Carlsson, F; Linse, P; Malmsten, M. Monte Carlo simulations of polyelectrolyte-protein complexation. J. Phys. Chem. B 2001, 105, 9040–9049. [Google Scholar]
- Manning, GS. Simple model for the binding of a polyelectrolyte to an oppositely charged surface. J. Phys. Chem. B 2003, 107, 11485–11490. [Google Scholar]
- da Silva, FLB; Lund, M; Jönsson, B; Åkesson, T. On the complexation of proteins and polyelectrolytes. J. Phys. Chem. B 2006, 110, 4459–4464. [Google Scholar]
- Feng, X; Dubin, PL. Measurement of equilibrium binding of cationic micelles to apolyanion by membrane filtration. Langmuir 2002, 18, 2032–2035. [Google Scholar]
- Seyrek, E; Dubin, PL; Henriksen, J. Nonspecific electrostatic binding characteristics if the heparin-antithrombin interaction. Biopolymers 2007, 86, 249–259. [Google Scholar]
- Bugalowski, W; Lohman, T. A general method of analysis of ligand-macromolecule equilibria using a spectroscopic signal from the ligand to monitor binding. Application to Escherichia coli single-strand binding protein-nucleic acid interactions. Biochemistry 1987, 26, 3099–3106. [Google Scholar]
- DeHaseth, PL; Gross, CA; Burgess, RR; Record, MT, Jr. Measurement of binding constants for protein DNA interactions by DNA-cellulose chromatography. Biochemistry 1977, 16, 4777–4783. [Google Scholar]
- Schwarz, G; Klose, S. Thermodynamic and kinetic studies on the cooperative binding of proflavine to linear polyanions. Eur. J. Biochem 1972, 29, 249–256. [Google Scholar]
- Daune, MP. Interactions protéines-acides nucléiques. 1. Etude théorique de l’association. Eur. J. Biochem 1972, 26, 207–211. [Google Scholar]
- Schwarz, G. Cooperative binding to linear biopolymers. Eur. J. Biochem 1970, 12, 442–453. [Google Scholar]
- McGhee, JD; vonHippel, PH. Theoretical aspects of DNA-protein interactions: Co-operative and non-co-operative binding of large ligands to a one-dimensional homogeneous lattice. J. Mol. Biol 1974, 86, 469–489. [Google Scholar]
- Record, TM, Jr; Lohman, TM; de Haseth, PL. Ion effects on ligand-nucleic acid interactions. J. Mol. Biol 1976, 107, 145–158. [Google Scholar]
- Mascotti, DP; Lohman, TM. Thermodynamic extent of counterion release upon binding oligolysines to single-stranded nucleic acids. Proc. Natl. Acad. Sci. USA 1990, 87, 3142–3146. [Google Scholar]
- Mascotti, DP; Lohman, TM. Thermodynamics of single-stranded RNA binding to oligolysines containing tryptophan. Biochemistry 1992, 31, 8932–8946. [Google Scholar]
- Lohman, TM; Overman, LB; Ferrari, ME; Kozlov, AG. A highly salt dependant enthalpy change for Escherichia coli SSB protein-nucleic acid binding due to ion-protein interactions. Biochemistry 1996, 35, 5272–5279. [Google Scholar]
- Mascotti, DP; Lohman, TM. Thermodynamics of oligoarginines binding to RNA and DNA. Biochemistry 1997, 36, 7272–7279. [Google Scholar]
- Ball, V; Winterhalter, M; Schwinté, P; Lavalle, Ph; Voegel, J-C; Schaaf, P. Complexation mechanism of bovine serum albumin and poly(allylamine hydrochloride). J. Phys. Chem. B 2002, 106, 2357–2364. [Google Scholar]
- Feng, X; Leduc, M; Pelton, R. Polyelectrolyte complex characterization with isothermal titration calorimetry and colloid titration. Colloids Surf., A: Physicochem. Eng. Aspects 2008, 317, 535–542. [Google Scholar]
- Bucur, CB; Sui, Z; Schlenoff, JB. Ideal mixing in polyelectrolyte complexes and multilayers: entropy driven assembly. J. Am. Chem. Soc 2006, 128, 13690–13691. [Google Scholar]
- Klocek, G; Seelig, J. Melittin interaction with sulfated cell surface sugars. Biochemistry 2008, 47, 2841–2849. [Google Scholar]
- Michaels, AS. Polyelectrolyte complexes. Ind. Eng. Chem 1965, 57, 32–41. [Google Scholar]
- Laugel, N; Betscha, C; Winterhalter, M; Voegel, J-C; Schaaf, P; Ball, V. Relationship between the growth regime of polyelectrolyte multilayers and the polyanion/polycation complexation enthalpy. J. Phys. Chem. B 2006, 110, 19443–19449. [Google Scholar]
- Boyd, GE; Wilson, DP; Manning, GS. Enthalpies of mixing polyelectrolytes with simple aqueous electrolyte solutions. J. Phys. Chem 1976, 80, 808–810. [Google Scholar]
- Ross, PD; Shapiro, JT. Heat of interaction of DNA with polylysine, spermine and Mg2+. Biopolymers 1974, 13, 415–416. [Google Scholar]
- Matulis, D; Rouzina, I; Bloomfield, VA. Thermodynamics of DNA binding and condensation: isothermal titration calorimetry and electrostatic mechanism. J. Mol. Biol 2000, 296, 1053–1063. [Google Scholar]
- Spink, CH; Chaires, JB. Thermodynamics of the binding of a cationic lipid to DNA. J. Am. Chem. Soc 1997, 119, 10920–10928. [Google Scholar]
- Ball, V; Winterhalter, M; Perret, F; Esposito, G; Coleman, AW. p-Sulfonatocalix[6]arene is an effective coacervator of poly(allylamine htdrochloride). Chem. Comm 2001, 7, 2276–2277. [Google Scholar]
- Memmi, L; Lazar, A; Brioude, A; Ball, V; Coleman, AW. Protein-calixarene interactions: complexation of Bovine serum albumin by sulfonatocalix[n]arenes. Chem Comm 2001, 2474–2475. [Google Scholar]
- Heerklotz, H. The microcalorimetry of lipid membranes. J. Phys. Condens. Matter 2004, 16, R441–R467. [Google Scholar]
- Seelig, J. Titration calorimetry of lipid-peptide interactions. Biochim. Biphys. Acta 1997, 1331, 103–116. [Google Scholar]
- Seelig, J. Thermodynamics of lipid-peptide interactions. Biochim. Biophys. Acta 2004, 1666, 40–50. [Google Scholar]
- Bäuerle, H-D; Seelig, J. Interaction of charged and uncharged calcium channel antagonists with phospholipid membranes. Binding equilibrium, binding enthalpy and membrane location. Biochemistry 1991, 30, 7203–7211. [Google Scholar]
- Seelig, J; Ganz, P. Nonclassical hydrophobic effect in membrane binding equilibria. Biochemistry 1991, 30, 9354–9359. [Google Scholar]
- Gerebtzoff, G; Li-Blatter, X; Fischer, H; Frentzel, A; Seelig, A. Halogenation of drugs enhances membrane binding and permeation. ChemBioChem 2004, 5, 676–684. [Google Scholar]
- Anderson, TG; Tan, A; Ganz, P; Seelig, J. Calorimetric measurement of phospholipid interaction with methyl-β-cyclodextrin. Biochemistry 2004, 43, 2251–2261. [Google Scholar]
- Meier, M; Li Blatter, X; Seelig, A; Seelig, J. Interactions of verapamil with lipid membranes and P-Glycoprotein: connecting thermodynamics and membrane structure with functional activity. Biophys. J 2006, 91, 2943–2955. [Google Scholar]
- Machaidze, G; Ziegler, A; Seelig, J. Specific binding of Ro 09-O198 (cynnamycin) to phosphatidylethanol amine:a thermodynamic analysis. Biochemistry 2002, 41, 1965–1971. [Google Scholar]
- Wenk, M; Seelig, J. Magainin 2 amide interaction with lipid membranes: calorimetric detection of peptide binding and pore formation. Biochemistry 1998, 37, 39909–3916. [Google Scholar]
- Wieprecht, T; Beyermann, M; Seelig, J. Thermodynamics of the coil-helix transition of amphipatic peptides in a membrane environment: the role of vesicle curvature. Biophys. Chem 2002, 96, 191–201. [Google Scholar]
- Meier, M; Seelig, J. Length dependence of the coil ⇔ β-sheet transition in a membrane environement. J. Am. Chem. Soc 2008, 130, 1017–1024. [Google Scholar]
- Meier, M; Seelig, J. Thermodynamics of the coil↔β sheet transition in a membrane environment. J. Mol. Biol 2007, 369, 277–289. [Google Scholar]
- Hammel, M; Schwarzenbacher, R; Gries, A; Kostner, GM; Lagner, P; Prassl, R. Mechanism of the interaction of β2-Glycoprotein I with negatively charged phospholipid membranes. Biochemistry 2001, 40, 14173–14181. [Google Scholar]
- Gabriel, GJ; Pool, JG; Som, A; Dabkowski, JM; Coughlin, EB; Muthukumar, M; Tew, GN. Interactions between antimicrobial polynorbornenes and phospholipid vesicles monitored by light scattering and microcalorimetry. Langmuir 2008, 24, 12489–12495. [Google Scholar]
- Scott, MJ; Jones, MN. The interaction of phospholipid liposomes with zinc citrate particles: a microcalorimetric investigation. Colloids Surf., A: Phys. Engineer. Aspects 2001, 182, 247–256. [Google Scholar]
- Schwarz, G; Damian, L; Winterhalter, M. Model-free analysis of binding at lipid membranes employing micro-calorimetric measurements. Eur. Biophys. J 2007, 36, 571–579. [Google Scholar]
- McLaughlin, S. The electrostatic properties of membranes. Ann. Rev. Biophys. Biophys. Chem 1989, 18, 113–116. [Google Scholar]
- Kabanov, VA; Yaroslavov, AA. What happens to negatively charged lipid vesicles upon interacting with polycation species? J. Controlled Release 2002, 78, 267–271. [Google Scholar]
- Volodkin, D; Ball, V; Voegel, J-C; Möhwald, H. Complexation of phosphocholine liposomes with polylysine. Stabilization by surface coverage or aggregation? Biochim. Biophys. Acta, Biomembr 2007, 1768, 280–290. [Google Scholar]
- Nebel, S; Bartoldus, I; Stegmann, T. Calorimetric detection of influenza virus induced membrane fusion. Biochemistry 1995, 34, 5705–5711. [Google Scholar]
- Basiuk, VA. Thermodynamics of adsorption of amino acids, small peptides, and nucleic acid components on silica adsorbents. In Biopolymers at Interfaces Surfactant Science Series; Malmsten, M, Ed.; Marcel Dekker: New York. NY, USA, 2003; volume 113, pp. 45–70. [Google Scholar]
- Norde, W; Lyklema, J. Why proteins prefer interfaces. J. Biomater. Sci. Polym. Ed 1992, 3, 183–202. [Google Scholar]
- Norde, W; Lyklema, J. The adsorption of human plasma albumin and bovine pancreas ribonuclease at negatively charged polystyrene surfaces: V. Microcalorimetry. J. Colloid Interface Sci 1978, 66, 295–302. [Google Scholar]
- Norde, W; Lyklema, J. Thermodynamics of protein adsorption. Theory with special reference to the adsorption of Human Plasma Albumin and Bovine pancreas ribonuclease at polystyrene surfaces. J. Colloid Interface Sci 1979, 71, 350–366. [Google Scholar]
- Brandes, N; Welzel, PB; Werner, C; Kroh, LW. Adsorption-induced conformational changes of proteins onto ceramic particles: differential scanning calorimetry and FTIR analysis. J. Colloid Interface Sci 2006, 299, 56–69. [Google Scholar]
- Larsericsdotter, H; Oscarsson, S; Buijs, J. Thermodynamic analysis of lysozyme adsorbed to silica. J. Colloid Interface Sci 2004, 276, 261–268. [Google Scholar]
- Lin, F-Y; Chen, WY; Sang, L-C. Microcalorimetric studies of the interactions of lysozyme with immobilized metal ions: effects of ion, pH value, and salt concentration. J. Colloid Interface Sci 1999, 214, 373–379. [Google Scholar]
- Lin, F-Y; Chen, W-Y; Hearn, MTW. Microcalorimetric studies on the interaction mechanism between proteins and hydrophobic solid surfaces in hydrophobic interaction chromatography: effects of salt, hydrophobicity of the solvent, and the structure of the protein. Anal. Chem 2001, 73, 3875–3883. [Google Scholar]
- Lin, FY; Chen, WY; Hearn, MTW. Thermodynamic analysis of the interaction between proteins and solid surfaces: application to liquid chromatography. J. Mol. Recognit 2002, 15, 55–93. [Google Scholar]
- Lee, VA; Craig, RG; Filisko, FE; Zand, R. Microcalorimetry of the adsorption of lysozyme onto polymeric substrates. J. Colloid Interface Sci 2005, 288, 6–13. [Google Scholar]
- Chen, W-Y; Liu, Z-C; Lin, P-H; Fang, C-I; Yamamoto, S. The hydrophobic interactions of the ion-exchanger resin ligands with proteins at high salt concentrations by adsorption isotherms and isothermal titration calorimetry. Sep. Purif. Technol 2007, 54, 212–219. [Google Scholar]
- Goobes, R; Goobes, G; Campbell, CT; Stayton, PS. Thermodynamics of statherin adsorption onto hydroxyapatite. Biochemistry 2006, 45, 5576–5586. [Google Scholar]
- De, M; You, C-C; Srivastava, S; Rotello, VM. Biomimetic interactions of proteins with functionalized nanoparticles: a thermodynamic study. J. Am. Chem. Soc 2007, 129, 10747–10753. [Google Scholar]
- Xu, C-P; van de Belt-Gritter, B; Busscher, HJ; van der Mei, HC; Norde, W. Calorimetric comparison of the interaction between salivary proteins and Streptococcus Mutans with and without antigen I/II. Colloids Surf., B: Biointerfaces 2007, 54, 193–199. [Google Scholar]
- Xie, C-L; Tang, HK; Song, ZH; Qu, S-S. Microcalorimetric study of bacterial growth. Thermochim. Acta 1988, 123, 33–41. [Google Scholar]
- Zhao, R; Liu, Y; Xie, Z; Shen, P; Qu, S. A calorimetric method for studying the biological effects of La3+ on Escherichia Coli. J. Biochem. Biophys. Methods 2000, 46, 1–9. [Google Scholar]
- interactions between α-cyclodextrins and organic guests.
- interactions between catalytic antibodies and organic substrates.
- interactions between albumins and organic guests.
- interactions between catalytic antibodies and inhibitors.
- interactions between enzymes and inhibitors.
- interactions between antibodies and proteins.

 ):
, (
):
, (
 ):
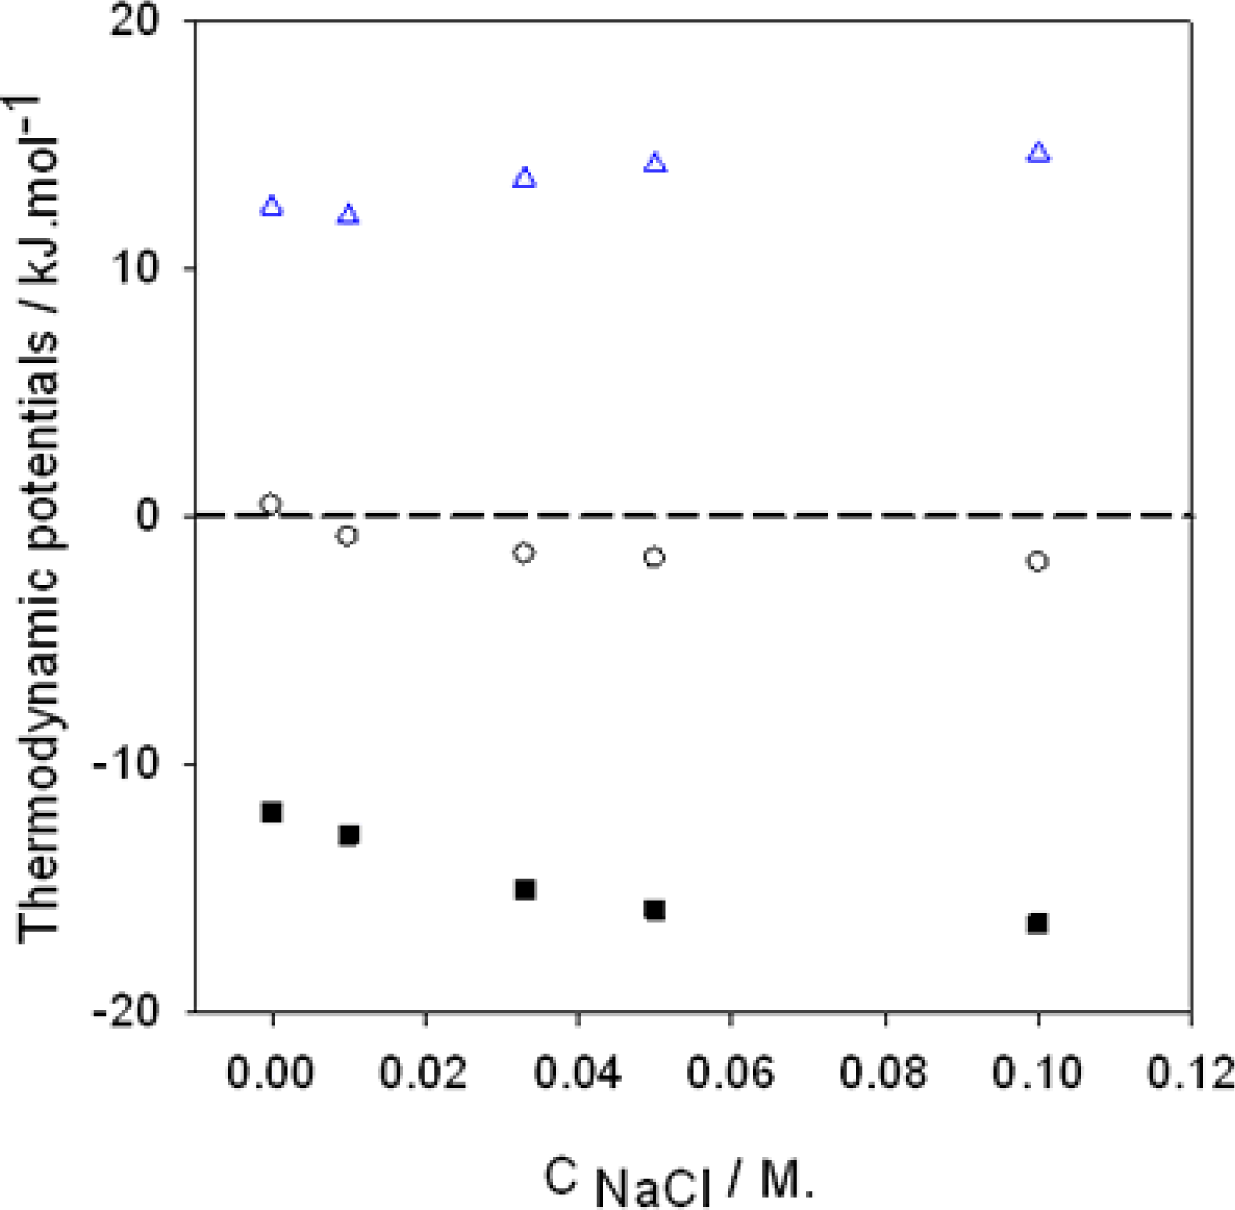
, (▪):
The dashed line corresponds to a process implying no change in energy.
):
, (▪):
The dashed line corresponds to a process implying no change in energy.
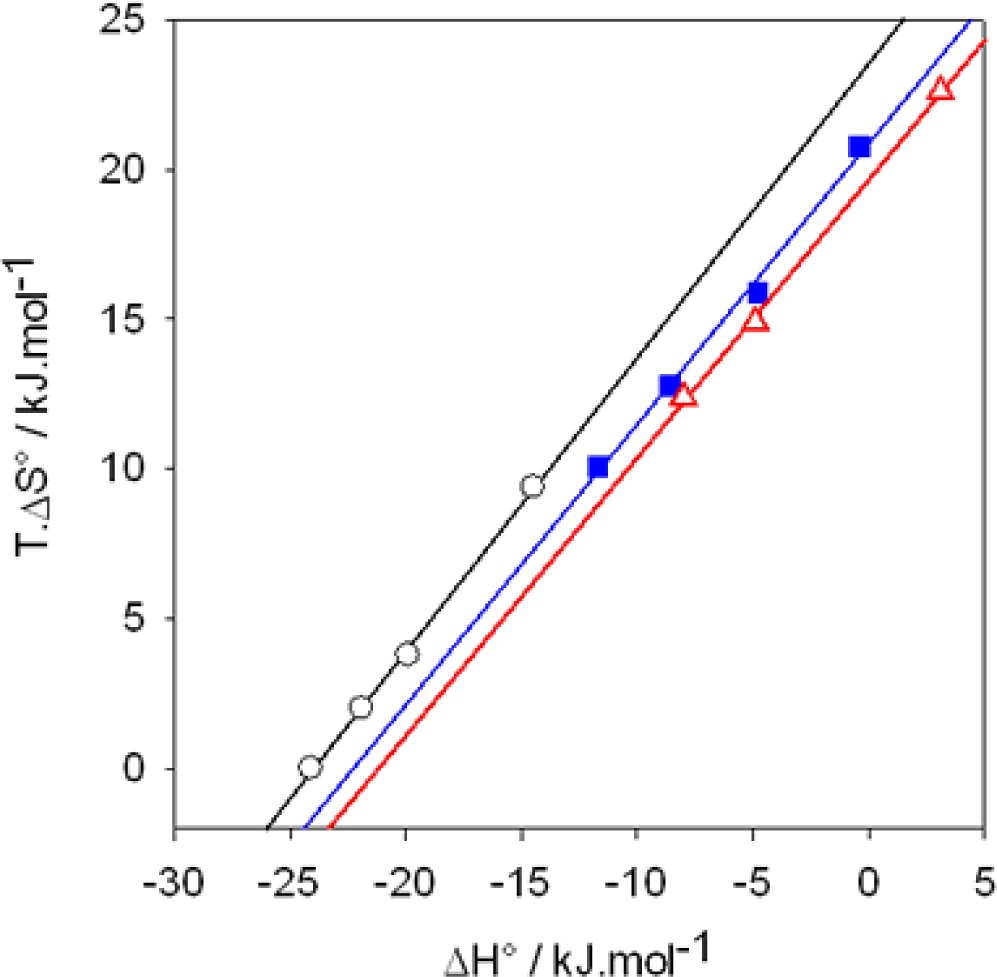
 ): I−, the slope of the linear regression is α=0.98, (
 ): Br−, α=0.93, (
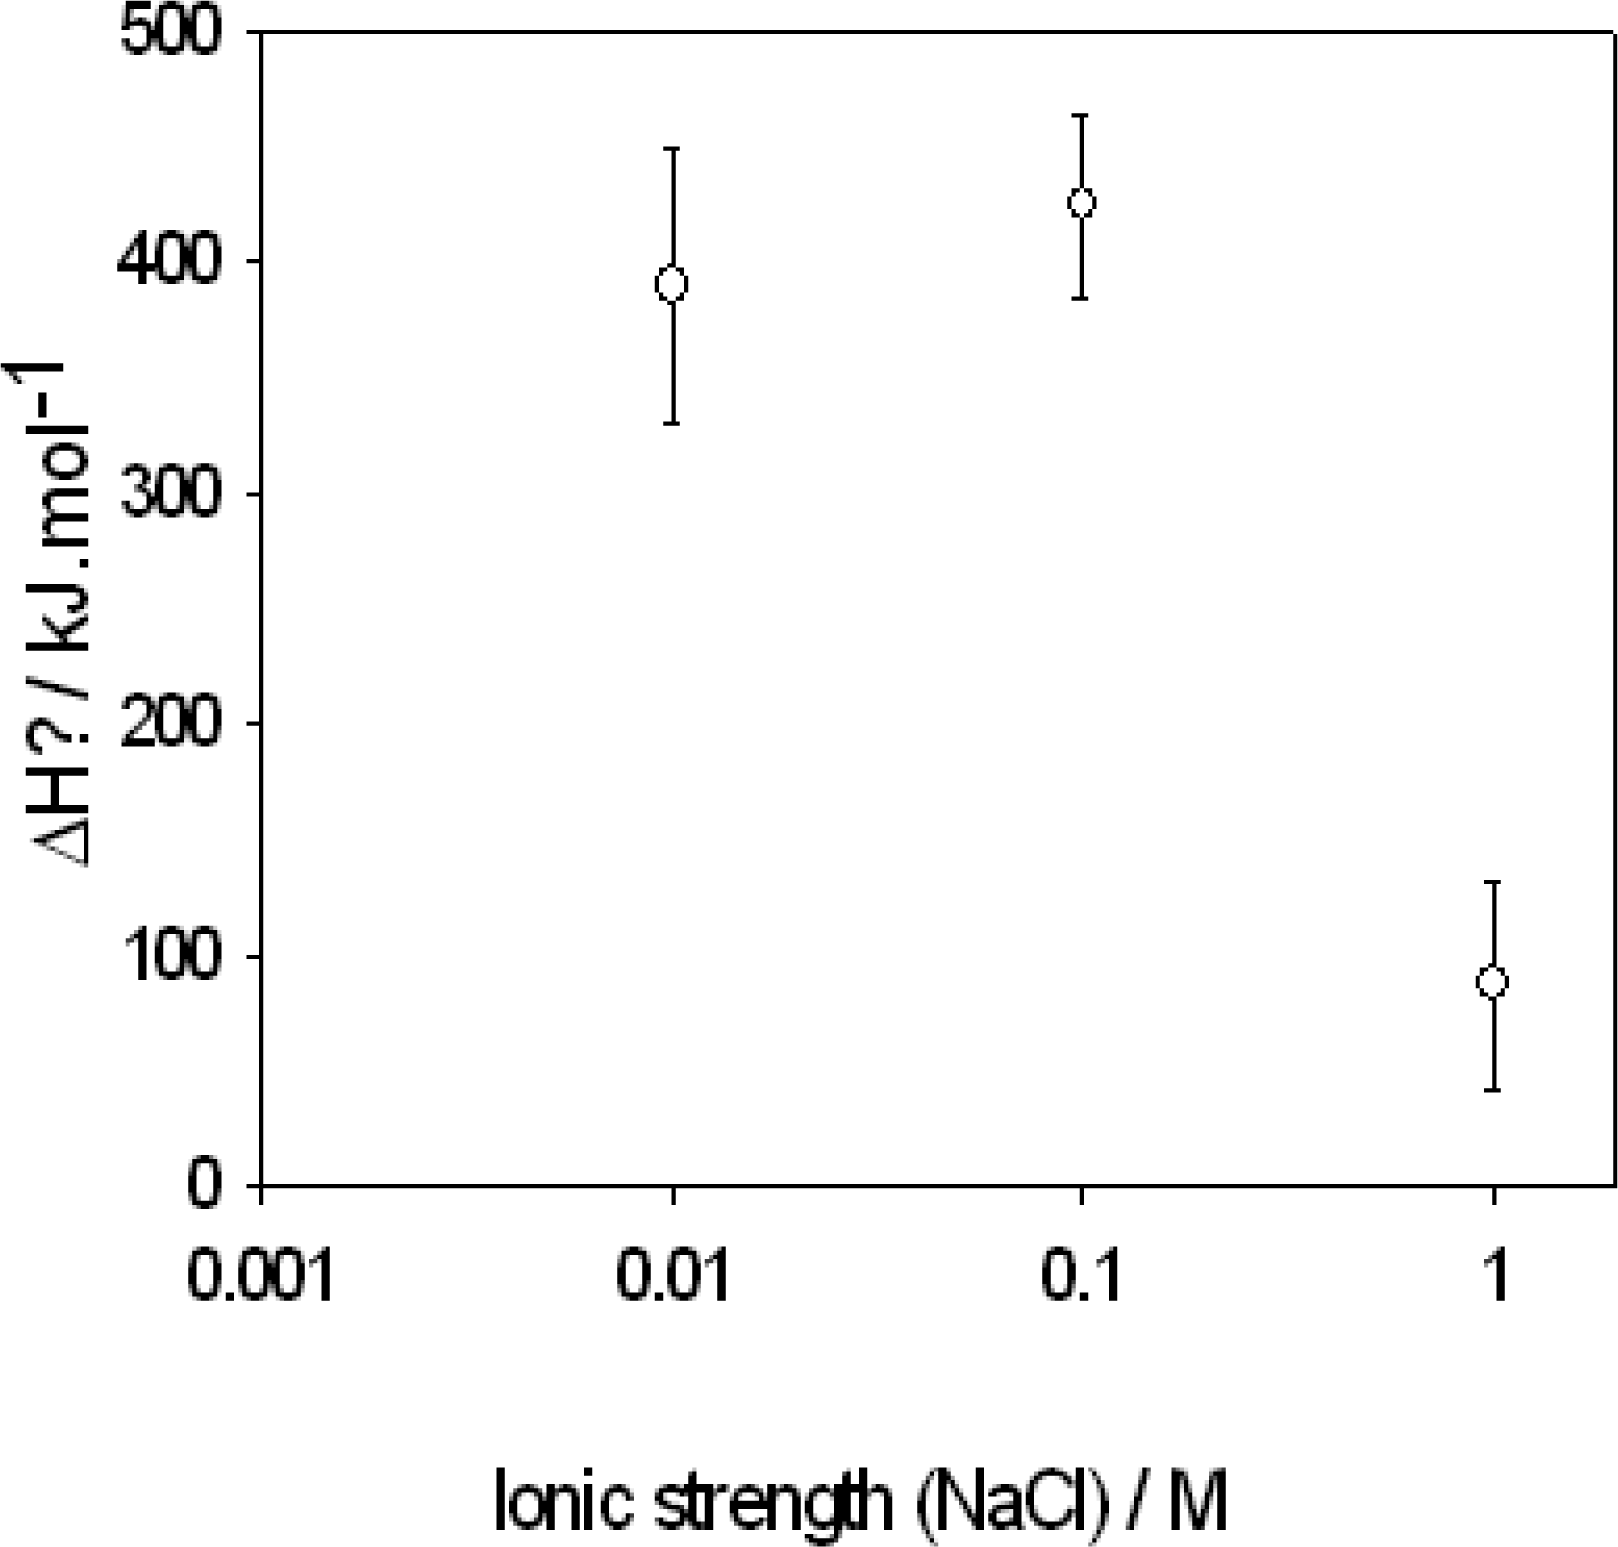
 ): Cl−, α=0.93. The ITC experiments were performed between 303 and 333 K. Data taken from Ref. [65].
): I−, the slope of the linear regression is α=0.98, (
): Br−, α=0.93, (
): Cl−, α=0.93. The ITC experiments were performed between 303 and 333 K. Data taken from Ref. [65].
): Cl−, α=0.93. The ITC experiments were performed between 303 and 333 K. Data taken from Ref. [65].
): I−, the slope of the linear regression is α=0.98, (
): Br−, α=0.93, (
): Cl−, α=0.93. The ITC experiments were performed between 303 and 333 K. Data taken from Ref. [65].


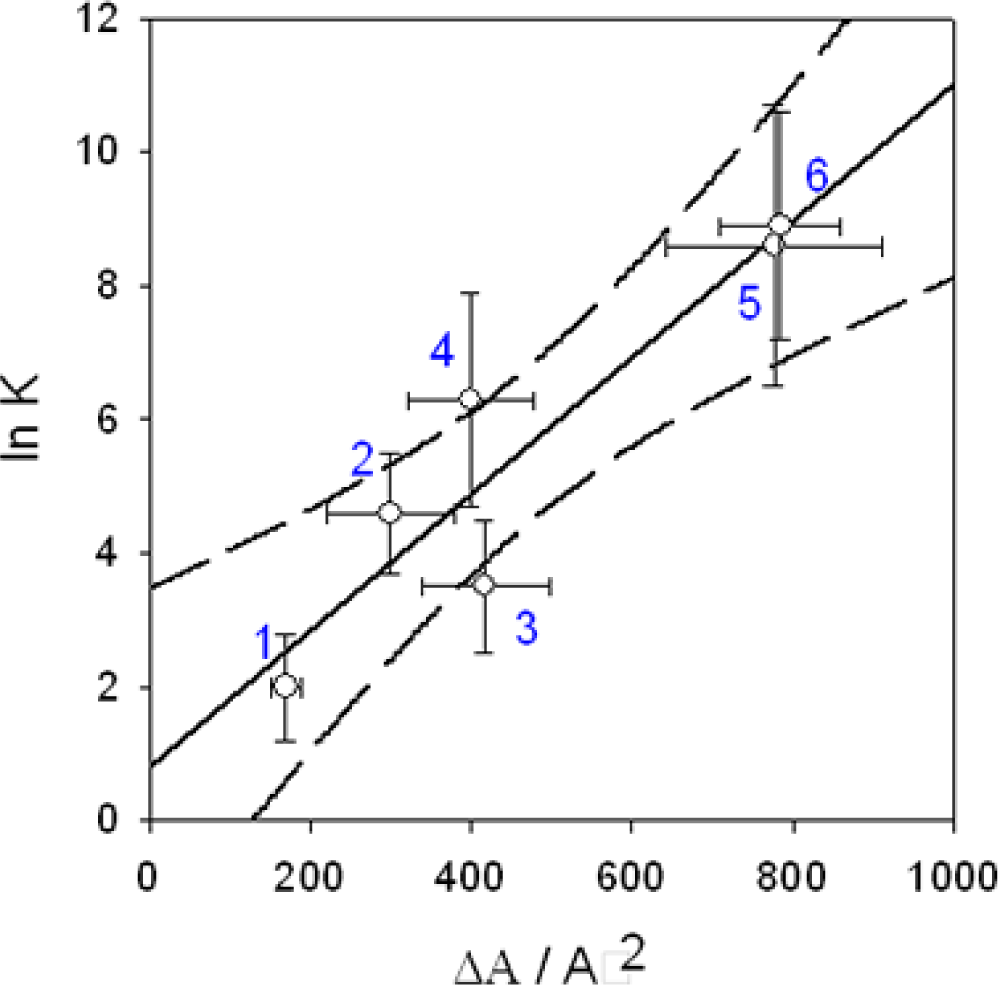
 )
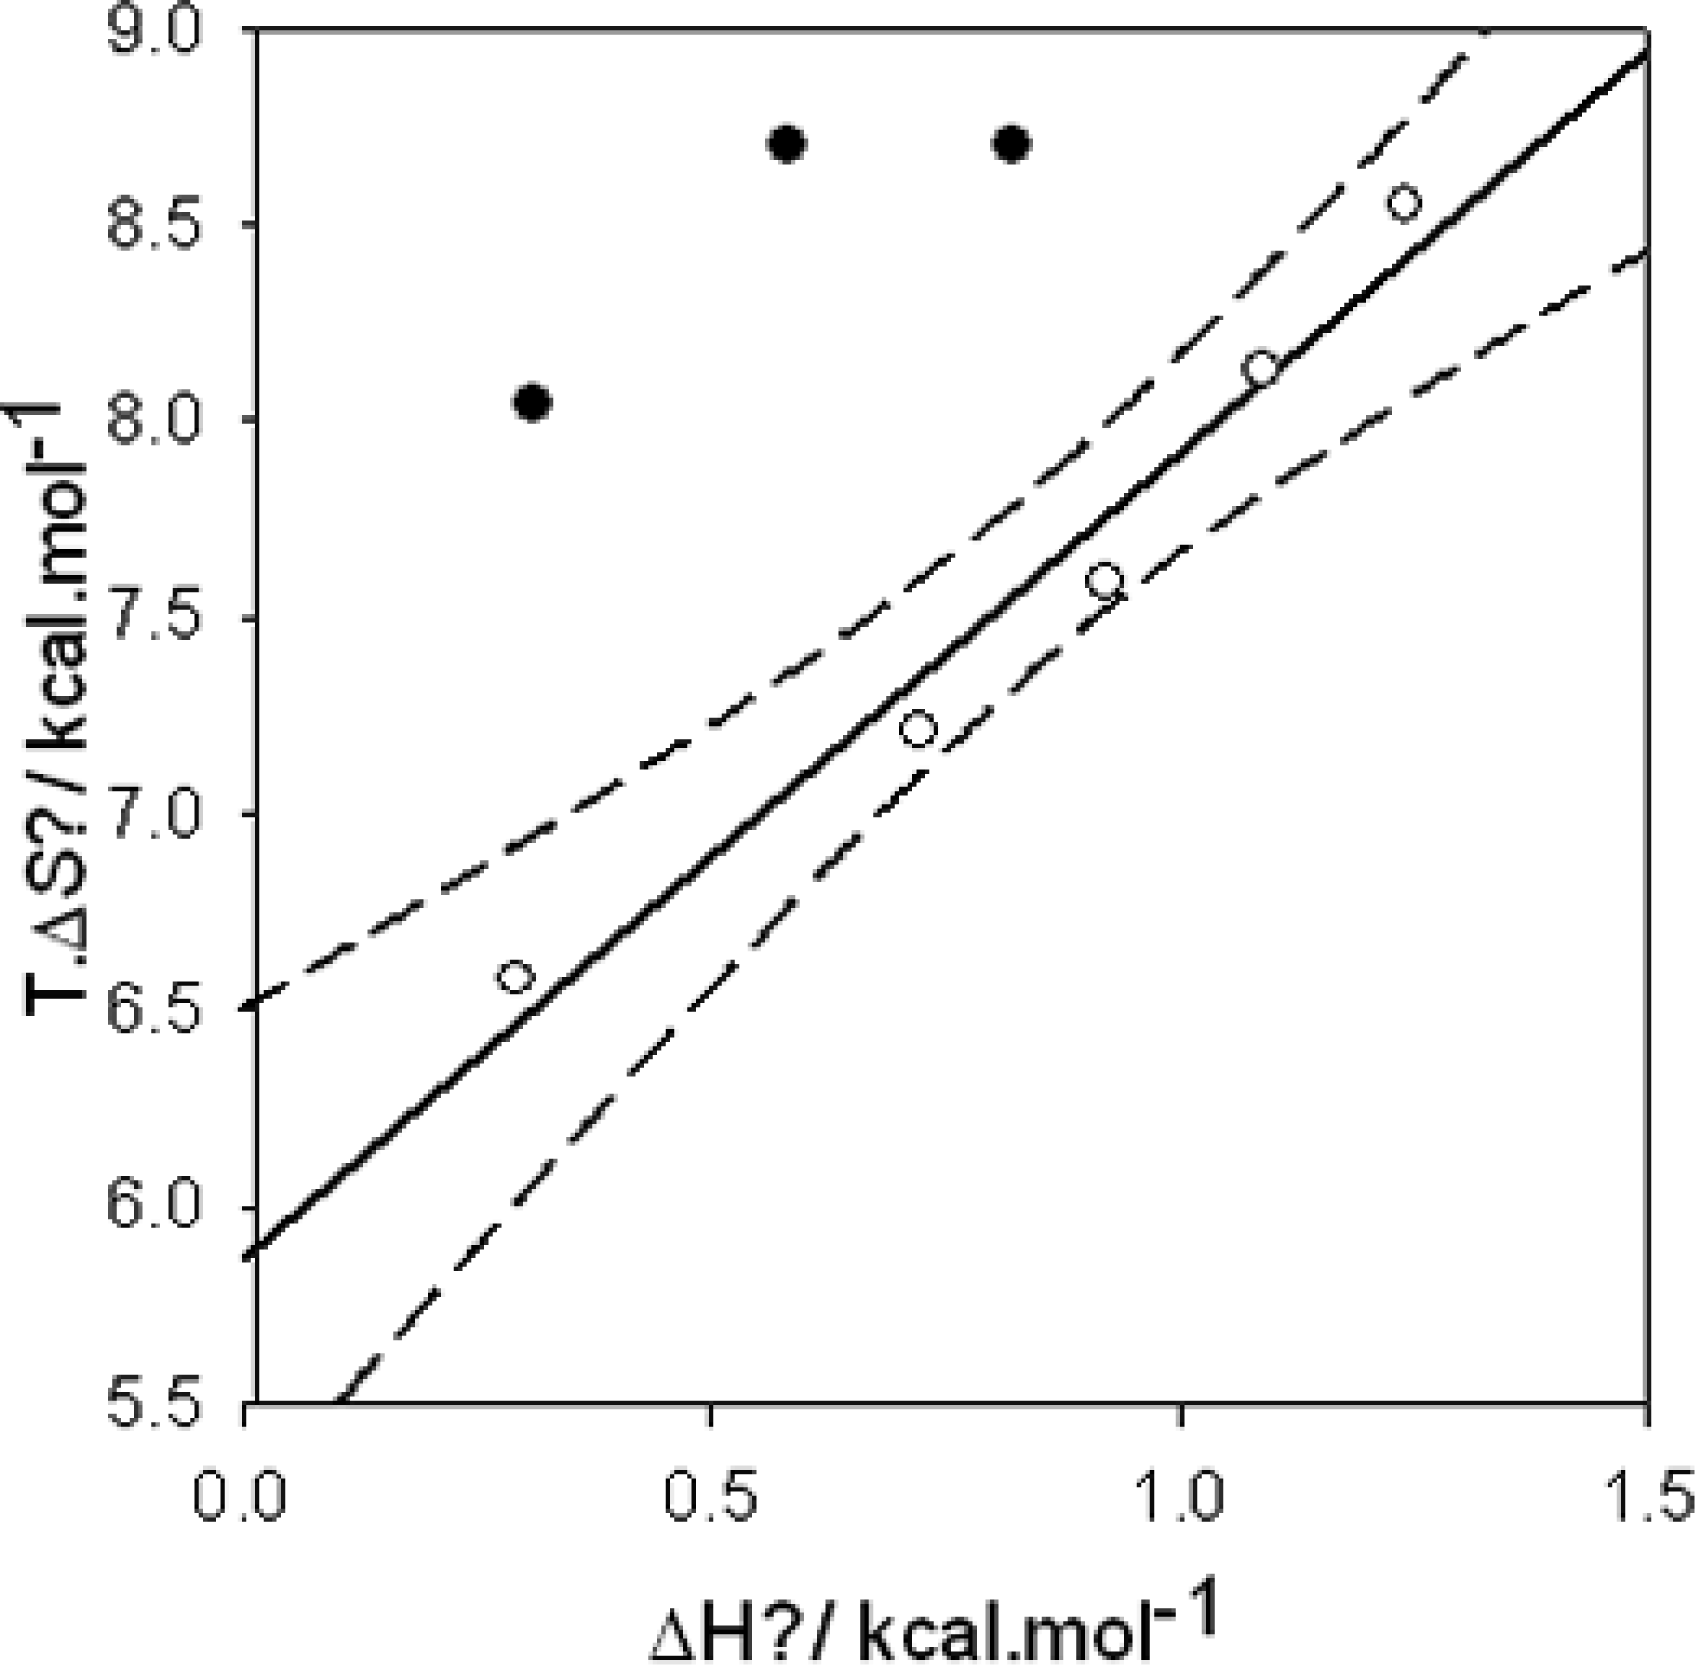
-pUC118 binding and: (•) condensation of pUC118. The full and dashed lines correspond to the linear regression and the limit of the 95 % confidence interval respectively.
)
-pUC118 binding and: (•) condensation of pUC118. The full and dashed lines correspond to the linear regression and the limit of the 95 % confidence interval respectively.
)
-pUC118 binding and: (•) condensation of pUC118. The full and dashed lines correspond to the linear regression and the limit of the 95 % confidence interval respectively.
)
-pUC118 binding and: (•) condensation of pUC118. The full and dashed lines correspond to the linear regression and the limit of the 95 % confidence interval respectively.


© 2009 by the authors; licensee Molecular Diversity Preservation International, Basel, Switzerland. This article is an open-access article distributed under the terms and conditions of the Creative Commons Attribution license (http://creativecommons.org/licenses/by/3.0/).
Share and Cite
Ball, V.; Maechling, C. Isothermal Microcalorimetry to Investigate Non Specific Interactions in Biophysical Chemistry. Int. J. Mol. Sci. 2009, 10, 3283-3315. https://doi.org/10.3390/ijms10083283
Ball V, Maechling C. Isothermal Microcalorimetry to Investigate Non Specific Interactions in Biophysical Chemistry. International Journal of Molecular Sciences. 2009; 10(8):3283-3315. https://doi.org/10.3390/ijms10083283
Chicago/Turabian StyleBall, Vincent, and Clarisse Maechling. 2009. "Isothermal Microcalorimetry to Investigate Non Specific Interactions in Biophysical Chemistry" International Journal of Molecular Sciences 10, no. 8: 3283-3315. https://doi.org/10.3390/ijms10083283