Article

Antioxidant Activities of Extract and Fractions from the Hypocotyls of the Mangrove Plant Kandelia candel

Key Laboratory of the Ministry of Education for Coastal and Wetland Ecosystems, School of Life Sciences, Xiamen University, Xiamen 361005, China
*
Author to whom correspondence should be addressed.
Int. J. Mol. Sci. 2010, 11(10), 4080-4093; https://doi.org/10.3390/ijms11104080
Submission received: 30 September 2010 / Revised: 17 October 2010 / Accepted: 19 October 2010 / Published: 21 October 2010
(This article belongs to the Section Biochemistry)

Abstract

:
The antioxidant activities of 70% acetone extract (70% AE) from the hypocotyls of the mangrove plant Kandelia candel and its fractions of petroleum ether (PF), ethyl acetate (EF), water (WF), and the LF (WF fraction further purified through a Sephadex LH-20 column), were investigated by the 1,1-diphenyl-2-picrylhydrazyl (DPPH) free radical scavenging and ferric reducing/antioxidant power (FRAP) assays. The results showed that all the extract and fractions possessed potent antioxidant activity. There was a significant linear correlation between the total phenolics concentration and the ferric reducing power or free radical scavenging activity of the extract and fractions. Among the extract and fractions, the LF fraction exhibits the best antioxidant performance. The MALDT-TOF MS and HPLC analyses revealed that the phenolic compounds associated with the antioxidant activity of the LF fraction contains a large number of procyanidins and a small amount of prodelphinidins, and the epicatechin is the main extension unit.

1. Introduction

Reactive oxygen species (ROS), including superoxide radicals, hydroxyl radicals, singlet oxygen and hydrogen peroxide, are often generated as by-products of biological reactions or from exogenous factors [1]. Increasing evidence has suggested that many human diseases, such as cancer, cardiovascular disease, and neurodegenerative disorders, are the results of the oxidative damage by reactive oxygen species [2,3]. The antioxidants are molecules that mainly decelerate or prevent the oxidation reaction in vitro and in vivo by terminating the oxidation chain reaction [4]. The application of antioxidants in pharmacology is valuable to improve current treatments for diseases.
In recent years, there has been a great interest in finding natural antioxidants from plant materials to replace synthetic antioxidants, which are being restricted due to their carcinogenicity [5]. Numerous crude extracts and pure natural compounds from plants were reported to have antioxidant and radical scavenging activities [68]. Within the antioxidant compounds, flavonoids and phenolics, with a large distribution in nature, have been studied more comprehensively [911].
Mangroves are a diverse group of trees that grow in intertidal tropical forests. In mangrove species, phenolics are abundant components, which prevent damage from herbivores [12,13], but they also exhibit a diversity of other biological activities of historic and potential importance to humans [14]. Mangrove extracts have been used for diverse medicinal purposes and have a variety of antibacterial, antiherpetic and antihelminthic activities [15,16]. The extracts of some mangrove species indicate significant antioxidant activity [17,18]. Kandelia candel (Rhizophoraceae) is mostly widely distributed in the tropical and subtropical coastlines of China. According to a previous study, phenolics are important components in the leaf extract of K. candel and show excellent antioxidant activities [19]. The hypocotyls of K. candel also have high phenolics levels [20]. Therefore, the K. candel hypocotyls may be a good candidate for further development as an antioxidant remedy. In this study, we investigated the antioxidant activities of the 70% acetone extract and its fractions of K. candel hypocotyls for the first time, and identified the active compounds by matrix-assisted laser desorption/ionization time-of-flight mass spectrometry (MALDI-TOF MS) and reversed phase high performance liquid chromatography (HPLC) analyses.

2. Results and Discussion

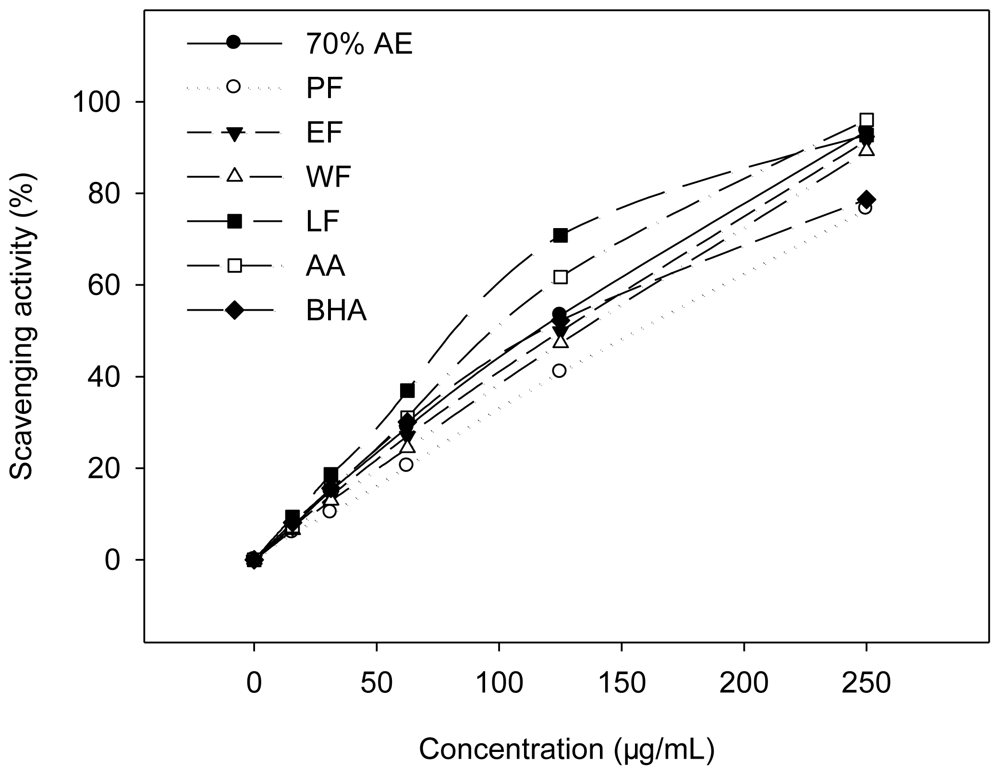
2.1. DPPH Radical Scavenging Activity

DPPH is one of the compounds that has a proton free radical with a characteristic absorption, which decreases significantly on exposure to proton radical scavengers [21]. The DPPH radical scavenging by antioxidants is attributable to their hydrogen donating ability [22]. The DPPH assay has been widely accepted as a tool for estimating free radical scavenging activities of antioxidants [19,2327]. Figure 1 illustrates a significant decrease in the concentration of DPPH radical due to the scavenging ability of the extract/fractions and standards (ascorbic acid and BHA).
The quality of the antioxidants in the extract/fractions was determined by the IC50 values (the concentration with scavenging activity of 50%) (Table 1). A low IC50 value indicates strong antioxidant activity in a sample. The lowest IC50 value of the LF (87.20 ± 1.01 μg/mL) indicated that this fraction exhibited the highest radical scavenging effect. The DPPH radical scavenging activity was found to be in the order: LF > ascorbic acid > BHA ≈ 70% AE > EF > WF > PF.

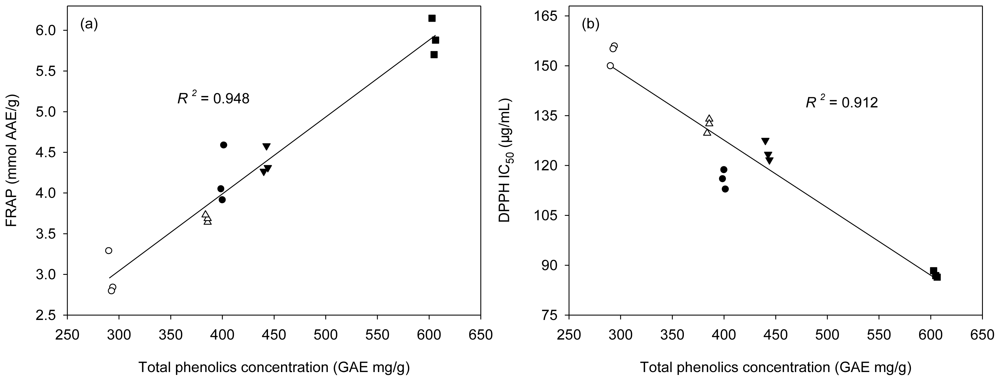
2.2. Ferric Reducing Antioxidant Power (FRAP)

The reduction capacity of a compound may serve as a significant indicator of its potential antioxidant activity [28]. The FRAP assay treats the antioxidants contained in the samples as reductants in a redox-linked colorimetric reaction and the value reflects the reducing power of the antioxidants [29]. A higher absorbance corresponds to a higher ferric reducing power. In the present study, the BHA and extract/fractions showed increased ferric reducing power with the increased concentration (Figure 2).
The FRAP value was expressed in ascorbic acid equivalents to determine the antioxidant ability of the samples. The FRAP was found to be 4.18 ± 0.36, 2.99 ± 0.27, 4.39 ± 0.17, 3.69 ± 0.04, 5.91 ± 0.23, and 5.28 ± 0.11 mmol AAE/g for 70% AE, PF, EF, WF, LF, and BHA, respectively (Table 1). In accordance with the findings from the DPPH assay, the LF had the highest antioxidant ability. In brief, the reducing power of extract/fractions and standard exhibited the descending order: LF > BHA > 70% AE ≈ EF > WF > PF.

2.3. The Total Phenolics Concentration

Plant phenolics possess the ability to scavenge both active oxygen species and electrophiles [30]. Many plant phenolic compounds, including flavonoids, tannins and phenolic acid, exhibit a strong antioxidant activity [31,32]. The total phenolics concentration in the extract/fractions of the hypocotyls of K. candel is shown in Table 2.
LF had the highest concentration of total phenolics, followed by EF, 70% AE, WF, and then PF. A significant liner correlation was found between the total phenolics concentration and the ferric reducing power (R2 = 0.948) or the total phenolics concentration and free radical scavenging activity (R2 = 0.912) (Figure 3). Some previous studies also had the same results [3335]. Phenolics concentration of K. candel hypocotyls was responsible for the antioxidant activity.

2.4. MALDI-TOF MS Analysis

MALDI-TOF MS is ideally suited for characterizing polyflavonoid tannin oligomers [3638] and is considered the mass spectrometric method of choice for analysis of tannins, which exhibit large structural heterogeneity [39]. When MALDI-TOF is used to characterize tannins, the selection of the appropriate matrix and cationization reagent is very important. Flamini [40] and Behrens et al. [41] reported that DHB as a matrix leads to the best analytical conditions for the detection of procyanidins in reflectron mode to provide the broadest mass range with the least background noise. Xiang et al. [42] found that for various cationizing agents in the presence of DHB matrix for MALDI-TOF MS analysis of condensed tannins, only Cs+ affect the intensity of the signals on the MALDI-TOF mass spectrum [42]. Using MALDI-TOF with deionization and selection of Cs+ as the cationization reagent, higher tannin polymers were observed [43].
Figure 4 shows the MALDI-TOF mass spectrum of the polymeric tannin mixtures from the last fraction (LF), recorded as Cs+ adducts in the positive ion reflectron mode and showing a series of repeating procyanidin polymers. The displayed magnification demonstrates the good resolution of the spectrum. The results indicated that condensed tannins from the last fraction (LF) are characterized by mass spectra with a series of peaks with distances of 288 Da, corresponding to a mass difference of one catechin/epicatechin between each polymer (Table 3). Therefore, prolongation of condensed tannins is due to addition of catechin/epicatechin monomers, extending up to hexadecamers.
In addition to the predicted homopolyflavan-3-ol mass series mentioned above, each DP had a subset of masses 16, 32, 48 Da higher (Figure 4 and Table 3). These masses can be explained by heteropolymers of repeating flavan-3-ol units containing an additional hydroxyl group (.16 Da) at the position 5′ of the B-ring. Given the absolute masses corresponding to each peak, it was further suggested that this condensed tannin contains a large number of procyanidins and a small amount of prodelphinidins.
On the basis of the structures described by Krueger et al. [44], an equation was formulated to predict heteropolyflavan-3-ols of a higher DP (Table 3). The equation is M = 290 + 288a + 304b + 133, where M is calculated mass, 290 is the molecular weight of the terminal catechin/epicatechin unit, a is the degree of polymerization contributed by the catechin/epicatechin extending unit, b is the degree of polymerization contributed by the gallocatechin/epigallocatechin extending unit, and 133 is the weight of cesium. Application of this equation to the experimentally obtained data revealed the presence of a series of condensed tannins consisting of well-resolved polymers. The broad peaks in this spectrum indicated, however, that there is a large structural heterogeneity within DP.
Each peak of the condensed tannins was also followed by mass signals at a distance of 132 Da (Figure 4), which was most likely added by one arabinoside group at the heterocyclic C-ring or an additional one Cs+ and loss of a proton. No series of compounds that are 2 Da multiples lower than those described peaks for heteropolyflavan-3-ols were detected, so A-type interflavan ether linkage does not occur between adjacent flavan-3-ol subunits. For the first time, the structure of condensed tannins from the hypocotyls of K. candel was successfully characterized by MALDI-TOF MS.

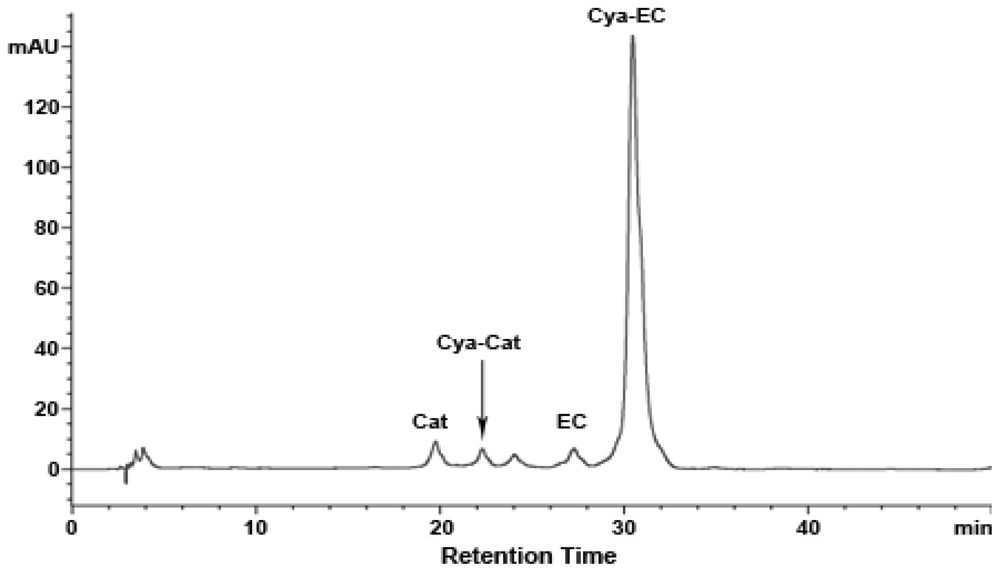
2.5. Thiolysis with Cysteamine Followed by RP-HPLC Analysis

Depolymerization reactions in the presence of nucleophiles are often used in the structural analysis of condensed tannins [18]. To further investigate whether the condensed tannins from the last fraction (LF) are composed of catechin and epicatechin, depolymerization through thiolysis reaction was carried out by following standard procedures using cysteamine, which was preferred to toluene-a-thiol as it is more user-friendly and much less toxic [45]. The reaction mixture was analyzed by HPLC (Figure 5). In agreement with the MALDI-TOF MS results, the last fraction (LF) consists primarily of procyanidins. The major product observed was the 4β-(2-aminoethylthio) epicatechin (Cya-EC) along with a small amount of (+)-catechin (Cat), (−)-epicatechin (EC), and 4β-(2-aminoethylthio) catechin (Cya-Cat). This result suggests that there are significant amounts of epicatechin extension units in the last fraction (LF).

3. Experimental Section

3.1. Chemicals and Materials

The solvents acetone, petroleum ether, ethyl acetate and methanol were of analytical reagent (AR) purity grade. The trifluoroacetic acid (TFA) and acetonitrile used for the analysis were of HPLC grade. 1,1-Diphenyl-2-picrylhydrazyl (DPPH), 2,4,6-tripyridyl-S-triazine (TPTZ), cysteamine hydrochloride, ascorbic acid, butylated hydroxyanisole (BHA), cesium chloride, and gallic acid were purchased from Aldrich (U.S.). (−)-Epicatechin (EC), (+)-catechin (Cat) were purchased from Sigma (U.S.). Sephadex LH-20 was purchased from Amersham (U.S.). The hypocotyls of K. candel were collected from Zhangjiang River Estuary Mangrove National Natural Reserves (117°24′E, 23°55′N), Yunxiao, Fujian province, China, and immediately freeze dried and ground.

3.2. Preparation of Samples

Freeze-dried hypocotyls (15 g) of K. candel were extracted with 150 mL 70% acetone and kept for 24 h at room temperature. The extract was then centrifuged at 3000 g for 15 min and collected. The same procedure was repeated three times. The collected extracts were combined, concentrated in a rotary evaporator, and then lyophilized. The final yield of 70% acetone extract (70% AE) was 4.5 g. From the 4.5 g of dried extract, 3 g was fractionated successively with petroleum ether, ethyl acetate, and water to yield soluble fractions of petroleum ether (PF, 0.21 g), ethyl acetate (EF, 0.39 g), and water (WF, 2.36 g). The water fraction (2 g) containing mainly polymers was further purified through a Sephadex LH-20 column. The column was first eluted with methanol:water (1:1) until the eluent turned colorless and then with acetone:water (7:3, 500 mL). The acetone was removed under reduced pressure, and the resulting residue was lyophilized to give the last fraction containing the purified polymeric tannins (LF, 0.89 g), which was further analyzed by MALDI-TOF mass spectrometry and thiolysis.

3.3. DPPH Radical Scavenging Activity

The free radical scavenging activities of the samples on the DPPH radical were measured using the method described by Brand-Williams et al. [46]. A 0.1 mL of various concentrations of each freeze-dried sample at different concentrations (15.63–250 μg/mL) was added to 3.9 mL of DPPH solution (25 mg/L in methanolic solution). An equal amount of methanol and DPPH served as control. After the mixture was shaken and left at room temperature for 30 min, the absorbance at 517 nm was measured. Lower absorbance of the reaction mixture indicates higher free radical scavenging activity. The IC50 value, defined as the amount of antioxidant necessary to decrease the initial DPPH concentration by 50%, was calculated from the results and used for comparison. The capability to scavenge the DPPH radical was calculated by using the following equation:
DPPH scavenging effect ( % ) = [ ( A 1 - A 2 ) / A 1 ] × 100
where A1 = the absorbance of the control reaction; A2 = the absorbance in the presence of the sample. BHA and ascorbic acid were used as standards.

3.4. Ferric Reducing/Antioxidant Power (FRAP) Assay

FRAP assay is a simple and reliable colorimetric method commonly used for measuring the total antioxidant capacity [47]. In brief, 3 mL of prepared freshly FRAP reagent was mixed with 0.1 mL of test sample or methanol (for the reagent blank). The FRAP reagent was prepared from 300 mmol/L acetate buffer (pH 3.6), 20 mmol/L ferric chloride and 10 mmol/L TPTZ made up in 40 mmol/L hydrochloric acid. All the above three solutions were mixed together in the ratio of 25:2.5:2.5 (v/v/v). The absorbance of reaction mixture at 593 nm was measured spectrophotometrically after incubation at 25 °C for 10 min. The FRAP values, expressed in mmol ascorbic acid equivalents (AAE)/g dried tannins, were derived from a standard curve.

3.5. Determination of Total Phenolics

The amount of total phenolics was determined using the Folin-Ciocalteu method [48]. Briefly, 0.2 mL aliquot of extract was added to a test tube containing 0.3 mL of distilled H2O. 0.5 mL of Folin-Ciocalteu reagent and 2.5 mL 20% Na2CO3 solution were added to the mixture and shaken. After incubation for 40 min at room temperature, the absorbance versus a blank was determined at 725 nm. Total phenolics concentrations of extracts were expressed as mg gallic acid equivalents (GAE)/g extract. All samples were analyzed in three replications.

3.6. MALDI-TOF MS Analysis

The MALDI-TOF MS spectra were recorded on a Bruker Reflex III instrument (Germany). The irradiation source was a pulsed nitrogen laser with a wavelength of 337 nm, and the duration of the laser pulse was 3 ns. In the positive reflectron mode, an accelerating voltage of 20.0 kV and a reflectron voltage of 23.0 kV were used. 2,5-Dihydroxy benzoic acid (DHB, 10 mg/mL 30% acetone solution) was used as the matrix. The sample solutions (10 mg/mL 30% acetone solution) were mixed with the matrix solution at a volumetric ratio of 1:3. The mixture (1 μL) was spotted to the steel target. Amberlite IRP-64 cation-exchange resin (Sigma-Aldrich, U.S.), equilibrated in deionized water, was used to deionize the analyte-matrix solution thrice. Cesium chloride (1.52 mg/mL) was mixed with the analyte-matrix solution (1:3, v/v) to promote the formation of a single type of ion adduct ([M + Cs]+) [42].

3.7. Thiolysis of the Condensed Tannins for HPLC Analysis

Thiolysis was carried out according to the method of Torres and Lozano [49]. A condensed tannin solution (4 mg/mL in methanol) was prepared. A sub-sample (50 μL) was placed in a vial and hydrochloric acid in methanol (3.3%, v/v; 50 μL) and cysteamine hydrochloride in methanol (50 mg/mL, 100 μL) were added. The solution was heated at 40 °C for 30 min, and cooled to room temperature. The size and composition of the condensed tannins were estimated from the RP-HPLC analysis of the depolymerised fractions [45]. Briefly, the terminal flavan-3-ols units were released by acid cleavage in the presence of cysteamine, whereas the extension moieties were released as the C4 cysteamine derivatives. Thiolysis reaction media (20 μL) filtrated through a membrane filter with an aperture size of 0.45 μm was analyzed by RP-HPLC.
The high performance liquid chromatograph was an Agilent 1200 system (U.S.) equipped with a diode array detector and a quaternary pump. The thiolysis media were further analyzed using LC/MS (QTRAP 3200, U.S.) with a Hypersil ODS column (4.6 mm × 250 mm, 2.5 μm) (China). The mobile phase was composed of solvent A (0.5% v/v trifluoroacetic acid (TFA) in water) and solvent B (0.5% v/v TFA in acetonitrile). The gradient condition was: 0–5 min, 3% B (isocratic); 5–15 min, 3–9% B (linear gradient); 15–45 min, 9–16% B (linear gradient), 45–60 min, 16–60% B (linear gradient). The column temperature was ambient and the flow-rate was set at 1 mL/min. Detection was at 280 nm and the UV spectra were acquired between 200–600 nm. Degradation products were identified on chromatograms according to their relative retention times and their UV-visible spectra. Each sample analysis was repeated three times.

3.8. Statistical Analysis

All data were expressed as means ± standard deviation of three independent determinations. One-way analysis of variance (ANOVA) was used, and the differences were considered to be significant at P < 0.05. All statistical analyses were performed with SPSS 13.0 for windows.

4. Conclusions

All the extract/fractions from the hypocotyls of K. candel showed potent antioxidant activity. Phenolics concentration of K. candel hypocotyls was responsible for the antioxidant activity. Extracts from the hypocotyls of K. candel might be valuable antioxidant natural sources for both the medical and food industry. Among the extract/fractions, the LF fraction exhibits the best antioxidant performance. The MALDT-TOF MS and HPLC analyses revealed that the phenolic compounds associated with the antioxidant activity of the LF fraction, contains a large number of procyanidins and a small amount of prodelphinidins, and the epicatechin is the main extension unit.

Acknowledgements

This work was supported by the National Natural Science Foundation of China (31070522), the Program for New Century Excellent Talents in University (NCET-07-0725), and by the Scientific Research Foundation for the Returned Overseas Chinese Scholars, State Education Ministry.

References

  1. Cerutti, PA. Oxidant stress and carcinogenesis. Eur. J. Clin. Invest 1991, 21, 1–11. [Google Scholar]
  2. Lemberkovics, É; Czinner, E; Szentmihályi, K; Balázs, A; SzÖke, É. Comparative evaluation of Helichrysi flos herbal extracts as dietary sources of plant polyphenols, and macro-and microelements. Food Chem 2002, 78, 119–127. [Google Scholar]
  3. Shon, MY; Kim, TH; Sung, NJ. Antioxidants and free radical scavenging activity of Phellinus baumii (Phellinus of Hymenochaetaceae) extracts. Food Chem 2003, 82, 593–597. [Google Scholar]
  4. Yanishlieva, NV; Marinova, E; Pokorny, J. Natural antioxidants from herbs and spices. Eur. J. Lipid Sci. Technol 2006, 108, 776–793. [Google Scholar]
  5. Sasaki, Y; Kawaguchi, S; Kamaya, A; Ohshita, M; Kabasawa, K; Iwama, K; Taniguchi, K; Tsuda, S. The comet assay with 8 mouse organs: results with 39 currently used food additives. Mutat. Res 2002, 519, 103–119. [Google Scholar]
  6. Barla, AI; Öztürk, M; Kültür, S; Öksüz, S. Screening of antioxidant activity of three Euphorbia species from Turkey. Fitoterapia 2007, 78, 423–425. [Google Scholar]
  7. Chang, SK; Sung, PM. Antioxidant activities of ethanol extracts from seeds in fresh Bokbunja (Rubus coreanus Miq.) and wine processing waste. Bioresour. Technol 2008, 99, 4503–4509. [Google Scholar]
  8. Chua, MT; Tung, YT; Chang, ST. Antioxidant activities of ethanolic extracts from the twigs of Cinnamomum osmophloeum. Bioresour. Technol 2008, 99, 1918–1925. [Google Scholar]
  9. Amico, V; Chillemi, R; Mangiafico, S; Spatafora, C; Tringali, C. Polyphenol-enriched fractions from Sicilian grape pomace: HPLC-DAD analysis and antioxidant activity. Bioresour. Technol 2008, 99, 5960–5966. [Google Scholar]
  10. Tung, YT; Wu, JH; Kuo, YH; Chang, ST. Antioxidant activities of natural phenolic compounds from Acacia confusa bark. Bioresour. Technol 2007, 98, 1120–1123. [Google Scholar]
  11. Maksimović, Z; Malenčić, D; Kovačević, N. Polyphenol contents and antioxidant activity of Maydis stigma extracts. Bioresour. Technol 2005, 96, 873–877. [Google Scholar]
  12. Feller, IC; Whigham, DF; O’Neill, JP; McKee, KL. Effects of nutrient enrichment on withinstand cycling in a mangrove forest. Ecology 1999, 80, 2193–2205. [Google Scholar]
  13. Hernes, PJ; Benner, R; Cowie, GL; Goni, MA; Bergamaschi, BA; Hedges, JI. Tannin diagenesis in mangrove leaves from a tropical estuary: A novel molecular approach. Geochim. Cosmochim. Acta 2001, 65, 3109–3122. [Google Scholar]
  14. Mainoya, J; Mesaki, S; Banyikwa, FF. Kunstadter, PE, Bird, CF, Sabhasri, S, Eds.; The distribution and socio-economic aspects of mangrove forests in Tanzania. In Man in the Mangroves: the Socio-Economic Situation of Human Settlements in Mangrove Forests; United Nations University: Tokyo, Japan, 1986; pp. 87–95. [Google Scholar]
  15. Pittier, H. Manual de las plantas usuales de Venezuela; Fundación Eugenio Mendoza: Caracas, Venezuela, 1978. [Google Scholar]
  16. Lemmens, R; Wilijarni-Soetjipto, N. Dye and tannin-producing plants; Pudoc: Wageningen, The Netherlands, 1991. [Google Scholar]
  17. Banerjee, D; Chakrabarti, S; Hazra, A; Banerjee, S; Ray, J; Mukherjee, B. Antioxidant activity and total phenolics of some mangroves in Sundarbans. Afr. J. Biotechnol 2008, 7, 805–810. [Google Scholar]
  18. Rahim, AA; Rocca, E; Steinmetz, J; Jain Kassim, M; Sani Ibrahim, M; Osman, H. Antioxidant activities of mangrove Rhizophora apiculata bark extracts. Food Chem 2008, 107, 200–207. [Google Scholar]
  19. Zhang, LL; Lin, YM; Zhou, HC; Wei, SD; Chen, JH. Condensed tannins from mangrove species Kandelia candel and Rhizophora mangle and their antioxidant activity. Molecules 2010, 15, 420–431. [Google Scholar]
  20. Lin, YM; Liu, JW; Xiang, P; Lin, P; Ye, GF; da Sternberg, LSL. Tannin dynamics of propagules and leaves of Kandelia candel and Bruguiera gymnorrhiza in the Jiulong River Estuary, Fujian, China. Biogeochemistry 2006, 78, 343–359. [Google Scholar]
  21. Yamaguchi, T; Takamura, H; Matoba, T; Terao, J. HPLC method for evaluation of the free radical-scavenging activity of foods by using 1, 1-diphenyl-2-picrylhydrazyl. Biosci. Biotechnol. Biochem 1998, 62, 1201–1204. [Google Scholar]
  22. Chen, CW; Ho, CT. Antioxidant properties of polyphenols extracted from green and black teas. J. Food Lipids 1995, 2, 35–46. [Google Scholar]
  23. Zhang, LL; Lin, YM. HPLC, NMR and MALDI-TOF MS analysis of condensed tannins from Lithocarpus glaber leaves with potent free radical scavenging activity. Molecules 2008, 13, 2986–2997. [Google Scholar]
  24. Zhang, LL; Lin, YM. Tannins from Canarium album with potent antioxidant activity. J. Zhejiang Univ. Sci. B 2008, 9, 407–415. [Google Scholar]
  25. Zhang, LL; Lin, YM. Antioxidant tannins from Syzygium cumini fruit. Afr. J. Biotechnol 2009, 8, 2301–2309. [Google Scholar]
  26. Ruan, ZP; Zhang, LL; Lin, YM. Evaluation of the antioxidant activity of Syzygium cumini leaves. Molecules 2008, 13, 2545–2556. [Google Scholar]
  27. Wei, SD; Zhou, HC; Lin, YM; Liao, MM; Chai, WM. MALDI-TOF MS analysis of condensed tannins with potent antioxidant activity from the leaf, stem bark and root bark of Acacia confusa. Molecules 2010, 15, 4369–4381. [Google Scholar]
  28. Meir, S; Kanner, J; Akiri, B; Philosoph-Hadas, S. Determination and involvement of aqueous reducing compounds in oxidative defense systems of various senescing leaves. J. Agric. Food Chem 1995, 43, 1813–1819. [Google Scholar]
  29. Li, Y; Guo, C; Yang, J; Wei, J; Xu, J; Cheng, S. Evaluation of antioxidant properties of pomegranate peel extract in comparison with pomegranate pulp extract. Food Chem 2006, 96, 254–260. [Google Scholar]
  30. Robards, K; Prenzler, PD; Tucker, G; Swatsitang, P; Glover, W. Phenolic compounds and their role in oxidative processes in fruits. Food Chem 1999, 66, 401–436. [Google Scholar]
  31. Heim, KE; Tagliaferro, AR; Bobilya, DJ. Flavonoid antioxidants: chemistry, metabolism and structure-activity relationships. J. Nutr. Biochem 2002, 13, 572–584. [Google Scholar]
  32. Rakić, S; Povrenović, D; Tešević, V; Simić, M; Maletić, R. Oak acorn, polyphenols and antioxidant activity in functional food. J. Food Eng 2006, 74, 416–423. [Google Scholar]
  33. Cai, Y; Luo, Q; Sun, M; Corke, H. Antioxidant activity and phenolic compounds of 112 traditional Chinese medicinal plants associated with anticancer. Life Sci 2004, 74, 2157–2184. [Google Scholar]
  34. Silva, EM; Souza, JNS; Rogez, H; Rees, JF; Larondelle, Y. Antioxidant activities and polyphenolic contents of fifteen selected plant species from the Amazonian region. Food Chem 2007, 101, 1012–1018. [Google Scholar]
  35. Kumaran, A; Karunakaran, J. In vitro antioxidant activities of methanol extracts of five Phyllanthus species from India. LWT- Food Sci. Technol 2007, 40, 344–352. [Google Scholar]
  36. Hanton, SD. Mass spectrometry of polymers and polymer surfaces. Chem. Rev 2001, 101, 527–569. [Google Scholar]
  37. Pasch, H; Pizzi, A; Rode, K. MALDI–TOF mass spectrometry of polyflavonoid tannins. Polymer 2001, 42, 7531–7539. [Google Scholar]
  38. Navarrete, P; Pizzi, A; Pasch, H; Rode, K; Delmotte, L. MALDI-TOF and 13C NMR characterization of maritime pine industrial tannin extract. Ind. Crop. Prod 2010, 32, 105–110. [Google Scholar]
  39. Reed, JD; Krueger, CG; Vestling, MM. MALDI-TOF mass spectrometry of oligomeric food polyphenols. Phytochemistry 2005, 66, 2248–2263. [Google Scholar]
  40. Flamini, R. Mass spectrometry in grape and wine chemistry. Part I: Polyphenols. Mass Spectrom. Rev 2003, 22, 218–250. [Google Scholar]
  41. Behrens, A; Maie, N; Knicker, H; Kögel-Knabner, I. MALDI-TOF mass spectrometry and PSD fragmentation as means for the analysis of condensed tannins in plant leaves and needles. Phytochemistry 2003, 62, 1159–1170. [Google Scholar]
  42. Xiang, P; Lin, YM; Lin, P; Xiang, C. Effects of adduct ions on matrix-assisted laser desorption/ionization time of flight mass spectrometry of condensed tannins: a prerequisite knowledge. Chin. J. Anal. Chem 2006, 34, 1019–1022. [Google Scholar]
  43. Xiang, P; Lin, Y; Lin, P; Xiang, C; Yang, Z; Lu, Z. Effect of cationization reagents on the matrix-assisted laser desorption/ionization time-of-flight mass spectrum of Chinese gallotannins. J. Appl. Polym. Sci 2007, 105, 859–864. [Google Scholar]
  44. Krueger, CG; Dopke, NC; Treichel, P; Folts, J; Reed, JD. Matrix-assisted laser desorption/ionization time-of-flight mass spectrometry of polygalloyl polyflavan-3-ols in grape seed extract. J. Agric. Food Chem 2000, 48, 1663–1667. [Google Scholar]
  45. Torres, JL; Selga, A. Procyanidin size and composition by thiolysis with cysteamine hydrochloride and chromatography. Chromatographia 2003, 57, 441–445. [Google Scholar]
  46. Brand-Williams, W; Cuvelier, ME; Berset, C. Use of a free radical method to evaluate antioxidant activity. LWT-Food Sci. Technol 1995, 28, 25–30. [Google Scholar]
  47. Benzie, IFF; Strain, JJ. The ferric reducing ability of plasma (FRAP) as a measure of antioxidant power: the FRAP assay. Anal. Biochem 1996, 239, 70–76. [Google Scholar]
  48. Makkar, HPS; Blümmel, M; Borowy, NK; Becker, K. Gravimetric determination of tannins and their correlations with chemical and protein precipitation methods. J. Sci. Food Agric 1993, 61, 161–165. [Google Scholar]
  49. Torres, JL; Lozano, C. Chromatographic characterization of proanthocyanidins after thiolysis with cysteamine. Chromatographia 2001, 54, 523–526. [Google Scholar]
Figure 1. DPPH radical scavenging activities of AA (ascorbic acid), BHA and the extract/fractions of K. candel hypocotyls at different concentrations.
Ijms 11 04080f1
Figure 2. Ferric reducing power of BHA and the extract/fractions of K. candel hypocotyls at different concentrations.
Ijms 11 04080f2
Figure 3. Correlation between the total phenolics concentration and the ferric reducing power (A); the total phenolics concentration and the free radical scavenging activity (B) of the extract/fractions of the hypocotyls of K. candel. Symbols: black circles = 70% AE, white circles = PF, black triangles = EF, white triangles = WF, and black quadrangle = LF.
Ijms 11 04080f3
Figure 4. MALDI-TOF positive ion reflectron mode mass spectrum of the condensed tannins from the last fraction (LF).
Ijms 11 04080f4
Figure 5. Reversed phase HPLC chromatograms of the tannins from the last fraction (LF) degraded in the presence of cysteamine; Cat, (+)-catechin; EC, (−)-epicatechin; Cya-Cat, 4β-(2-aminoethylthio) catechin; Cya-EC, 4β-(2-aminoethylthio) epicatechin.
Ijms 11 04080f5
Table 1. Antioxidant activities of the 70% acetone extract (70% AE) of K. candel hypocotyls and its fractions using the DPPH free radical scavenging assay and the ferric reducing antioxidant power (FRAP) assay.
Extract/fraction/ standard antioxidantsAntioxidant activity
IC50/DPPH (μg/mL) aFRAP (mmol AAE/g) b
70% AE115.67 ± 2.91d4.18 ± 0.36c
PF153.48 ± 3.22a2.99 ± 0.27e
EF124.19 ± 3.02c4.39 ± 0.17c
WF132.04 ± 2.16b3.69 ± 0.04d
LF87.20 ± 1.01f5.91 ± 0.23a
Ascorbic acid101.96 ± 1.84e--
BHA116.91 ± 0.97d5.28 ± 0.11b
aThe antioxidant activity was evaluated as the content of the test sample required to decrease the absorbance at 517 nm by 50% in comparison to the control;
bFRAP values are expressed in mmol ascorbic acid equivalent/g sample in dry weight; BHA: Butylated hydroxyanisole. Values are expressed as mean of duplicate determinations ± standard deviation; Different letters in the same column show significant differences from each other at P < 0.05 level.
Table 2. Total phenolics concentration in the extract/fractions of the hypocotyls of K. candel.
Extract/fractionsTotal phenolics (GAE mg/g extract or fractions)
70% AE400.43 ± 1.34c
PF292.75 ± 2.05e
EF442.21 ± 2.05b
WF385.02 ± 1.16d
LF604.63 ± 1.69a
Values are means ± SD of three determinations. Different letters in the same column show significant differences from each other at P < 0.05 level.
Table 3. MALDI-TOF MS of the condensed tannins from the last fraction (LF).
PolymerNumber of catechin unitsNumber of Gallocatechin unitsCalculated [M + Cs]+Observed [M + Cs]+
Trimer30999999.30
2110151015.30
1210311031.22

Tetramer4012871287.39
3113031303.39
2213191319.38

Pentamer5015751575.48
4115911591.48
3216071607.49

Hexamer6018631863.56
5118791879.58
4218951895.58
3319111911.47

Heptamer7021512151.64
6121672167.71
5221832183.67
4321992199.59

Octamer8024392439.74
7124552455.75
6224712471.62

Nonamer9027272727.81
8127432743.48
7227592759.67

Decamer10030153015.92
9130313032.92

Undecamer11033033303.75
10133193320.75

Dodecamer12035913592.52
11136073608.53

Tridecamer13038793880.61
12138953896.72

Tetradecamer14041674168.72
13141834184.73

Pentadecamer15044554456.68

Hexadecamer16047434744.73

