Screening and Initial Binding Assessment of Fumonisin B1 Aptamers

 ,
,
Abstract
:
1. Introduction
2. Results and Discussion
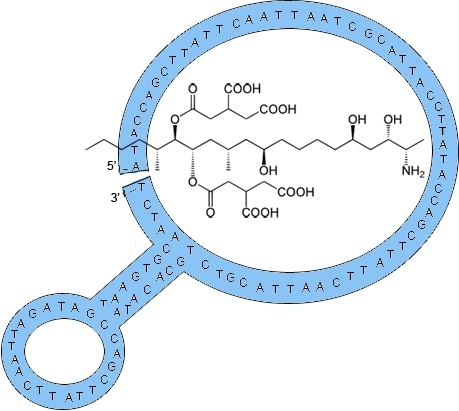
2.1. Fumonisin B1 Immobilization
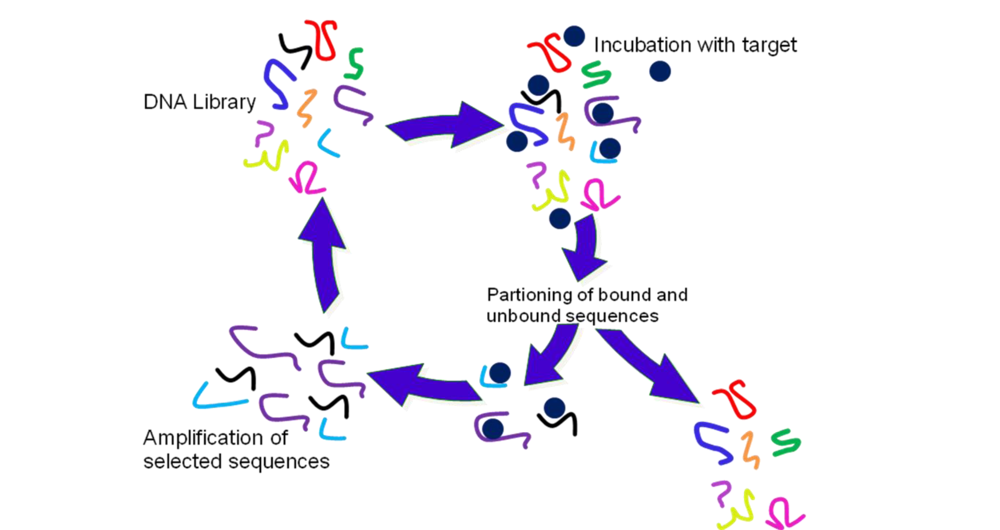
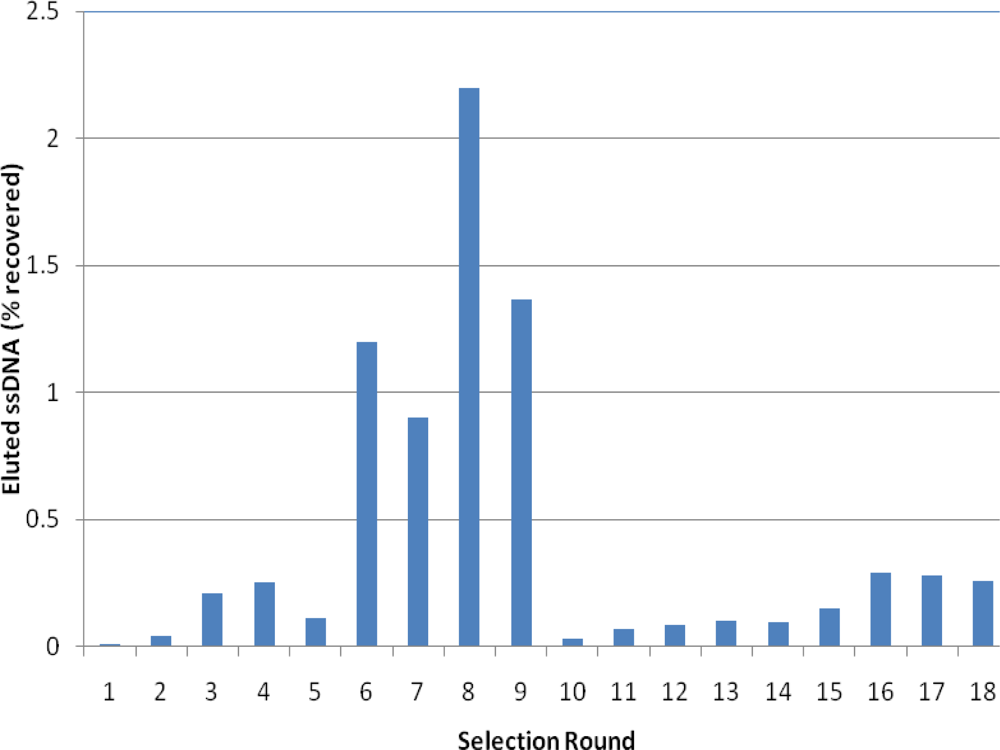
2.2. Selection of Aptamers
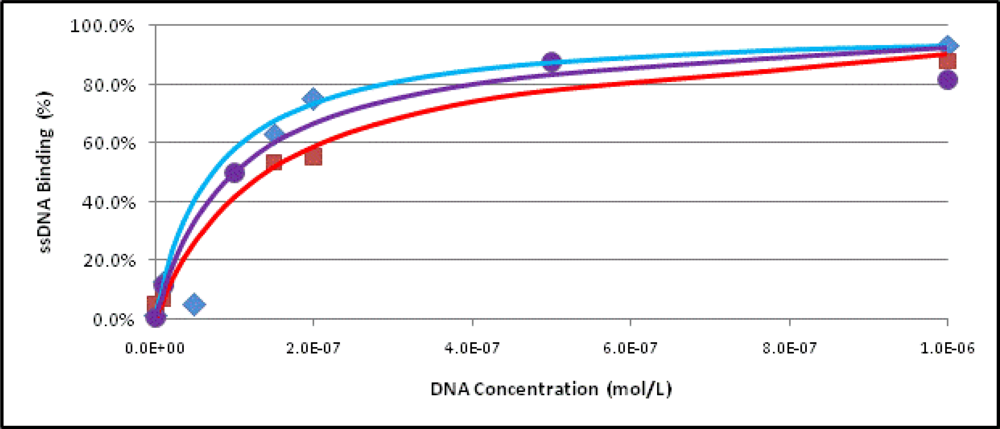
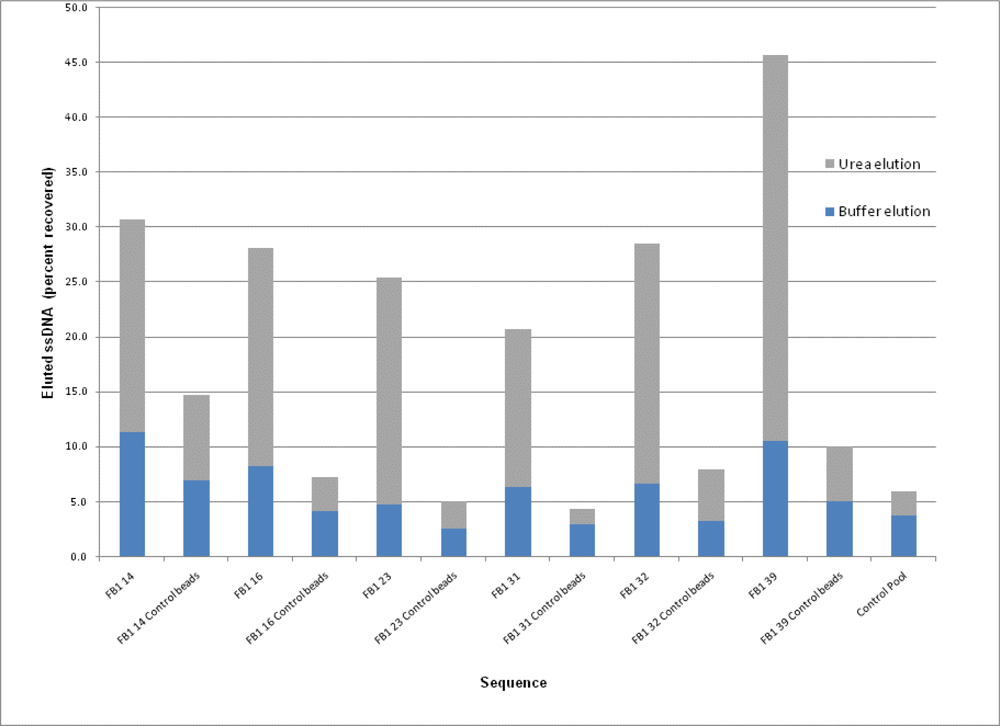
2.3. Binding Assays
3. Experimental Section
3.1. Reagents
3.2. Derivatization of Magnetic Beads
3.3. DNA Library and Primer Synthesis
3.4. SELEX Experiments
3.5. Cloning and Sequencing
3.6. Binding Assays
3.7. Determination of the Dissociation Constant
4. Conclusions
Acknowledgments
References
- Shoji, A; Kuwahara, M; Ozaki, H; Sawai, H. Modified DNA Aptamer that Binds the (R)-Isomer of a Thalidomide Derivative with High Enantioselectivity. J. Am. Chem. Soc 2007, 129, 1456–1464. [Google Scholar]
- Jenison, RD; Gill, SC; Pardi, A; Polisky, B. High-Resolution Molecular Discrimination by RNA. Science 1994, 263, 1425–1429. [Google Scholar]
- Huizenga, DE; Szostak, JW. A DNA Aptamer that Binds Adenosine and ATP. Biochemistry 1995, 34, 656–665. [Google Scholar]
- Paborsky, LR; McCurdy, SN; Griffin, LC; Toole, JJ; Leung, LL. The Single-Stranded DNA Aptamer-Binding Site of Human Thrombin. J. Biol. Chem 1993, 268, 20808–20811. [Google Scholar]
- Daniels, DA; Chen, H; Hicke, BJ; Swiderek, KM; Gold, L. A Tenascin-C Aptamer Identified by Tumor Cell SELEX: Systematic Evolution of Ligands by Exponential Enrichment. Proc. Natl. Acad. Sci. USA 2003, 100, 15416–15421. [Google Scholar]
- Jayasena, SD. Aptamers: An Emerging Class of Molecules that Rival Antibodies in Diagnostics. Clin. Chem 1999, 45, 1628–1650. [Google Scholar]
- Cheli, F; Pinotti, L; Campagnoli, A; Fusi, E; Rebucci, R; Baldi, A. Mycotoxin Analysis, Mycotoxin-Producing Fungi Assays and Mycotoxin Toxicity Bioassays in Food Mycotoxin Monitoring and Surveillance. Ital. J. Food Sci 2008, 20, 447–462. [Google Scholar]
- Maragos, CM. Recent Advances in the Development of Novel Materials for Mycotoxin Analysis. Anal. Bioanal Chem 2009, 395, 1205–1213. [Google Scholar]
- Cruz-Aguado, JA; Penner, G. Determination of Ochratoxin a with a DNA Aptamer. J. Agric. Food Chem 2008, 56, 10456–10461. [Google Scholar]
- Cruz-Aguado, JA; Penner, G. Fluorescence Polarization Based Displacement Assay for the Determination of Small Molecules with Aptamers. Anal. Chem 2008, 80, 8853–8855. [Google Scholar]
- De Girolamo, A; McKeague, M; Miller, JD; DeRosa, MC; Visconti, A. Determination of Ochratoxin A in Wheat After Clean-Up through a DNA Aptamer-Based Solid Phase Extraction Column. Food Chem 2010. Submitted.. [Google Scholar]
- Yang, C; Wang, Y; Marty, J; Yang, X. Aptamer-Based Colorimetric Biosensing of Ochratoxin A using Unmodified Gold Nanoparticles Indicator. Biosens Bioelectron 2010. in Press. [Google Scholar]
- Kuang, H; Chen, W; Xu, D; Xu, L; Zhu, Y; Liu, L; Chu, H; Peng, C; Xu, C; Zhu, S. Fabricated Aptamer-Based Electrochemical “signal-Off” Sensor of Ochratoxin A. Biosens. Bioelectron 2010, 26, 710–716. [Google Scholar]
- Wang, Z; Duan, N; Hun, X; Wu, S. Electrochemiluminescent Aptamer Biosensor for the Determination of Ochratoxin A at a Gold-Nanoparticles-Modified Gold Electrode using N-(Aminobutyl)-N-Ethylisoluminol as a Luminescent Label. Anal. Bioanal Chem 2010, 398, 2125–2132. [Google Scholar]
- Yang, X. Screeing DNA Aptamers of Deoxynivalenol by SELEX. Dissertation Thesis, Microbiology Unit of Nanchang University: Jiangxi, China, 16 December 2007.
- Bardoczy, V; Meszaros, T. Aptamer Selection for Macromolecular (Protein) and for Small Molecule Targets. In Periodica Polytechnica Abstracts of PhD Conference 2006; Faculty of Chemical Enginering, Budapest University of Technology and Economics: Budapest, Hungary, 2007. [Google Scholar]
- Bolger, M; Coker, RD; DiNovi, M; Gaylor, D; Gelderblom, W; Olsen, M; Paster, N; Riley, RT; Shephard, G; Speijers, GJA. Fumonisins. WHO/IPCS Safety Evaluation of Certain Mycotoxins in Food. WHO Food Addit. Ser 2001, 47, 557–680. [Google Scholar]
- SCF. Updated Opinion on Fumonisin B1, B2 and B3. Available online: http://ec.europa.eu/food/fs/sc/scf/out185_en.pdf (accessed on 18 November 2010).
- Anderson, GP; Kowtha, VA; Taitt, CR. Detection of Fumonisin B1 and Ochratoxin A in Grain Products using Microsphere-Based Fluid Array Immunoassays. Toxins 2010, 2, 297–309. [Google Scholar]
- Khayoon, WS; Saad, B; Salleh, B; Ismail, NA; Manaf, NHA; Latiff, AA. A Reversed Phase High Performance Liquid Chromatography Method for the Determination of Fumonisins B1 and B2 in Food and Feed using Monolithic Column and Positive Confirmation by Liquid chromatography/tandem Mass Spectrometry. Anal. Chim. Acta 2010, 679, 91–97. [Google Scholar]
- Ellington, AD; Szostak, JW. In Vitro Selection of RNA Molecules that Bind Specific Ligands. Nature 1990, 346, 818–822. [Google Scholar]
- Tuerk, C; Gold, L. Systematic Evolution of Ligands by Exponential Enrichment: RNA Ligands to Bacteriophage T4 DNA Polymerase. Science 1990, 249, 505–510. [Google Scholar]
- Mayer, G. The Chemical Biology of Aptamers. Angew. Chem. Int. Ed. Engl 2009, 48, 2672–2689. [Google Scholar]
- Stoltenburg, R; Reinemann, C; Strehlitz, B. FluMag-SELEX as an Advantageous Method for DNA Aptamer Selection. Anal. Bioanal. Chem 2005, 383, 83–91. [Google Scholar]
- Keefe, AD; Pai, S; Ellington, A. Aptamers as Therapeutics. Nat. Rev. Drug Discov 2010, 9, 537–550. [Google Scholar]
- Tombelli, S; Minunni, M; Mascini, M. Aptamers-Based Assays for Diagnostics, Environmental and Food Analysis. Biomol. Eng 2007, 24, 191–200. [Google Scholar]
- Tombelli, S; Minunni, M; Mascini, M. Analytical Applications of Aptamers. Biosens. Bioelectron 2005, 20, 2424–2434. [Google Scholar]
- Mann, D; Reinemann, C; Stoltenburg, R; Strehlitz, B. In Vitro Selection of DNA Aptamers Binding Ethanolamine. Biochem. Biophys. Res. Commun. 2005, 338, 1928–1934. [Google Scholar]
- Carothers, JM; Goler, JA; Kapoor, Y; Lara, L; Keasling, JD. Selecting RNA Aptamers for Synthetic Biology: Investigating Magnesium Dependence and Predicting Binding Affinity. Nucleic Acids Res 2010, 38, 2736–2747. [Google Scholar]
- Okazawa, A; Maeda, H; Fukusaki, E; Katakura, Y; Kobayashi, A. In Vitro Selection of Hematoporphyrin Binding DNA Aptamers. Bioorg. Med. Chem. Lett 2000, 10, 2653–2656. [Google Scholar]
- de Soultrait, VR; Lozach, P; Altmeyer, R; Tarrago-Litvak, L; Litvak, S; Andréola, ML. DNA Aptamers Derived from HIV-1 RNase H Inhibitors are Strong Anti-Integrase Agents. J. Mol. Biol 2002, 324, 195–203. [Google Scholar]
- Luo, X; McKeague, M; Pitre, S; Dumontier, M; Green, J; Golshani, A; DeRosa, MC; Dehne, F. Computational Approaches Toward the Design of Pools for the in Vitro Selection of Complex Aptamers. RNA 2010, 16, 2252–2262. [Google Scholar]
- Wilson, C; Szostak, JW. Isolation of a Fluorophore-Specific DNA Aptamer with Weak Redox Activity. Chem. Biol 1998, 5, 609–617. [Google Scholar]
- Silverman, SK. Artificial Functional Nucleic Acids: Aptamers, Ribozymes, and Deoxyribozymes Identified by in Vitro Selection. In Functional Nucleic Acids for Analytical Applications; Li, Y, Lu, Y, Eds.; Springer Science + Business Media, LLC: New York, NY, USA, 2009; Volume 1, pp. 47–108. [Google Scholar]
- Hopmans, EC; Murphy, PA. Detection of Fumonisins B1, B2, and B3 and Hydrolyzed Fumonisin B1 in Corn–Containing Foods. J. Agric. Food Chem 1993, 41, 1655–1658. [Google Scholar]
- Jhaveri, S; Ellington, A. In Vitro Selection of RNA Aptamers to a Small Molecule Target. Curr Protoc Nucleic Acid Chem 2002. Chapter 9, Unit 9.5.. [Google Scholar]
- Tok, JB; Fischer, NO. Single Microbead SELEX for Efficient ssDNA Aptamer Generation Against Botulinum Neurotoxin. Chem. Commun. (Camb) 2008, 16, 1883–1885. [Google Scholar]
- Stojanovic, MN; de Prada, P; Landry, DW. Aptamer-Based Folding Fluorescent Sensor for Cocaine. J. Am. Chem. Soc 2001, 123, 4928–4931. [Google Scholar]
- Ogawa, A; Tomita, N; Kikuchi, N; Sando, S; Aoyama, Y. Aptamer Selection for the Inhibition of Cell Adhesion with Fibronectin as Target. Bioorg. Med. Chem. Lett 2004, 14, 4001–4004. [Google Scholar]
- Zuker, M. Mfold Web Server for Nucleic Acid Folding and Hybridization Prediction. Nucleic Acids Res 2003, 31, 3406–3415. [Google Scholar]
- Davis, JH; Szostak, JW. Isolation of High-Affinity GTP Aptamers from Partially Structured RNA Libraries. Proc. Natl. Acad. Sci. USA 2002, 99, 11616–11621. [Google Scholar]
- Fukusaki, E; Hasunuma, T; Kajiyama, S; Okazawa, A; Itoh, TJ; Kobayashi, A. SELEX for Tubulin Affords Specific T-Rich DNA Aptamers. Bioorg. Med. Chem. Lett 2001, 11, 2927–2930. [Google Scholar]
- Miller, JD; Savard, ME; Rapior, S. Production and Purification of Fumonisins from a Stirred Jar Fermenter. Nat. Toxins 1994, 2, 354–359. [Google Scholar]
- Visconti, A; Solfrizzo, M; De Girolamo, A. Determination of Fumonisins B-1 and B-2 in Corn and Corn Flakes by Liquid Chromatography with Immunoaffinity Column Cleanup: Collaborative Study. J. AOAC Int 2001, 84, 1828–1837. [Google Scholar]
- Chen, Z; Ruffner, DE. Modified Crush-and-Soak Method for Recovering Oligodeoxynucleotides from Polyacrylamide Gel. BioTechniques 1996, 21, 820–822. [Google Scholar]
- Fylstra, D; Lasdon, L; Watson, J; Waren, A. Design and use of the Microsoft Excel Solver. INTERFACES 1998, 28, 29–55. [Google Scholar]


| Selection Round | Negative Selection Used | Number of FB1 derivatized beads used | Incubation time with FB1 derivatized beads(min) |
|---|---|---|---|
| 1 | Unmodified | 5 × 10⁸ | 60 |
| 2 | Unmodified | 5 × 10⁸ | 60 |
| 3 | Unmodified | 5 × 10⁸ | 60 |
| 4 | Unmodified | 5 × 10⁸ | 60 |
| 5 | l-homocysteine | 1 × 10⁸ | 60 |
| 6 | l-homocysteine | 1 × 10⁸ | 60 |
| 7 | l-homocysteine | 1 × 10⁸ | 45 |
| 8 | l-homocysteine | 1 × 10⁸ | 45 |
| 9 | l-homocysteine | 1 × 10⁸ | 45 |
| 10 | l-homocysteine | 5 × 10⁷ | 45 |
| 11 | l-cysteine and l-methionine | 5 × 10⁷ | 45 |
| 12 | l-cysteine and l-methionine | 5 × 10⁷ | 30 |
| 13 | l-cysteine and l-methionine | 5 × 10⁷ | 30 |
| 14 | l-cysteine and l-methionine | 5 × 10⁷ | 30 |
| 15 | l-cysteine and l-methionine | 1 × 10⁷ | 30 |
| 16 | l-glutamic acid | 1 × 10⁷ | 30 |
| 17 | l-glutamic acid | 1 × 10⁷ | 30 |
| 18 | l-glutamic acid | 1 × 10⁷ | 20 |
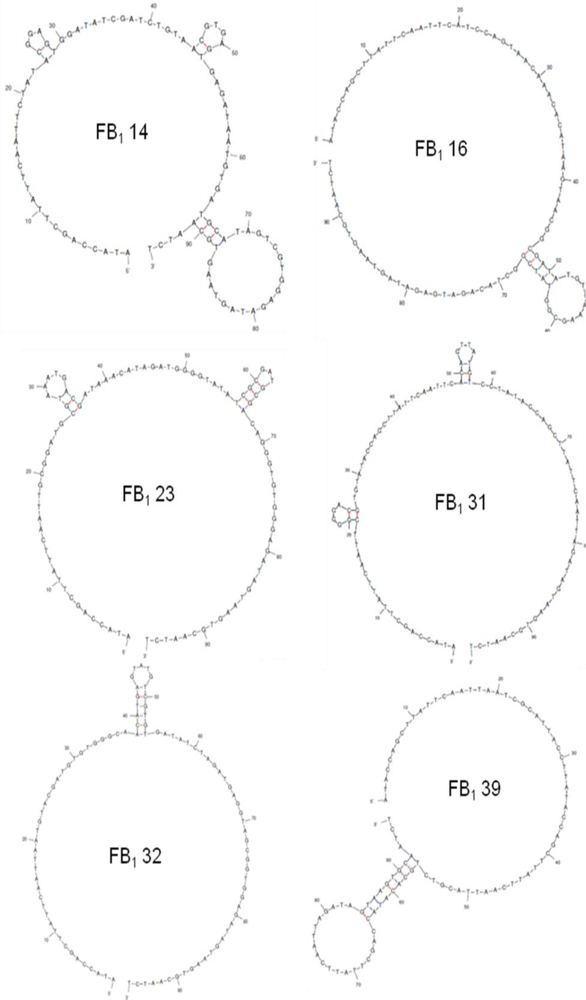
| Sequence | 5′-ATACCAGCTTATTCAATT-N60-AGATAGTAAGTGCAATCT-3′ | G Content (%) | Sequence Incidence (% of Total) |
|---|---|---|---|
| FB1 14 | CTATACGGAGTGGATATCGATCTGTAACGT GAGTGAGATAATGTGATGCATAGTCGTGG | 32 | 12.5 |
| FB1 16 | CATCCAGTAACAAACACATAAGTAACGGC GATATGTCAAAGCGGTATCGGCTACAGATG | 22 | 12.5 |
| FB1 23 | GCGGATGCGTAAATGACGATAAACATAGAT GGGGTATATCGCGATGCGACAGGGTGT | 35 | 12.5 |
| FB1 31 | CGGGGACGTGTATACCAGCTTATTCAATTC ACAGTTATGTCCTATACCAGCTTATTCAATT | 17 | 25 |
| FB1 32 | AATGTACGATGTGTGGGCAACATGAGTATG TCGTGTGATATCTAGATGAGGTAGCGGTGG | 37 | 12.5 |
| FB1 39 | AATCGCATTACCTTATACCAGCTTATTCAAT TACGTCTGCACATACCAGCTTATTCAATT | 8 | 25 |
© 2010 by the authors; licensee MDPI, Basel, Switzerland. This article is an open-access article distributed under the terms and conditions of the Creative Commons Attribution license (http://creativecommons.org/licenses/by/3.0/).
Share and Cite
McKeague, M.; Bradley, C.R.; Girolamo, A.D.; Visconti, A.; Miller, J.D.; DeRosa, M.C. Screening and Initial Binding Assessment of Fumonisin B1 Aptamers. Int. J. Mol. Sci. 2010, 11, 4864-4881. https://doi.org/10.3390/ijms11124864
McKeague M, Bradley CR, Girolamo AD, Visconti A, Miller JD, DeRosa MC. Screening and Initial Binding Assessment of Fumonisin B1 Aptamers. International Journal of Molecular Sciences. 2010; 11(12):4864-4881. https://doi.org/10.3390/ijms11124864
Chicago/Turabian StyleMcKeague, Maureen, Charlotte R. Bradley, Annalisa De Girolamo, Angelo Visconti, J. David Miller, and Maria C. DeRosa. 2010. "Screening and Initial Binding Assessment of Fumonisin B1 Aptamers" International Journal of Molecular Sciences 11, no. 12: 4864-4881. https://doi.org/10.3390/ijms11124864