Review

Liquid-Liquid Phase Transition and Glass Transition in a Monoatomic Model System

1
WPI Advanced Institute for Materials Research, Tohoku University, 2-1-1 Katahira, Aoba-ku, Sendai 980-8577, Japan
2
Department of Physics, Yeshiva University, 500 West 185th Street, New York, NY 10033, USA
3
Department of Physics, Brooklyn College of the City University of New York, Brooklyn, NY 11210, USA
4
Center for Polymer Studies and Department of Physics, Boston University, Boston, MA 02215, USA
*
Author to whom correspondence should be addressed.
Int. J. Mol. Sci. 2010, 11(12), 5184-5200; https://doi.org/10.3390/ijms11125184
Submission received: 16 November 2010 / Revised: 13 December 2010 / Accepted: 13 December 2010 / Published: 16 December 2010
(This article belongs to the Special Issue Amorphous Alloys)

Abstract

:
We review our recent study on the polyamorphism of the liquid and glass states in a monatomic system, a two-scale spherical-symmetric Jagla model with both attractive and repulsive interactions. This potential with a parametrization for which crystallization can be avoided and both the glass transition and the liquid-liquid phase transition are clearly separated, displays water-like anomalies as well as polyamorphism in both liquid and glassy states, providing a unique opportunity to study the interplay between the liquid-liquid phase transition and the glass transition. Our study on a simple model may be useful in understanding recent studies of polyamorphism in metallic glasses.

1. Introduction

The phenomenon of polyamorphism of a single-component system has been receiving a considerable attention [13] since the observation of two or more distinct glasses in water [412]. A number of new substances of such laboratory transformations have been reported [13,14] including elemental [1517], molecular [18], ionic [19], and covalent [20] systems. Recently, a metallic glass case, based on cerium [19], has been added to the list. Most of the experimental studies on polyamorphism involve transitions from an initial liquid state to either a second metastable liquid or to a glass. Polyamorphism in equilibrium, i.e., a liquid-liquid phase transition (LLPT) [21], has been studied for bulk phosphorus [15,16], and interpreted to underlie experimental observation in bulk water [7], quasi-two-dimensional confined water, [22,23] and quasi-one-dimensional confined water [2428], as well as in the thin layer of water surrounding biomolecules such as lysozyme, DNA, and RNA [25,29]. There is evidence from several sources [3036] that the two liquid phases involved in a LLPT have rather different properties. Thus, the existence of a single-component system with two distinct glassforming liquid phases provides a rare opportunity to study the fundamental aspects of glass formation. However, it can be challenging to establish such properties unambiguously because of the propensity of crystallization of the low-entropy liquid. It is therefore of interest to find a model system in which liquid phases can be studied under stable as well as metastable conditions, and glass transition (GT) can be observed independently.
One such a model is the spherically-symmetric two-scale Jagla potential with both replusive and attractive interactions [30,3742]. In this review, we will show that the two-scale Jagla potential (Figure 1), with a choice of parameters that crystallization can be avoided, exhibits polyamorphism not only in the equilibrium liquid phase at high temperature [30], but also in the glass states at low temperature [43]. It has been suggested that such spherically-symmetric potentials provide a generic mechanism for LLPT [4448], and have interested experimentalists to seek examples among the liquid metals [19]. For example, Stell and coworkers had identified Cesium and Cerium as candidate systems [4952], and indeed irreversible density changes under high pressure in glassy metals containing a large mole fraction of Ce have subsequently been reported [19]. Thus, the Jagla potential provides an excellent example of a very simply constituted system that is a good glassformer and it is suitable for pursuing the study of glassforming ability, which is obviously a key issue in the science of bulk metallic glasses. This resulted in a unique system that has allowed us to study the relation between the GT and the LLPT, which might be useful for the prediction of the relations between high density and low density metallic liquid phases that might be found in future studies of cerium-rich bulk metallic glassformers.
In this article, we will review our recent studies on a simple Jagla model of monoatomic system [34,35,3739,43] as shown in Figure 1. It shows polyamorphism both in liquid and glasses and can be of interest to general understanding of polyamorphism in liquids (such as water, Yttrium Oxide-Aluminum [53]), and polyamorphism in metallic glasses (such as Ce-based alloys [19]).

2. Polyamorphism in the Liquid States

We firstly review the equilibrium properties of the liquid phases of the Jagla model, which is relevant to the study of liquid water. As we know, water is the most important solvent for biological function [5456], yet water possesses many properties that are not well understood. One current hypothesis concerns the possibility that water’s anomalies are related to the existence of a line of a first order LLPT terminating at a liquid-liquid critical point (LLCP) [4,7,21,44,57], which is located in the deep supercooled region of the phase diagram below the homogeneous nucleation line, sometimes called the “no-man’s land” because it is difficult to make direct measurements on the bulk liquid phase [7]. For instance, the thermodynamic properties (e.g., specific heat) [58,59] of the bulk liquid water seems to diverge to a temperature (T ≈ 228 K) within the no man’s land region [6]. By confining water in hydrophilic nano-geometries, the liquid water can be stabilized down to much lower temperatures, which allows the detection of the thermodynamic property (e.g., specific heat), instead of divergence, exhibiting a maximum [60]. More recent experiment on nano-confined water by quasi-electric neutron scattering (QENS) and nuclear magnetic resonance (NMR) [24,61,62] showed that water appears to have dynamic crossover, between non-Arrhenius (“fragile”) behavior at high T to Arrhenius (“strong”) behavior at low T [6266]. This indicates that the LLPT may have a strong effect on the dynamic properties of supercooled water, including the glass transition [6771]. We note that, in this review, we only focused on one of four possible scenarios to explain the anomalous properties of water [72]. In particular, the singularity-free scenario [7375] hypothesizes that the low T anticorrelation between volume and entropy is sufficient to cause the response functions to increase upon cooling and display maxima at non-zero T, without reference to any sigular behavior. In the first part, we focus on the relation between a liquid-liquid phase transition and the thermodynamic and dynamic properties [25,30,62,65,7678].

2.1. Liquid-Liquid Phase Transition

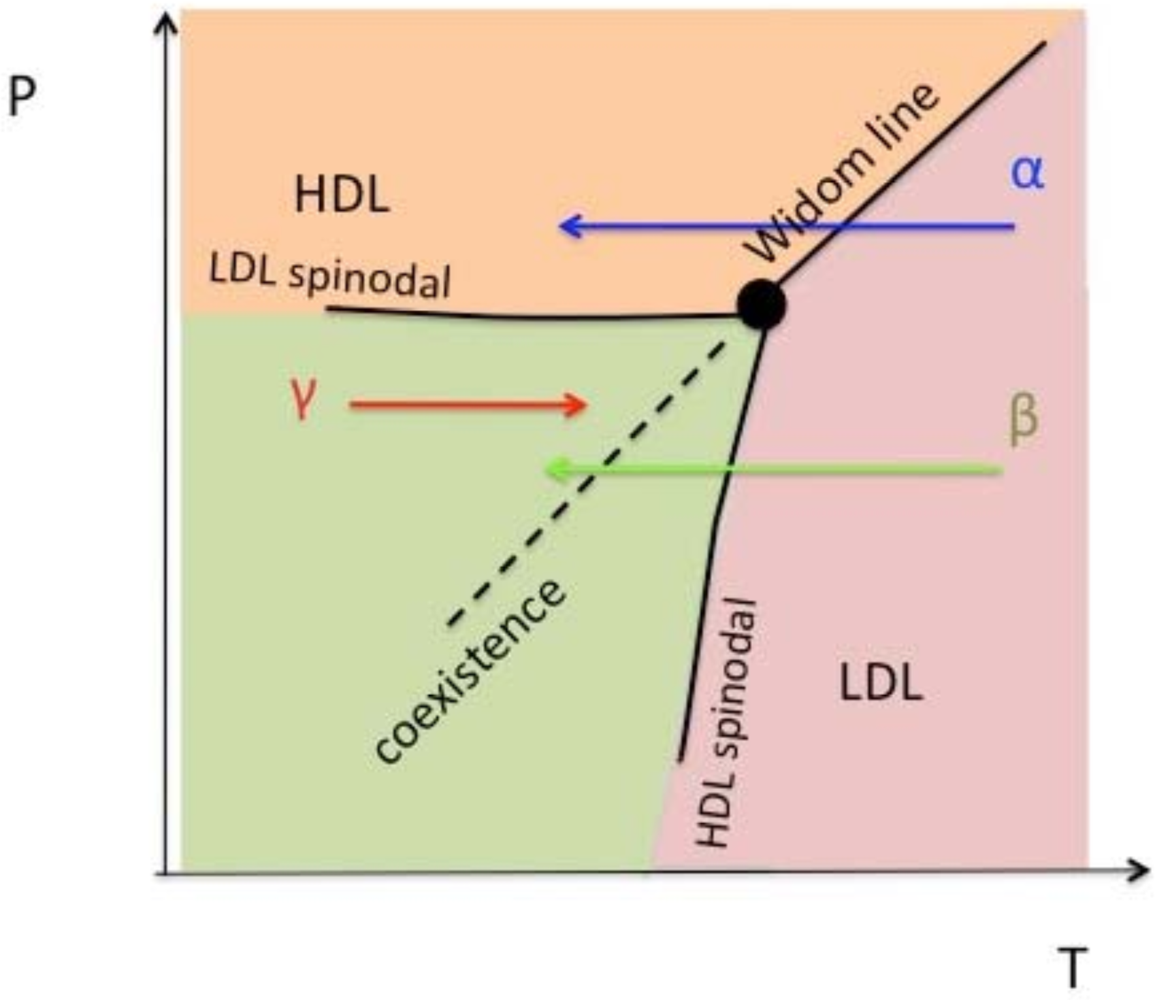
With the proper choice of parameters, as shown in Figure 1, the system shows a LLPT with a critical point located at Tc = 0.375, Pc = 0.243 and ρc = 0.37 above the melting line [30,34,35]. The coexistence line, determined by Maxwell rule via integrating of the isotherms in the PV phase diagram, shows a positively sloped liquid-liquid coexistence line [30]. A sketch of the phase diagram is shown in Figure 2. According to the Clapeyron equation,
dP dT = Δ S Δ V
the entropy in the low temperature phase, high-density liquid (HDL), is lower than the high temperature phase, low-density liquid (LDL), due to a positively sloped coexistence line. Hence, the HDL phase is more ordered than the LDL phase, which is the opposite of the liquid-liquid transition found in simulation for water [65] and silicon [31].
The limit of stability of the less-ordered LDL phase is determined by the high pressure LDL spinodal PLDL(T), which, for our model, is unlikely to be crossed by cooling the system at constant pressure since PLDL(T) ≈ Pc for all T except in the immediate vicinity of the LLCP. On the other hand, the limit of stability of the more ordered HDL phase is determined by the low pressure HDL spinodal THDL(P), which can be crossed by heating the HDL phase at constant pressure. That is why the dynamic behavior of the more ordered HDL phase can be studied only when T < THDL(P) for P < Pc [34,35].

2.2. Liquid-Liquid Transition and the Widom Line

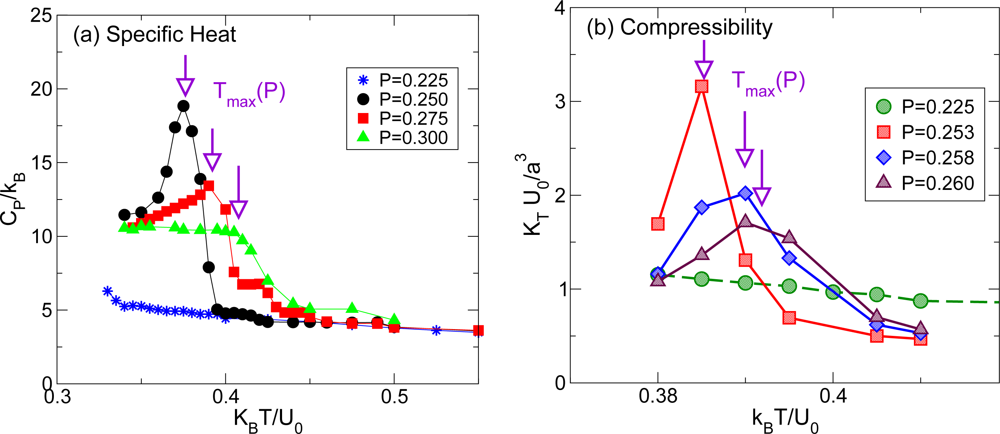
If the system is cooled isobarically along a path above the liquid-liquid critical pressure Pc (Figure 2, path α), the state functions continuously change from the values characteristic of a high temperature phase (LDL) to those characteristic of a low temperature phase (HDL). The thermodynamic response functions which are the derivatives of the state functions with respect to temperature, e.g., isobaric heat capacity (Figure 3(a)) and isothermal compressibility (Figure 3(b)), have maxima at temperatures denoted by Tmax(P). Remarkably these maxima are still prominent far above the critical pressure, as in the case of the liquid-gas critical phenomenon of water in Refs. [7982], and the values of the response functions at Tmax(P) (e.g., C P max and K T max) diverge as the critical point is approached. The lines of the maxima Tmax(P) for different response functions are different but asymptotically approach one another as the critical point is approached, since all response functions become expressible in terms of the correlation length. This asymptotic line is sometimes called the Widom line, and is often regarded as an extension of the coexistence line into the “one-phase regime”.
If the system is cooled at constant pressure below Pc within the two phases region (Figure 2, path β), the coexistence line can be difficult to detect in a pure system due to metastability, and changes will occur only when the spinodal is approached where the initial phase is no longer stable. The response functions—CP (Figure 3(a)) and KT (Figure 3(b))—increase continuously along path β (Figure 3) before the system reaches the stability limit near the LDL spinodal [57].

2.3. Structural Changes and Liquid-Liquid Phase Transition

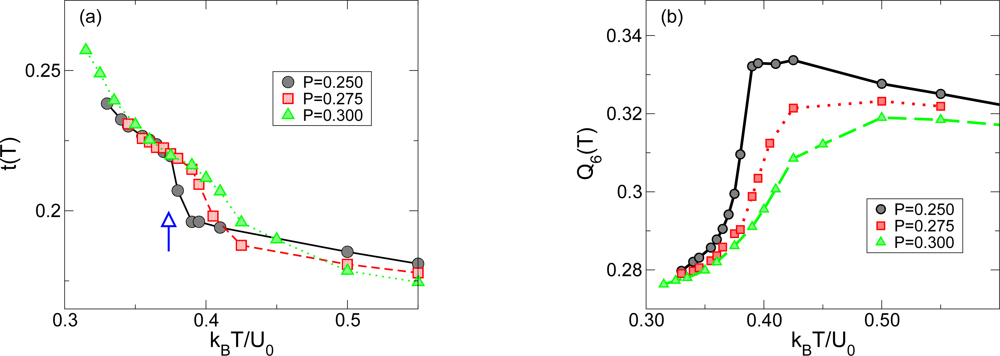
The structural properties [34] can be characterized by the translation order parameter and orientation order parameter. The translational order parameter t [8883] is defined as t 0 r c | g ( r ) 1 | d r, where r is the radial distance, g(r) is the pair correlation function, and rc = L/2 is the cutoff distance, where L is dimension of the system. A change in the translational order parameter indicates a change in the structure of the system. For uncorrelated systems, the interaction in the system is short-ranged with g(r) = 1, leading to t = 0; for long-range correlated systems, the modulations in g(r) persist over large distances, causing t to grow.
The orientational order parameter characterizes the average local order of the system [83]. For each particle, there are 12 bonds connecting the centeral particle with each of its 12 nearest neighbours and each bond is characterized by two angles (θ, φ). For the ith particle, the orientational order parameter, Ql,i, is defined as
Q , i [ 4 π 2 + 1 m = m = | Y ¯ , m | 2 ] 1 / 2
where ℓ,m(θ, φ) denotes the average of the spherical harmonic function Yℓ,m(θ, φ) over the 12 bonds associated with particle i. The orientational order parameter for the entire system is calculated as Q =< Qℓ,i >, where < ... > denotes the average over all particles in the system. For ℓ = 6, Q has large value for most crystals, such as fcc, hcp, and bcc. In general, the value of Q6 increases as the local order of a system increases, e.g, Q6=0.574 for the fcc lattice and Q6 = 0.289 for uncorrelated systems.
Similarly to what was observed for the thermodynamic properties, we see a sharp transition, from those resembling the LDL phase to those resembling the HDL phase when the system crosses the Widom line, in the translational t (Figure 4(a)) and orientational order parameters Q6 (Figure 4(b)). These sharp changes in t and Q6 becomes more pronounced as the path is closer to the critical pressure.

2.4. Dynamics Crossover and Liquid-Liquid Phase Transition

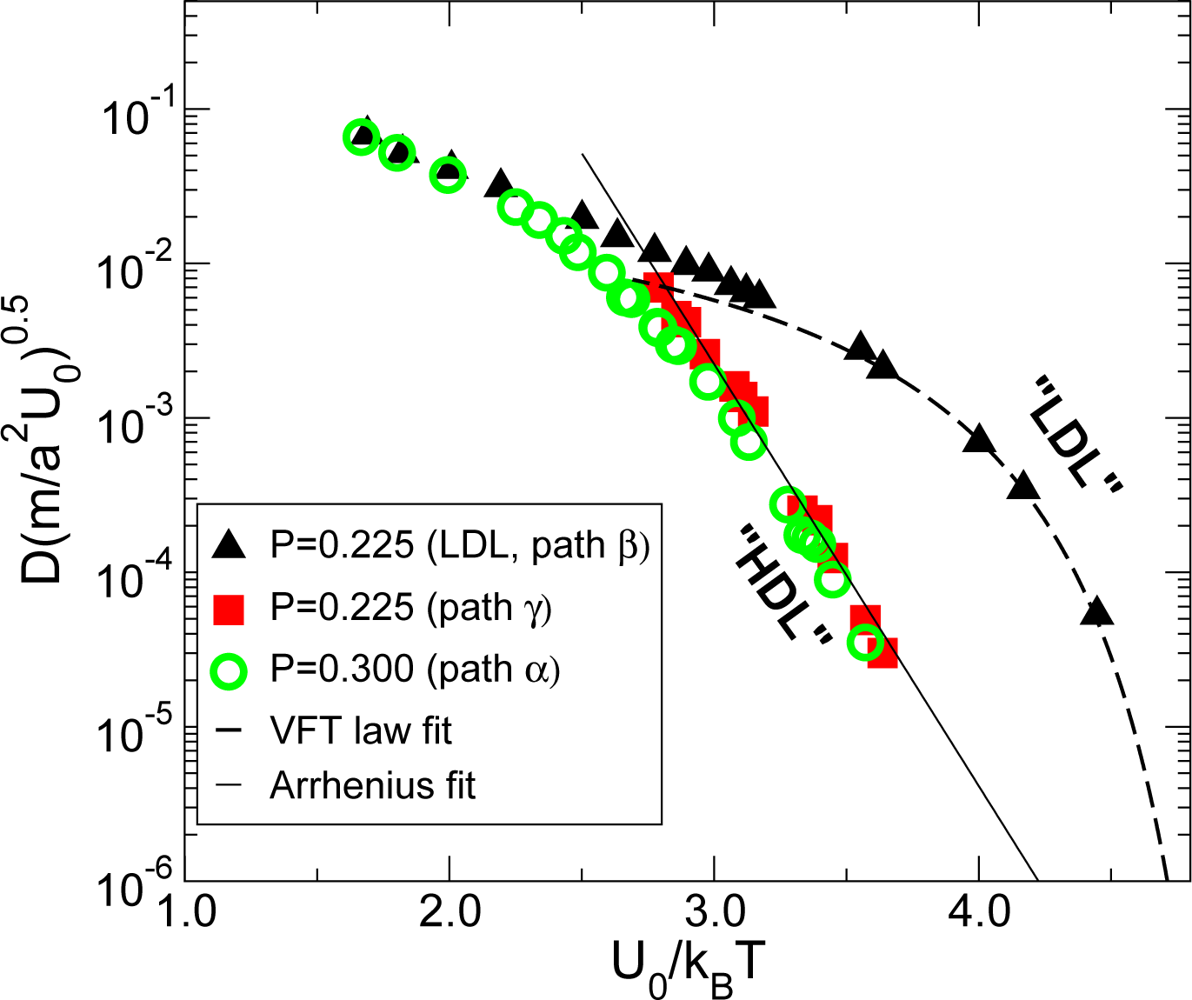
In the region of the P-T phase diagram between the LDL and HDL spinodals, the system can exist in both the LDL and HDL phases, one stable and one metastable. Along path β (Figure 2), the LDL phase remains metastable before crossing the LDL spinodal line. The dynamic behavior of the less ordered LDL phase follows the non-Arrhenius Vogel-Fulcher-Tamann (VFT) law (Figure 5, Triangle up), which is the characteristic of fragile glass formers. On the other hand, along paths γ which belong to the HDL phase, D follows Arrhenius behavior (Figure 5, Square), which is the characteristic of the strong glass formers.
For P > Pc along path α, there is a crossover in the behavior of D (Figure 5, Circle). The behavior is similar to what was observed in experimental studies of the strong liquid BeF2 [89], confined water [24] and in simulations of SiO2 [31]. In both cases, the Arrhenius slope extrapolates to an intercept at 1/T = 0, which is six orders of magnitude above the intercept of the high temperature Arrhenius part of the plot (which is common to all phases). Thus, the behavior of the HDL-like liquid on the low-temperature side of the Widom line can be classified as that of a strong liquid. The behavior on the high-temperature side of the Widom line, in the LDL-like phase, however, is very different, resembling that of the fragile liquid, as is clear from Figure 5. Thus, the present spherically-symmetric Jagla ramp potential exhibits a dynamic crossover from fragile liquid (LDL-like) at high-temperature to strong liquid (HDL-like) at low-temperature, suggesting the analogous fragile-to-strong transition as in water. We note that the strong liquid for Jagla potential is now the HDL phase, while the strong liquid for water is the LDL phase, due to the fact that the coexistence line for Jagla potential is positively sloped.
The Jagla ramp potential has an accessible LLCP and also displays water-type thermodynamic- and dynamic- crossover which occurs as the system crosses the Widom line while cooled along constant pressure paths P > Pc. These results, similar to simulations of silicon [31], show that the dynamics is Arrhenius in the more ordered phase (HDL for Jagla ramp model) and fragile for the less ordered phase (LDL for Jagla ramp model). The dynamic crossover for P > Pc is consistent with (i) the experimental observation in confined geometries (small pores) of a fragility transition [62], and (ii) experimental observation of a peak in the specific heat upon cooling water at atmospheric pressure in nanopores [60]. The existence of a single-component, monoatomic, system with two distinct glassforming liquid phases, provides a rare opportunity for study of fundamental aspects of glass formation.

3. Liquid—Glass Transformations

Despite being monatomic, and also spherically symmetric in its interaction potential, the Jagla system proves vitrification during cooling at rates that are very moderate by simulation standards. The observation of a LLPT in the Jagla model [30,34,35,3739] suggests that two different glasses should exist at low temperature. The high density liquid (HDL) is expected to transform into a high density amorphous (HDA) solid upon isobaric cooling at P > Pc [path α in Figure 2]. Similarly, the low density liquid (LDL) should transform into a low density amorphous (LDA) solid upon cooling at P < Pc [path β in Figure 2].

3.1. Low Density Amorphous and High Density Amorphous

It is well known that the vitrification of monatomic liquid cannot be assumed even in simulations [17,91] since crystallization will usually occur during the cooling process. We find that HDA can indeed be formed if the liquid is cooled at a “slow” rate at P > Pc (path α) [43]. However, cooling the liquid at P < Pc (path β) at the same rate results in crystallization. A faster (“intermediate”) rate [43] is required in order to obtain LDA. We note that upon cooling along path β, the liquid with LDL-like local geometry crosses the LLPT coexistence line (Figure 2). However, the LDL-to-HDL spinodal is never crossed so the system remains in the LDL phase due to metastability. Therefore, further cooling leads to vitrification of solid LDA without HDL formation.
Upon cooling the liquid at P > Pc (path α), although the system is in the one-phase region, a smooth crossover (not a transition) occurs from more LDL-like local geometry at temperatures well above the Widom line T > TW to more HDL-like local geometry well below the Widom line [30] (Figure 2). The structural heterogeneity that characterize the Jagla liquid are such that for T > TW the system can be thought of as a sea of molecules with locally LDL-like geometry, in which isolated molecules (and small clusters of molecules) with locally HDL-like geometry appear. As T decreases, the clusters of molecules with locally HDL-like geometry increase in number and size until there is a crossover at TW. For T > TW, the system can be thought of as a sea of molecules with locally HDL-like geometry, in which only isolated molecules (and small clusters of molecules) with locally LDL-like geometry occur. Thus one observes vitrification of the liquid with HDL-like local geometry to HDA.
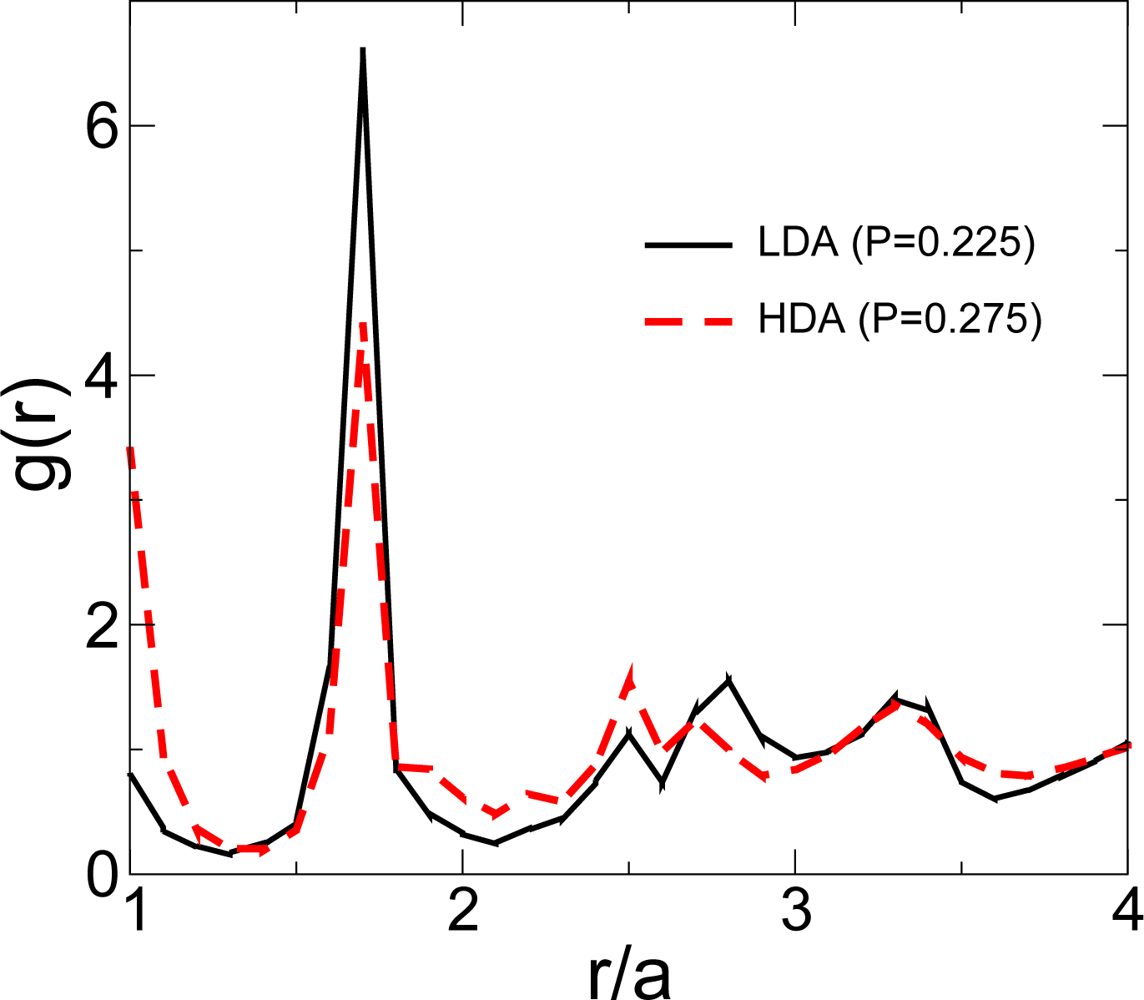
Figure 6 compares the radial distribution functions (RDF) of LDA and HDA obtained along P < Pc and P > Pc, respectively. Both RDFs are clearly different indicating that LDA and HDA are indeed distinct glass phases. For LDA, the majority of the particles are located around the soft-core distance, in the vicinity of the minimum of the pair potential (corresponding to the peak of the RDF at the soft-core distance r/a = 1.72 in Figure 6). For HDA, neighbors are observed at both the hard-core distance (r/a = 1) and the soft-core distance. The present results suggest that the presence of two scales in a pair interaction potential can be sufficient for a system to be a good glass former.

3.2. Pressure Dependence of the Glass Transition

In this system, the glass transition temperature, Tg, determined by differential scanning calorimetry, is weakly P-dependent, similar to the observation in metallic glasses. The line of Tg is continuous within either the LDL or HDL phases [43]. However, it shows a discontinuity as the LDL spinodal line is crossed (Figure 7). This interesting result can be used in experiments to test whether a liquid presents polyamorphism. For example, in some substances such as water, crystallization occurs just above Tg. In this case, isothermal compression of LDL into HDL cannot be performed at TTg since crystallization can occur. Thus, the presence of polyamorphism cannot be tested close to Tg by compression of LDL. In this cases, measuring Tg at different pressures and identifying a discontinuity would indicate that polyamorphism in the glass state extends above Tg to the liquid phase [92].

3.3. Density Minimum and Glass Transition

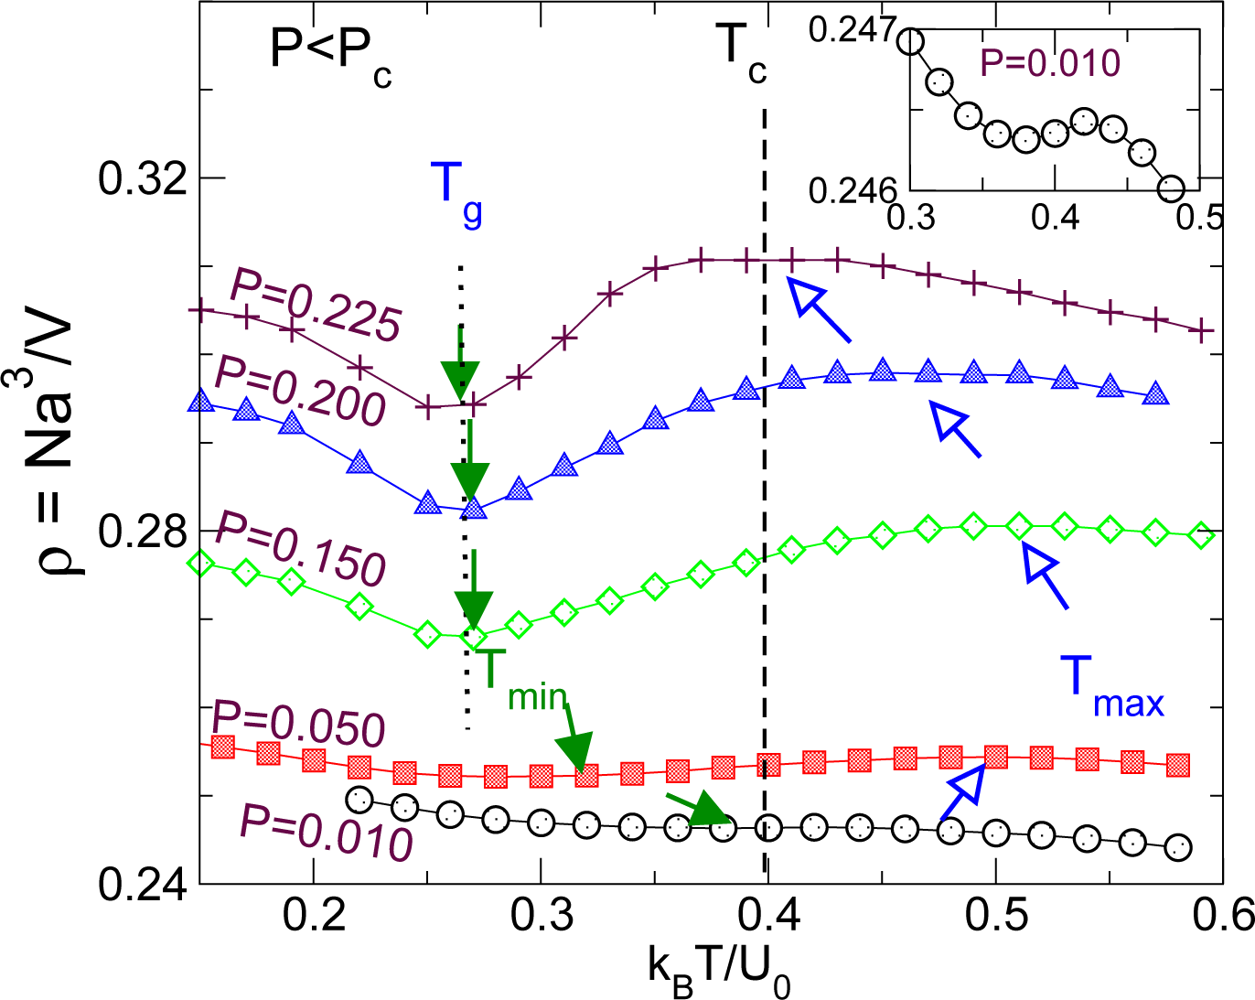
Another important question—especially relevant for liquids with density anomalies such as water, BeF2, Si, and SiO2—is how the anomalous thermal expansion behavior upon cooling below the temperature of maximum density Tmax in the supercooled liquid changes to “normal” behavior in the glass state. The display of a temperature of maximum density is a striking feature of the Jagla model, as described earlier [30,34,35]. What is more remarkable is the existence of the even rarer density minimum [43], which makes studies of the Jagla model useful for the understanding of the general relations between the density anomaly and LLPT. This feature, has been seen not only in experiment of confined water [26,27] and in simulation of bulk water [93,94] but also in supercooled Te, stable As2Te3 [95] and some Ge-Te alloys [96], and at the upper limit of experiments for BeF2 [89] and in silica [97]. In Reference[43], Xu et. al. showed how these features are unique to the low density polymorph and vary in a complex way with pressure. As shown in Figure 8, the density maximum is an equilibrium property, but the density minimum in the equilibrated liquid is only seen at the lowest pressures, in the temperature range between the Tg and the Tmax. At relatively higher pressures below the critical pressure Pc, the density minimum is preempted by the GT for the cooling rates applied. For slower cooling rates [43] the minimum would presumably continue to be seen as an equilibrium phenomenon.

4. Conclusions

In this review, we have discussed the phase transformations in the Jagla model, which was parametrized in order to show polyamorphism at high temperature in the equilibrium liquid phase. The presence of a LLCP results in a sharp increase in thermal (e.g., CP) and structural response functions upon cooling as the Widom line temperature TW is approached. Such a sharp increase in thermal response functions is anomalous (i.e., in normal liquids, CP decreases upon cooling) and is observed in few substances such as water [98]. It is therefore indeed reasonable to assert that the anomalous behavior of bulk water seen at normal and moderate pressures can be associated with the presence of a nearby LLCP and also helpful to look for comparable behavior in other systems.
Further, the Jagla model proves to have not only one but two very different liquids, which vitrify to different glasses upon cooling with rates common in computer simulations. These glasses are different amorphous forms both from the structural (e.g., their RDFs are distinct) and thermodynamics point of view (e.g., their Tg values are different). In particular, we observed that Tg is practically constant for each glass but it is larger for HDA than for LDA. Tg changes discontinuously (by ≈ 17%) as we go from LDA to HDA across the transition line. The study of the relation between LDA and HDA and the possible transformations between each other are relevant to understand polyamorphism in the glassy state [1,2].
Lastly, we note that the Jagla model was originally proposed to model water-like anomalous behaviors [3739,83]. However, with a different parametrization than that one used here, it might be a good candidate to model cerium. Cerium crystallizes into HCP at low pressure, as the Jagla model does, and Ce-Al alloys show polyamorphism in the glass state [19]. It will be interesting to see if the Jagla model can be parametrized to yield other properties particular to cerium, such as its isosymmetric crystal-crystal (FCC-FCC) transition [99]. It is then understandable that the glass formation in cerium-based alloys is only obtained with multiple component doping, or very rapid quenching, as reported in the recent literature [100].

Acknowledgments

XLM acknowledges the support by the World Premier International Research Center Initiative (WPI Initiative) and Grant-in-Aid for Young Scientists (B), MEXT, Japan. HES thanks NSF grant CHE 0908218 for support. SVB thanks the Office of the Academic Affairs of Yeshiva University for funding the Yeshiva University high-performance computer cluster and acknowledges the partial support of this research through the Bernard W. Gamson Computational Science Center at Yeshiva College.

References

  1. Wilding, MC; Wilson, M; Mcmillan, PF. Structural studies and polymorphism in amorphous solids and liquids at high pressure. Chem. Soc. Rev 2006, 35, 964–986. [Google Scholar]
  2. McMillan, PF. Polyamorphic transformations in liquids and glasses. J. Mat. Chem 2004, 14, 1506–1512. [Google Scholar]
  3. Angell, CA. Insights into phases of liquid water from study of its unusual glass-forming properties. Science 2008, 319, 582–587. [Google Scholar]
  4. Debenedetti, PG. Supercooled and glassy water. J. Phys. Condens. Mat 2003, 15, R1669–R1726. [Google Scholar]
  5. Angell, CA. Amorphous water. Ann. Rev. Phys. Chem 2004, 55, 559–583. [Google Scholar]
  6. Debenedetti, PG; Stanley, HE. Supercooled and glassy water. Phys. Today 2003, 56, 40–46. [Google Scholar]
  7. Mishima, O; Stanley, HE. The relationship between liquid, supercooled and glassy water. Nature 1998, 396, 329–335. [Google Scholar]
  8. Mishima, O; Calvert, LD; Whalley, E. An apparent first-order transition between two amorphous phases of ice induced by pressure. Nature 1985, 314, 76–78. [Google Scholar]
  9. Mishima, O; Calvert, LD; Whalley, E. Melting ice-I at 77K and 10kbar–A new method of making amorphous solids. Nature 1984, 310, 393–395. [Google Scholar]
  10. Mishima, O. Relationship between melting and amorphization of ice. Nature 1996, 384, 546–549. [Google Scholar]
  11. Loerting, T; Salzmann, C; Kohl, I; Mayer, E; Hallbrucker, A. A second distinct structural “state” of high-density amorphous ice at 77 K and 1 bar. Phys. Chem. Chem. Phys 2001, 3, 5355–5357. [Google Scholar]
  12. Finney, JL; Bowron, DT; Soper, AK; Loerting, T; Mayer, E; Hallbrucker, A. Structure of a new dense amorphous ice. Phys. Rev. Lett 2002, 89, 205503. [Google Scholar]
  13. New Kinds of Phase Transitions: Transformations in Disordered Substances; Brazhkin, V; Buldyrev, SV; Ryzhov, VN; Stanley, HE (Eds.) NATO Advanced Research Workshop: Brussels Belgium, 2002.
  14. Loerting, T; Brazhkin, VV; Morishita, T. Multiple amorphous-amorphous transitions. Adv. Chem. Phys 2009, 143, 29–82. [Google Scholar]
  15. Katayama, Y; Mizutani, T; Tsumi, K; Shinomura, O; Yamakata, M. A first-order liquid-liquid phase transition in phosphorus. Nature 2000, 403, 170–173. [Google Scholar]
  16. Monaco, G; Falconi, S; Crichton, WA; Mezouar, M. Nature of the first-order phase transition in fluid phosphorus at high temperature and pressure. Phys. Rev. Lett 2003, 90, 255701. [Google Scholar]
  17. Bhat, H; Molinero, V; Solomon, V; Soignard, E; Sastry, S; Yarger, JL; Angell, CA. Vitrification of a monatomic metallic liquid. Nature 2007, 448, 787–790. [Google Scholar]
  18. Kurita, R; Tanaka, H. Critical-like phenomena associated with liquid-liquid transition in a molecular liquid. Science 2004, 306, 845–848. [Google Scholar]
  19. Sheng, HW; Liu, HZ; Cheng, YQ; Wen, J; Lee, PL; Luo, WK; Shastri, SD; Ma, E. Polyamorphism in a metallic glass. Nat. Mater 2007, 6, 192–197. [Google Scholar]
  20. Sen, S; Gaudio, S; Aitken, BG; Lesher, CE. Observation of a pressure-induced first-order polyamorphic transition in a chalcogenide glass at ambient temperature. Phys. Rev. Lett 2006, 97, 025504. [Google Scholar]
  21. Poole, PH; Sciortino, F; Essmann, U; Stanley, HE. Phase-behavior of metastable water. Nature 1992, 360, 324–328. [Google Scholar]
  22. Zanotti, J-M; Bellissent-Funel, M-C; Chen, S-H. Experimental evidence of a liquid-liquid transition in interfacial water. Europhys. Lett 2005, 71, 91–97. [Google Scholar]
  23. Chen, S-H; Mallamace, F; Liu, L; Liu, DZ; Chu, XQ; Zhang, Y; Kim, C; Faraone, A; Mou, C-Y; Fratini, E; Baglioni, P; Kolesnikov, AI; Garcia-Sakai, V. Dynamic crossover phenomenon in confined supercooled water and its relation to the existence of a liquid-liquid critical point in water. Proceedings of 5th International Workshop on Complex Systems, Sendai, Japan, 25–28 September 2007.
  24. Liu, L; Chen, S-H; Faraone, A; Yen, CW; Mou, CY. Pressure dependence of fragile-to-strong transition and a possible second critical point in supercooled confined water. Phys. Rev. Lett 2005, 95, 117802. [Google Scholar]
  25. Chen, S-H; Mallamace, F; Mou, CY; Broccio, M; Corsaro, C; Faraone, A; Liu, L. The violation of the Stokes-Einstein relation in supercooled water. Proc. Nat. Acad. Sci. USA 2006, 103, 12974–12978. [Google Scholar]
  26. Mallamace, F; Broccio, M; Corsaro, C; Faraone, A; Majolino, D; Venuti, V; Liu, L; Mou, CY; Chen, S-H. Evidence of the existence of the low-density liquid phase in supercooled, confined water. Proc. Natl. Acad. Sci. USA 2007, 104, 18387–18391. [Google Scholar]
  27. Liu, DZ; Zhang, Y; Chen, CC; Mou, CY; Poole, PH; Chen, S-H. Observation of the density minimum in deeply supercooled confined water. Proc. Natl. Acad. Sci. USA 2007, 104, 9570–9574. [Google Scholar]
  28. Mallamace, F; Corsaro, C; Broccio, M; Branca, C; Gonzalez-Segredo, N; Spooren, J; Chen, S-H; Stanley, HE. NMR evidence of a sharp change in a measure of local order in deeply supercooled confined water. Proc. Natl. Acad. Sci. USA 2008, 105, 12725–12729. [Google Scholar]
  29. Chen, S-H; Liu, L; Chu, X; Zhang, Y; Fratini, E; Baglioni, P; Faraone, A; Mamontov, E. Experimental evidence of fragile-to-strong dynamic crossover in DNA hydration water. J. Chem. Phys 2006, 125, 171103. [Google Scholar]
  30. Xu, L; Kumar, P; Buldyrev, SV; Chen, S-H; Poole, PH; Sciortino, F; Stanley, HE. Relation between the Widom line and the dynamic crossover in systems with a liquid-liquid phase transition. Proc. Natl. Acad. Sci. USA 2006, 102, 16558–16562. [Google Scholar]
  31. Sastry, S; Angell, CA. Liquid-liquid phase transition in supercooled silicon. Nat. Mater 2003, 2, 739–743. [Google Scholar]
  32. Morishita, T. Liquid-liquid phase transitions of phosphorus via constant-pressure first-principles molecular dynamics simulations. Phys. Rev. Lett 2001, 87, 105701. [Google Scholar]
  33. Saika-Voivod, I; Poole, PH; Sciortino, F. Fragile-to-strong transition and polyamorphism in the energy landscape of liquid silica. Nature 2001, 412, 514–517. [Google Scholar]
  34. Xu, L; Buldyrev, SV; Angell, CA; Stanley, HE. Thermodynamics and dynamics of the two-scale spherically symmetric Jagla ramp model of anomalous liquids. Phys. Rev. E 2006, 74, 031108. [Google Scholar]
  35. Xu, L; Buldyrev, SV; Stanley, HE. Relationship between the liquid-liquid phase transition and dynamic behaviour in the Jagla model. J. Phys. Condens. Mat 2006, 18, S2239–S2246. [Google Scholar]
  36. Xu, L; Mallamace, F; Yan, ZY; Starr, FW; Buldyrev, SV; Stanley, HE. Appearance of a fractional Stokes-Einstein relation in water and a structural interpretation of its onset. Nat. Phys 2009, 5, 565–569. [Google Scholar]
  37. Jagla, EA. Core-softened potentials and the anomalous properties of water. J. Chem. Phys 1999, 111, 8980–8986. [Google Scholar]
  38. Jagla, EA. A model for the fragile-to-strong transition in water. J. Phys. Cond. Matt 1999, 11, 10251–10258. [Google Scholar]
  39. Jagla, EA. Liquid-liquid equilibrium for monodisperse spherical particles. Phys. Rev. E 2001, 63, 061509. [Google Scholar]
  40. Gibson, HM; Wilding, NB. Metastable liquid-liquid coexistence and density anomalies in a core-softened fluid. Phys. Rev. E 2006, 73, 061507. [Google Scholar]
  41. Buldyrev, SV; Kumar, P; Debenedetti, PG; Rossky, PJ; Stanley, HE. Water-like solvation thermodynamics in a spherically symmetric solvent model with two characteristic lengths. Proc. Natl. Acad. Sci. USA 2007, 104, 20177–20182. [Google Scholar]
  42. Lomba, E; Almarza, NG; Martin, C; McBride, C. Phase behavior of attractive and repulsive ramp fluids: Integral equation and computer simulation studies. J. Chem. Phys 2007, 126, 244510. [Google Scholar]
  43. Xu, L; Buldyrev, SV; Giovambattista, N; Angell, CA; Stanley, HE. A monatomic system with a liquid-liquid critical point and two distinct glassy states. J. Chem. Phys 2009, 130, 054505. [Google Scholar]
  44. Franzese, G; Malescio, G; Skibinsky, A; Buldyrev, SV; Stanley, HE. Generic mechanism for generating a liquid-liquid phase transition. Nature 2001, 409, 692–695. [Google Scholar]
  45. Malescio, G; Franzese, G; Pellicane, G; Skibinsky, A; Buldyrev, SV; Stanley, HE. Liquid-liquid phase transition in one-component fluids. J. Phys. Condens. Mat 2002, 14, 2193–2200. [Google Scholar]
  46. Franzese, G; Malescio, G; Skibinsky, A; Buldyrev, SV; Stanley, HE. Metastable liquid-liquid phase transition in a single-component system with only one crystal phase and no density anomaly. Phys. Rev. E 2002, 66, 051206. [Google Scholar]
  47. Skibinsky, A; Buldyrev, SV; Franzese, G; Malescio, G; Stanley, HE. Liquid-liquid phase transitions for soft-core attractive potentials. Phys. Rev. E 2004, 69, 061206. [Google Scholar]
  48. Malescio, G; Franzese, G; Skibinsky, A; Buldyrev, SV; Stanley, HE. Liquid-liquid phase transition for an attractive isotropic potential with wide repulsive range. Phys. Rev. E 2005, 71, 061504. [Google Scholar]
  49. Stell, G; Hemmer, PC. Phase-transitions due to softness of potential core. J. Chem. Phys 1972, 56, 4274–4286. [Google Scholar]
  50. Sadr-Lahijany, MR; Scala, A; Buldyrev, SV; Stanley, HE. Liquid-state anomalies and the stell-hemmer core-softened potential. Phys. Rev. Lett 1998, 81, 4895–4898. [Google Scholar]
  51. Scala, A; Sadr-Lahijany, MR; Giovambattista, N; Buldyrev, SV; Stanley, HE. Waterlike anomalies for core-softened models of fluids: Two-dimensional systems. Phys. Rev. E 2001, 63, 041202. [Google Scholar]
  52. Scala, A; Sadr-Lahijany, MR; Giovambattista, N; Buldyrev, SV; Stanley, HE. Applications of the Stell-Hemmer potential to understanding second critical points in real systems. J. Stat. Phys 2000, 100, 97–106. [Google Scholar]
  53. Greaves, GN; Wilding, MC; Fearn, S; Langstaff, D; Kargl, F; Cox, S; Vu Van, Q; Majrus, O; Benmore, CJ; Weber, R; Martin, CM; Hennet, L. Detection of First-Order Liquid/Liquid Phase Transitions in Yttrium Oxide-Aluminum Oxide Melts. Science 2008, 322, 566–570. [Google Scholar]
  54. Bellissent-Funel, M-C. Hydration Processes in Biology: Theoretical and Experimental Approaches; ISO Press: Amsterdam, The Netherlands, 1999. [Google Scholar]
  55. Robinson, GW; Zhu, S-B; Singh, S; Evans, MW. Water in Biology, Chemistry, and Physics: Experimental Overviews and Computational Methodologies; World Scientific: Singerpore, 1996. [Google Scholar]
  56. Workshop on “Water”: Structure and Dynamics of Water and Aqueous Solutions—Anomalies and their Possible Implications in Biology; Institute Laue Langevin: Grenoble, France, 1984.
  57. Debenedetti, PG. Metastable Liquids: Concepts and Principles; Princeton University Press: Princeton, NJ, USA, 1996. [Google Scholar]
  58. Angell, CA; Shuppert, J; Tucker, JC. Anomalous properties of supercooled water-heat-capacity, expansivity, and proton magnetic-response chemical-shit from 0 to −38 degrees. J. Phys. Chem 1973, 77, 3092–3099. [Google Scholar]
  59. Speedy, RJ; Angell, CA. Isothermal compressibility of supercooled water and evidence for a thermodynamic singularity at −45 degrees. J. Chem. Phys 1976, 65, 851–858. [Google Scholar]
  60. Maruyama, S; Wakabayashi, K; Oguni, M. Cp Maximum at 233 K for the Water within Silica Nanopores. AIP Conf. Proc 2004, 708, 675–676. [Google Scholar]
  61. Bergman, R; Swenson, J. Dynamics of supercooled water in confined geometry. Nature 2000, 403, 283–286. [Google Scholar]
  62. Faraone, A; Liu, L; Mou, C-Y; Yen, C-W; Chen, S-H. Fragile-to-strong liquid transition in deeply supercooled confined water. J. Chem. Phys 2004, 121, 10843–10846. [Google Scholar]
  63. Ito, K; Moynihan, CT; Angell, CA. Thermodynamic determination of fragility in liquids and a fragile-to-strong liquid transition in water. Nature 1999, 398, 492–495. [Google Scholar]
  64. Starr, FW; Angell, CA; Stanley, HE. Prediction of entropy and dynamic properties of water below the homogeneous nucleation temperature. Physica A 2003, 323, 51–66. [Google Scholar]
  65. Poole, PH; Sciortino, F; Grande, T; Stanley, HE; Angell, CA. Effect of hydrogen-bonds on the thermodynamic behavior of liquid water. Phys. Rev. Lett 1994, 73, 1632. [Google Scholar]
  66. Angell, CA. Water- It is a strong liquid. J. Phys. Chem 1993, 97, 6339–6341. [Google Scholar]
  67. Smith, RS; Kay, BD. The Existence of Supercooled Liquid Water at 150 K. Nature 1999, 398, 788–791. [Google Scholar]
  68. Smith, RS; Dohnalek, Z; Kimmel, GA; Stevenson, KP; Kay, BD. The Self-diffusivity of Amorphous Solid Water Near 150 K. Chem. Phys 2000, 258, 291–305. [Google Scholar]
  69. Velikov, V; Borick, S; Angell, CA. The glass transition of water, based on hyperquenching experiments. Science 2001, 294, 2335–2338. [Google Scholar]
  70. Johari, GP. Calorimetric features of high-enthalpy amorphous solids and glass-softening temperature of water. J. Chem. Phys. B 2003, 107, 9063–9070. [Google Scholar]
  71. Mayer, E. Water behaviour—Glass transition in hyperquenched water. Nature 2005, 435, E1. [Google Scholar]
  72. Stokely, K; Mazza, MG; Stanley, HE; Franzese, G. Effect of Hydrogen Bond Cooperativity on the Behavior of Water. Proc. Natl. Acad. Sci. USA 2010, 107, 1301–1306. [Google Scholar]
  73. Sastry, S; Debenedetti, PG; Sciortino, F; Stanley, HE. Singularity-Free Interpretation of the Thermodynamics of Supercooled Water. Phys. Rev. E 1996, 53, 6144–6154. [Google Scholar]
  74. Stanley, HE. A Polychromatic Correlated-Site Percolation Problem with Possible Relevance to the Unusual behavior of Supercooled H2O and D2O. J. Phys. A 1979, 12, L329–L337. [Google Scholar]
  75. Stanley, HE; Teixeira, J. Interpretation of The Unusual Behavior of H2O and D2O at Low Temperatures: Tests of a Percolation Model. J. Chem. Phys 1980, 73, 3404–3422. [Google Scholar]
  76. Poole, PH; Sciortino, F; Essmann, U; Stanley, HE. Spinodal of liquid water. Phys. Rev. E 1993, 48, 3799–3817. [Google Scholar]
  77. Poole, PH; Essmann, U; Sciortino, F; Stanley, HE. Phase-diagram for amorphous solid water. Phys. Rev. E 1993, 48, 4605–4610. [Google Scholar]
  78. Sciortino, F; Poole, PH; Essmann, U; Stanley, HE. Line of compressibility maxima in the phase diagram of supercooled water. Phys. Rev. E 1997, 55, 727–737. [Google Scholar]
  79. Anisimov, MA; Sengers, JV; Levelt Sengers, JMH. Aqueous System at Elevated Temperatures and Pressures: Physical Chemistry in Water, Stream and Hydrothermal Solutions; Palmer, DA, Fernandez-Prini, R, Harvey, AH, Eds.; Elsevier: Amsterdam, The Netherlands, 2004. [Google Scholar]
  80. Levelt, JMH. Measurements of the Compressibility of Argon in the Gaseous and Liquid Phase, PhD Thesis, University of Amsterdam: Amsterdam, The Netherlands,. 1958.
  81. Michels, A; Levelt, JMH; Wolkers, G. Thermodynamic properties of argon at temperatures between 0 °C and −140 °C and at densities up to 640 amagat (pressures up to 1050 atmospheres). Physica 1958, 24, 769–794. [Google Scholar]
  82. Michels, A; Levelt, JMH; de Graaff, W. Compressibility isotherms of argon at temperatures between −25 °C and −155 °C, and at densities up to 640 amagat (pressures up to 1050 atmospheres). Physica 1958, 24, 659–671. [Google Scholar]
  83. Yan, ZY; Buldyrev, SV; Stanley, HE. Structural order for one-scale and two-scale potentials. Phys. Rev. Lett 2005, 95, 130604. [Google Scholar]
  84. Yan, ZY; Buldyrev, SV; Giovambattista, N; Debenedetti, PG; Stanley, HE. A family of tunable spherically-symmetric potentials that span the range from hard spheres to waterlike behavior. Phys. Rev. E 2006, 73, 051204. [Google Scholar]
  85. Yan, ZY; Buldyrev, SV; Kumar, P; Giovambattista, N; Debenedetti, PG; Stanley, HE. Structure of the first- and second-neighbor shells of simulated water: Quantitative relation to translational and orientational order. Phys. Rev. E 2007, 76, 051201. [Google Scholar]
  86. Yan, ZY; Buldyrev, SV; Kumar, P; Giovambattista, N; Stanley, HE. Correspondence between phase diagrams of the TIP5P water model and a spherically symmetric repulsive ramp potential with two characteristic length scales. Phys. Rev. E 2008, 77, 042201. [Google Scholar]
  87. Yan, ZY; Buldyrev, SV; Stanley, HE. Relation of water anomalies to the excess entropy. Phys Rev E 2008, 78, 051201. [Google Scholar]
  88. Errington, JR; Debenedetti, PG. Relationship between structural order and the anomalies of liquid water. Nature 2001, 409, 318–321. [Google Scholar]
  89. Hemmati, M; Moynihan, CT; Angell, CA. Interpretation of the molten BeF2 viscosity anomaly in terms of a high temperature density maximum, and other waterlike features. J. Chem. Phys 2001, 115, 6663–6671. [Google Scholar]
  90. Corradini, D; Buldyrev, SV; Gallo, P; Stanley, HE. Effect of hydrophobic solutes on the liquid-liquid critical point. Phys. Rev. E 2010, 81, 061504. [Google Scholar]
  91. Molinero, V; Sastry, S; Angell, CA. Tuning of tetrahedrality in a silicon potential yields a series of monatomic (metal-like) glass formers of very high fragility. Phys. Rev. Lett 2006, 97, 075701. [Google Scholar]
  92. Loerting, T; Giovambattista, N. Amorphous ices: Experiments and numerical simulations. J. Phys. Condens. Matter 2006, 18, R919–R977. [Google Scholar]
  93. Poole, PH; Saika-Voivod, I; Sciortino, F. Density minimum and liquid-liquid phase transition. J. Phys. Condens. Matter 2005, 17, L431–L437. [Google Scholar]
  94. Paschek, D. How the Liquid-Liquid Transition Affects Hydrophobic Hydration in Deeply Supercooled Water. Phys. Rev. Lett 2005, 94, 217802. [Google Scholar]
  95. Tver’yanovich, LS; Ushakov, VM; Tverjanovich, A. Heat of structural transformation at the semiconductor-metal transition in As2Te3 liquid. J. Non-Cryst. Solids 1996, 197, 235–237. [Google Scholar]
  96. Tsuchiya, Y. The molar volume of molten As-Sb, As-Bi and As-Te systems: further evidence for rapid structural changes in liquid As in the supercooled state. J. Non-Cryst. Solids 1999, 250, 473–477. [Google Scholar]
  97. Sen, S; Andrus, RL; Baker, DE; Murtagh, MT. Observation of an Anomalous Density Minimum in Vitreous Silica. Phys. Rev. Lett 2004, 93, 125902. [Google Scholar]
  98. Oguni, M; Angell, CA. Anomalous components of supercooled water expansivity, compressibility, and heat-capacity (CP and Cv) from binary formamide+water solution studies. J. Chem. Phys 1983, 78, 7334–7342. [Google Scholar]
  99. Aptekar, IL; Ponyatovskii, YG. Theory of cerium isomorphism .I. Equilibrium PT phase diagram. Phys. Met. Metall 1968, 25, 10. [Google Scholar]
  100. Zhang, B; Wang, RJ; Wang, WH. Response of acoustic and elastic properties to pressure and crystallization of Ce-based bulk metallic glass. Phys. Rev. B 2005, 72, 104205. [Google Scholar]
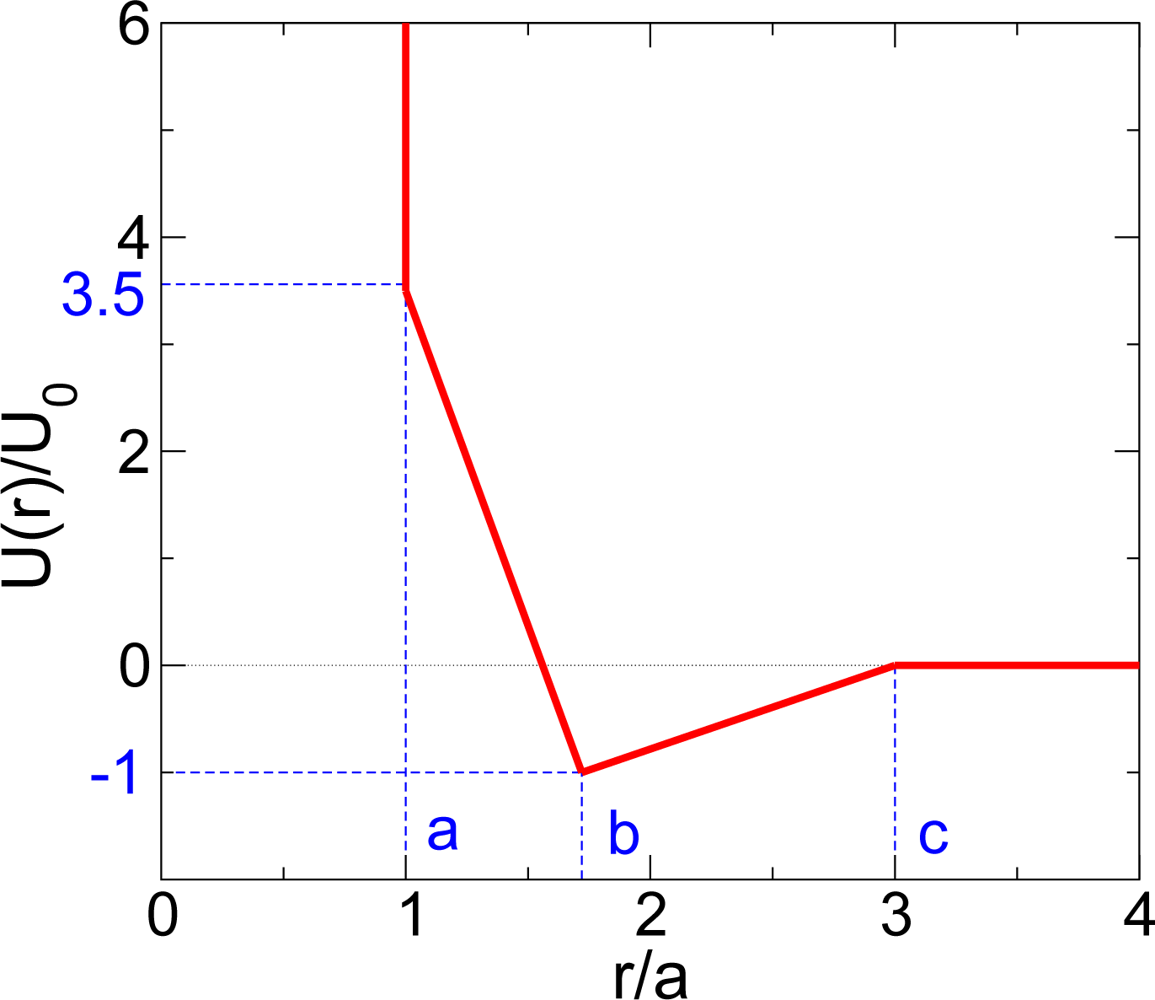
Figure 1. The spherically-symmetric “two-scale” Jagla ramp potential. The two length scales of the Jagla potential are the hard core diameter r = a and the soft core diameter r = b. Here we treat the case with UR = 3.56U0, b = 1.72a, and a long range cutoff c = 3a.
Ijms 11 05184f1
Figure 2. Sketch of the Jagla potential PT phase diagram [30]. The low-density liquid (LDL) and high density liquid (HDL) phases are separated by a first order transition line (dashed line), terminating at a critical point at Pc = 0.243 and Tc = 0.373. The Widom line TW indicates the locus of maxima in the correlation length that occurs in supercritical region (T > Tc and P > Pc). Studies in this work are along three different kinds of paths: (i) for P > Pc, path α in the one phase region, (ii) for P < Pc, path β in LDL phase, and (iii) for P < Pc, path γ in HDL phase.
Ijms 11 05184f2
Figure 3. (Color online) Response functions for the Jagla ramp model as function of temperature for different values of P > Pc (Figure 2, path α) and P < Pc (Figure 2, path β). (a) Constant pressure specific heat CP and (b) isothermal compressibility KT. Both CP and KT have maxima, as is known to occur experimentally for the liquid-gas critical point [79] and for the LLCP [60]. For large P the peaks become less pronounced and shift to higher temperature as the Widom line has positive slope. Adapted from Reference [34].
Ijms 11 05184f3
Figure 4. Structural changes upon crossing the Widom line region. The translational order parameter t (a) and the orientational order parameter Q6 (b). There is a sharp change in t and Q6 occurs as the system crosses the Widom line. These sharp changes in t and Q6 becomes more pronounced as the path is closer to the critical pressure. Adapted from Reference [34].
Ijms 11 05184f4
Figure 5. Dynamic behavior for Jagla ramp potential. The T-dependence of the diffusivity D along constant pressure paths: (i) P < Pc for path β (LDL) and path γ (HDL), and (ii) P > Pc for path α. Along path β, the liquid remains in LDL phase due to metastability, and its diffusivity follows a Vogel-Fuchler-Tamann (VFT) fit, indicating a fragile liquid. Along path γ in the HDL phase, the liquid is strong, indicated by the temperature independent activation energy. For the path above the critical point, the system shows a crossover upon crossing the Widom line, from LDL-like at high temperature to HDL-like at low temperature side. The dashed line is a Vogel-Fulcher-Tamann fit. Adapted from Reference [34] with a correction of normalization factor of 600 in the value of D by Corradini et. al [90].
Ijms 11 05184f5
Figure 6. Illustration of the structural difference of the low density amorphous (LDA) solid and the high density amorphous (HDA) solid by the radial distribution function g(r). For LDA, there are more particles sitting near the soft-core distance; while for HDA, particles shift from the soft core distance (r/a = 1.72) to the hard core distance (r/a = 1.0), so the peak at r/a = 1.72 decreases while the peak at r/a = 1.0 increases. Adapted from Reference [43].
Ijms 11 05184f6
Figure 7. Phase diagram in liquids and glass states. The HDL and LDL have different glass transition temperatures, clearly indicating two types of glasses in system with liquid-liquid phase transition.
Ijms 11 05184f7
Figure 8. Demonstration of density minimum is affected by the glass transition along path β below Pc. For low pressures the temperature of minimum density is located in ergodic region, approaching to the temperature of maximum density (see inset). For relative high pressures below Pc, the density minima are preempted by glass transition, indicated by the same location of the density minimum along different β paths. Adapted from Reference [43].
Ijms 11 05184f8