1. Introduction
Whole genome sequences are generally accepted as excellent tools for studying evolutionary relationships [
1]. Traditional distance methods with multiple alignment or various sequence evolutionary models for phylogenetic analysis are not directly applicable to the analysis of complete genomes.
A number of methods without sequence alignment for deriving species phylogeny based on overall similarities of complete genomes have been developed. These include fractal analysis [
2–
4], dynamical language model [
5], information-based analysis [
6–
8], log-correlation distance and Fourier transformation with Kullback-Leibler divergence distance [
9], Markov model [
10–
15], principal component analysis [
16] and singular value decomposition (SVD) [
17–
19]. The analyses based on the Markov model and dynamical language model without sequence alignment using 103 prokaryotes and 6 eukaryotes have yielded trees separating the three domains of life, Archaea, Eubacteria and Eukarya, with the relationships among the taxa consistent with those based on traditional analyses [
5,
11]. These two methods were also used to analyze the complete chloroplast genomes [
5,
12]. The SVD method was used to analyze mitochondrial genomes of 64 selected vertebrates [
19]. A correlation-distance method without removing the random background (similar to [
7]) was used to analyze rRNA gene sequences as DNA barcodes [
20].
In the above approaches of SVD, Markov model and dynamical language model, there is a step to calculate the correlation-related distance between two genomes after removing the randomness or noise from the composition vectors. A drawback is that these correlation-related distances are not proper distance metrics in the strict mathematical sense (Professor Bailin Hao, personal communication, 2009; see also [
21]). There are some ways to overcome this problem. One way is to change the concept of distance to that of dissimilarity proposed by Xu and Hao [
15] in the Markov model approach. Another way is to replace a pseudo-distance by a proper distance metric, which requires that the results are not worsened from the biological point of view. In the first way, there is no widely accepted mathematical definition for the concept of dissimilarity or similarity. Chen
et al. [
22] defined a similarity metric, but unfortunately the sample correlation between two vectors in a vector space does not yield a proper similarity under their definition.
In this paper, we follow the second way and propose two proper correlation-related distance metrics to replace the pseudo-distance in the dynamical language approach used by Yu
et al. [
5]. We then evaluate the effects of this replacement on the analysis of a wide range of complete genomes from the biological point of view.
2. Dynamical Language Approach for Phylogenetic Analysis
Three kinds of data from the complete genomes can be analysed using the dynamical language approach proposed by Yu
et al. [
5]. They are the whole DNA sequences (including protein-coding and non-coding regions), all protein-coding DNA sequences and the amino acid sequences of all protein-coding genes. We outline this approach here.
There are a total of N = 4K (for DNA sequences) or 20K (for protein sequences) possible types of K-strings, that is, the strings with fixed length K. We denote the length of a DNA or protein sequence as L. Then a window of length K is used to slide through the sequences by shifting one position at a time to determine the frequencies of each of the N kinds of K-strings in this sequence. We define p(α1α2...αK) = n(α1α2...αK) / (L – K + 1) as the observed frequency of a K -string α1α2...αK, where n(α1α2...αK) is the number of times that α1α2...αK appears in this sequence. For the DNA or amino acid sequences of the protein-coding genes, denoting by m the number of protein-coding genes from each complete genome, we define
as the observed frequency of a K-string α1α2...αK; here nj (α1α2...αK) means the number of times that α1α2...αK appears in the jth protein-coding DNA sequence or protein sequence, and Lj the length of the jth sequence in this complete genome. Then we can form a composition vector for a genome using p(α1α2...αK) as components for all possible K-strings α1α2...αK. We use pi to denote the i-th component corresponding to the string type i, i = 1,…,N (N strings are arranged in a fixed order as the alphabetical order). In this way we construct a composition vector p = (p1, p2,..., pN) for a genome.
Yu
et al. [
5] considered an idea from the theory of dynamical language [
23] that a
K-string
s1s2...
sK is possibly constructed by adding a letter
sK to the end of the (
K – 1) -string
s1s2...
sK–1 or a letter
s1 to the beginning of the (
K – 1) -string
s2s3...
sK. After counting the observed frequencies for all strings of length (
K – 1) and the four or 20 kinds of letters, the expected frequency of appearance of
K-strings is predicted by:
where
p(
s1) and
p(
sK) are frequencies of nucleotides or amino acids
s1 and
sK appearing in this genome. Then
q(
s1s2...
sK) of all 4
K or 20
K kinds of
K-strings is viewed as the noise background. We then subtract the noise background before performing a cross-correlation analysis through defining:
The transformation X = (p / q) – 1 has the desired effect of subtraction of random background in p and rendering it a stationary time series suitable for subsequent cross-correlation analysis.
Then we use X (s1s2...sK) for all possible K-strings s1s2...sK as components and arrange according to a fixed alphabetical order all the K-strings to form a composition vector X = (X1, X2,..., XN) for genome X, and likewise Y = (Y1, Y2,...,YN) for genome Y.
Then we view the
N components in the vectors
X and
Y as samples of two random variables respectively. The sample correlation
C(
X,
Y) between any two genomes
X and
Y is defined in the usual way in probability theory as:
The distance
Dr (
X,
Y) between the two genomes is then defined by
Dr (
X,
Y) = (1 –
C(
X,
Y)) / 2. A distance matrix for all the genomes under study is then generated for the construction of phylogenetic trees. This distance method to construct phylogenetic tree is referred to as the
dynamical language model method [
5]. Finally, we construct all trees using the neighbour-joining (NJ) method [
24] in the software
SplitsTree4 V4.10 [
25] or in the
Molecular Evolutionary Genetics Analysis software (MEGA 4) [
26] based on the distance matrices.
To determine a best length of strings (
K) in our model, we plot the mean value of X over all
K-strings from a genome (whole DNA sequences or protein sequences) as a function of
K (see
Figure 1 for examples from our data). The mean value of
X starts to approach zero at
K = 6 or 7 if we use protein sequences from genome and at
K = 11 or 12 if we use whole DNA sequence. The mean value of
X being close to zero means that the value of
p (from the sequence) is almost equal to value of
q (from the model). Hence these
K values are suitable for phylogeny reconstruction using our approach. This result is also confirmed later in this paper from a biological point of view.
3. Proper Distance Metrics in Vector Spaces
Each genome can be considered as a point in N = 4K (for DNA sequences) or 20K (for protein sequences) dimensional space represented by its composition vector X = (X1, X2,..., XN).
A function
D(
X,
Y) between two vectors
X and
Y is said to be a distance metric if it satisfies the following properties:
D(X, Y) ≥ 0; and D(X, Y) = 0 if and only if X = Y;
D(X, Y) = D(Y, X);
D(X, Z) ≤ D(X, Y) + D(Y, Z) for any X, Y and Z.
The inequality (iii) is called the triangle inequality. A distance metric D(X, Y) is said to be normalized if 0 ≤ D(X, Y) ≤ 1 for any X and Y.
If we denote:
where |
X| and |
Y| are the lengths of the vectors
X and
Y respectively, then
Xu and
Yu are unit vectors (
i.e., have length 1). Let
θ be the angle between two vectors of
X and
Y. It is well known that
C(
Xu,
Yu) = cos
θ.
The distance defined by
Dr (
X,
Y) = (1 –
C(
X,
Y)) / 2 is not a proper distance metric because it does not satisfy condition (i) (except for unit vectors) and the triangle inequality (iii) [
21]. In the following we describe two proper distance metrics related to the sample correlation.
3.1. Chord Distance
The chord distance is defined on the set of unit vectors in a vector space as the length of the chord constructed from two unit vectors. Mathematically, let
Xu = (
Xu1,
Xu2,…,
XuN) and
Yu = (
Yu1,
Yu2,…,
YuN) be two unit vectors; then the chord distance
Dchord (
Xu,
Yu)is defined as:
It is seen that
Dchord (
Xu,
Yu) = 0 if and only if
C(
Xu,
Yu) = 1,
i.e., cos
θ(
Xu,
Yu) = 1, which implies that
θ(
Xu,
Yu) = 0 because the angle
θ(
Xu,
Yu) between the two vectors
Xu and
Yu is in [0,
π]. This result means that the two vectors
Xu and
Yu are identical. It is obvious that
Dchord (
Xu,
Yu) =
Dchord (
Yu,
Xu). Because the three chords constructed by the pairs
Xu and
Yu,
Xu and
Zu,
Yu and
Zu are the three edges of a triangle, and the sum of the lengths of any two edges of a triangle is larger or equal to the length of the third edge, the triangle inequality of the chord distance follows. Hence the chord distance is a proper distance metric in the strict mathematical sense. The chord distance
Dchord (
Xu,
Yu) can be normalized by
. This distance is also called Cavalli-Sforza chord distance [
27] or described on pp. 163–166 of [
28]. This distance performed well in simulations of tree-building algorithms by Takezaki and Nei [
29]. It has also been used to analyze microarray gene expression data [
30].
3.2. Piecewise Distance
This distance metric is also defined on the set of unit vectors in a vector space. For any two unit vectors
Xu and
Yu, we define:
where
ρ is any positive real number which is not smaller than 3. We call
Dpiecewise (
Xu,
Yu) the
piecewise distance.
By definition, Dpiecewise (Xu, Yu) = 0 if and only if C(Xu, Yu) = 1, which means that the two vectors Xu and Yu are identical as shown above. It is also obvious that Dpiecewise (Xu, Yu) = Dpiecewise (Yu, Xu). Using the facts ρ ≥ 3, −1 ≤ C(Xu, Yu) ≤ 1 for any two unit vectors and Dpiecewise (Xu, Yu) + Dpiecewise (Yu, Zu) – Dpiecewise (Xu, Zu) = [ρ + C(Xu, Yu) + C(Yu, Zu) –C(Xu, Zu)]/ρ ≥ 0, we get the triangle inequality for the piecewise distance. Hence the piecewise distance is a proper distance metric in the strict mathematical sense. The piecewise distance Dpiecewise (Xu, Yu) can be normalized by
. Usually we may take ρ = 3.
4. Evaluation of the Proposed Distance Metrics from the Biological Point of View
We propose to replace the pseudo-distance in the dynamical language approach [
5] by the chord distance or piecewise distance. We need to examine the effects of this replacement from the biological point of view. In order to do this, we evaluate the new distance metrics on four datasets, namely
Dataset 1 of 109 complete genomes of prokaryotes and eukaryotes used in [
11],
Dataset 2 of 34 prokaryote and chloroplast genomes used in [
12],
Dataset 3 of mitochondrial genomes of 64 selected vertebrates used in [
19], and
Dataset 4 of 62 complete genomes of alpha-proteobacteria used in [
31]. (
Note: Chan
et al. [
21] recently tested the chord distance with different denoising formulas on Dataset 2).
We used the dynamical language approach for Datasets 1 and 2 in [
5] and Dataset 3 in [
32]. Some biological comparisons of this approach with the Markov model approach on Datasets 1 and 2 were given in [
5]. Recently we found that wrong data of the Archaea Crenarchaeota bacterium
Pyrobaculum aerophilum (Pyrae) from Dataset 1 was used in [
5]. Using the right genome data,
Pyrobaculum aerophilum (Pyrae) groups with the other Archaea Crenarchaeota bacteria correctly (when we use the amino acid sequences of all protein-coding genes from genomes and
K = 6). After this correction, the resulting tree is better than the one in [
11] from the biological point of view, with all firmicutes group together and the other branches are similar. For Dataset 2, we obtained two trees with the same topology to those using the dynamical language approach in [
5] and the Markov model approach in [
12] (also using the amino acid sequences of all protein-coding genes from genomes and
K = 6). For Dataset 3, we reported in [
32] a good tree in agreement with the current understanding of the phylogeny of vertebrates revealed by the traditional approaches using the dynamical language approach (based on the whole DNA sequences of genomes and
K = 11). This tree is better than the one in [
19] and the one obtained by the Markov model approach. Hence we just need to compare the best trees obtained by the dynamical language approach using the two proper distance metrics with the best trees obtained from the pseudo-distance in [
5] based on the first three datasets. In 2009, Guyon
et al. [
31] compared four alignment free string distances for complete genome phylogeny using Dataset 4. We will compare our method in this paper with the results in [
31] based on Dataset 4.
The whole DNA sequences (including protein-coding and non-coding regions), all protein-coding DNA sequences and the amino acid sequences of all protein-coding genes from genome data are used for phylogenetic analysis. For
Dataset 1, we have seen that amino acid sequences of all protein-coding genes from genomes give better results than those given by the whole DNA sequences and all protein-coding DNA sequences. We evaluated the dynamical language approach with chord distance and piecewise distance on the amino acid sequences of all protein-coding genes from genomes for
K = 3, 4, 5 and 6. We find the trees using the new distance metrics have the same topology as the trees using the old “distance” for the same value of
K, and the trees for
K = 6 are the best. Here we present the tree for
K = 6 using dynamical language approach with chord distance in
Figure 2. The phylogeny shown in
Figure 2 supports the broad division into three domains and agrees with the tree of life based on 16S rRNA in a majority of basic branches. For further biological discussions, one can refer to [
5] with the correction for the position of
Pyrobaculum aerophilum (Pyrae).
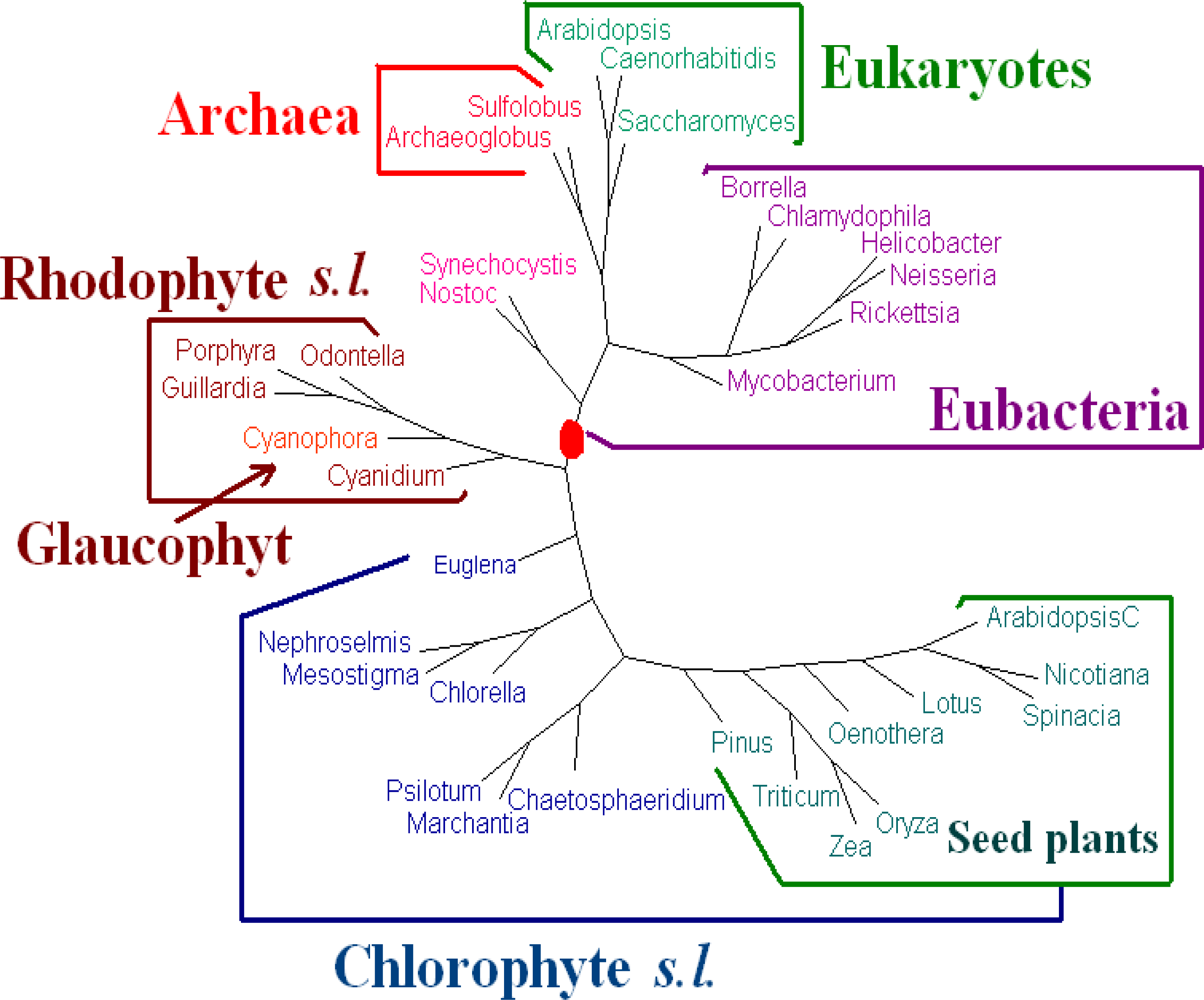
For
Dataset 2, we have seen that the amino acid sequences of all protein-coding genes from genomes give better results than those given by the whole DNA sequences and all protein-coding DNA sequences. We evaluated the dynamical language approach with chord distance and piecewise distance on the amino acid sequences of all protein-coding genes from genomes for
K = 3, 4, 5 and 6. We find the tree using the piecewise distance has the same topology as the tree using the old “distance” for the same value of
K, the tree using the chord distance has similar topology (a little bit worse because
Pinus thunbergii is separated from its correct position) to the tree using the old “distance” for the same value of
K. And the trees of
K = 6 are the best. Hence we present the tree for
K = 6 using the dynamical language approach with piecewise distance (
ρ = 3) in
Figure 3. We also note that the topology of the tree in
Figure 3 is the same as that of the tree obtained by the Markov model in [
12]). The phylogeny of
Figure 3 shows that the chloroplast genomes are separated to two major clades corresponding to chlorophytes
s.l. and rhodophytes
s.l. The interrelationships among the chloroplasts are largely in agreement with the current understanding on chloroplast evolution. For further biological discussions, one can refer to [
12].
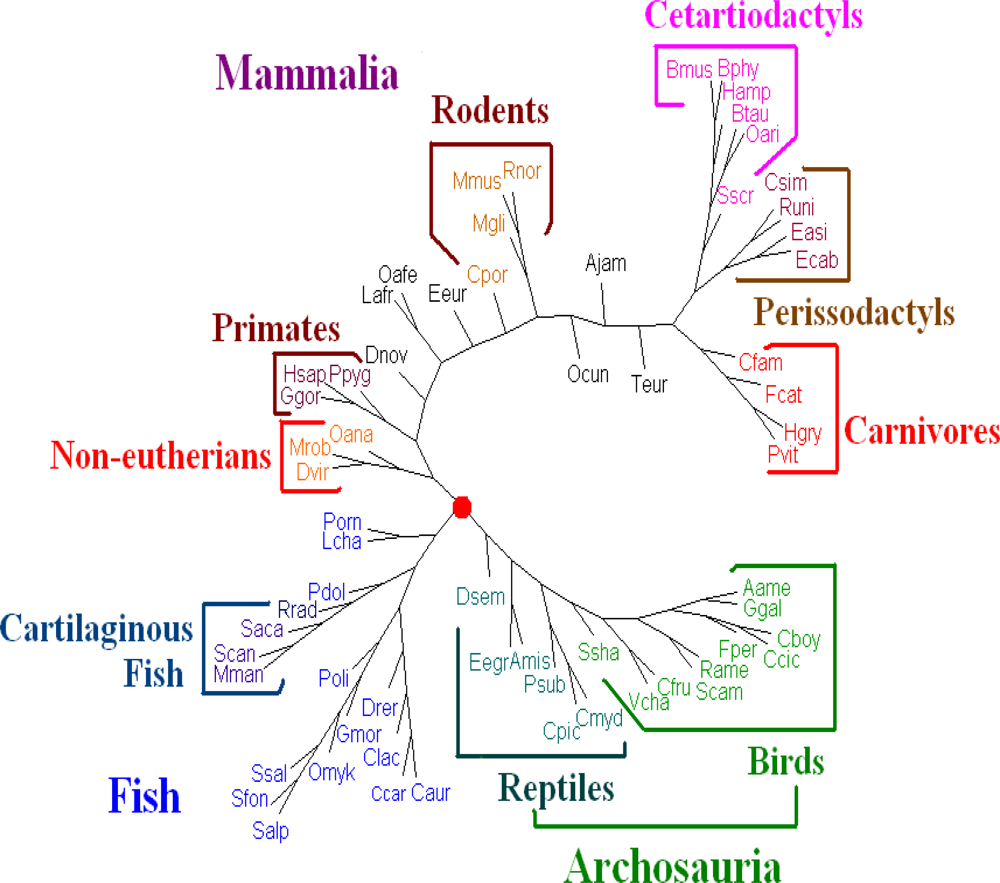
For
Dataset 3, after comparing all the trees with the traditional classification of the 64 vertebrates (the traditional classification from the KEGG database is available under “Complete Mitochondrial Genomes” on
http://www.genome.jp/kegg/genes.html)), we find that the whole DNA sequences give better results than those given by the amino acid sequences of all protein-coding genes from genomes and all protein-coding DNA sequences. We evaluated the dynamical language approach with the proposed distance metrics on the sequences of whole genomes for
K = 6 to 13. We find the tree using the piecewise distance has the same topology as the tree using the old “distance” for the same value of
K, the tree using the chord distance has similar topology (a little bit better because
Dasypus novemcinctus.(Dnov) is close to but does not remain in a branch of primates) to the tree using the old “distance” for the same value of
K. And the trees for
K = 11 are the best. Hence we present the tree for K = 11 using the dynamical language approach with chord distance in
Figure 4. The tree (
Figure 4) generated is similar in topology to the tree obtained using the SVD method in the case
K = 4 [
19], and is also similar to a recently generated tree of 69 species [
33], placing a vast majority of species into well-accepted groupings. As shown in
Figure 4, our distance-based analysis shows that the mitochondrial genomes are separated into three major clusters. One group corresponds to mammals; one group corresponds to the fish; and the third one represents Archosauria (including birds and reptiles). The interrelationships among the mitochondrial genomes are roughly in agreement with the current understanding of the phylogeny of vertebrates revealed by the traditional approaches. For further biological discussion, one can refer to [
32].
For
Dataset 4, Guyon
et al. [
31] first reconstructed a reference tree using Maximum Likelihood (ML) method based on the large (LSU) and the small (SSU) ribosomal subunits sequences (
i.e., the traditional alignment method). Then they compared the results using four alignment free string distances for complete genome phylogeny. The four distances are Maximum Significant Matches (MSM) distance,
k-word (KW) distance (
i.e., the Markov model in [
11]), Average Common Substring (ACS) distance and Compression (ZL) distance. Guyon
et al. [
31] found the MSM distance out performs the other three distances and the KW cannot give good phylogenetic topology for the 62 alpha-proteobacteria (see Figure 3 in [
31]). We tested our dynamical language approach with pseudo-distance in [
5] and the two proper distances in this paper on Dataset 4. We found that amino acid sequences of all protein-coding genes from genomes give better results than those given by the whole DNA sequences and all protein-coding DNA sequences. We evaluated the dynamical language approach with pseudo-distance in [
5] and the two proper distances in this paper on the amino acid sequences of all protein-coding genes from genomes for
K = 3, 4, 5 and 6. We found the trees using the new distance metrics have the same topology as the trees using the old “distance” for the same value of
K, and the topology of trees for
K = 5 and 6 are the same and the best. Here we present the tree for
K = 6 using dynamical language approach with chord distance in
Figure 5. As shown in
Figure 5, all Rhizobiales (Bartonellaceae, Brucellaceae, Rhizobiaceae and Phyllobacteriaceae) (A), Rhizobiales (Bradyrhizobiaceae) (B), Rickettsiales (Rickettsiaceae and Anaplasmataceae) (C), Rhodospirillales (D), Sphingomonadales (E); Rhodobacterales (Rhodobacteraceae) (F) group into correct branches respectively. Even inside each lineage (groups A to F), our phylogentic topology is more similar to that of ML reference tree (the right side tree in Figure 1 of [
31]) than that obtained by the MSM distance (the best result in [
31]). After comparing our
Figure 5 with the tree obtained using KW distance (
i.e., the Markov model in [
11]) (the tree in Figure 3 of [
31]), our dynamical language model performs much better than the KW distance.
There is no significant effect by the normalization of the distances and different values of ρ ≥ 3. Using the proposed distance metrics, we compared the trees before and after normalization and found that the topology of the trees is the same. Then we set ρ = 4, 6, 8, 10 and found that we could get the trees with the same topology as the tree for ρ = 3. As a result, there seems to be no noticeable effect by normalization of the distances and different values of ρ ≥ 3.


