Article

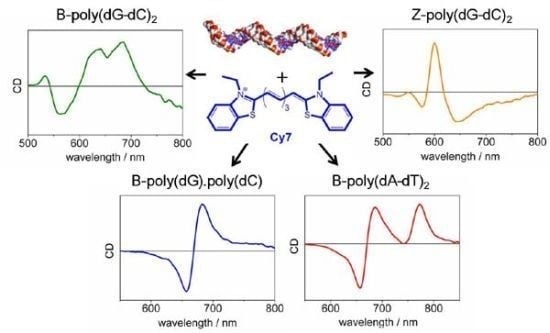
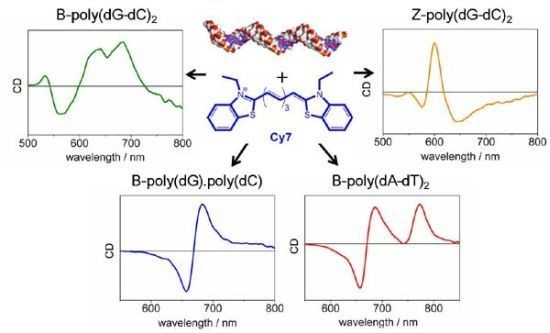
3,3′-Diethylthiatricarbocyanine Iodide: A Highly Sensitive Chiroptical Reporter of DNA Helicity and Sequence

by
Jung Kyu Choi
1,
Alessandro D’Urso
1,2,
Mitch Trauernicht
2,
Murtaza Shabbir-Hussain
1,
Andrea E. Holmes
2 and
Milan Balaz
1,*
1
Department of Chemistry, University of Wyoming, Laramie, WY 82071, USA
2
Doane College, 1014 Boswell, Crete, NE 68333, USA
*
Author to whom correspondence should be addressed.
Int. J. Mol. Sci. 2011, 12(11), 8052-8062; https://doi.org/10.3390/ijms12118052
Submission received: 21 October 2011 / Revised: 2 November 2011 / Accepted: 7 November 2011 / Published: 16 November 2011
(This article belongs to the Special Issue Applications of Circular Dichroism)

Abstract

:
Using UV-vis absorption and circular dichroism (CD) spectroscopies, we explored the binding interactions of 3,3′-diethylthiatricarbocyanine iodide (Cy7) with polynucleotides of different sequences and helicity. CD showed to be a very diagnostic tool giving different spectroscopic chiroptical signatures for all explored DNA sequences upon Cy7 binding. Cy7 was able to spectroscopically discriminate between the right handed B-DNA of poly(dG-dC)2 and its left handed Z-DNA counterpart induced by spermine or Co(III)hexamine via nearly opposite induced circular dichroic signal.

Graphical Abstract

1. Introduction

Cyanine dyes represent an important class of chromophores due to their favorable optical properties, such as high extinction coefficients and fluorescence [1]. Their highly conjugated structure results in a small HOMO-LUMO gap and red shifted absorbance and fluorescence [2,3]. Cyanines cover a wide span of applications ranging from fluorescent biomedical imaging, labeling, and non-linear optics to light harvesting and optical storage [48].
Cyanines are achiral and thus circular dichroism (CD) silent in the absence of a chiral template like DNA. Binding of the achiral dyes to the chiral DNA helix can result in an induced circular dichroism (ICD) in the absorption spectrum of the dye (500–900 nm). An ICD signal can rise from two distinct phenomena, (a) chiral twisting of the dye in the DNA groove; or (b) an exciton coupling between two chirally oriented dyes. Since cyanines absorb in the visible region whereas nucleic acids absorb in the UV region (<300 nm), the ICD signal is free of overlaps and very diagnostic of a dye binding mode. Cy3 and Cy5 cyanine dyes have previously been reported to bind to alternating adenine-thymine oligo and polynucleotides. Cy5 assembles as parallel helical dimers in the minor groove, and exciton coupled circular dichroism (ECCD) originates from the interaction between the adjacent cyanine dimers (dimer-dimer coupling) [913]. However, binding of Cy5 (Cy3 was not studied) to poly(dG-dC)2 did not yield an ICD signal in the cyanine absorption region. The absence of an ICD was explained by the ineffective, non-coupled orientation of Cy5 upon DNA binding [13]. 3,3′-Diethylthiatricarbocyanine iodide (Cy7, Chart 1) contains a conjugated bridge of seven methines and has a more red shifted absorption than Cy5 (Δλmax ~ 100 nm) with an absorption maxima in the NIR region (650 to 800 nm). The extended conjugated system makes Cy7 dye more photolabile than its shorter counterparts, and long-term exposure to visible light must be avoided. Herein we report the chiroptical signature of Cy7 binding with polynucleotides having different sequences and helical twists.
The spectroscopic recognition of DNA helicity is important but challenging [1418]. The biological relevance of Z-DNA has been demonstrated by the discovery of transcription factors that selectively bind to Z-DNA, and thus have a direct impact on gene expression [1922]. Z-DNA is left handed and is higher in energy than the canonical right-handed B-DNA [23,24] Thus far, porphyrins [16,18,2528] helicines [15], and tris(phenanthroline)metal-complexes [2931] have been used as in vitro Z-DNA probes. No in vivo molecular probes have been reported so far. In order to explore the DNA binding of Cy7, we have selected three polynucleotide sequences allowing us to access four DNA duplexes that differ in nucleobase sequence and helicity: (i) the B-form of poly(dA-dT)2; (ii) the B-form of poly(dC).poly(dG); (iii) and (iv) the B- and Z-forms of poly(dG-dC)2.

2. Results and Discussion

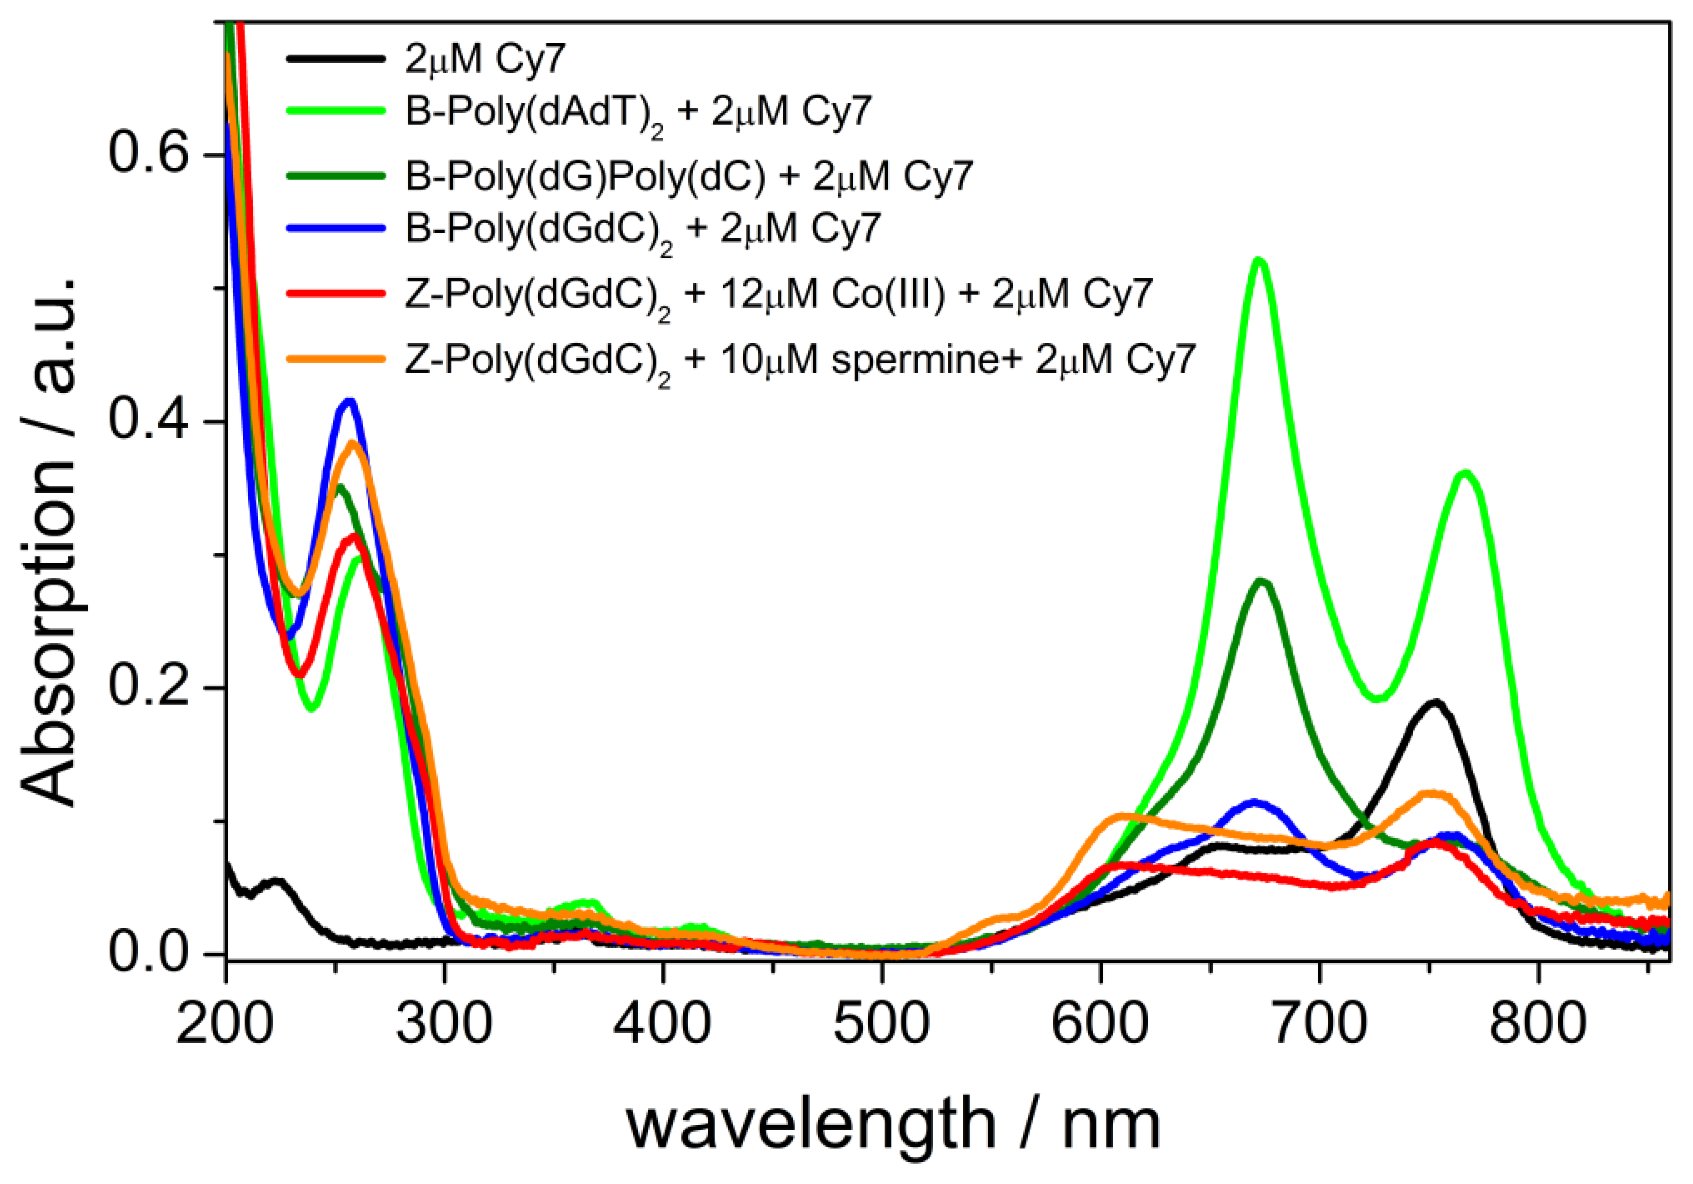
2.1. UV-vis Spectroscopy of the B-forms of poly(dA-dT)2, poly(dC).poly(dG), and poly(dG-dC)2

The UV-vis absorption spectrum of Cy7 in the absence of DNA showed a characteristic profile with two major bands at 755 nm (strong) and 650 nm (weak). Absorption spectra show that very diverse structural and electronic mechanisms exist when Cy7 is bound to different forms of DNA (Figure 1). Titration of Cy7 into a solution of alternating adenine-thymine polynucleotide poly(dA-dT)2 resulted in a significant increase of intensity at 650 nm and 750 nm which was accompanied by the shift of the absorption maxima to a longer wavelength. The Cy7 (2 μM) bound to the adenine-thymine DNA (50 μM) showed a red shift from 650 nm to 670 nm (Δλ = 20 nm, 80% hyperchromicity) and from 750 nm to 760 nm (Δλ = 15 nm, 100% hyperchromicity) when compared to the DNA-free unbound dye. Similar absorption behavior was observed for the shorter cyanine dye, Cy5, where changes in absorption behavior were explained as a result of a Cy5 dimer formation [912]. On the other hand, addition of Cy7 (0 to 2 μM) to a solution of non-alternating polynucleotide poly(dG).poly(dC) resulted in a decrease (40% hyperchromicity) of the 750 nm absorption band and an increase (100% hyperchromicity) of the 650 nm band. Both bands exhibited bathochromic shifts, Δλ 650 = 20 nm and Δλ 750 = 5 nm. Titration of Cy5 into a poly(dG-dC)2 has previously shown to result in hypochromicity of absorption bands without formation of a cyanine dimer. In our case, however, the increase of 650 nm absorption band together with a red shift (from 650 to 670 nm, Δλ = 20 nm, 15% hypochromicity) suggested the formation of a Cy7 dimer upon DNA binding. The decrease of absorption (45% hypochromicity) and red shift of 750 nm band (Δλ = 20 nm) furnished additional evidence for the Cy7 dimer formation in the presence of poly(dG-dC)2. The changes in UV-vis spectroscopy when Cy7 is bound to different forms of DNA originate from structural differences of Cy7 in the minor groove of three examined polynucleotides. Interestingly, cyanine dyes Cy3 and Cy5 were previously found to bind to poly(dG-dC)2 as monomers while our results suggest the formation of Cy7 dimers in the presence of poly(dG-dC)2.

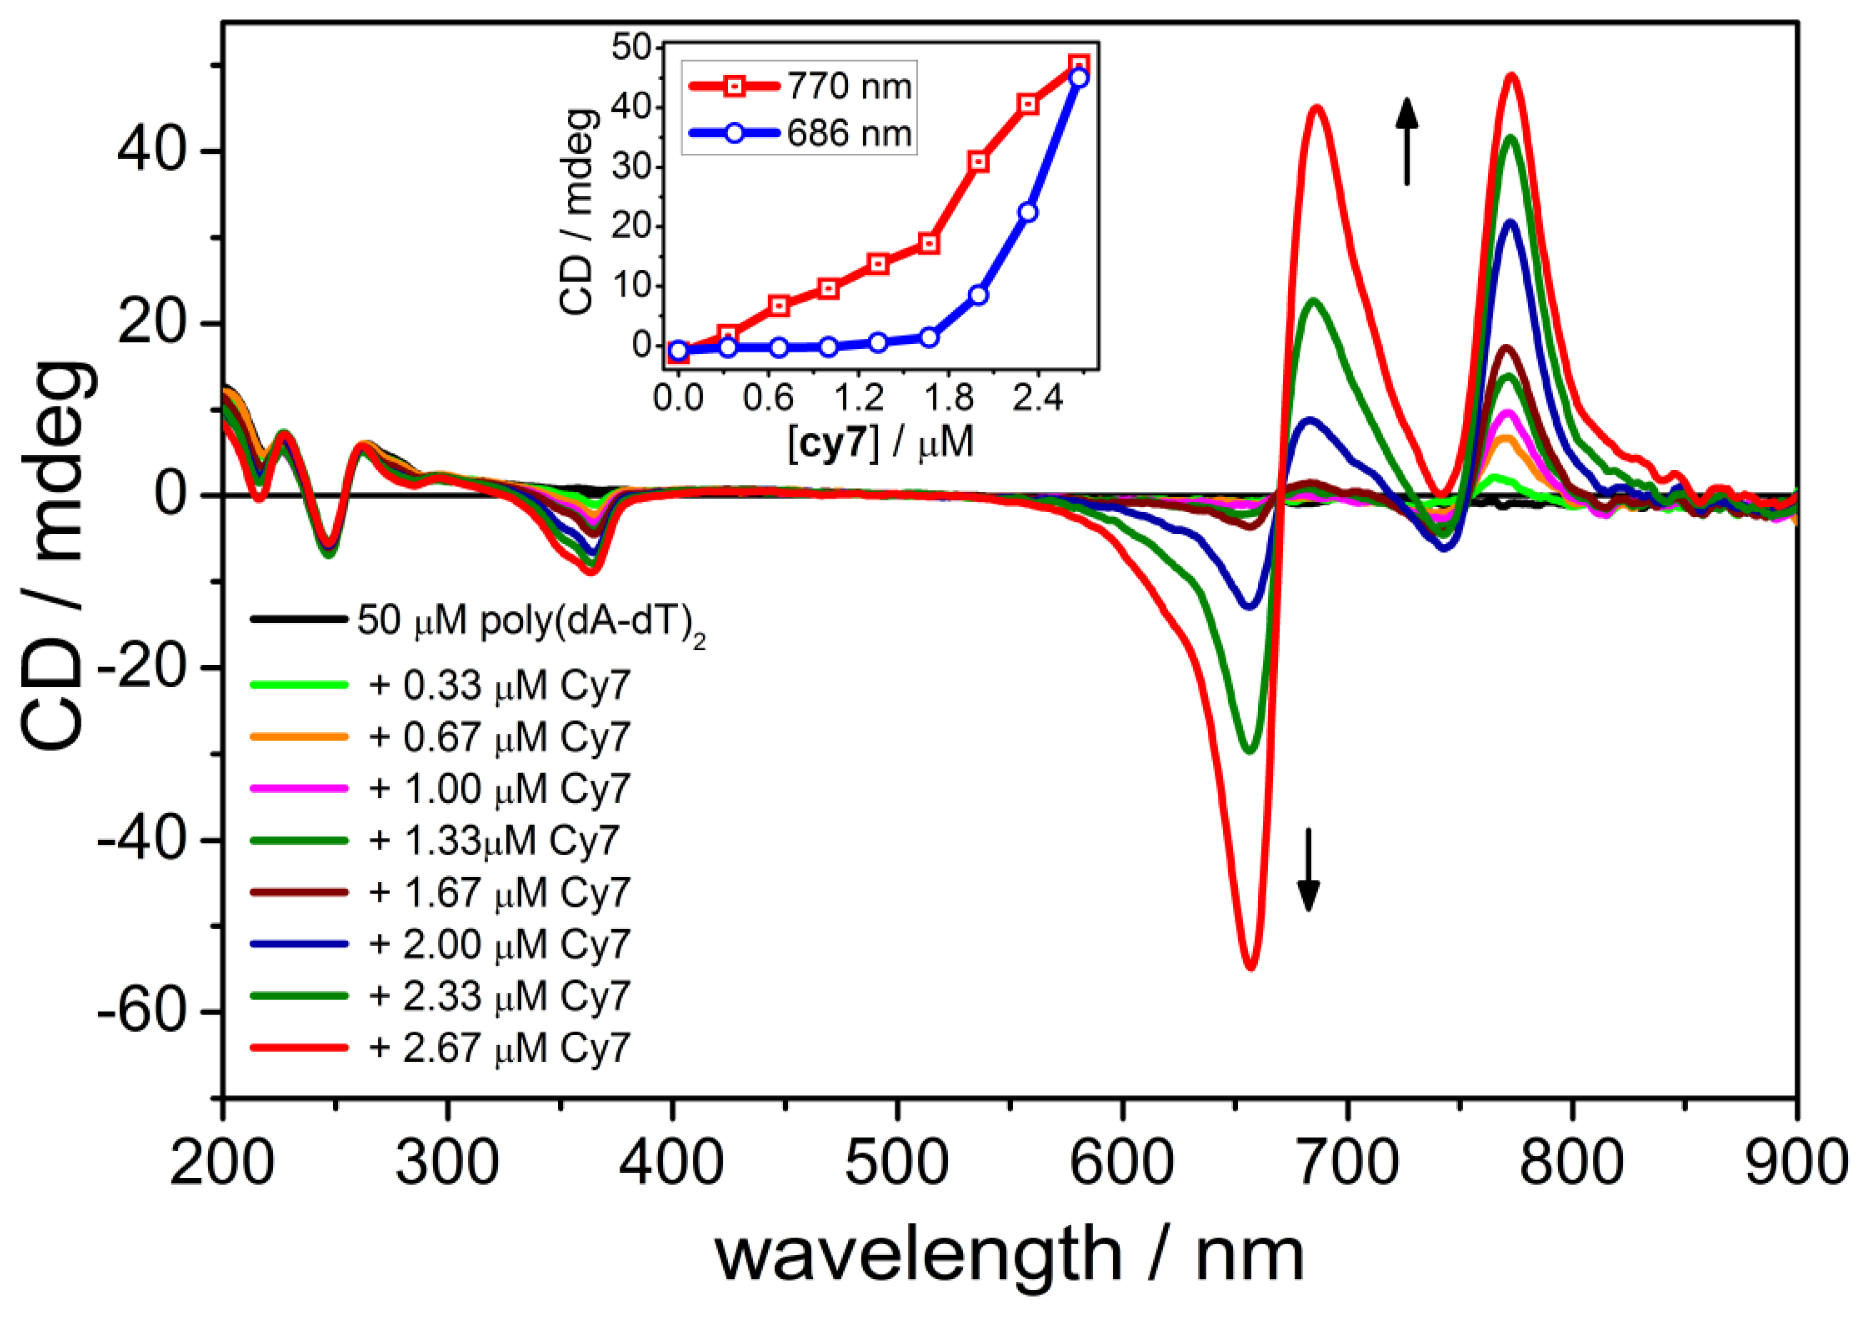
2.2. CD Spectroscopy of the B-form of poly(dA-dT)2

Titrations of Cy7 (from 0 μM to 1.66 μM, 0.33 μM increment) into a solution of poly(dA-dT)2 gave rise to a positive CD band at 770 nm and a negative CD band at 360 nm (Figure 2). These CD bands originated from the chiral twist of a DNA bound dye. The 770 nm CD band coincided with 770 nm absorption band corresponding to the monomeric form of the dye. Increasing the concentration of Cy7 from 1.66 μM to 2.66 μM resulted in appearance of a bisignate CD signal with a positive CD band at 686 nm and negative band at 655 nm accompanied with an additional increase of ellipticity of the 770 nm CD band (Inset, Figure 2). This bisignate CD originated from electronic dipole-dipole exciton coupling between two neighboring cyanine dyes. The isosbestic point of the bisignate CD signal overlapped with the absorption band at 670 nm and provided additional evidence that the bisignate CD curve rose from exciton coupling involving Cy7 dimers. The binding of Cy7 did not disturb the secondary structure of DNA which could be seen from the nearly unchanged characteristic DNA region in the UV region of the CD spectrum.

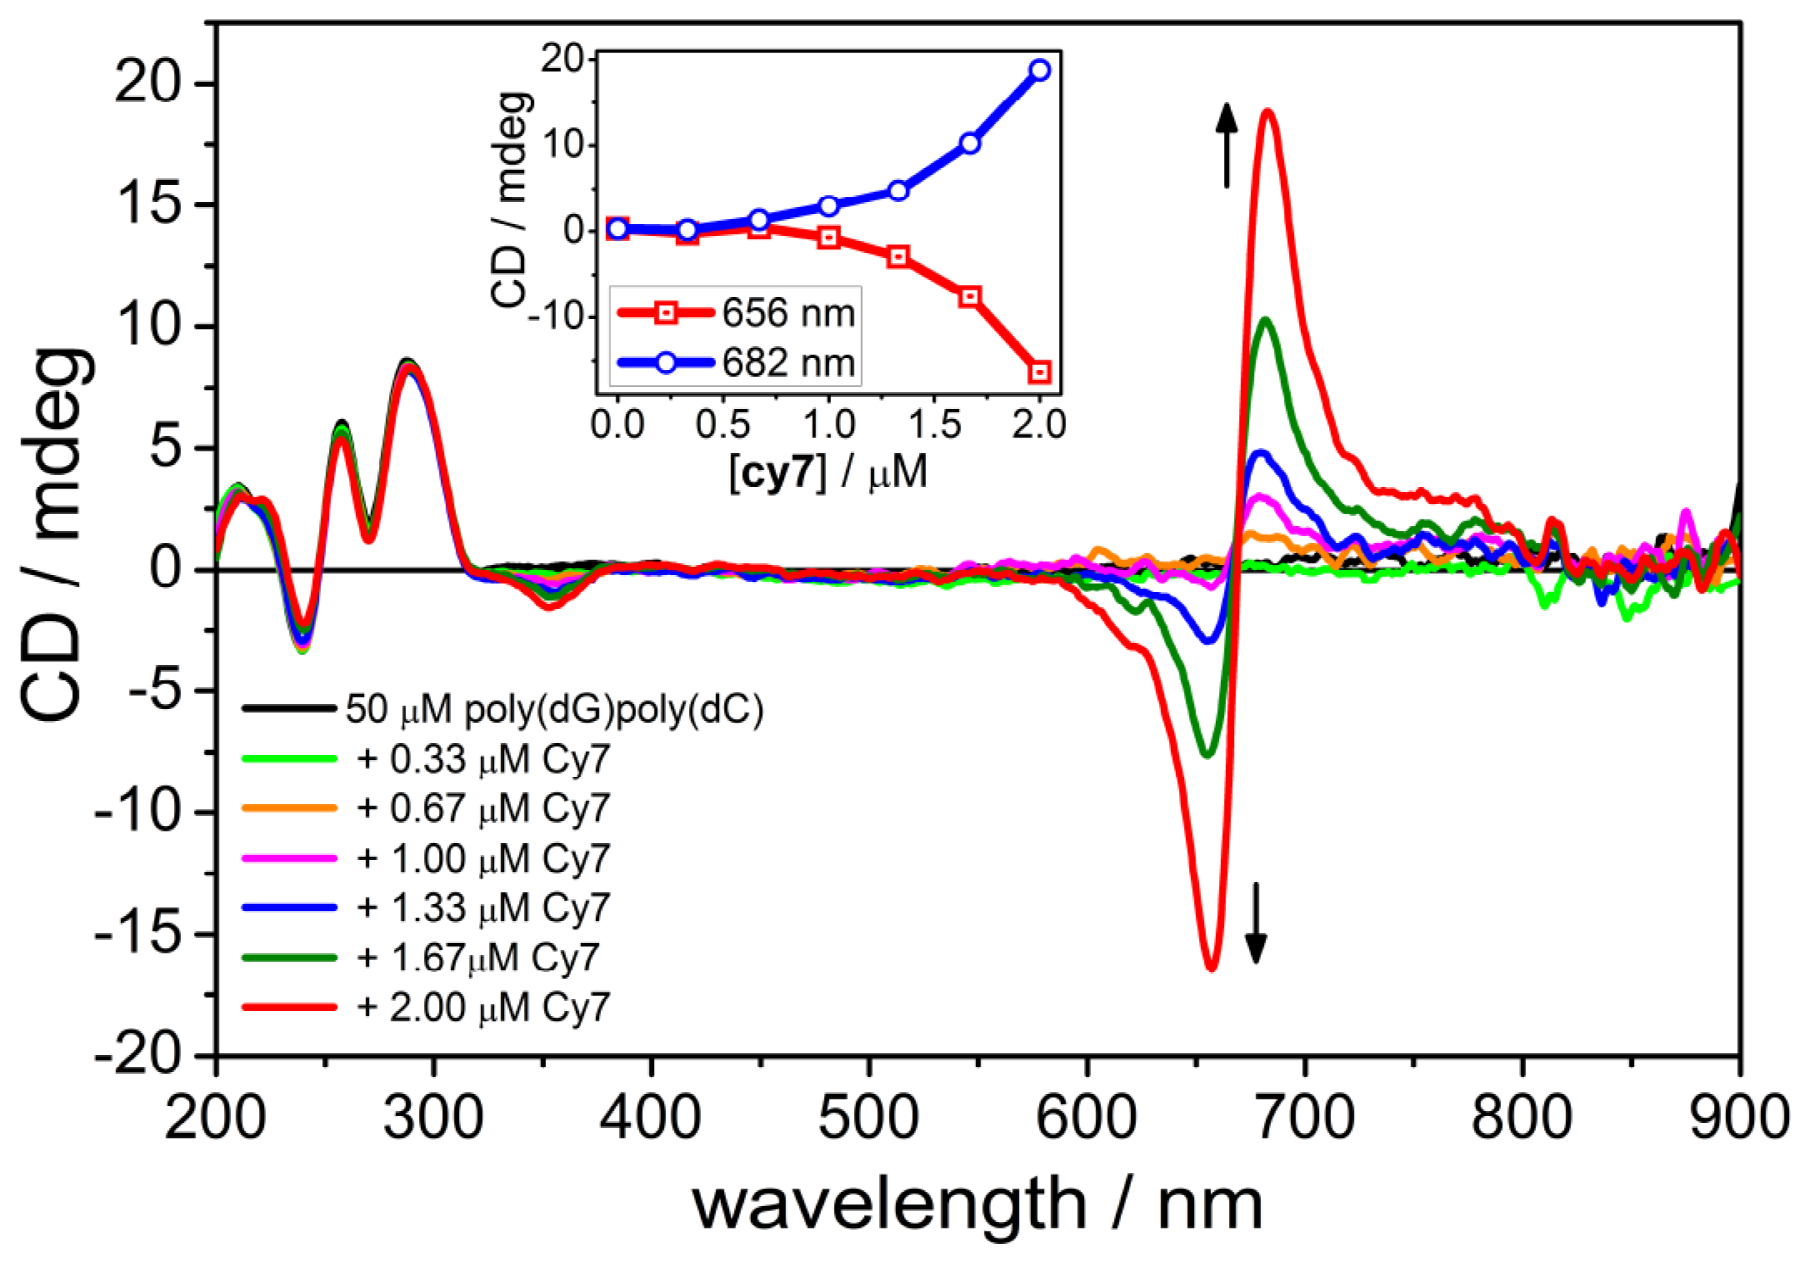
2.3. CD Spectroscopy of the B-form of poly(dC).poly(dG)

CD titration of Cy7 to a solution of poly(dG).poly(dC) in 5% MeOH/Na-cacodylate buffer revealed a strong bisignate signal with positive Cotton effect at 680 nm and a negative Cotton effect at 655 with an isosbestic point at 668 nm (Figure 3). A small negative CD band was also observed at 350 nm. No CD band was observed at 770 nm which coincided with a very weak absorption band at that wavelength. It appears that poly(dG).poly(dC) DNA promotes the formation of chiral dimer aggregates even at low concentration of Cy7. Again, virtually no changes have been detected in the CD spectrum below 300 nm.

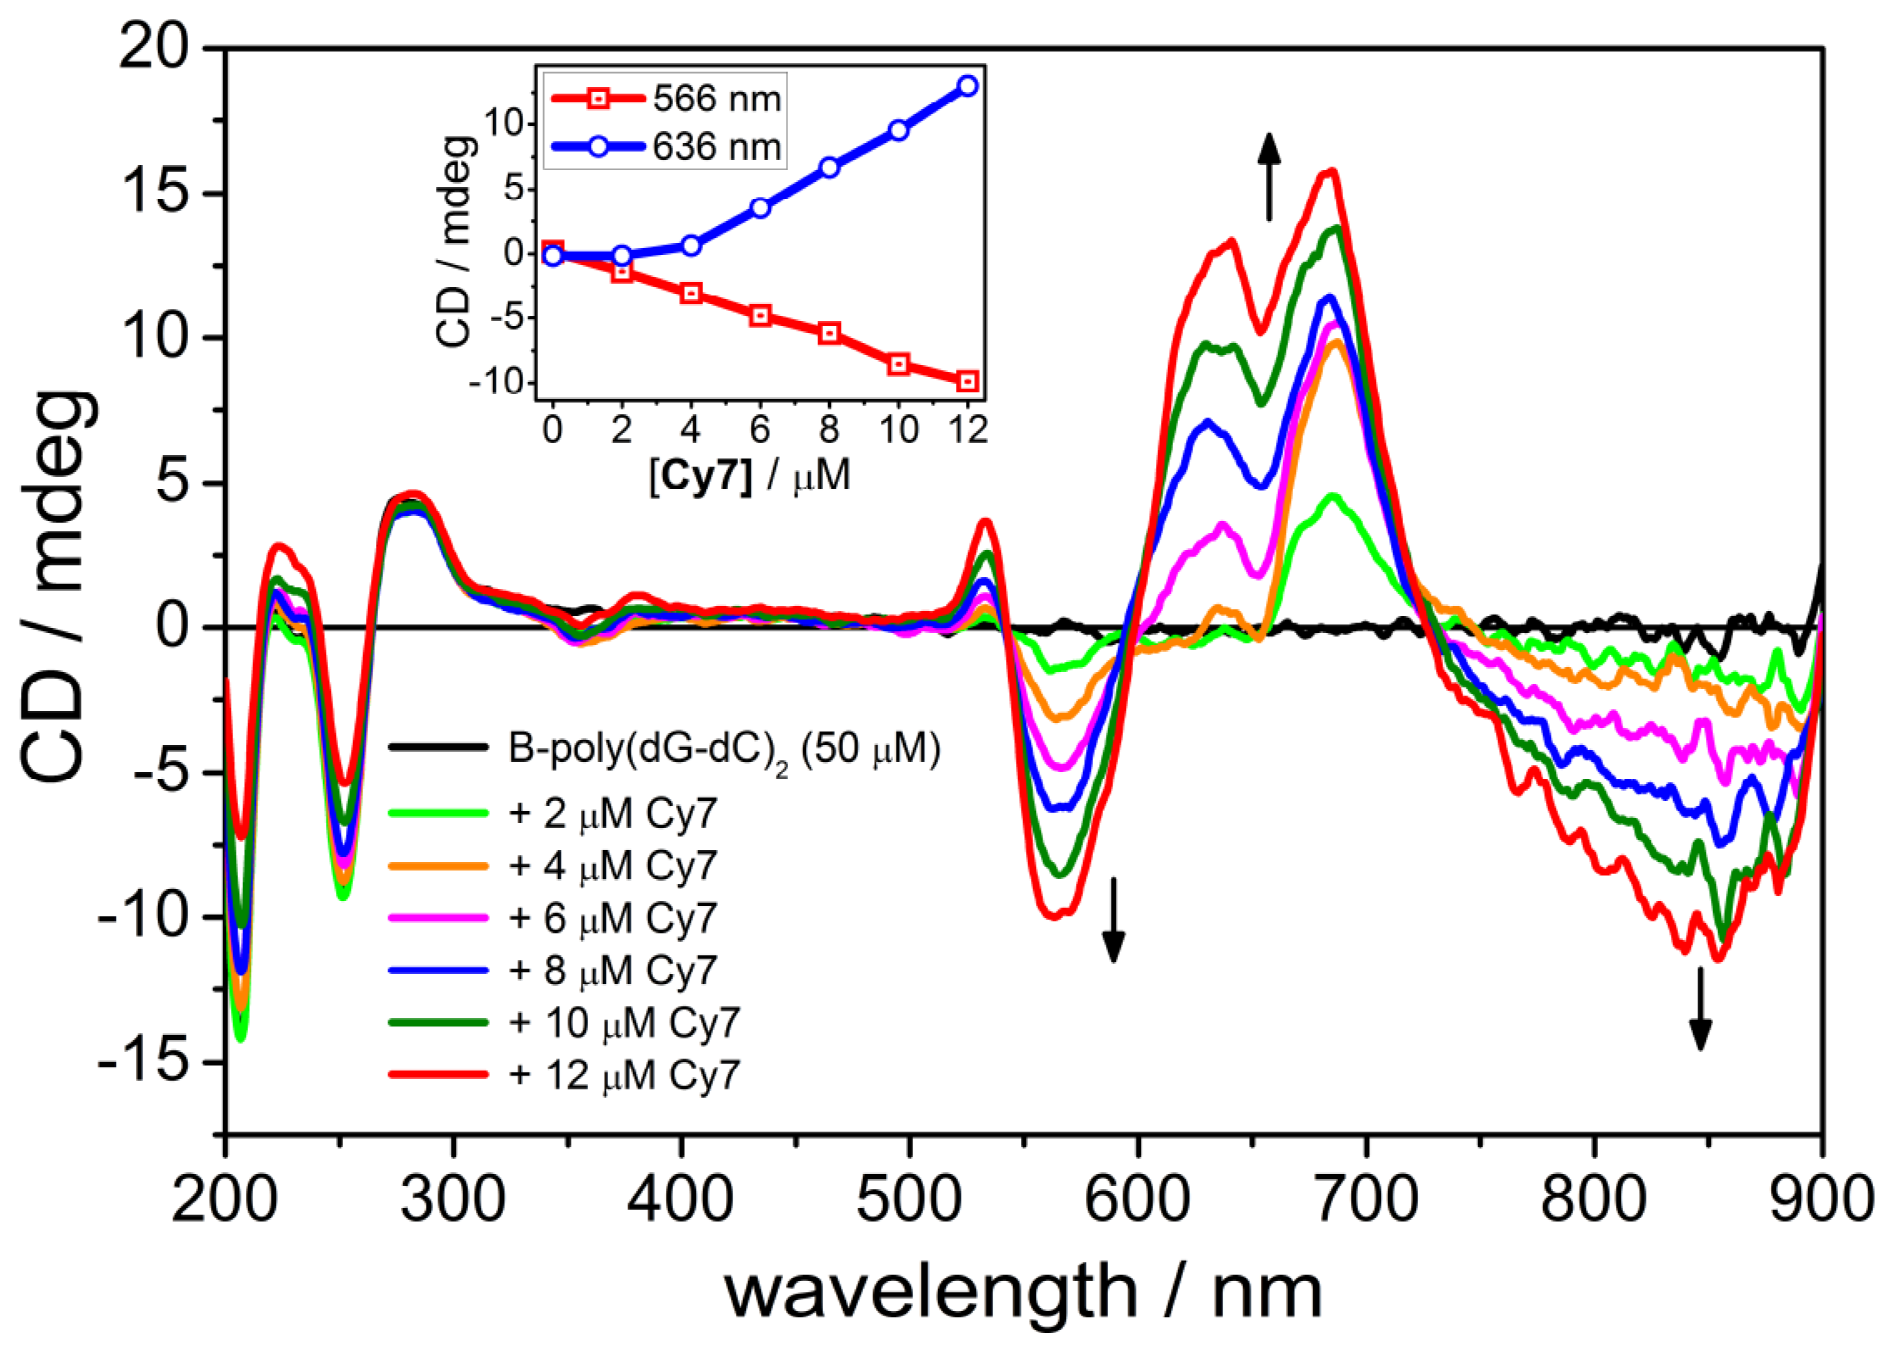
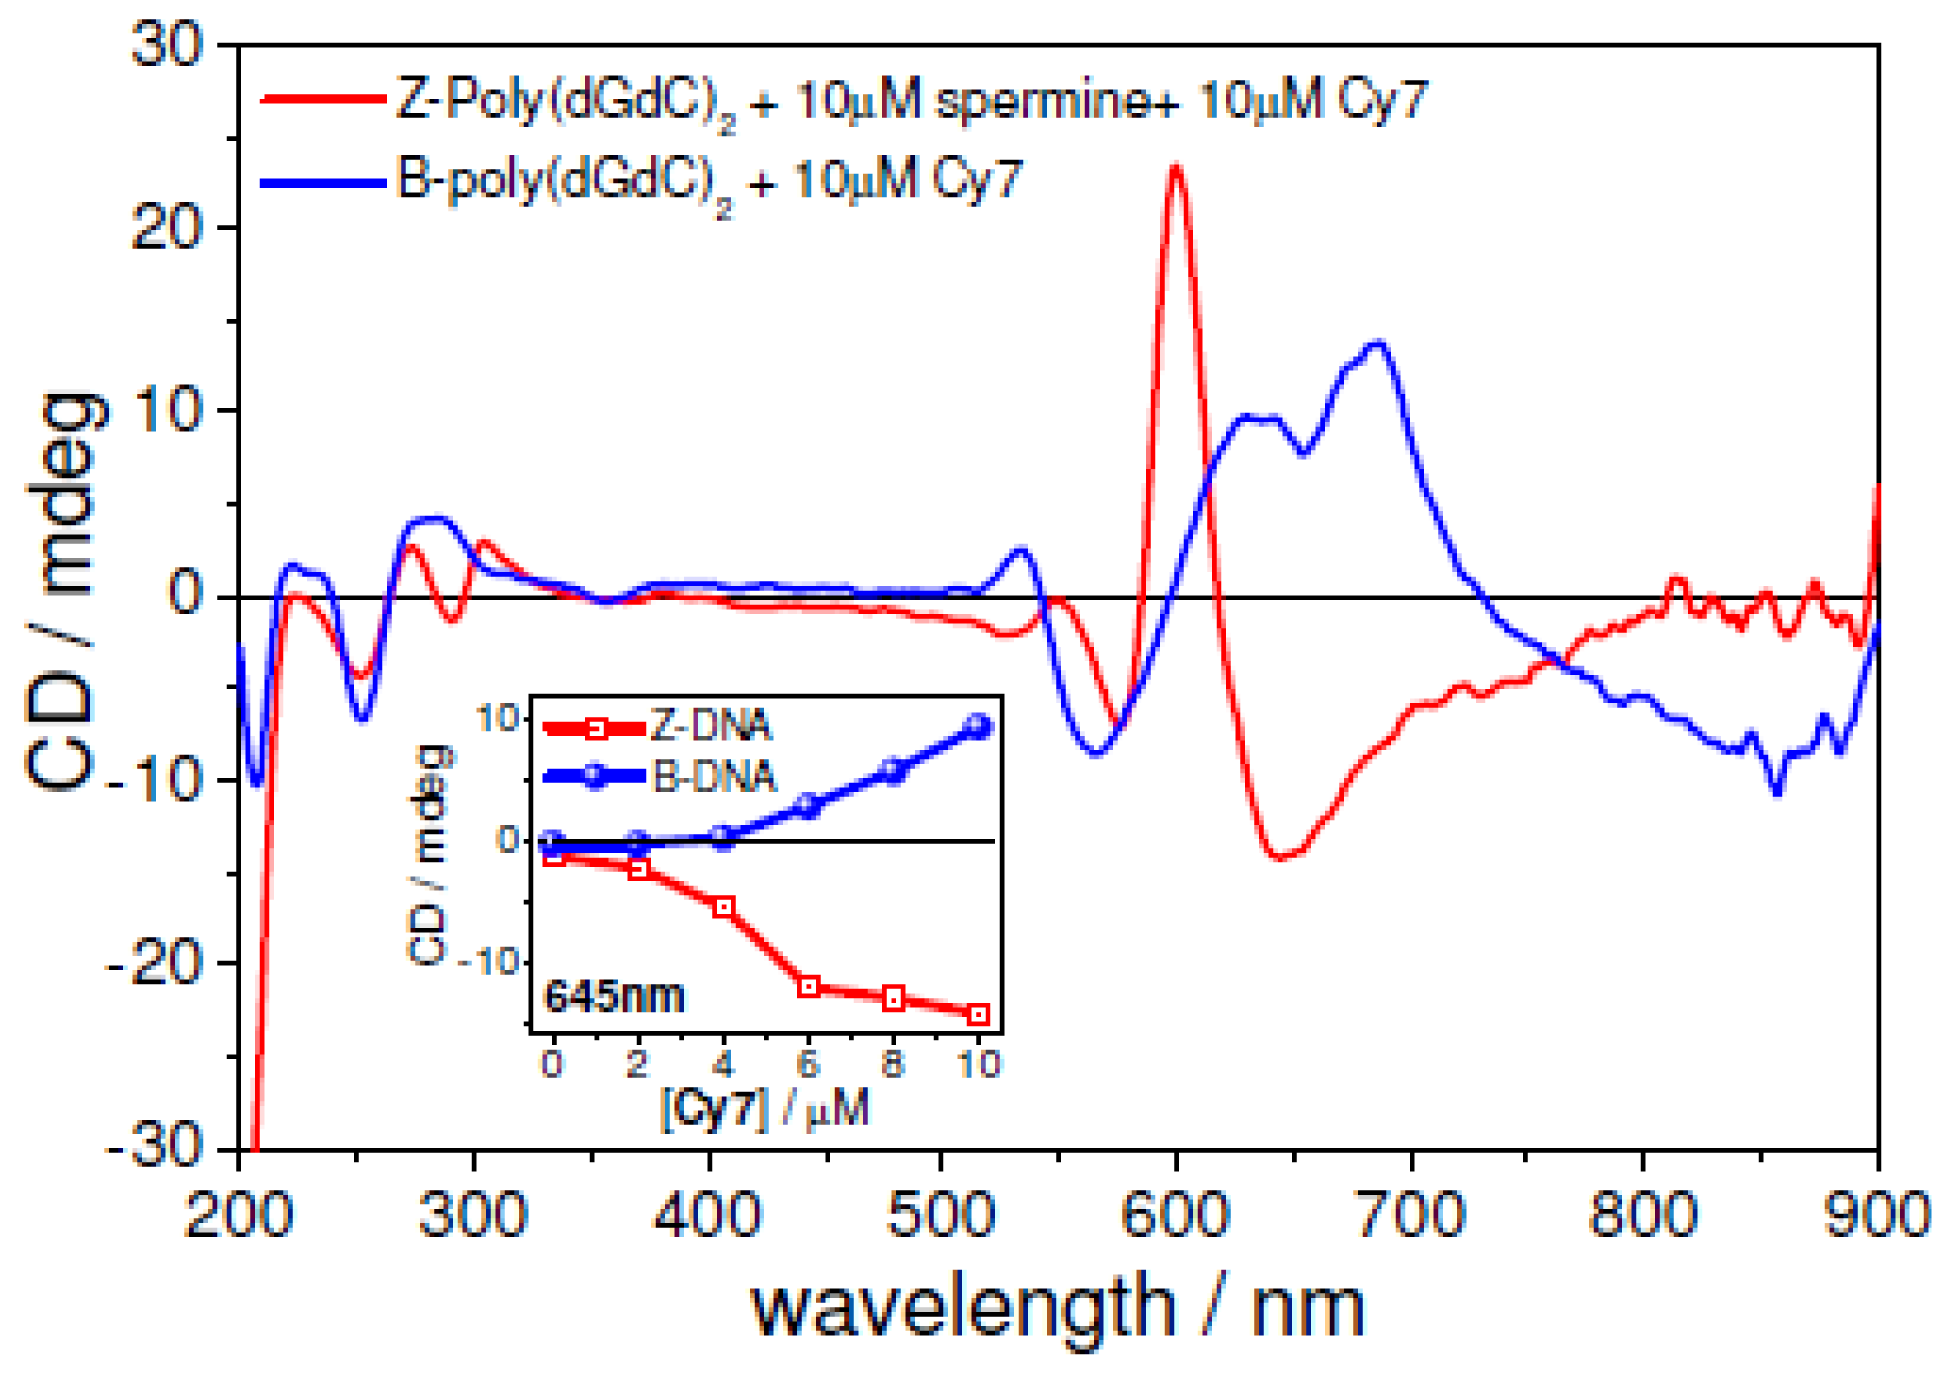
2.4. CD Spectroscopy of the B-form of poly(dC-dG)2

Next, we explored the binding of Cy7 with poly(dG-dC)2. Stepwise addition of Cy7 (in 0.33 μM addition steps) from 0 μM to 1.26 μM resulted in an appearance of a positive Cotton effect centered at 690 nm corresponding to a bound Cy7 monomer (Figure 4). In addition, a very weak negative CD band was observed at 340 nm. Increasing the concentration of Cy7 further (from 1.58 μM to 2.21 μM) yielded negative Cotton effects at 850 and 580 nm and a positive Cotton effect at 620 nm accompanied with a disappearance of the positive CD band at 690 nm (Inset, Figure 4). The observed CD spectroscopic changes originated from a rearrangement of the DNA bound Cy7 upon addition of more dye suggesting a different DNA binding mode at low Cy7/DNA ratio (<1:50, i.e., one dye bound for 50 DNA base pairs) and high Cy7/DNA ratio (>1:50).
Since the ICD signal was weak in comparison to Cy7 binding with poly(dA-dT)2 or poly(dG).poly(dC) when using 0.33 μM increments, we decided to try larger additions (2 μM) to enhance the ICD signal. As can be seen in Figure 5, the first two additions of Cy7 (2 and 4 μM) to poly(dG-dC)2 gave rise to a positive Cotton effect at 680 nm and a negative Cotton effect at 560 nm. Further addition of Cy7 yielded an additional positive CD band at 640 nm, a small positive CD band at 535 nm and a broad negative CD band at 850 nm (Figure 4). It is worth noting that the previously reported shorter cyanine Cy5 dye did not yield an ICD signal when bound to poly(dG-dC)2 [13].

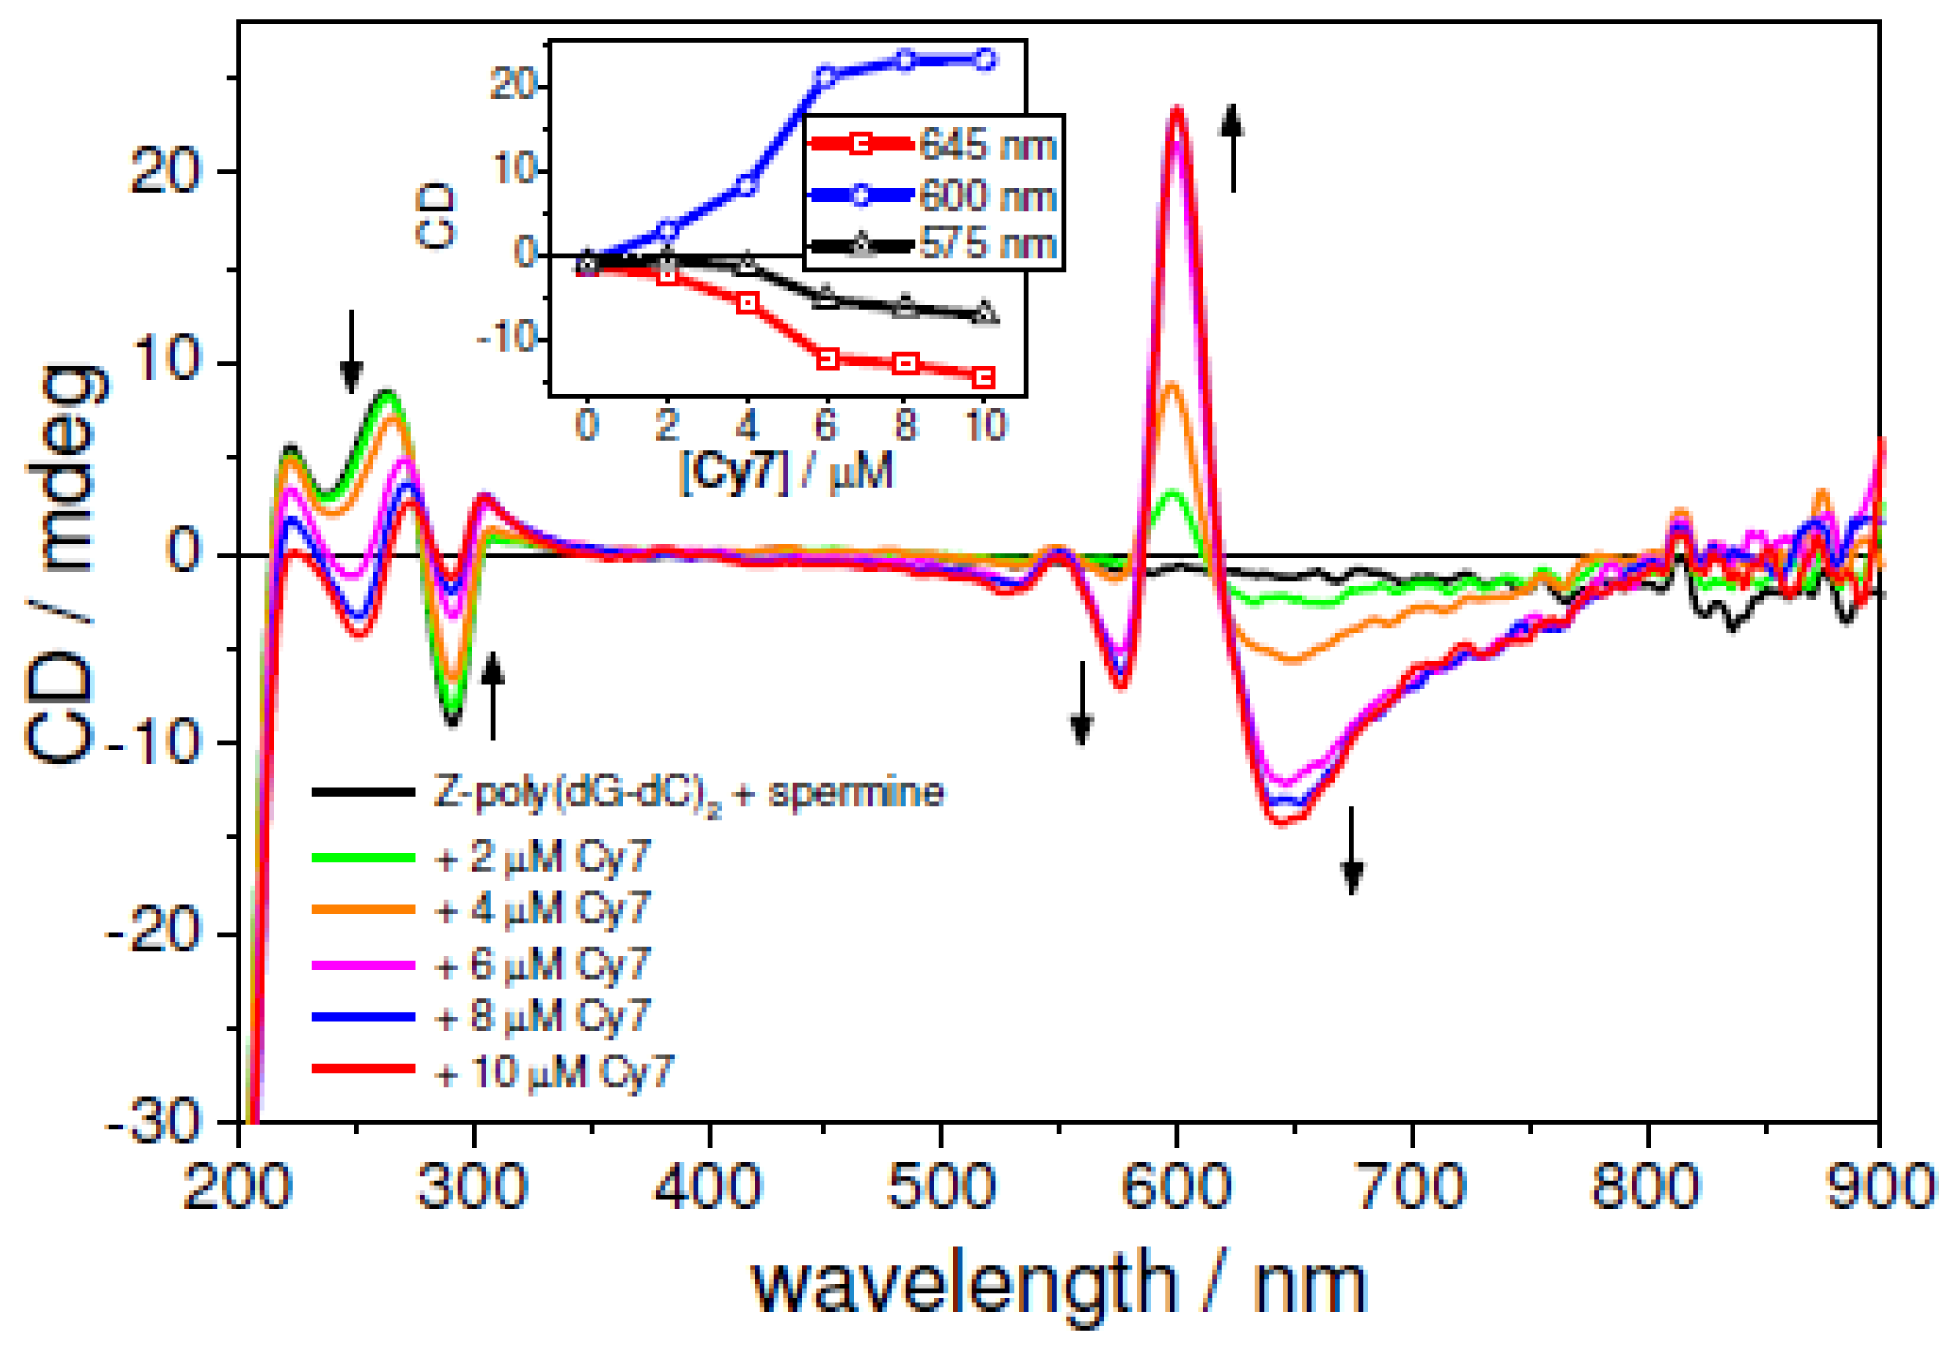
2.5. UV-vis and CD Spectroscopies of the Z-form of poly(dC-G)2

We used poly(dG-dC)2 as a tunable B- to Z-DNA scaffold to access DNA sequences having identical nucleotide composition but different helicity [25]. The fully protonated tetraamine spermine (H3N+-(CH2)3-+NH2-(CH2)4-+NH2-(CH2)3-+NH3) and cobalt(III) hexaamine were employed as micromolar inducers of the Z-DNA conformation [32]. Spermine-Z-DNA was induced at 60 °C using 10 μM spermine, then slowly cooled to RT (1 °C/min) while Co(III)-Z-form was induced with 12 μM at room temperature [33]. We used two different Z-DNA inducers to investigate the effect of the inducer as an integral part of the Z-DNA structure upon cyanine binding. Successful formation of Z-DNA was confirmed by CD spectroscopy where the spectral region below 300 nm revealed a spectral signature characteristic of left-handed Z-DNA, i.e., negative CD bands at 290 nm and 200 nm and a positive CD band at 260 nm. Since we employed different amounts of Z-DNA inducers (10 μM of spermine4+ vs. 12 μM of Co(NH3)63+) the final Z-DNA solutions differed in ionic strengths.
Stepwise addition of Cy7 (0 μM to 10 μM, 2.0 μM step) to a solution of Co(III) induced Z-form of poly(dG-dC)2 had a distinct effect on the Cy7 UV-vis absorption profile (Figure 1). A 50% decrease of absorbance at 750 nm without a wavelength shift has been observed. The 650 nm band exhibited 20% hypochromicity and 50 nm blue shift to 600 nm. Titration of Cy7 to a spermine induced Z-form yielded a similar spectroscopic signature, i.e., a 35% hypochromicity of the 750 nm band and 20% hyperchromicity of 650 nm band accompanied with a 50 nm blue shift. Addition of Cy7 to the spermine induced Z-poly(dG-dC)2 gave rise to an ICD signal at 500–800 nm with two negative Cotton effects at 645 nm and 570 nm and a positive Cotton effect at 605 nm (Figure 6). The addition of Cy7 to spermine Z-DNA caused significant conformational changes of DNA. As seen in Figure 6, the negative CD band at 290 nm decreased dramatically upon Cy7 addition. No such change was observed with Co(III) induced Z-DNA (Figure S2), suggesting a lower conformational stability of spermine induced Z-DNA probably caused by a binding competition between spermine and Cy7 in the DNA minor groove.
The addition of Cy7 to spermine induced left-handed forms of poly(dG-dC)2 yielded ICD spectra in the visible region with nearly opposite CD signatures when compared to the B-form of poly(dG-dC)2 (Figure 7). The origin of the nearly opposite CD signals was due to the dye’s opposite chiral orientation when bound to the two different DNA helical backbone. This opposite characteristic of Cy7 was clearly seen when the ICD signal of Cy7 bound to B-poly(dG-dC)2 (Figure 7, blue curve) was compared to ICD signal of the Cy7 bound to Z-form of poly(dG-dC)2 induced by spermine (Figure 7, red curve) and by Co(NH3)63+ (ESI, Figure S3). Therefore, Cy7 allowed for the visualization of DNA structure in the visible spectral range which is far from any possible spectral overlap with indigenous chromophores.

3. Experimental Section

3,3′-Diethylthiatricarbocyanine iodide Cy7 (3-Ethyl-2-[7-(3-ethyl-2-benzothiazolinylidene)-1,3,5-heptatrienyl]benzothiazolium iodide, DiSC2(7)) was purchased from Sigma-Aldrich. Water was obtained from a Milli-Q system with a resistivity of 18.2 MΩ·cm. DNA samples were dissolved in a sodium cacodylate buffer (1 mM, pH 7.0), annealed at 80 °C for 20 min, cooled at 1 °C/min, and kept at 4 °C. The concentration of the DNA stock solutions was quantified by UV-vis spectroscopy and is reported per base pair. The Cy7 stock solution (c = 0.5 mM) was prepared in methanol, and the concentration was determined by UV-vis spectroscopy using the extinction coefficient ɛ = 2.5 × 10⁵ M−1·cm−1 at 758 nm [9,33].
CD spectra were recorded at 20 °C using a Jasco J-815 spectropolarimeter equipped with a single position Peltier temperature control system using following conditions: scanning speed 50 nm/min, data pitch 0.5 nm, DIT 2 s, and bandwidth 1 nm. UV-vis absorption spectra were collected at 20 °C using a Jasco V-600 UV-vis double beam spectrophotometer equipped with a single position Peltier temperature control system. To minimize the Cy7 photobleaching, all titrations have been performed under reduced light and each CD spectrum was performed as a single scan. A quartz cuvette with a 1 cm path length was used for all CD and UV-vis experiments.

4. Conclusions

CD spectroscopy was employed to explore the chiroptical behavior of cyanine dye Cy7 in the presence of DNA sequences having different sequences and helical twists. UV-vis absorption spectra reflected very different structural and electronic characteristics of Cy7 when bound to different DNA forms. Cy7 assembles onto poly(dG-dC)2 with a very distinct chiroptical signature, unlike its shorter cyanine counterparts Cy3 and Cy5. We showed that Cy7 can spectroscopically discriminate between polynucleotides having different sequences using ICD signals in the visible spectroscopic region. Cy7 also recognized and chiroptically distinguished right-handed B-DNA and left handed Z-DNA forms of poly(dG-dC)2 via a very diagnostic induced circular dichroism signal between 500–900 nm.

Supplementary Material

ijms-12-08052-s001.pdf

Acknowledgments

This research was supported in part by the University of Wyoming Start-Up Fund (M.B.); the NIH, Grant Nos. P20 RR016474 (M.B.) and P20 RR016469 (A.E.H.) from the INBRE Programs of the National Center for Research Resources; the NSF-EPSCoR-EPS-1004094 and the NSF CHE-0747949 (A.E.H.). A.D’U. thanks the 22th PhD program of the University of Catania.

References

  1. Brooker, L.G.S.; Sprague, R.H.; Smyth, C.P.; Lewis, G.L. Color and constitution I Halochromism of anhydronium bases related to the cyanine dyes. J. Am. Chem. Soc 1940, 62, 1116–1125. [Google Scholar]
  2. Byers, G.W.; Gross, S.; Henrichs, P.M. Direct and sensitized photooxidation of cyanine dyes. Photochem. Photobiol 1976, 23, 37–43. [Google Scholar]
  3. Yang, S.J.; Tian, H.; Xiao, H.M.; Shang, X.H.; Gong, X.D.; Yao, S.D.; Chen, K.C. Photodegradation of cyanine and merocyanine dyes. Dyes Pigments 2001, 49, 93–101. [Google Scholar]
  4. Mishra, A.; Behera, R.K.; Behera, P.K.; Mishra, B.K.; Behera, G.B. Cyanines during the 1990s: A review. Chem. Rev 2000, 100, 1973–2011. [Google Scholar]
  5. Mustroph, H.; Stollenwerk, M.; Bressau, V. Current developments in optical data storage with organic dyes. Angew. Chem. Int. Ed 2006, 45, 2016–2035. [Google Scholar]
  6. Gomez-Hens, A.; Aguilar-Caballos, M.P. Long-wavelength fluorophores: New trends in their analytical use. TrAC Trends Anal. Chem 2004, 23, 127–136. [Google Scholar]
  7. Webster, S.; Fu, J.; Padilha, L.A.; Przhonska, O.V.; Hagan, D.J.; Van Stryland, E.W.; Bondar, M.V.; Slominsky, Y.L.; Kachkovski, A.D. Comparison of nonlinear absorption in three similar dyes: Polymethine, squaraine and tetraone. Chem. Phys 2008, 348, 143–151. [Google Scholar]
  8. Flanagan, J.H.; Khan, S.H.; Menchen, S.; Soper, S.A.; Hammer, R.P. Functionalized tricarbocyanine dyes as near-infrared fluorescent probes for biomolecules. Bioconjugate Chem 1997, 8, 751–756. [Google Scholar]
  9. Garoff, R.A.; Litzinger, E.A.; Connor, R.E.; Fishman, I.; Armitage, B.A. Helical aggregation of cyanine dyes on DNA templates: Effect of dye structure on formation of homo- and heteroaggregates. Langmuir 2002, 18, 6330–6337. [Google Scholar]
  10. Hannah, K.C.; Armitage, B.A. DNA-templated assembly of helical cyanine dye aggregates: A supramolecular chain polymerization. Acc. Chem. Res 2004, 37, 845–853. [Google Scholar]
  11. Wang, M.M.; Silva, G.L.; Armitage, B.A. DNA-templated formation of a helical cyanine dye J-aggregate. J. Am. Chem. Soc 2000, 122, 9977–9986. [Google Scholar]
  12. Hannah, K.C.; Gil, R.R.; Armitage, B.A. H-1 NMR and optical spectroscopic investigation of the sequence-dependent dimerization of a symmetrical cyanine dye in the DNA minor groove. Biochemistry 2005, 44, 15924–15929. [Google Scholar]
  13. Seifert, J.L.; Connor, R.E.; Kushon, S.A.; Wang, M.; Armitage, B.A. Spontaneous assembly of helical cyanine dye aggregates on DNA nanotemplates. J. Am. Chem. Soc 1999, 121, 2987–2995. [Google Scholar]
  14. Barton, J.K.; Basile, L.A.; Danishefsky, A.; Alexandrescu, A. Chiral probes for the handedness of DNA helices-enantiomers of tris(4,7-diphenylphenanthroline)ruthenium(Ii). Proc. Natl. Acad. Sci. USA 1984, 81, 1961–1965. [Google Scholar]
  15. Xu, Y.; Zhang, Y.X.; Sugiyama, H.; Umano, T.; Osuga, H.; Tanaka, K. (P)-Helicenes displays chiral selection in binding to Z-DNA. J. Am. Chem. Soc. 2004, 126, 6566–6567. [Google Scholar]
  16. Balaz, M.; de Napoli, M.; Holmes, A.E.; Mammana, A.; Nakanishi, K.; Berova, N.; Purrello, R. A Cationic zinc porphyrin as a chiroptical sensor for Z-DNA. Angew. Chem. Int. Ed 2005, 44, 4006–4009. [Google Scholar]
  17. Seo, Y.J.; Kim, B.H. Probing the B-to-Z-DNA duplex transition using terminally stacking ethynyl pyrene-modified adenosine and uridine bases. Chem. Commun 2006, 150–152. [Google Scholar]
  18. Balaz, M.; Li, B.C.; Steinkguger, J.D.; Ellestad, G.A.; Nakanishi, K.; Berova, N. Porphyrins conjugated to DNA as CD reporters of the salt-induced B to Z-DNA transition. Org. Biomol. Chem 2006, 4, 1865–1867. [Google Scholar]
  19. Kim, Y.-G.; Lowenhaupt, K.; Maas, S.; Herbert, A.; Schwartz, T.; Rich, A. The Zab domain of the human RNA editing enzyme ADAR1 recognizes Z-DNA when surrounded by B-DNA. J. Biol. Chem 2000, 275, 26828–26833. [Google Scholar]
  20. Herbert, A.; Rich, A. The role of binding domains for dsRNA and Z-DNA in the in vivo editing of minimal substrates by ADAR1. Proc. Natl. Acad. Sci. USA 2001, 98, 12132–12137. [Google Scholar]
  21. Kim, Y.-G.; Lowenhaupt, K.; Oh, D.-B.; Kim, K.K.; Rich, A. Evidence that vaccinia virulence faktor E3L binds to Z-DNA in vivo-Implications for development of a therapy for poxvirus infection. Proc. Natl. Acad. Sci. USA 2004, 101, 1514–1518. [Google Scholar]
  22. Champ, P.C.; Maurice, S.; Vargason, J.M.; Camp, T.; Ho, P.S. Distributions of Z-DNA and nuclear factor I in human chromosome 22: A model for coupled transcriptional regulation. Nucleic Acids Res 2004, 32, 6501–6510. [Google Scholar]
  23. Rich, A.; Zhang, S. Z-DNA: The long road to biological function. Nat. Rev. Genet 2003, 4, 566–572. [Google Scholar]
  24. Herbert, A.; Rich, A. Left-handed Z-DNA: Structure and function. Genetica 1999, 106, 37–47. [Google Scholar]
  25. D’Urso, A.; Mammana, A.; Balaz, M.; Holmes, A.E.; Berova, N.; Lauceri, R.; Purrello, R. Interactions of a tetraanionic porphyrin with DNA: From a Z-DNA sensor to a versatile supramolecular device. J. Am. Chem. Soc 2009, 131, 2046–2047. [Google Scholar]
  26. D’Urso, A.; Kyu Choi, J.; Shabbir-Hussain, M.; Ngwa, F.N.; Lambousis, M.I.; Purrello, R.; Balaz, M. Recognition of left-handed Z-DNA of short unmodified oligonucleotides under physiological ionic strength conditions. Biochem. Biophys. Res. Commun 2010, 397, 329–332. [Google Scholar]
  27. Choi, J.K.; Sargsyan, G.; Shabbir-Hussain, M.; Holmes, A.E.; Balaz, M. Chiroptical detection of condensed Nickel(II)-Z-DNA in the presence of the B-DNA via porphyrin exciton coupled circular dichroism. J. Phys. Chem. B 2011, 115, 10182–10188. [Google Scholar]
  28. D’Urso, A.; Holmes, A.E.; Berova, N.; Balaz, M.; Purrello, R. Z-DNA recognition in B-Z-B sequences by a cationic zinc porphyrin. Chem. Asian J 2011, 6, 3104–3109. [Google Scholar]
  29. Chow, C.S.; Barton, J.K. Transition metal complexes as probes of nucleic acids. Methods Enzymol 1992, 212, 219–242. [Google Scholar]
  30. Barton, J.K.; Lolis, E. Chiral discrimination in the covalent binding of bis(phenanthroline)dichlororuthenium(II) to B-DNA. J. Am. Chem. Soc 1985, 107, 708–709. [Google Scholar]
  31. Barton, J.K.; Dannenberg, J.J.; Raphael, A.L. Enantiomeric selectivity in binding tris(phenanthroline)zinc(II) to DNA. J. Am. Chem. Soc 1982, 104, 4967–4969. [Google Scholar]
  32. Parkinson, A.; Hawken, M.; Hall, M.; Sanders, K.J.; Rodger, A. Amine induced Z-DNA in poly(dG-dC). poly(dG-dC): Circular dichroism and gel electrophoresis study. Phys. Chem. Chem. Phys 2000, 2, 5469–5478. [Google Scholar]
  33. Sheppard, S.E.; Geddes, A.L. Effect of solvents upon the absorption spectra of dyes. IV. Water as solvent: A common pattern. J. Am. Chem. Soc 1944, 66, 1995–2002. [Google Scholar]
Figure 1. Absorption data for Cy7 dye alone (black), and in the presence of poly(dA-dT)2 (light green), poly(dG).poly(dC) (green), poly(dG-dC)2 (blue), Co(III)-Z-poly(dG-dC)2 (red), and spermine-Z-poly(dG-dC)2 (orange). Conditions: [DNA] = 50 μM, [NaCl] = 10 mM, 5% MeOH in Na-cacodylate buffer (1mM, pH = 7.0).
Ijms 12 08052f1
Figure 2. CD spectra of Cy7 titrated to poly(dA-dT)2. Inset: intensity change of the CD signals at 770 nm and 686 nm as a function of the Cy7 concentration. Conditions: [poly(dA-dT)2] = 50 μM, [NaCl] = 10 mM, 5% MeOH in Na-cacodylate buffer (1 mM, pH = 7.0). Titration step: [Cy7] = 0.33 μM.
Ijms 12 08052f2
Figure 3. CD spectra of Cy7 titrated to poly(dG).poly(dC). Inset: intensity change of the CD signal as a function of the Cy7 concentration. Conditions: [poly(dG).poly(dC)] = 50 μM, [NaCl] = 10 mM, 5% MeOH + Na-cacodylate buffer (1 mM, pH = 7.0). Titration step: [Cy7] = 0.33 μM.
Ijms 12 08052f3
Figure 4. Titration of Cy7 to poly(dG-dC)2. Titration step: [Cy7] = 0.33 μM. Inset: intensity change of the CD signals at 622 nm and 686 nm as a function of the Cy7 concentration. Conditions: [poly(dG-dC)2] = 50 μM, [NaCl] = 10 mM, 5% MeOH + Na-cacodylate buffer (1 mM, pH = 7.0).
Ijms 12 08052f4
Figure 5. CD spectra of Cy7 titrated to poly(dG-dC)2. Inset: intensity change of the CD signal as a function of the Cy7 concentration. Titration step: [Cy7] = 2.0 μM. Conditions: [poly(dG-dC)2] = 50 μM, [NaCl] = 10 mM, 5% MeOH + Na-cacodylate buffer (1 mM, pH = 7.0).
Ijms 12 08052f5
Figure 6. CD spectra of Cy7 titrated to spermine induced Z-poly(dG-dC)2. Inset: intensity change of the CD signal as a function of the Cy7 concentration. Conditions: [Z-poly(dG-dC)2] = 50 μM, [spermine] = 10 μM, [NaCl] = 10 mM, 5% MeOH + Na-cacodylate buffer (1 mM, pH = 7.0). Titration step: [Cy7] = 2.0 μM.
Ijms 12 08052f6
Figure 7. CD spectra comparison of Cy7 bound to poly(dG-dC)2 (blue) and spermine induced Z-poly(dG-dC)2 (red). Inset: intensity change of the CD signal at 645 nm as a function of the Cy7 concentration. Conditions: [DNA] = 50 μM, [spermine] = 10 μM, [NaCl] = 10 mM, 5% MeOH + Na-cacodylate buffer (1 mM, pH = 7.0). Titration step: [Cy7] = 2.0 μM.
Ijms 12 08052f7
Chart 1. Structure of Cy3, Cy5, and Cy7.
Ijms 12 08052f8

