Article

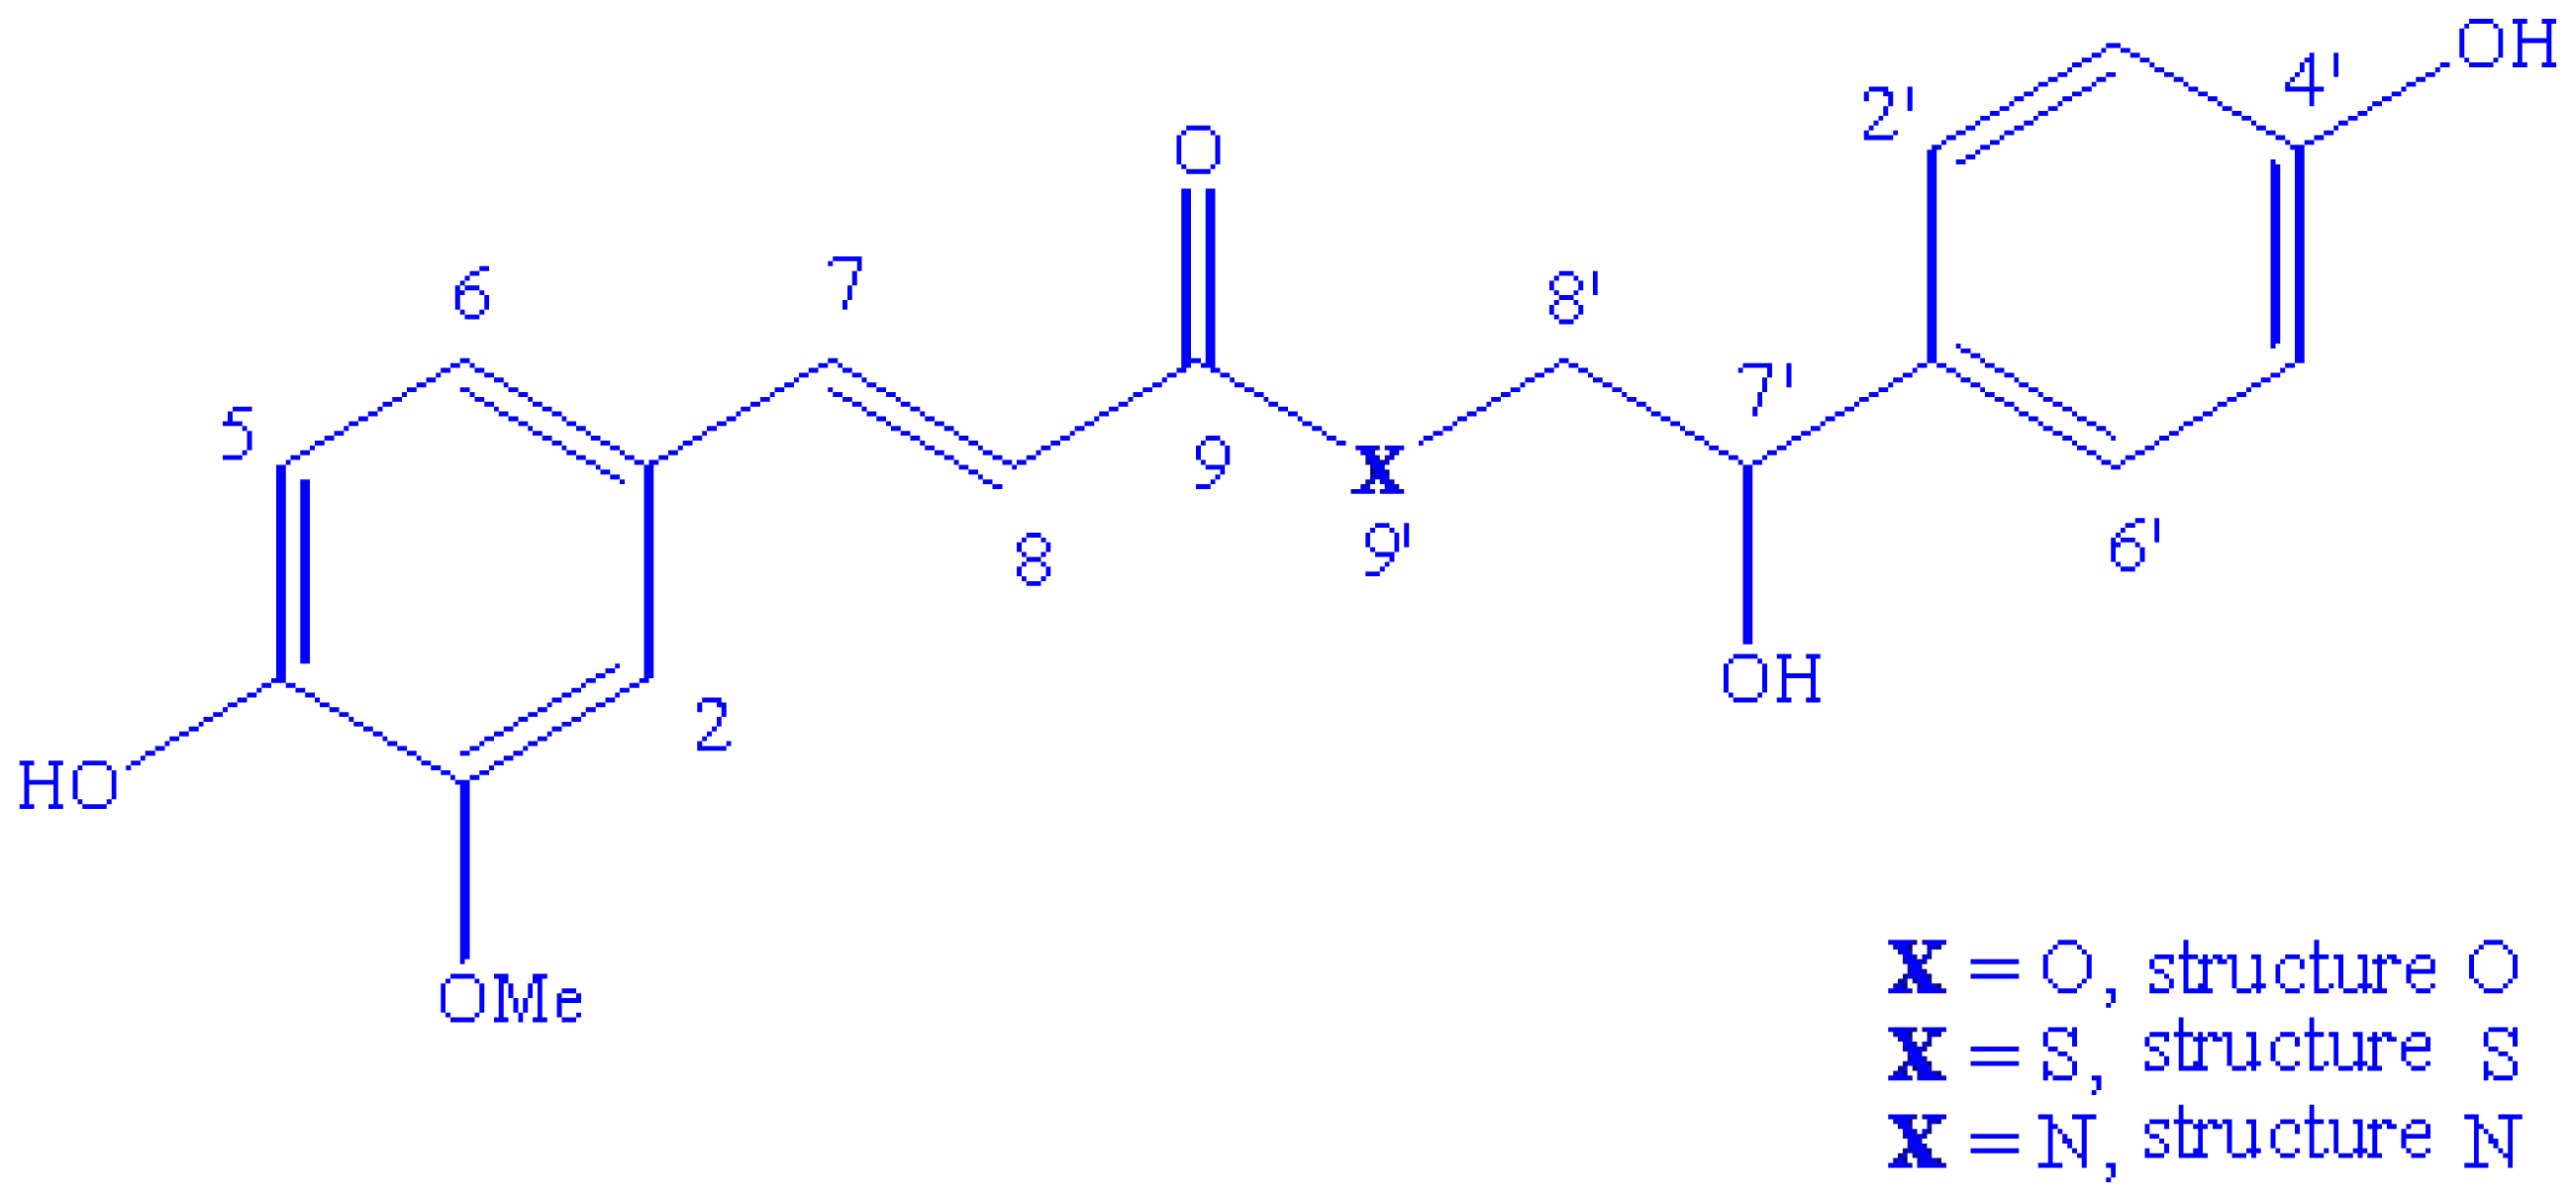
Identification of (−)(E)-N-[2(S)-Hydroxy-2-(4-hydroxyphenyl) ethyl]ferulamide, a Natural Product Isolated from Croton Pullei: Theoretical and Experimental Analysis

by
Silvana de O. Silva
1,
Rosana N.S. Peixoto
1,
José Rogério A. Silva
1,
Cláudio N. Alves
1,*,
Giselle M.S.P. Guilhon
1,
Lourivaldo S. Santos
1 and
Davi do S.B. Brasil
2,*
1
Faculty of Chemistry, Institute of Exact and Natural Sciences, Federal University of Pará, CP 11101, Belém, PA 66075-110, Brazil
2
Faculty of Chemistry Engineering, Institute of Technology, Federal University of Pará, Belém, PA 66075-110, Brazil
*
Authors to whom correspondence should be addressed.
Int. J. Mol. Sci. 2011, 12(12), 9389-9403; https://doi.org/10.3390/ijms12129389
Submission received: 31 August 2011 / Revised: 23 November 2011 / Accepted: 5 December 2011 / Published: 15 December 2011
(This article belongs to the Section Physical Chemistry, Theoretical and Computational Chemistry)

Abstract

:
Ferulic acid (FA) and its derivatives (FADs) are known for a variety of biological activities, such as photo-protective agent, antioxidant, antiatherogenic and antiplasmodial activities. During structural definition of a FAD isolated from Croton pullei, the possibility of a heterologous series made this definition difficult. In this regard, computational simulations were performed using theoretical calculations at DFT level to predict Infrared (IR) and Nuclear Magnetic Resonance (NMR) data. The IR and NMR 13C and 1H data were compared with the theoretical calculations performed for three structural possibilities of a heterologous series. The theoretical results were compared with the experimental data through linear regression in order to define the most probable structure and showed satisfactory values.

1. Introduction

Ferulic acid (FA) and its derivatives (FADs) have been isolated from in a vast number of plant species. FA is a phenolic compound found in plant cell wall components [1], especially in wheat, corn, rice, tomatoes, spinach, cabbage and asparagus [2]. It has a variety of biological activities, such as photo-protective agent [3] and antioxidant [4]. Additionally, some ferulic ester dimers are potential antiatherogenic and antiplasmodial agents [5].
Analysis of pure substances using nuclear magnetic resonance (NMR) spectroscopy is one of the steps for obtaining more information about the chemical nature of known or unknown organic compounds [6]. Due to the versatility of NMR techniques, as well as the amount of information that can be extracted from analyzing NMR spectra, such information is extremely important in natural product chemistry [6], the area where this tool is most applicable.
Complementary to NMR techniques, molecular modeling has appeared as an important set of computational tools for constructing, editing, visualizing and analyzing structural [7] of large [8,9] and small [1013] molecular systems. Several recent papers have been published comparing data from experimental NMR with theoretical calculations performed using various computational models. Published work comparing theoretical and experimental data may be found for julocrotine [14], also isolated from Croton pullei (Euphorbiaceae) [15]. Besides julocrotine, the chemical investigation of C. pullei led to identification of the alkaloids crotonimides A and B, together with the terpenoids, lupeol, ribenone, sitosterol, kaurenoic acid, stigmasterol, among other compounds [15,16]. The chemical study of C. pullei was retaken and another substance was isolated and identified as a FAD but the heteroatom of the position 9′ was not identified by experimental NMR techniques. NMR data points to three structural possibilities with different heteroatom in position 9′: oxygen (an ester) [17], nitrogen (an amide) [1820] or sulfur (a tioesther) (Figure 1). Thus, computational methods were used as an auxiliary tool for the elucidation of the structure of isolated natural products. All three structural possibilities were submitted to theoretical calculations using Density Functional Theory (DFT) [21]. Theoretical chemical shifts were compared with experimental data using linear regression, in order to define the heteroatom.

2. Results and Discussion

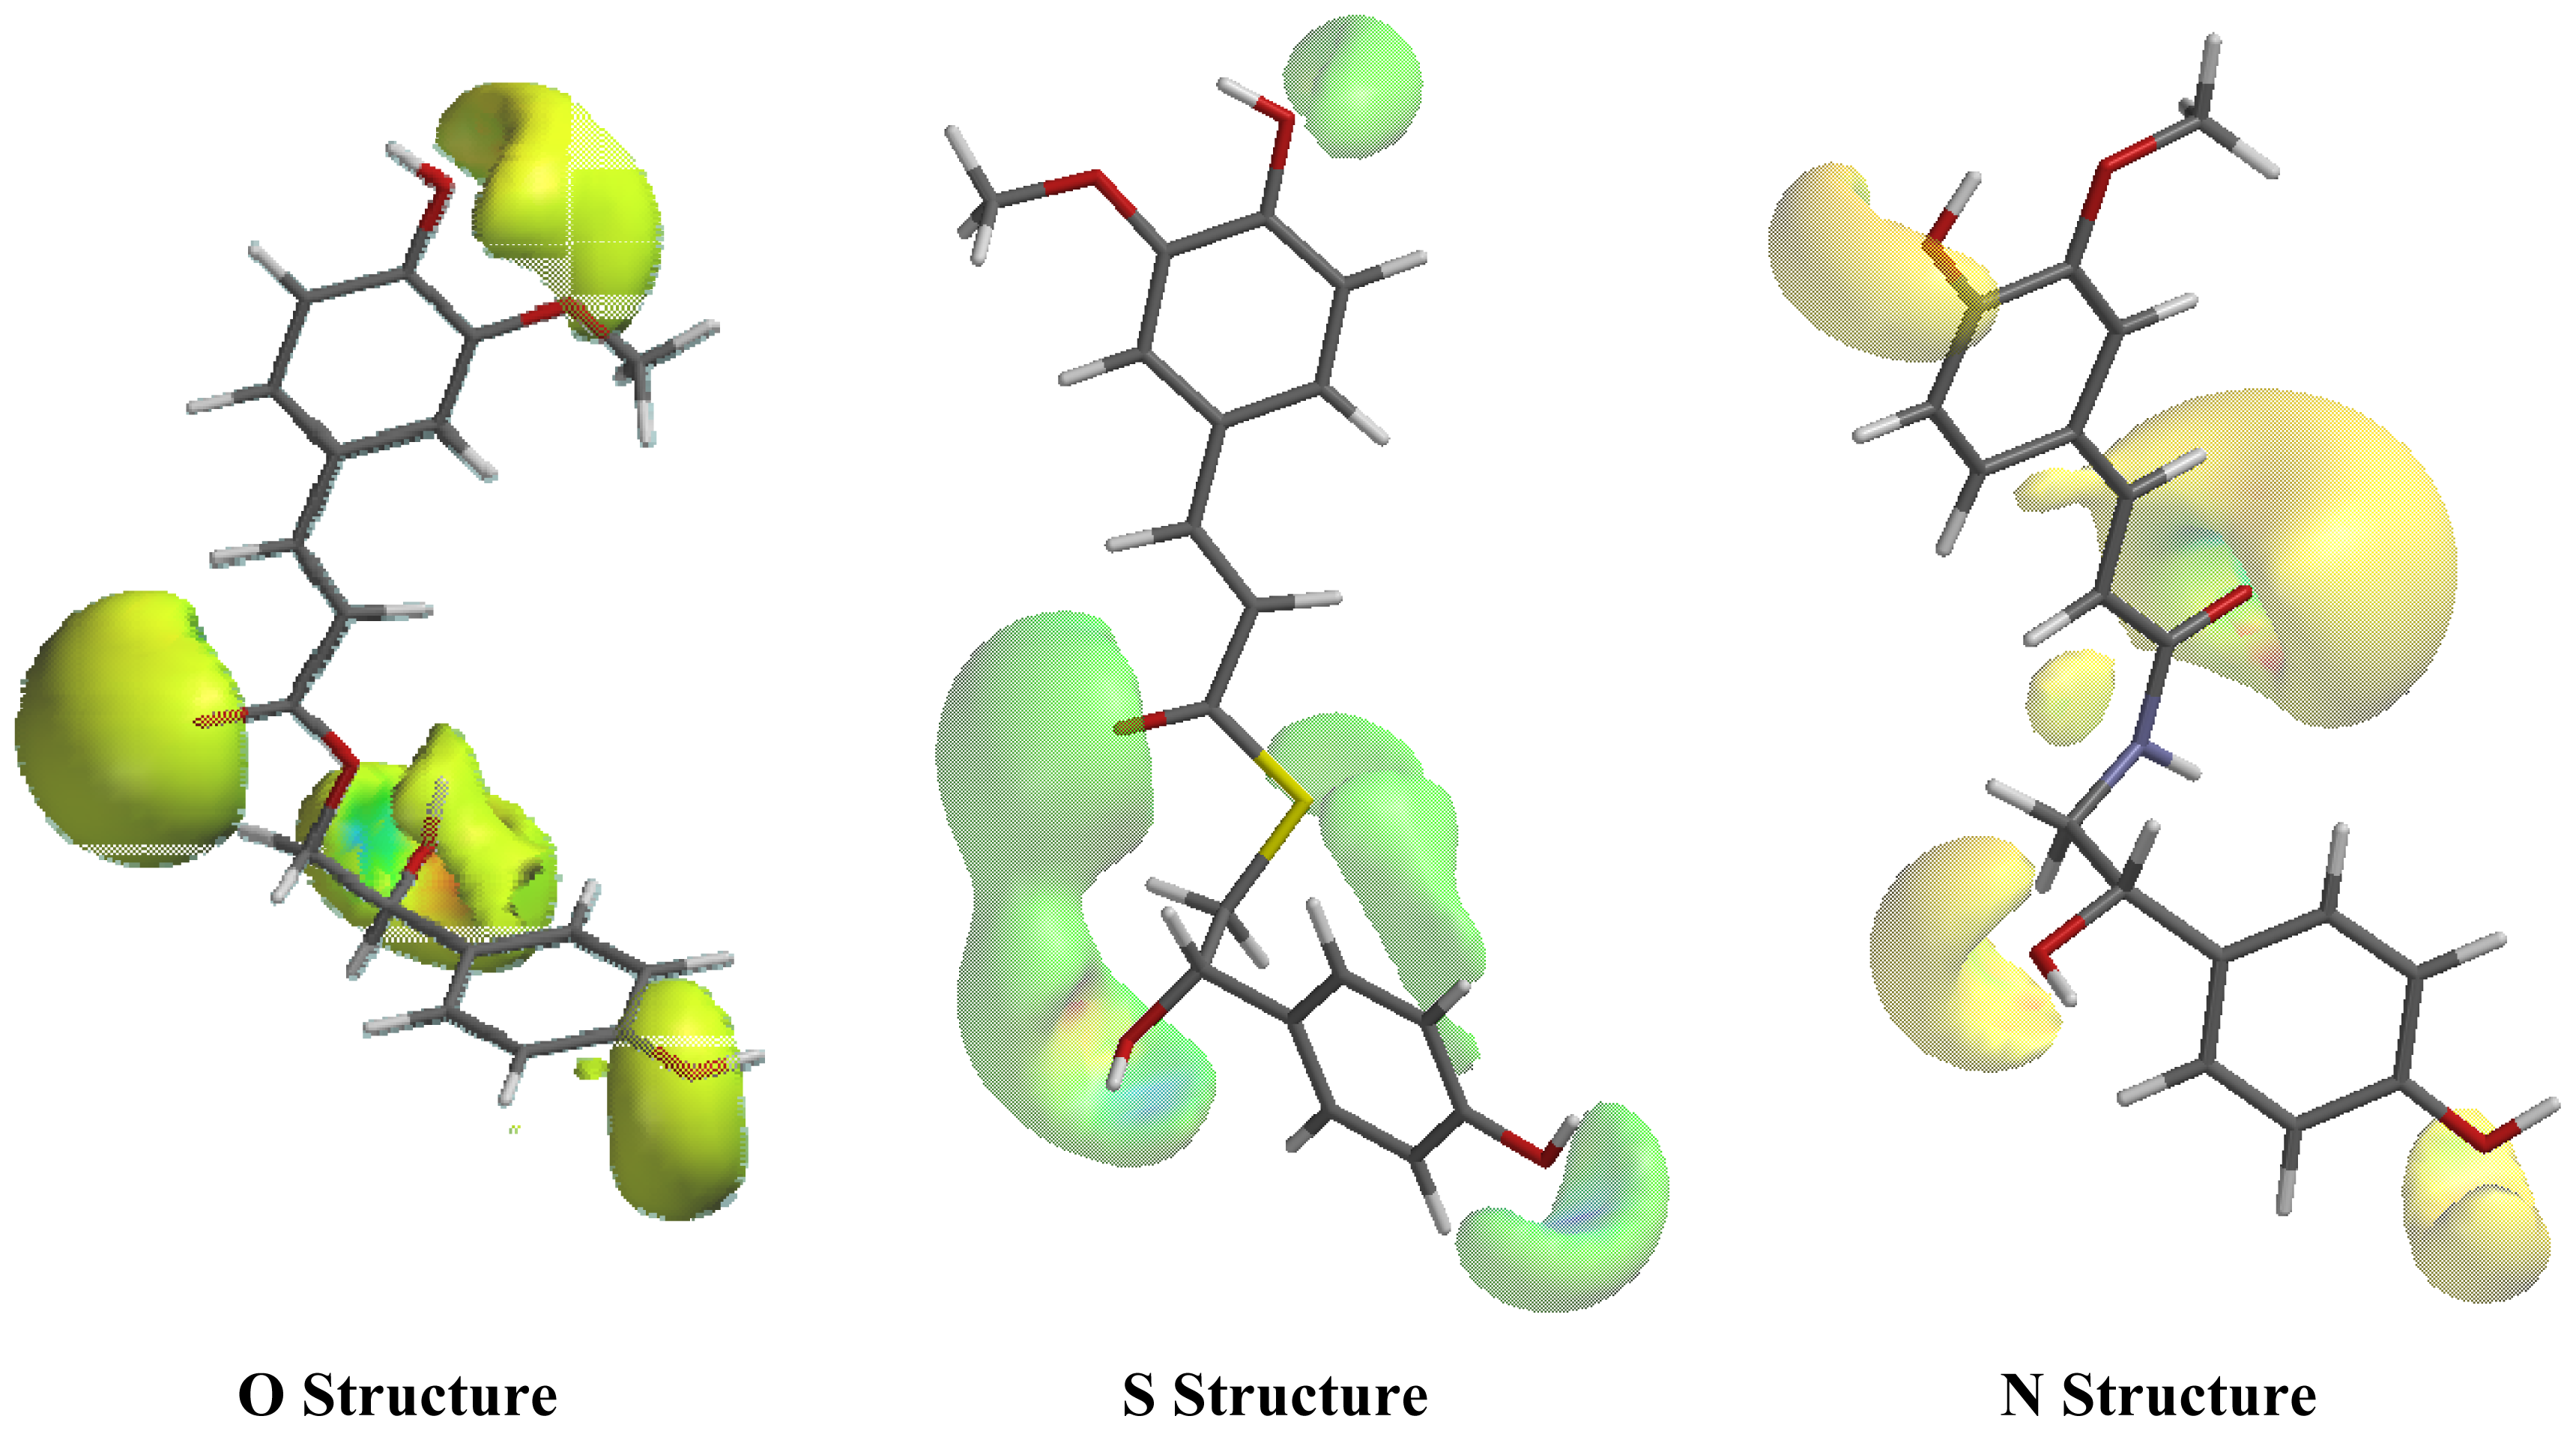
2.1. Conformational Analysis and Geometric Data

In Table S1 (see supplementary material) were presents the results to conformational analysis carried out to the O, S and N structures. The dihedral angle analyzed was C1′-C7′-C8′-X (X = O, S or N) for the three molecular structures. These results indicate that the conformers to each case have similar energies, thus we have selected two conformational structures to each compound (O, N and S) to start DFT calculations.
The data referring to the binding angles, binding distances and dihedral angles calculated using the B3LYP/6-31G(d,p) and B3LYP/6-31+G(d,p) methods (Table S2) after geometry optimization were analyzed to find the most probable heteroatom. As shown in Table S2, the structures calculated using B3LYP/6-31G(d,p) and B3LYP/6-31+G(d,p) showed very close bond lengths and bond angles for both conformers of structures O, S and N, however there are differences on the structural parameters between the three possibilities that are relevant especially near the O, S or N heteroatoms, as expected. The dihedral angle C1′-C7′-C8′-X obtained for the three structures possibilities (O, S and N structures) showed a difference of about 110° when calculated using B3LYP/6-31G(d,p) and B3LYP/6-31+G(d,p). While the calculated dihedral angle O7′-C7′-C8′-X varied significantly with the geometry change, the calculated dihedral angles C8′-X-C9-O9 e X-C9-C8-C7 were quite close. The dihedral angles C9-C8-C7-C1, C2-C3-O3-CMe and O4-C4-C3-O3 showed that the conformers are more sensitive to the geometry changes than to the applied DFT methods. So both methods can be used to describe the geometry of these molecules.

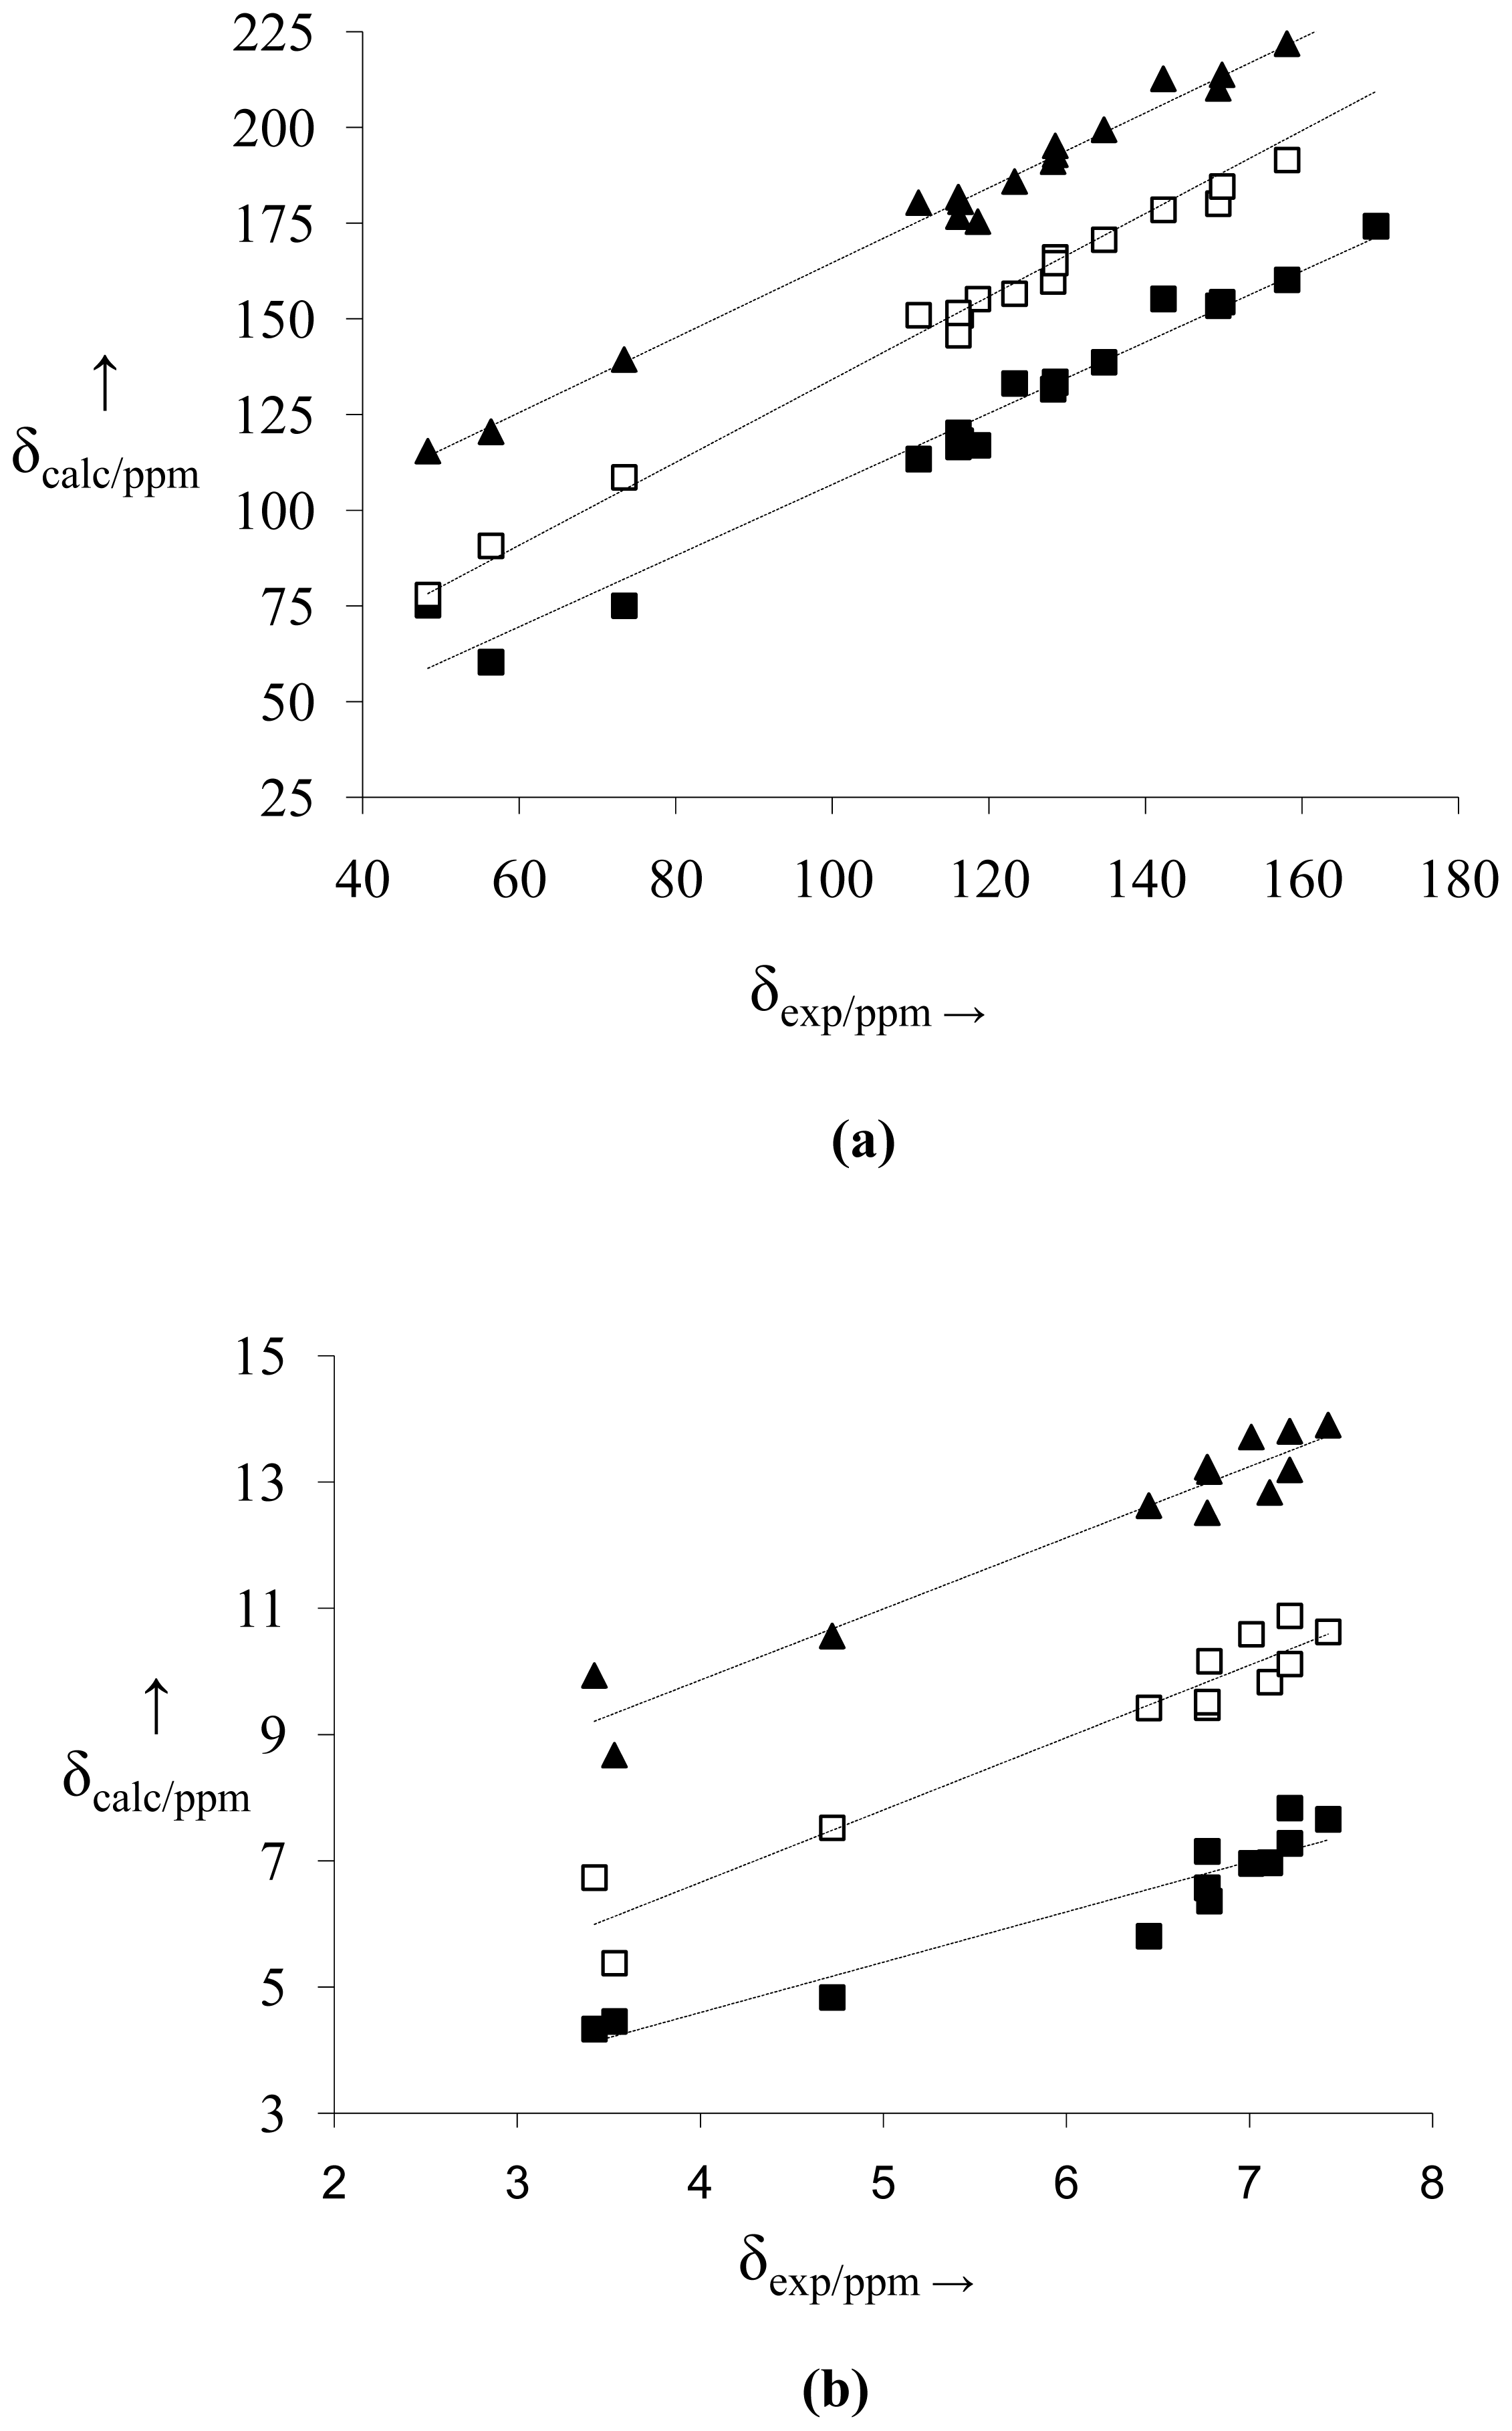
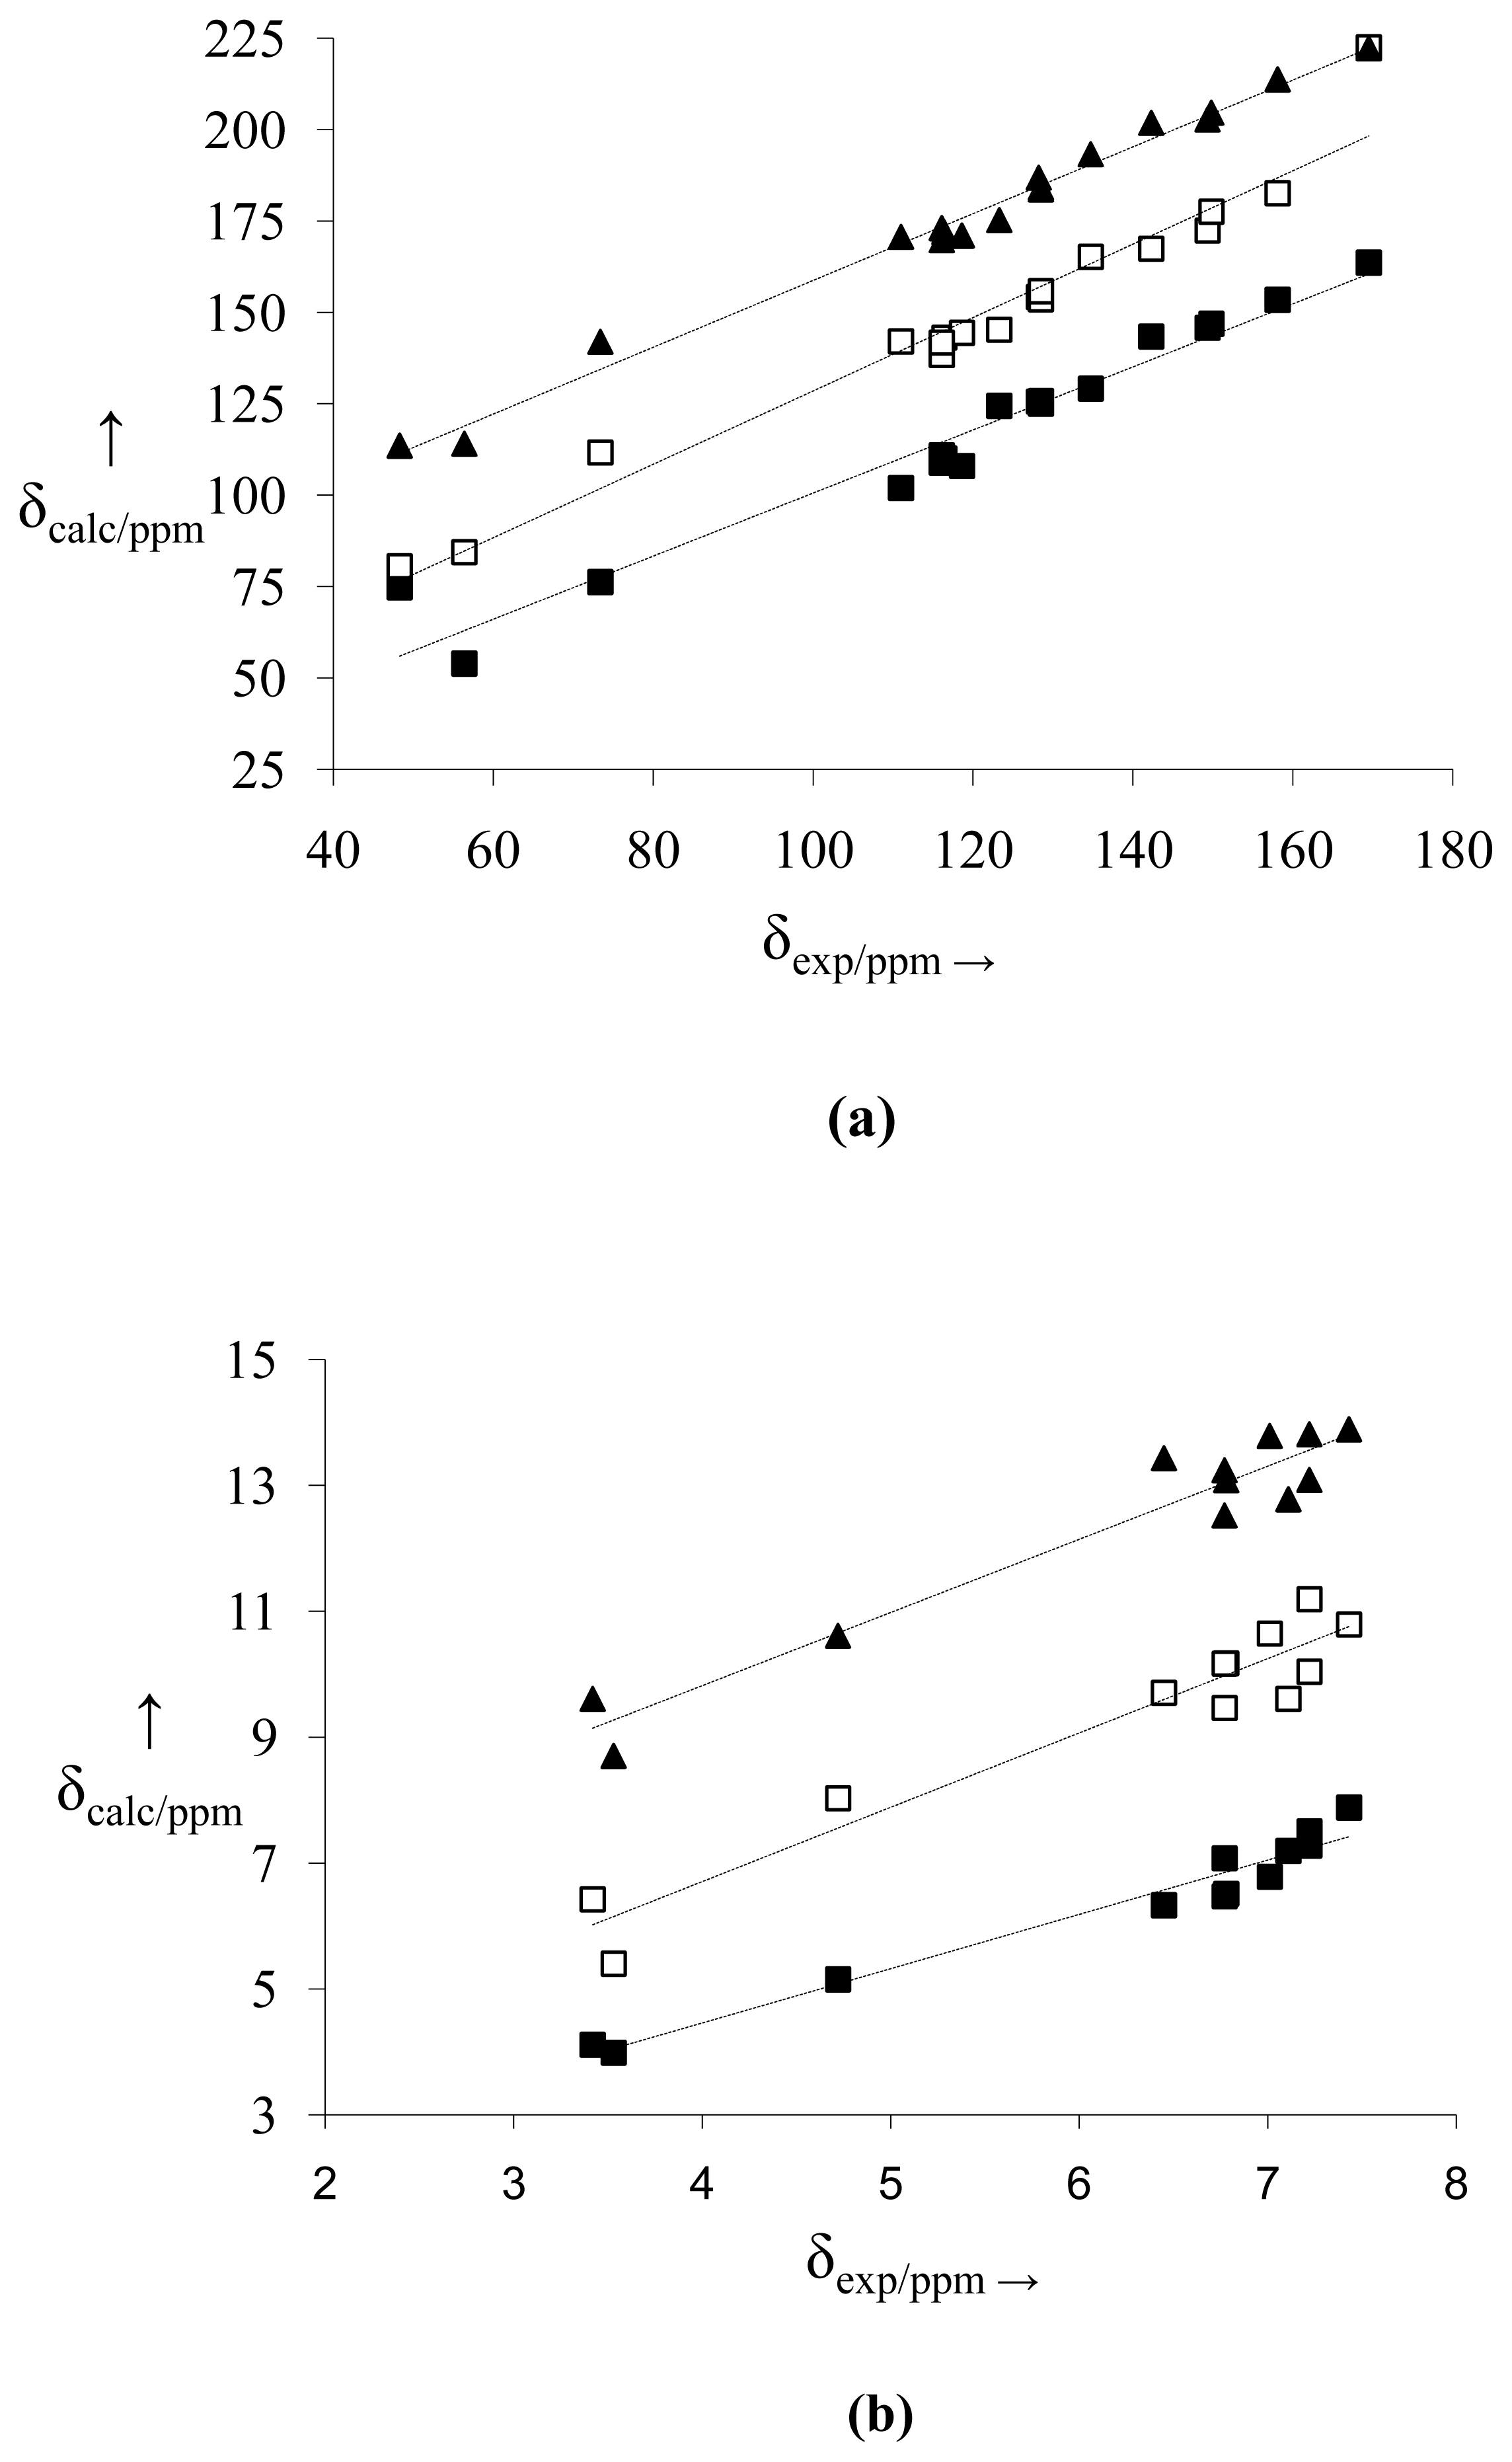
2.2. NMR Spectra and Statistical Analysis

The data for the FA, FADs and TMS (internal standard) (shielding constants of 32.1843 to 1H and 186.3296 to 13C) were calculated in gas phase at the B3PW91/DGDZVP and B3LYP/6-31+G(d,p) levels. The experimental and theoretical chemical shift for the 13C and 1H NMR data (chemical shifts) of the six structural possibilities of the FADs are showed in Tables 1 and 2 respectively, as well as the residue (RS) in ppm for each of the carbon and hydrogen atoms present in the structures. Tables 1 and 2 show the proximity existing between the values calculated by the DFT methodologies and those obtained experimentally for the O, S and N structures (Figures 1 and S1), which confirms the effectiveness of the computational model utilized for analyzing the possible structures. Consequently, the residual values in the structural region near the possible heteroatom provide an indication of which heteroatom may be the ligand of the studied FAD. This study showed that the proposed method can be used to identify unknown derivatives by the comparison between experimental and theoretical spectra. An example was carried out for the FA, confirming the effectiveness of computational methods (see Tables 3 and 4).
The structures with the nitrogen atom shows lower residue values for δ(13C) than those of the O and S structures. Residue values (RS) of 7.2; 1.9 ppm (B3PW91/DGDZVP) and 5.2; 7.2 ppm [B3LYP/6-31+G(d,p)], respectively were obtained for positions 8′ and 9, while for the same positions, the O and S structures showed RS = 26.9; 0.3 ppm (B3PW91/DGDZVP) and RS = 26.5; 2.3 ppm [B3LYP/6-31+G(d,p)] for carbon 8′, respectively, and for position 9 values of 4.7; 30.6 ppm (B3PW91/DGDZVP) and 5.9; 23.0 [B3LYP/6-31+G(d,p)], were found respectively. To explain the high residual values at position 8′ of the O structure (26.9 and 26.5 ppm) and at position 9 for the S structure (30.6 and 23.0 ppm) two electronic effects can be used. The first is the electronegativity difference between the three suggested heteroatoms: the oxygen is the most electronegative atom and deshields the carbon atom at position 8′, consequently, it will display the largest δ. The second is the electronic effect of resonance between the pair of free electrons of the suggested heteroatom with the carbonyl group in position 9. In the case of S structure, the atom is too large and the orbital overlap necessary for the resonance effect to take place, it is more difficult, leading to an electron shielding effect on the carbon atom of position 9, reveled in the largest δ (Figure 2). As expected, hydrogens of position 8′ of O structure are more deshielded by the heteroatom than those of N and S structures.
The indication of the N structure has also been suggested by analysis of the linear fit parameters presented in Table 4. The correlation coefficients (R2) acquired for δ(13C) were 0.99 [B3PW91/DGDZVP and B3LYP/6-31+G(d,p)] and 0.94 (B3PW91/DGDZVP) for δ(1H) for the N structure and these values are higher than those found for the other structures. The MAE (mean absolute error) for the three structures was significantly corrected by the method employed. The general correlation of the data of Table 4 is satisfactory, given that all the signals coming from the different functional groups are divided into their own distinct regions. Thus, the general reliability of those calculations is confirmed
The linear setting performed with the experimental chemical shift data and calculated using the B3PW91/DGDZVP and B3LYP/6-31+G(d,p) methods for the three structural possibilities may be observed in Figures 3 and 4, respectively, where the linear correlation graphs for NMR data for 13C (a) and 1H (b) are presented. Among the NMR data for 13C and 1H of the three cases, the N structure is the best linearly adjusted one, including in the region where the electronic cloud is most dense. Statistical analysis shows that all models of 1H and 13C presented good linear regression (90% < R2 < 99%) (Table 4). However, the best models for the cross-evaluation procedure were in calculating the N structure for 13C NMR in B3LYP/6-31+G (d,p) (F = 1269.99; s = 3.4479; sPRESS = 1.01 and Q2 = 98.3%), and 13C NMR in B3PW91/DGDZVP (F = 1675.82; s = 3.2676; sPRESS = 0.89 and Q2 = 98.86%).

2.3. Infrared Spectrum

Frequency calculations of the normal vibration modes of the proposed structures were performed with the B3LYP/6-31G(d,p) and B3LYP/6-31+G(d,p) methods and the values obtained for the main absorption bands are showed in Table 5. A large absorption band was detected in 3370 cm−1 characterizing the presence of hydrogen bonds (OH and NH groups) in the experimental spectrum. The value obtained utilizing theoretical calculations for NH were 3612 cm−1 [B3LYP/6-31G(d,p)] and 3825 cm−1 [B3LYP/6-31+G(d,p)]; the vibration of OH groups for O, S and N structures were observed in 3782–3823 cm−1 [B3LYP/6-31G(d,p)] and 3828–3807 cm−1 [B3LYP/6-31+G(d,p)], 3760–3822 cm−1 [B3LYP/6-31G(d,p)] and 3828–3633 cm−1 [ B3LYP/6-31+G(d,p)] and 3763–3822 cm−1 [B3LYP/6-31G(d,p)] and 3824–3771 cm−1 [ B3LYP/6-31+G(d,p)], respectively. The carbonyl stretching band was 1680 cm−1 and the values obtained theoretically were, respectively, 1794 cm−1 [B3LYP/6-31G(d,p)] and 1768 cm−1 [B3LYP/6-31+G(d,p)] (O structure), 1754 cm−1 [B3LYP/6-31G(d,p)] and 1701 cm−1 [B3LYP/6-31+G(d,p)] (S structure) and 1758 cm−1 [B3LYP/6-31G(d,p)] and 1727 cm−1 [B3LYP/6-31+G(d,p)] (N structure). The asymmetric deformation of CH3 groups, was 1510 cm−1, and the values obtained by the computational method were 1504 cm−1 [B3LYP/6-31G(d,p)] and 1509 cm−1 [B3LYP/6-31+G(d,p)], 1502 cm−1 [B3LYP/6-31G(d,p)] and 1509 cm−1 [B3LYP/6-31+G(d,p)] and 1501 cm−1 [B3LYP/6-31G(d,p)] and 1510 cm−1 [B3LYP/6-31+G(d,p)] for the O, S and N structures, respectively. The data acquired with the two methodologies for the possible O, S and N structures, as expected, are close, because they are in the same range of absorption in the infrared experimental spectrum.

2.4. Polarimetry

The [α]D25 = −16° obtained experimentally indicate that the enantiomer isolated has absolute configuration S in the position 7′. Similar result was obtained by Dellagreca et al. [18].

3. Experimental Section

3.1. Collection and Extraction

Stems of C. pullei (1.00 kg) were collected in the municipality of Peixe-boi (PA, Brazil) and identified by Ricardo Secco, a botanist at the Museu Paraense Emílio Goeldi (Belém-PA, Brazil). The stems was air dried, ground and extracted by percolation with hexane (7 days) and methanol (14 days), with filtrations every 3 or 4 days. The solutions were concentrated under vacuum in a rotary evaporator, resulting in hexane extract (0.65 g) and methanolic extract (80.00 g). Part of the methanolic extract (40.00 g) was submitted to partition with dichloromethane, ethyl acetate and n-butanol. The resulting solutions were concentrated in a rotary evaporator. The dichloromethane phase (4.80 g) was fractionated by column chromatography (CC) in silica, using mixtures of hexane, ethyl acetate and methanol in gradients of increasing polarities as eluents. The column fraction eluted with the mixture of hexane-AcOEt 60% was submitted to column chromatography procedure on Sephadex LH-20 using methanol as eluent, leading to isolation of 35 mg of the FAD. [α]D25 = −16° (c 0.01, CH3OH), IR spectra were recorded in KBr in the spectrometer Nicolet IS10 FT-IR of Thermo Scientific) and 1H and 13C NMR data were obtained at 300 and 75.4 MHz, respectively, in CDCl3 using the solvent peak as the internal standard.

3.2. Computational Method

The O, N and S structures were drawn using HyperChem Release 7.5 software [23] and submitted to an initial optimization at PM3 [24]. In addition, the conformational analysis was carried out to confirm the minimum energy structure to the three possible structures (O, N and S), by carrying out a series of partial optimizations constraining the concerned dihedral angle step by step within the appropriate range, with a step size of 10°, these calculations were carried out using the HF/STO-3G basis set, the dihedral angle analyzed was C1′-C7′-C8′-X (X = O, S or N) for the three molecular structures. Previous studies about the importance of conformational analysis involving NMR calculations has been published [25,26] for a large number of natural products. The molecular structures were optimized with the Gaussian® 03W [27] program, using the hybrid functional B3LYP together with the 6-31G(d,p) and 6-31G+(d,p) basis set. Vibrational analysis was performed using the procedure contained in the Gaussian® 03W package [27] with the DFT method using the B3LYP/6-31G(d,p) and B3LYP/6-31+G(d,p) levels, in the gas phase. This ensured that each gradient optimization located indeed a true minimum energy structure (no imaginary frequencies). The normal vibration modes were visualized using the Hyperchem 7.5 program [23]. Data for NMR (13C and 1H chemical shifts) were calculated using the DFT/B3PW91/DGDZVP and B3LYP/6-31+G(d,p) methods in vacuum. Recently, we have successfully used DFT/B3PW91/DGDZVP methodology to study 1H and 13C NMR spectra of cordatin [28] and 8-epicordatin [29]. Two conformers each structure (O, N and S) were submitted to DFT calculations by different methodologies (see Table S3); we chose this methods because the energies of the conformers are similar. The Spartan ′08 program [30] was utilized to calculate electrostatic potential surfaces of the O, S and N structures utilizing the DFT/B3LYP/6-31G(d,p) method.

3.3. Statistical Analysis

MINITAB14 [31] software was employed for statistical analysis of NMR linear regression data. The correlation coefficients (R2), the Fischer values (F) and the standard deviation (s) were the statistical parameters chosen for this analysis. For each one of the conformer of the molecules studied (O, N and S structures) parameters are presented for linear adjustment a and b: δcalc = a + bδexp, mean absolute error: MAE = ∑|δcalc – δexp|/n and corrected mean absolute error: CMAE = ∑| δcorr – δexp|/n [32]. These parameters, calculated for experimental and theoretical data in these structures, allow the study of chemical displacements (ppm), as well as of residues: RS = |δexp – δcalc|of the hydrogen and carbon atoms and the influence of the heteroligands involved in the region next to positions 8 and 9′.
The equations obtained were tested for their predictive power using a cross-validation procedure, which is a practical and reliable method for testing significance. This approach, known as “leave on out”, consists in developing a number of models with one sample omitted at the time. After these models are obtained, the omitted data are predicted and the differences between the real and predictor values are calculated. The sum of the squares of this difference is computed, and finally, the performance of the model (its predictive capacity) can be given by PRESS (predicted sum of squares) and by sPRESS (standard deviation of the cross-validation) [33]:
PRESS = i = 1 n ( y i - y ^ i ) 2 s PRESS = PRESS n - k - 1
where y is the experimental value, is the predictor value, n is the number of samples used for the construction model and k is the number of NMR parameters.
The predictive capacity [33] for the model was also quantified in terms of Q2, which is defined as:
Q 2 = 1.0 - i = 1 n ( y i - y ^ i ) 2 i = 1 n ( y i - y ¯ i ) 2 where , y ¯ = y m e a n

4. Conclusions

Computational calculations performed at the DFT level for a heterologous series showed excellent results. The computational method together with the 13C and 1H NMR and polarimetric analysis confirmed that the ferulic acid derivative present in a the stems of C. pullei is (−)(E)-N-[2(S)-Hydroxy-2-(4-hydroxyphenyl)ethyl]ferulamide. Thus the heteroatom of position 9′ is a nitrogen atom (N). The statistical parameters revealed that the B3PWP1/DGDZVP and B3LYP/6-31+G(d,p) methodology tested for FADs and FA offer good predictive capacity and good significance. The N structure present the vest values for R2, F, sPRESS and Q2 after cross-evaluation to 13C NMR data.

Acknowledgements

The authors would like to thank CNPq, FAPESPA and PROPESP/PARD-UFPA for their financial support.

References

  1. Sarangi, P.K.; Nanda, S.; Sahoo, H. Enhancing the rate of ferulic acid bioconversion using different carbon sources. J. Brew. Distill 2011, 2, 1–4. [Google Scholar]
  2. Anselmi, C.; Bernardi, F.; Centini, M.; Gaggelli, E.; Gaggelli, N.; Valensin, D.; Valensin, G.M. Interaction of ferulic acid derivatives with human erythrocytes monitored by pulse field gradient NMR diffusion and NMR relaxation studies. Chem. Phys. Lipids 2005, 134, 109–117. [Google Scholar]
  3. Anselmi, C.; Centini, M.; Maggiore, M.; Gaggelli, N.; Andreassi, M.; Buonocore, A.; Beretta, G.; Facino, R.M. Non-covalent inclusion of ferulic acid with α-cyclodextrin improves photo-stability and delivery: NMR and modeling studies. J. Pharm. Biomed. Anal 2008, 46, 645–652. [Google Scholar]
  4. Graf, E. Antioxidant potential of ferulic acid. Free Radic. Biol. Med 1992, 13, 435–448. [Google Scholar]
  5. Rakotondramanana, D.L.A.; Delomenède, M.; Baltas, M.; Duran, H.; Bedos-Belval, F.; Rasoanaivo, P.; Negre-Salvayre, A.; Gornitzka, H. Synthesis of ferulic ester dimers, functionalisation and biological evaluation as potential antiatherogenic and antiplasmodial agents. Bioorg. Med. Chem 2007, 15, 6018–6026. [Google Scholar]
  6. Chemistry of Natural Products. Available online: http://quiprona.wordpress.com/2009/06/17/analises-por-rmn-alguns-cuidados accessed on 13 April 2011.
  7. Carvalho, I.; Pupo, M.T.; Borges, Á.D.L.; Bernardes, L.S.C. Introdução a modelagem molecular de fármacos no curso experimental de química farmacêutica. Quim. Nova 2003, 26, 428–438. [Google Scholar]
  8. Tikhele, S.H.; Pissurlenkar, R.R.S.; Srivastava, S.; Saran, A.; Coutinho, E.C. Mapping interactions of gastric inhibitory polypeptide with GIPR N-terminus using NMR and molecular dynamics simulations. J. Pept. Sci 2010, 16, 383–391. [Google Scholar]
  9. Silva, J.R.A.; Lameira, J.; Santana, P.P.B.; Silva, A.; Schneider, M.P.C.; Alves, C.N. Homology modeling and molecular dynamics simulation of an alpha methyl coenzyme M reductase from Methanogenic archea. Int. J. Quantum Chem 2010, 110, 2067–2075. [Google Scholar]
  10. Plaza, A.; Piacente, S.; Perrone, A.; Hamed, A.; Pizza, C.; Bifulco, G. Stemmosides C and D, two novel unusual pregnane glycosides from Solenostemma argel: Structural elucidation and configurational study by a combined NMR-quantum mechanical strategy. Tetrahedron 2004, 52, 12201–12209. [Google Scholar]
  11. Wang, F.D.; Wang, T.; Wu, A.A.; Ding, L.; Wang, H.Q. X-ray and DFT study of glaucocalyxin A compound with cytotoxic activity. Chin. J. Chem. Phys 2009, 22, 275–284. [Google Scholar]
  12. Wang, T.; Tang, F.; Zhang, Y.; Chen, Z. A natural diterpenoid kamebacetal A with anti-tumor activity: Theoretical and experimental study. J. Mol. Struct 2010, 975, 317–322. [Google Scholar]
  13. Azizoglu, A.; Ozer, Z.; Kilic, T. An experimental and theoretical study on siderol isolated from Sideritis species. Collect. Czech. Chem. Commun. 2011, 76, 95–114. [Google Scholar]
  14. Moreira, R.Y.O.; Brasil, D.S.B.; Alves, C.N.; Guilhon, G.M.S.P.; Santos, L.S.; Arruda, M.S.P.; Muller, A.H.; Barbosa, P.S.; Abreu, A.S.; Silva, E.O.; et al. Crystal structure and theoretical calculations of julocrotine, a natural product with antileishmanial activity. Int. J. Quantum Chem 2008, 108, 513–520. [Google Scholar]
  15. Barbosa, P.S.; Abreu, A.; Batista, E.F.; Guilhon, G.M.S.P.; Muller, A.H.; Arruda, M.S.P.; Santos, L.S.; Arruda, A.C.; Secco, R.S. Glutarimide alkaloids and terpenoids from Croton pullei var glabrior Lanj. Biochem. Syst. Ecol 2007, 35, 887–890. [Google Scholar]
  16. Abreu, A.S.; Barbosa, P.S.; Müller, A.H.; Guilhon, G.M.S.P. Constituintes químicos do caule e das cascas do caule de Croton pullei var. glabrior (Euphorbiaceae). Rev. Virtual Iniciaç. Acad. UFPA 2001, 1, 1–9. [Google Scholar]
  17. Lee, H.; Oh, S.; Kwon, O.; Ahn, K.; Lee, J.; Kim, J.; Min, B.; Joung, H. Isolation of coumarins and ferulate from the roots of Angelica purpuraefolia and the antitumor activity of khellactone. Phytother. Res 2007, 21, 406–409. [Google Scholar]
  18. Dellagreca, M.; Previtera, L.; Purcaro, R.; Zarrelli, A. Cinnamic acid amides and lignanamides from Aptenia cordifolia. Tetrahedron 2006, 62, 2877–2882. [Google Scholar]
  19. Lee, D.G.; Park, Y.; Kim, M.; Jung, H.; Seu, Y.; Hahm, K.; Woo, E. Anti-fungal effects of phenolic amides isolated from the root bark of Lycium chinense. Biotechnol. Lett 2004, 26, 1125–1130. [Google Scholar]
  20. Nesterenko, V.; Putt, K.S.; Hergenrother, J. Identification from a combinatorial library of a small molecule that selectively induces apoptosis in cancer Cells. J. Am. Chem. Soc 2003, 125, 14672–14673. [Google Scholar]
  21. Lee, C.; Yang, W.; Parr, R.G. Development of the colle-salvetti correlation-energy formula into a funtional of the electron density. Phys. Rev 1998, 37, 785–789. [Google Scholar]
  22. Prachayasittikul, S.; Suphapong, S.; Worachartcheewan, A.; Lawung, R.; Ruchirawat, S.; Prachayasittikul, V. Bioactive Metabolites from Spilanthes acmella Murr. Molecules 2009, 14, 850–867. [Google Scholar]
  23. HyperChem, version 7.5; Hypercube, Inc: Gainesville, FL, USA, 2002.
  24. Stewart, J.J.P. Optimization of parameters for semiempirical methods I. Method. J. Comput. Chem 1989, 10, 209–220. [Google Scholar]
  25. Smith, S.G.; Goodman, J.M. Assigning the stereochemistry of paris of diastereoisomers using GIAO NMR shift calculation. J. Org. Chem 2009, 74, 4597–4607. [Google Scholar]
  26. Franks, W.T.; Zhou, D.H.; Wylie, B.J.; Money, B.G.; Graesser, D.T.; Frericks, H.L.; Sahota, G.; Rienstra, C.M. Magic-angle spinning solid-state nmr spectroscopy of the β1 immunoglobulin binding domain of protein G (GB1): 15N and 13C chemical shift assignments and conformational analysis. J. Am. Chem. Soc 2005, 127, 12291–12305. [Google Scholar]
  27. Gaussian 03, Revision C.02; Gaussian, Inc: Wallingford, CT, USA, 2004.
  28. Brasil, D.S.B.; Alves, C.N.; Guilhon, G.M.S.P.; Muller, A.H.; Secco, R.S.; Gabriel, R.; Llusar, P. Crystal structure and theoretical study of IR and 1H and 13C NMR spectra of cordatin, a natural product with antiulcerogenic activity. Int. J. Quantum Chem. 2008, 108, 2564–2575. [Google Scholar]
  29. Brasil, D.S.B.; Muller, A.H.; Guilhon, G.M.S.P.; Alves, C.N.; Peris, G.; Llusard, R.; Molinerd, V. Isolation, X-ray Crystal structure and theoretical calculations of the new compound 8-epicordatin and identification of others terpenes and steroids from the bark and leaves of Croton palanostigma Klotzsch. J. Braz. Chem. Soc 2010, 21, 731–739. [Google Scholar]
  30. Spartan software, version 8; Wavefunction, Inc: Irvine, CA, USA, 2008.
  31. MINITAB, MINITAB Release 14; MINITAB: State College, PA, USA, 2003.
  32. Cimino, P.; Gomez-Paloma, L.; Duca, D.; Riccio, R.; Bifulco, G. Comparison of different theory models and basis sets in the calculation of 13C NMR chemical shifts of natural products. Magn. Reson. Chem 2004, 42, S26–S33. [Google Scholar]
  33. Gaudio, A.C.; Zandonade, E. Proposição, validação e análise dos modelos que correlacionam estrutura química e atividade biológica. Quim. Nova 2001, 24, 658–671. [Google Scholar]
Figure 1. Planar visualization of O, S and N structure.
Ijms 12 09389f1
Figure 2. Electrostatic potential surfaces of the O, S and N structures optimized in B3LYP/6-31G(d,p).
Ijms 12 09389f2
Figure 3. Correlation between experimental and calculated (B3PW91/DGDZVP) chemical shifts of 13C (a) and 1H (b) for structures O (■), S (□) and N (▴). NMR data of the structures S and N were displaced from 30 to 60 ppm (13C NMR) and from 3 to 6 ppm (1H NMR), respectively. For each set of data the linear fitting is also reported as a dashed line.
Ijms 12 09389f3
Figure 4. Correlation between experimental and calculated [B3LYP/6-31+G(d,p)] chemical shifts of 13C (a) and 1H (b) for structures O (■), S (□) and N (▴). NMR data of the structures S and N were displaced from 30 to 60 ppm (13C NMR) and from 3 to 6 ppm (1H NMR), respectively. For each set of data the linear fitting is also reported as a dashed line.
Ijms 12 09389f4
Table 1. Experimental 13C nuclear magnetic resonance (NMR) data (Exp.), calculated 13C NMR data (Calc.) with B3PW91/DGDZVP and residue (RS) in ppm for the O, S and N structures.
B3PW91/DGDZVPB3LYP/6-31+G(d,p)

PositionExp.Structure OStructure SStructure NStructure OStructure SStructure N

Calc.RSCalc.RSCalc.RSCalc.RSCalc.RSCalc.RS
1128.2131.63.4129.81.6131.02.8125.72.5124.24.0126.81.4
2111.0113.42.3121.010.0120.39.3101.99.0112.11.1110.70.3
3149.3153.54.2150.20.8150.20.9145.93.4142.56.9142.86.4
4149.8154.44.6154.74.9153.73.9146.92.9147.52.3144.65.2
5116.4118.31.9120.94.5120.64.2110.26.2113.23.2111.94.5
6123.3133.29.9126.63.3125.92.6124.41.1115.38.0115.28.1
7142.3155.212.9148.56.2152.710.4143.51.2137.54.8141.80.5
8118.6117.01.6125.36.7115.43.2108.010.6114.44.2110.97.6
9169.5174.24.7200.130.6171.41.9163.65.9192.523.0162.37.2
1′134.7138.74.0140.76.0139.44.7129.25.5135.20.5133.31.4
2′128.5133.65.1136.07.5132.94.4125.82.7123.64.9124.14.4
3′116.1120.34.2115.70.4121.85.7110.95.1108.47.7113.03.1
4′158.1160.32.3161.63.4161.93.8153.44.7152.65.5153.74.4
5′116.1116.60.5121.65.5116.70.6108.97.2111.84.3109.76.4
6′128.5133.44.9134.66.1135.26.7125.03.5125.82.8123.64.9
7′73.475.11.778.65.279.45.976.22.881.78.381.98.6
8′48.375.326.947.90.355.57.274.826.550.62.353.55.2
OMe56.460.73.960.74.360.54.153.92.5154.42.054.02.4
RS = |δexp – δcalc|
Table 2. Experimental 1H NMR data (Exp.), calculated 1H NMR data (Calc.) with B3PW91/DGDZVP and residue (RS) in ppm for the O, S and N structures.
B3PW91/DGDZVPB3LYP/6-31+G(d,p)

PositionExp.Structure OStructure SStructure NStructure OStructure SStructure N

Calc.RSCalc.RSCalc.RSCalc.RSCalc.RSCalc.RS
27.116.970.146.830.286.830.287.190.086.610.506.780.33
56.786.370.417.160.387.170.396.510.277.170.397.080.30
67.016.960.057.590.587.710.706.780.237.650.647.790.78
77.437.660.237.630.207.900.477.880.457.790.367.890.46
86.455.810.646.420.036.620.176.330.126.710.267.430.98
2′7.227.280.067.120.107.800.587.280.067.040.187.810.59
3′6.777.150.386.430.347.230.467.080.316.470.307.240.47
5′6.776.570.207.210.446.510.266.470.307.170.406.520.25
6′7.227.840.627.880.667.190.037.510.298.200.987.090.13
7′4.724.840.124.520.204.560.165.150.435.030.314.610.11
8′ a3.534.460.932.381.152.670.863.990.462.401.132.700.83
8′ b3.424.330.913.730.313.940.524.110.693.430.013.610.19
RS = |δexp – δcalc|
Table 3. Experimental [22] 1H and 13C NMR data, calculated 1H NMR data (Calc.) with B3LYP/6-31+G(d,p) and residues (RS) in ppm for the FA.
Position13C1H

Exp. [22]Calc.RSExp. [22]Calc.RS
1127.8126.11.6--
2111.6113.51.87.26.70.5
3151.5145.16.4--
4149.9145.74.2--
5116.5111.45.16.86.60.2
6123.9113.610.47.57.50.4
C-α115.9107.78.26.36.50.2
C-β146.9147.20.37.67.80.2
C=O171.2162.78.5--
OMe-356.553.92.53.93.80.1
RS = |δexp – δcalc|
Table 4. Correlation and linear adjustment parameters for the NMR properties of the O, S and N structures and ferulic acid (FA).
δabR2MAECMAEsPRESSsPRESSFQ2
B3PW91/DGDZVPδ(1H) O0.801.410.900.390.400.49103.67940.1986.1184.12%
δ(1H) S1.16−0.980.940.390.310.41823.08960.18122.4986.67%
δ(1H) N1.13−0.640.940.410.310.38562.66610.16145.8388.50%
δ(13C) O0.9313,870.965.494.326.3579959.8791.94430.8894.69%
δ(13C) S1.08−4.110.975.973.535.7831913.8861.89524.1294.94%
δ(13C) N0.986.860.994.572.213.2676205.1890.891675.8298.86%

B3LYP/6- 31+G(d,p)δ(1H) O0.861.000.960.310.250.27861.04150.10222.4194.23%
δ(1H) S1.18−1.020.920.460.350.52314.63550.22118.1586.78%
δ(1H) N1.16−0.830.930.450.320.48793.82160.19131.4288.65%
δ(13C) O0.8614.220.955.745.426.77731331.072.28293.1790.63%
δ(13C) S1.00−1.920.955.324.707.49111304.142.26324.6393.18%
δ(13C) N0.917.300.994.562.823.4479260.4151.011269.9998.30%
δ(1H) FA1.02−0.120.950.260.240.36010.86890.2371.5691.13%
δ(13C) FA0.97−0.280.984.903.124.0927179.8441.68498.6597.88%
Table 5. Experimental and theoretical attribution of absorption bands in the IR (in cm−1) calculated at the B3LYP/6-31G(d,p) level for the heterologous series.
Vibrational Mode (cm−1)ExperimentalTheoretical—B3LYP/6-31G(d,p)Theoretical—B3LYP/6-31+G(d,p)

O structureS structureN structureO structureS structureN structure
υ (O-H aliphatic)3370378238083810380636333825
υ (O-H aromatic)3370381837603763382237653612
υ (N-H)3370--3612--3612
υ (O-H aromatic)3370382238223822382838283770
υa (CH2) + υs (C-H sp2)-312831563127313031373114
υs (CH2) + υs (C-H sp3) + υs (C-H sp2)-307730893076308130983094
υa (CH3) + υ (C-H sp2)-315431573155315731593157
υ (C-H sp2) + υa (C-H sp2 aromatic)-320732043206320732063201
υs (CH3)-301630263025301730293027
υ (C-H sp3) + υs (CH2)2930303830182985307330753064
δa (C-H sp2 aromatic) + υs (C-O)-167516731673166416621662
υ (C=O) + υ (C=C trans) + δ(C-H) [+δ(N-H)] a1680179417551758176817011727
υs (C=C trans) + υ (C=O) + δ (C-H sp2) or [+ δ(N-H)] a1600169117551685167917541674
δa (CH3)1510150515021502150915091510
δs (C-H sp2 aromatic) + υ (C-O secondary alcohol)1480130713071309131113091308
δs (C-H sp2) + υ (C-O secondary alcohol)1390131913161319131913271318
δs (C-H sp2) + δa (CH3)1110122512201179122012281227
υ: stretching; υa: asymmetrical stretching; υs: symmetrical stretching; δ: deformation; δa: asymmetrical deformation; δs: symmetrical deformation;
aOnly for N structure.

