Combined 3D-QSAR, Molecular Docking and Molecular Dynamics Study on Derivatives of Peptide Epoxyketone and Tyropeptin-Boronic Acid as Inhibitors Against the β5 Subunit of Human 20S Proteasome

Abstract
:1. Introduction
2. Materials and Methods
2.1. Data Sets
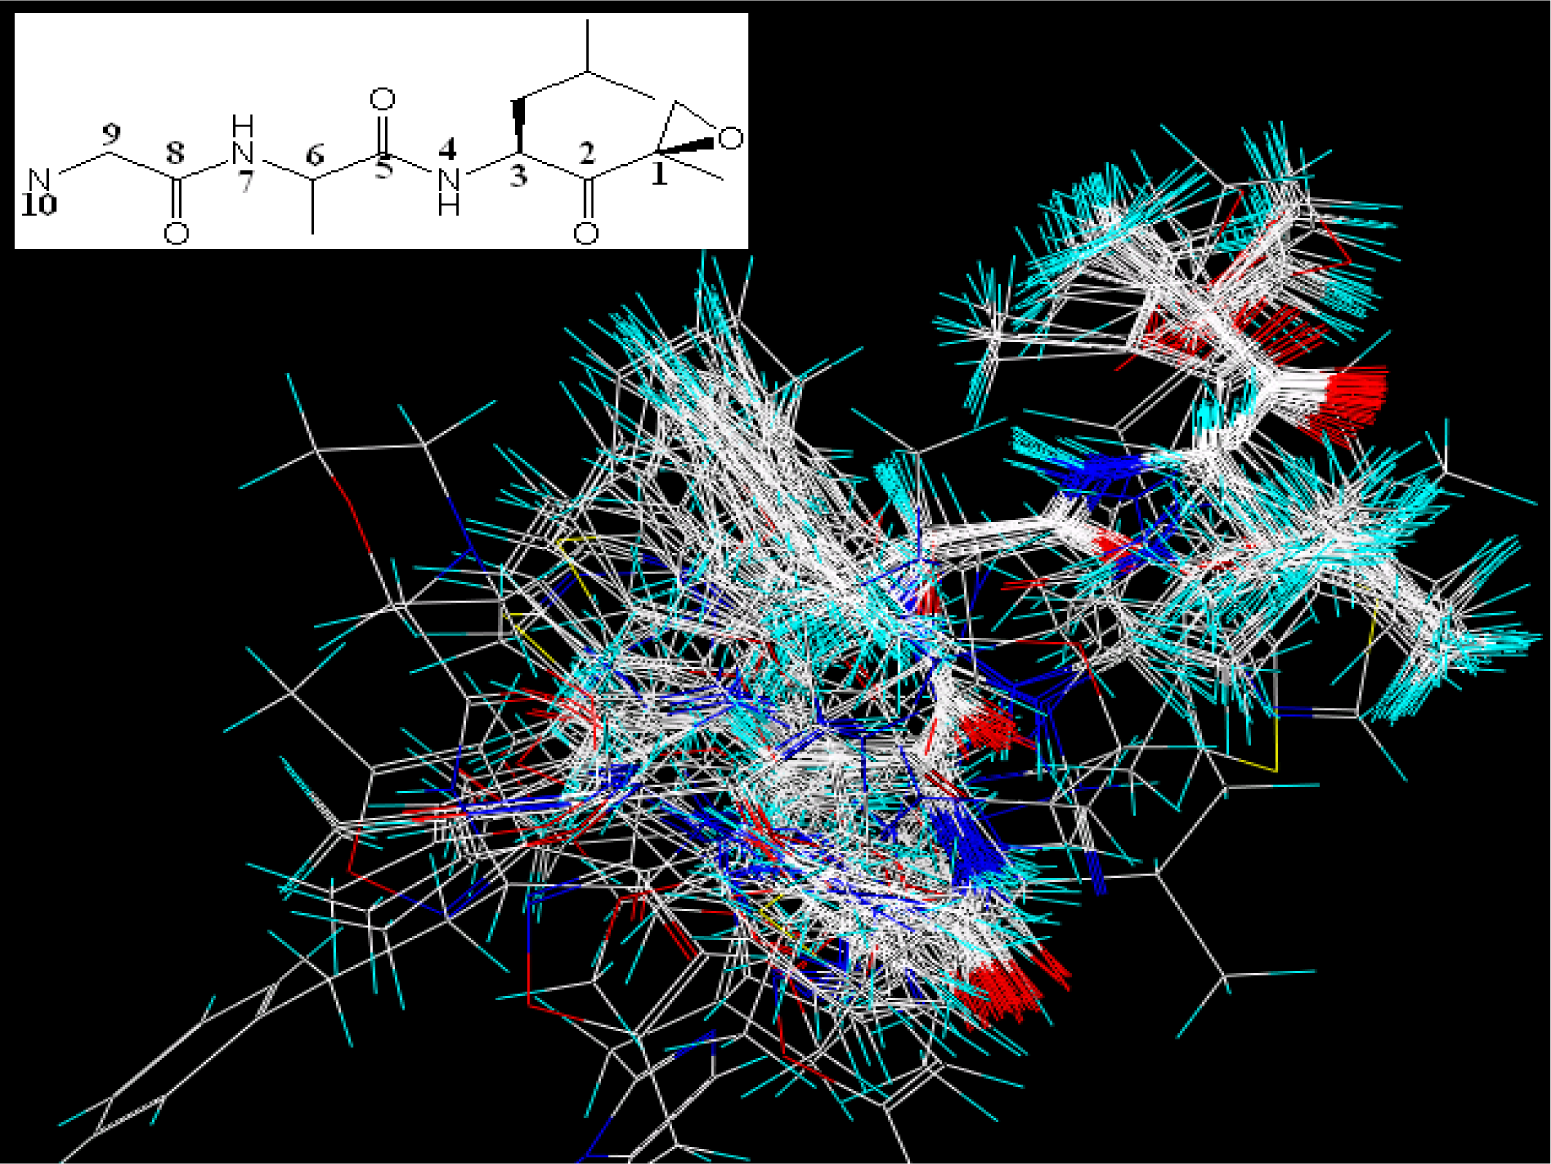
2.2. Molecular Modeling and Alignment
2.3. Calculation and Selection of Molecular Descriptors
2.4. 3D-QSAR Studies
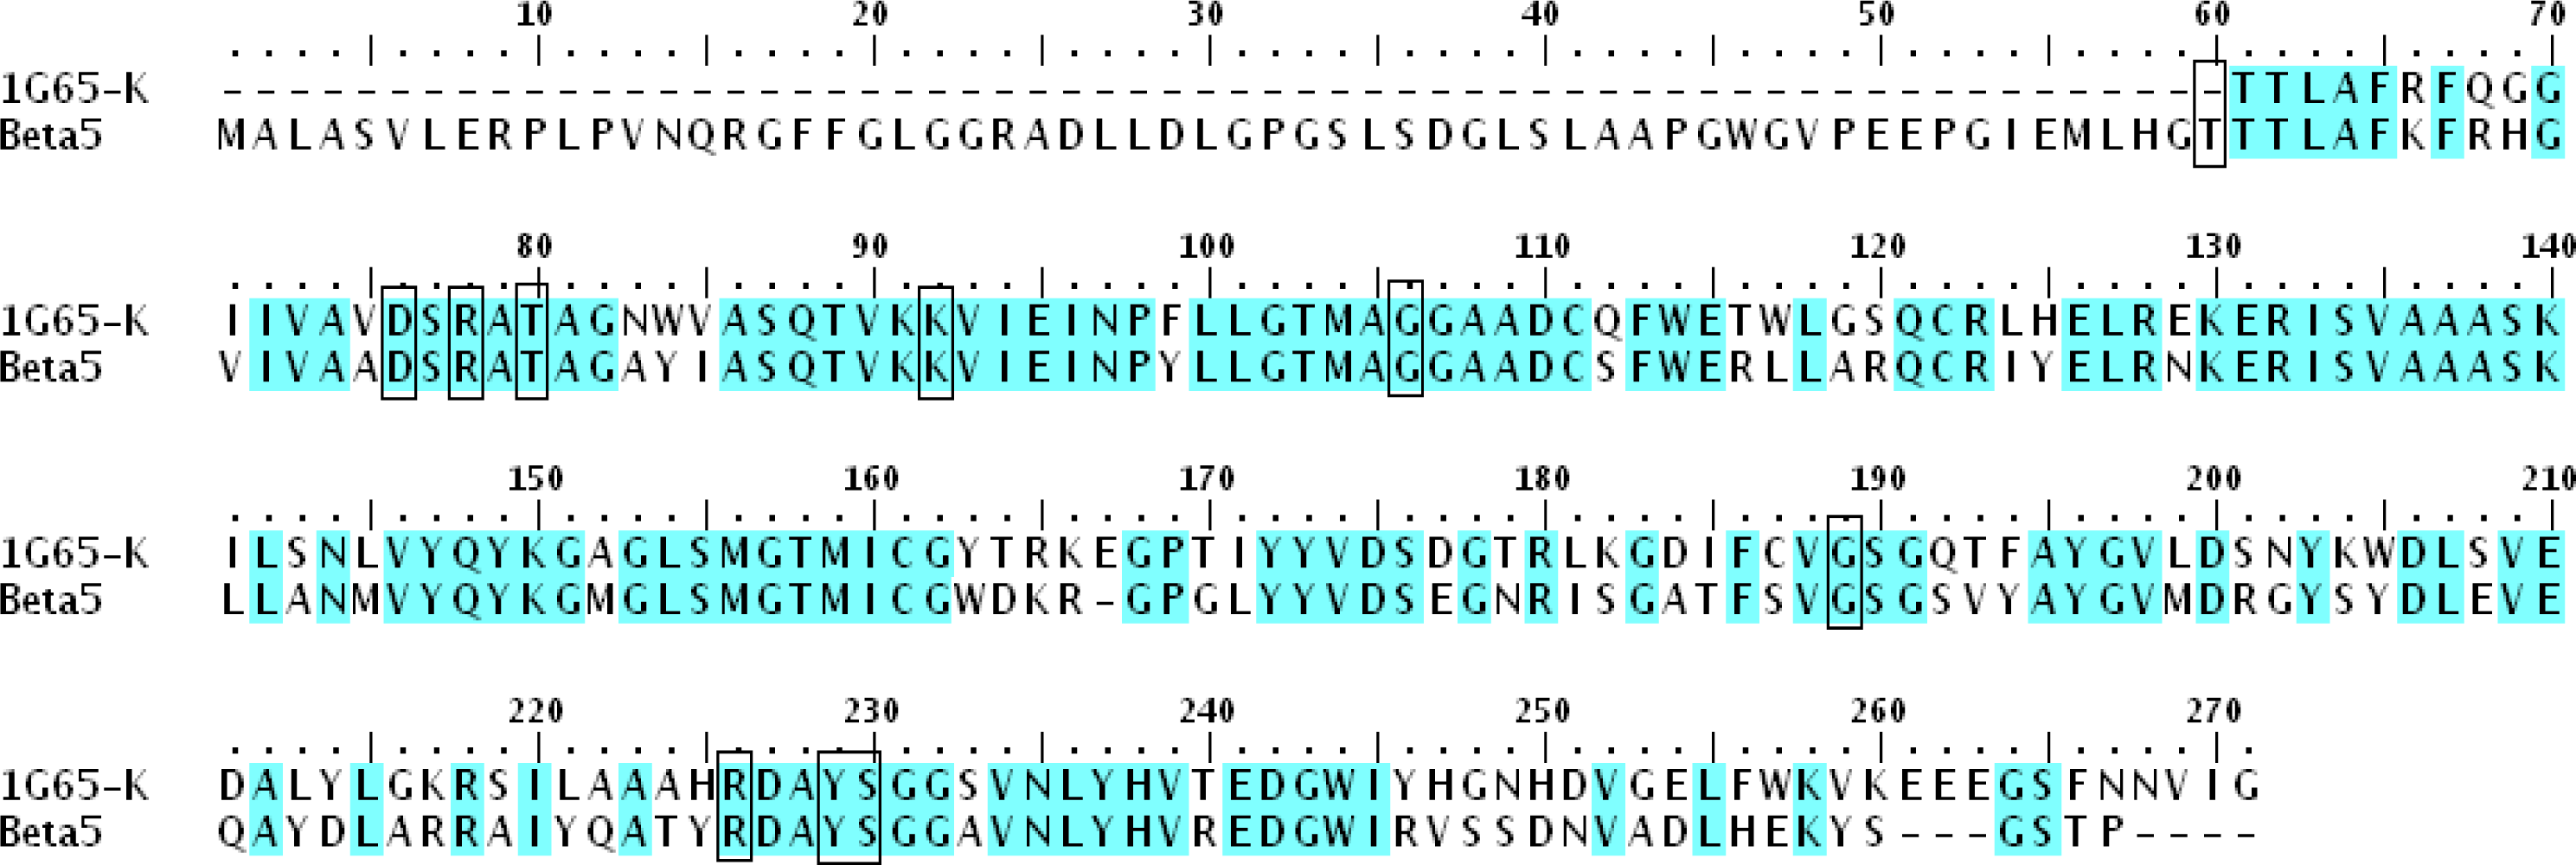
2.5. Homology Modeling
2.6. Molecular Docking
2.7. Molecular Dynamics Simulations
3. Results and Discussion
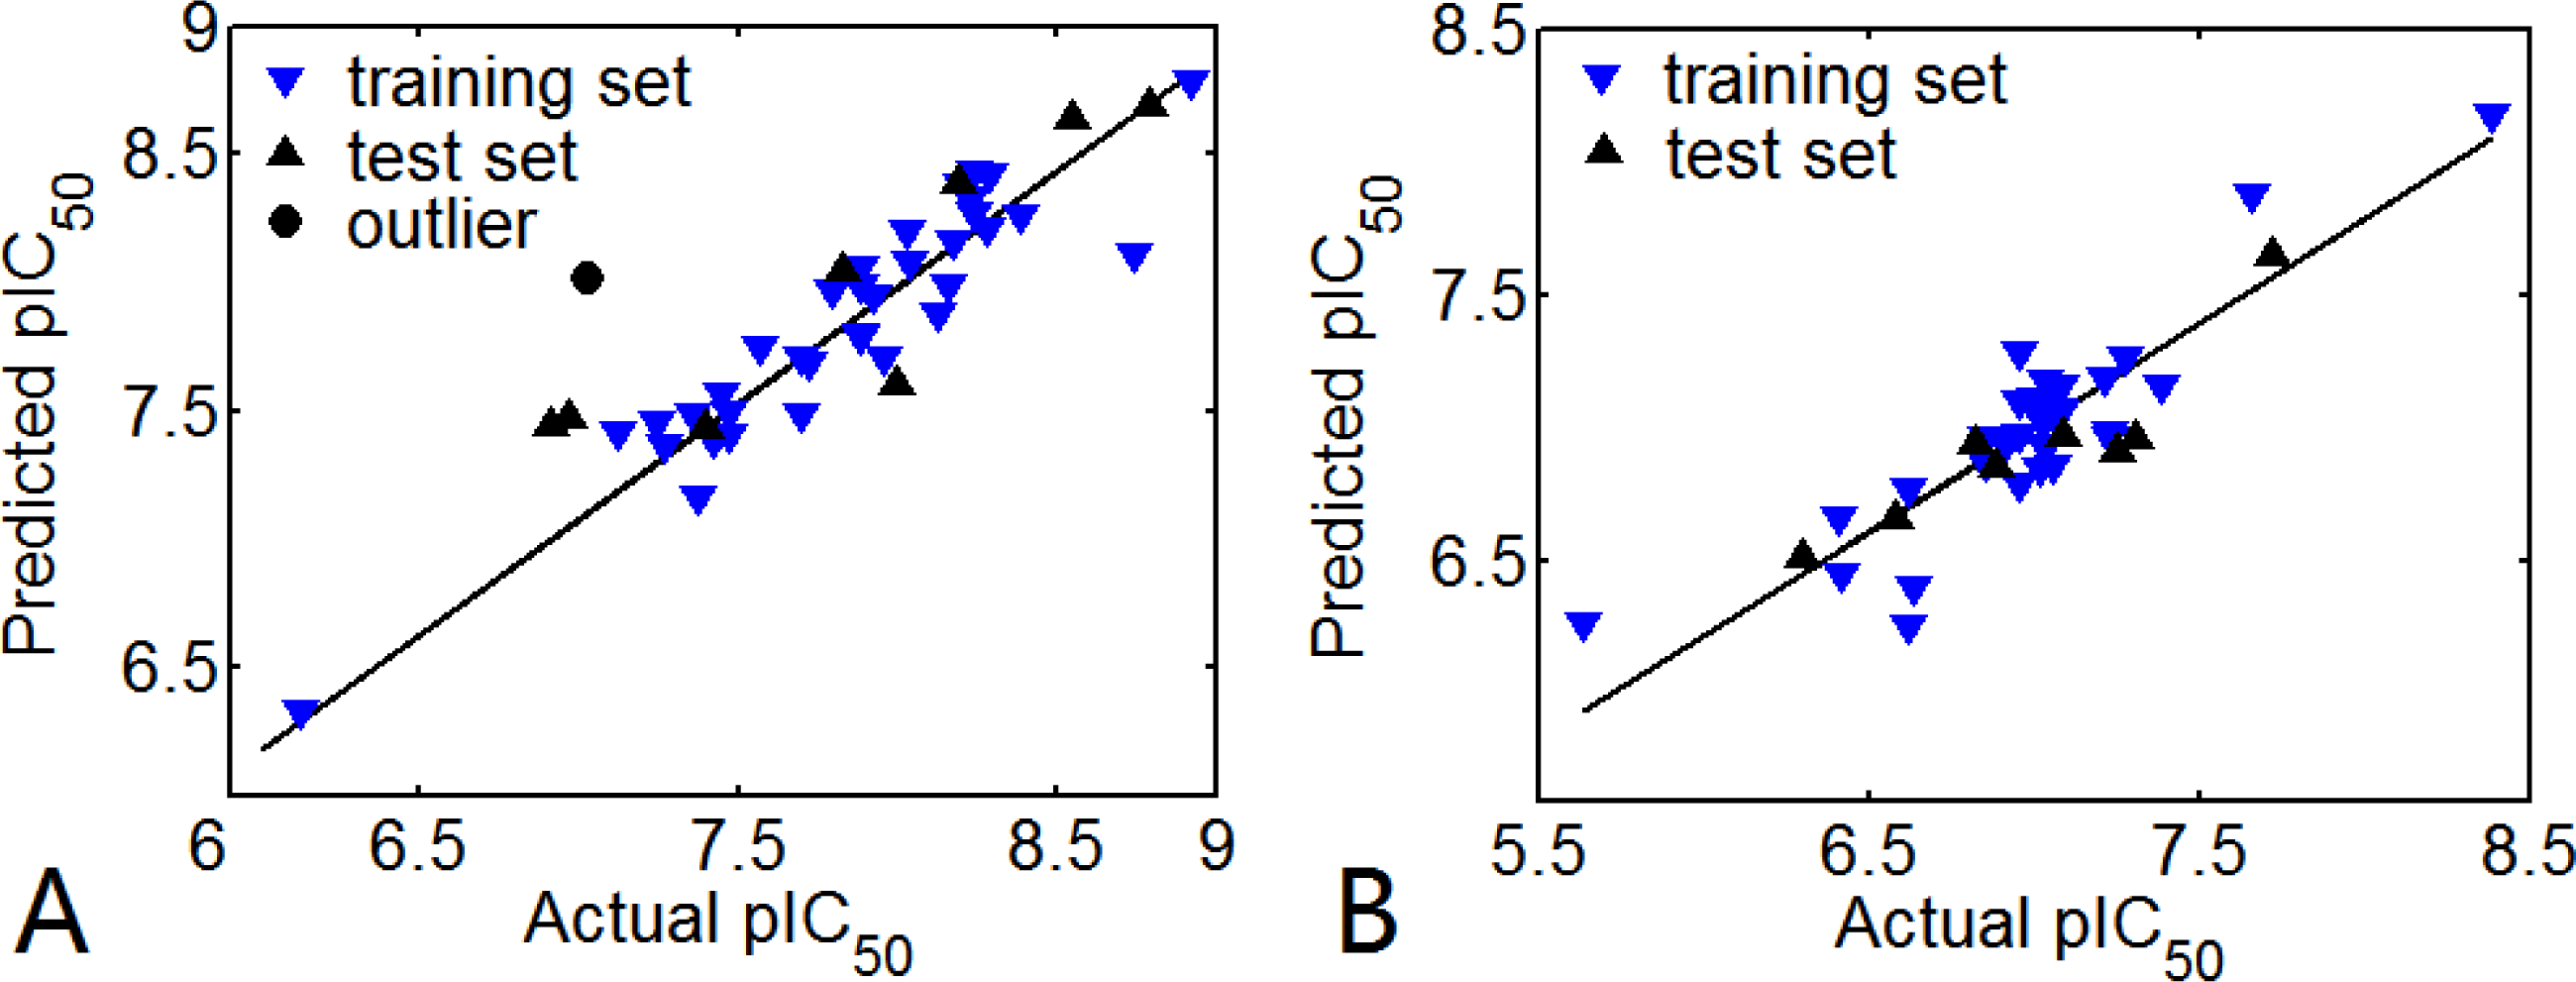
3.1. 3D-QSAR Models
3.1.1. EPK
3.1.2. TBA
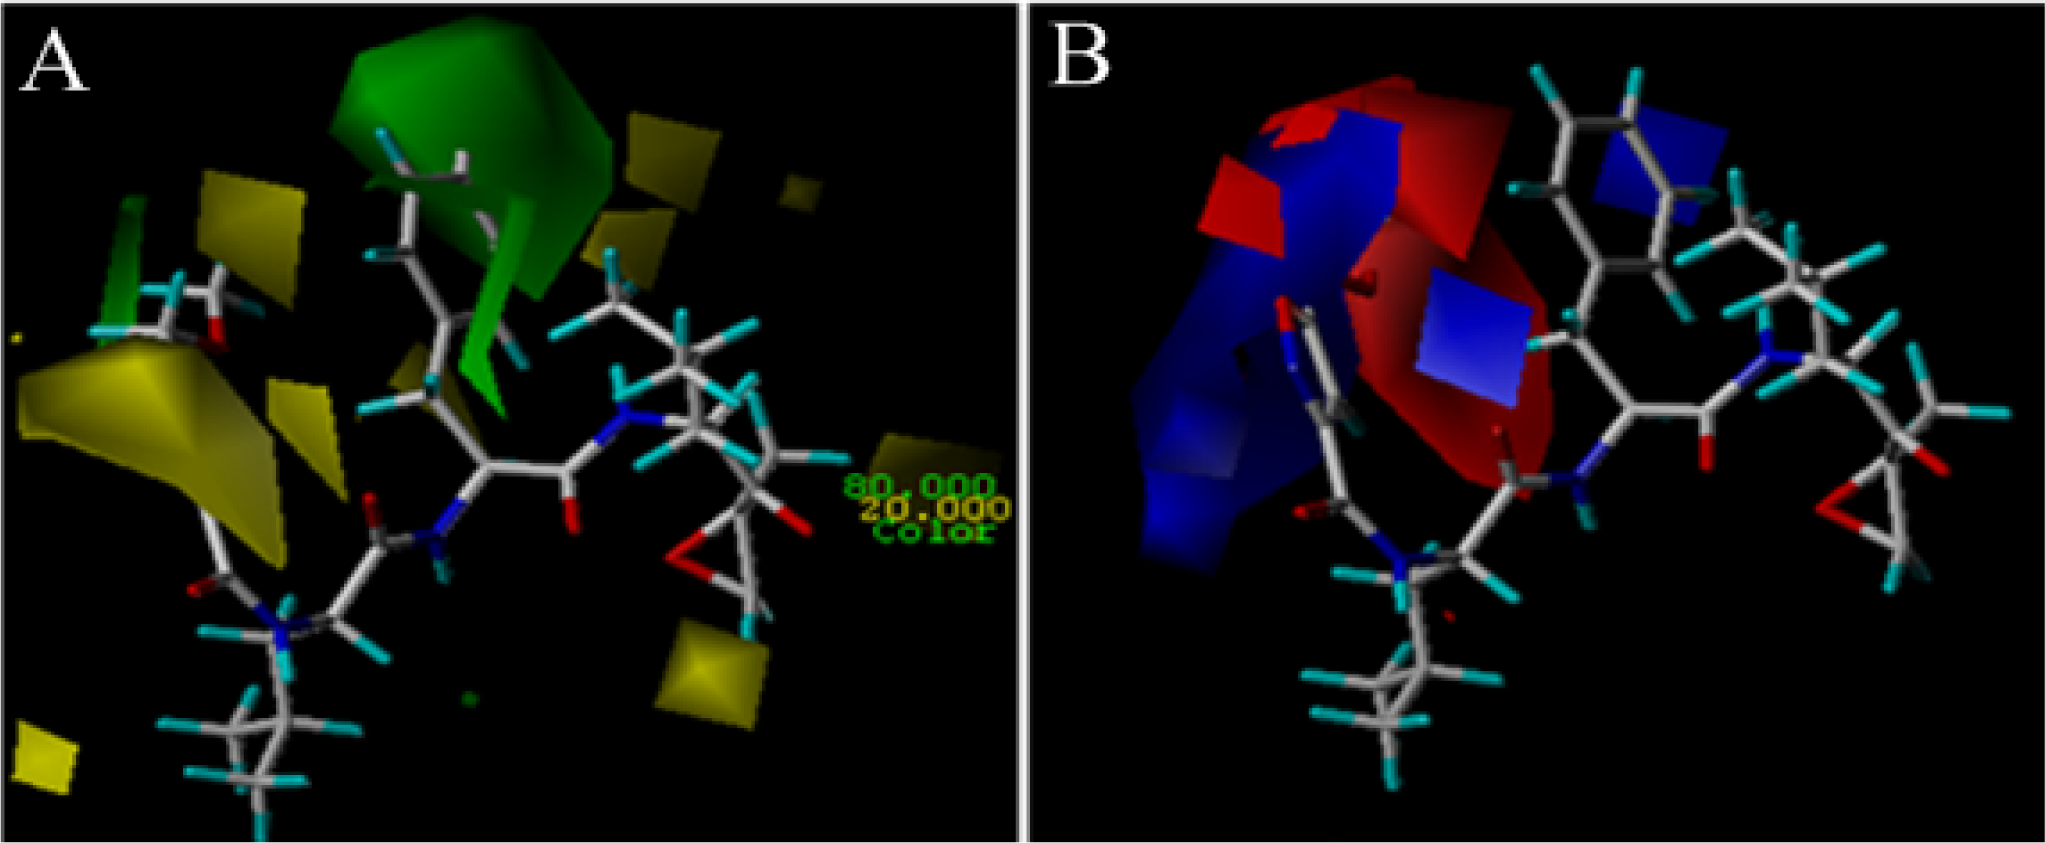
3.2. 3D-QSAR Contour Map Analysis
3.2.1. EPK
3.2.2. TBA
3.3. Homology Modeling
3.4. Docking Analysis and Comparison with 3D Contour Maps
3.4.1. EPK
3.4.2. TBA
3.5. Comparison of Binding Modes of Each Class
3.6. MD Simulations Analysis
3.6.1. EPK
 ) atom of the N-cap and the N atom of Ala109 main chain is measured (shown in Figure 11C). By comparison with Figure 11A (red curve), we found that the variation trend of N-cap is similar to that of compound 11. From this, we can come to the conclusion that the conformational change of compound 11 mainly results from the movement of the N-cap, which could be explained by the binding mode that the N-cap extending to the outer free space, but other parts of this ligand are kept tightly in the inner through H-bond interactions.
3.6.2. TBA
4. Conclusion
Acknowledgments
References
- De Bettignies, G; Coux, O. Proteasome inhibitors: Dozens of molecules and still counting. Biochimie 2010, 92, 1–16. [Google Scholar]
- Wehenkel, M; Ho, YK; Kim, K-B. Proteasome inhibitors: Recent progress and future directions. Modul. Protein Stab. Cancer Ther 2009, 99–119. [Google Scholar]
- Golab, J; Bauer, TM; Daniel, V; Naujokat, C. Role of the ubiquitin-proteasome pathway in the diagnosis of human diseases. Clin. Chim. Acta 2004, 340, 27–40. [Google Scholar]
- Griffin, TA; Nandi, D; Cruz, M; Fehling, HJ; Van Kaer, L; Monaco, JJ; Colbert, RA. Immunoproteasome assembly: Cooperative incorporation of interferon γ (IFN-γ)-inducible subunits. J. Exp. Med 1998, 187(1), 97–104. [Google Scholar]
- Kisselev, AF; Goldberg, AL. Proteasome inhibitors: From research tools to drug candidates. Chem. Biol 2001, 8, 739–758. [Google Scholar]
- Groll, M; Ditzel, L; Löwe, J; Stock, D; Bochtler, M; Bartunik, HD; Huber, R. Structure of 20S proteasome from yeast at 2.4 Å resolution. Nature 1997, 386, 463–471. [Google Scholar]
- Löwe, J; Stock, D; Jap, B; Zwickl, P; Baumeister, W; Huber, R. Crystal structure of the 20S proteasome from the Archaeon T. acidophilum at 3.4 Å resolution. Science 1995, 268, 533–539. [Google Scholar]
- Groll, M; Berkers, CR; Ploegh, HL; Ovaa, H. Crystal structure of the boronic acid-based proteasome inhibitor bortezomib in complex with the Yeast 20S proteasome. Structure 2005, 14, 451–456. [Google Scholar]
- Unno, M; Mizushima, T; Morimoto, Y; Tomisugi, Y; Tanaka, K; Yasuko, N; Tsukihara, T. Structure determination of the constitutive 20S Proteasome from bovine liver at 2.75 Å resolution. J. Biochem 2002, 131, 171–173. [Google Scholar]
- Jung, T; Catalgol, B; Grune, T. The proteasomal system. Mol. Aspect. Med 2009, 30, 191–296. [Google Scholar]
- Rivett, AJ. The multicatalytic proteinase: Multiple proteolytic activities. J. Biol. Chem 1989, 264, 12215–12219. [Google Scholar]
- Chen, P; Hochstrasser, M. Autocatalytic subunit processing couples active site formation in the 20S proteasome to completion of assembly. Cell 1996, 86, 961–972. [Google Scholar]
- Kisselev, AF; Akopian, TN; Castillo, V; Goldberg, AL. Proteasome active sites allosterically regulate each other, suggesting a cyclical bite-chew mechanism for protein breakdown. Mol. Cell 1999, 4, 395–402. [Google Scholar]
- Baumeister, W; Walz, J; Zuhl, F; Seemuller, E. The proteasome: Paradigm of self-compartmentalizing protease. Cell 1998, 92, 367–380. [Google Scholar]
- Groll, M; Bajorek, M; Kohler, A; Moroder, L; Rubin, DM; Huber, R; Glickman, MH; Finley, D. A gated channel into the proteasome core particle. Nat. Struct. Biol 2000, 7, 1062–1067. [Google Scholar]
- Jäger, S; Groll, M; Huber, R; Wolf, DH; Heinemeyer, W. Proteasome β-type Subunits: Unequal roles of propeptides in core particle maturation and a hierarchy of active site function. J. Mol. Biol 1999, 291, 997–1013. [Google Scholar]
- Lam, YA; Pockart, CM; Alban, A; Landon, M; Jamieson, C; Ramage, R; Mayer, RJ; Layfield, R. Inhibition of the ubiquitin-proteasome system in Alzheimer’s disease. PANS 2000, 97(18), 9902–9906. [Google Scholar]
- Ding, Q; Keller, JN. Proteasome and proteasome inhibiton in the central nervous system. Biol. Med 2001, 31(5), 574–584. [Google Scholar]
- Marfella, R; D’Amico, M; Esposito, K; Baldi, A; Di Filippo, C; Siniscalchi, M; Sasso, FC; Portoghese, M; Cirillo, F; Cacciapuoti, F; et al. The ubiquitin-proteasome system and inflammatory activity in diabetic atherosclerotic plaques. Diabetes 2006, 55, 622–632. [Google Scholar]
- Xu, J; Wu, Y; Zhang, M; Wang, S; Zou, MH. Proteasome-dependent degradation of guanosine 5′-triphosphate cyclohydrolase I causes tetrahydrobiopterin deficiency in diabetes mellitus. Circulation 2007, 116, 944–953. [Google Scholar]
- Wojcik, C; Di Napoli, M. Ubiquitin-proteasome system and proteasome inhibition: New strategies in sroke therapy. Stroke 2004, 35, 1506–1518. [Google Scholar]
- Wu, WKK; Cho, CH; Lee, CW; Wu, K; Fan, D; Yu, J; Sung, JJ. Proteasome inhibition: A new therapeutic strategy to cancer treatment. Cancer Lett 2010, 293, 15–22. [Google Scholar]
- Hideshima, T; Chauhan, D; Richardson, P; Mitsiades, C; Mitsiades, N; Hayashi, T; Munshi, N; Dang, L; Castro, A; Palombella; Adams, J; Anderson, KC. NF-kappa B as a therapeutic target in multiple myeloma. J. Biol. Chem 2002, 277, 16639–16647. [Google Scholar]
- Lopes, UG; Erhardt, P; Yao, R; Cooper, GM. p53-Dependent induction of apoptosis by proteasome inhibitors. J. Biol. Chem 1997, 272(20), 12893–12896. [Google Scholar]
- Pleban, E; Bury, M; M1ynarczuk, I; Wójcik, C. Effects of proteasome inhibitor PSI on neoplastic and non-transformed cell lines. Folia Histochem. Cytobiol 2001, 39, 133–134. [Google Scholar]
- Adams, J; Kauffman, M. Development of the proteasome inhibitor VelcadeTM (Bortezomib). Cancer Investig 2004, 22(2), 304–311. [Google Scholar]
- Adams, J. Proteasome inhibition: A novel approach to cancer therapy. Trends Mol. Med 2002, 8(Suppl. 4), S49–S54. [Google Scholar]
- Richardson, PG; Briemberg, H; Jagannath, S; Wen, PK; Barlogie, B; Berenson, J; Singhal, S; Siegel, DS; Irwin, D; Schuster, M; et al. Frequency, characteristics, and reversibility of peripheral neuropathy during treatment of advanced multiple myelomawith bortezomib. J. Clin. Oncol 2006, 24(19), 3113–3120. [Google Scholar]
- Sugawara, K; Hatori, M; Nishiyama, Y; Tomita, K; Kamei, H; Konishi, M; Oki, T. Eponemycin, a new antibiotic active against B16 melanoma. I. Production, isolation, structure and biological activity. J. Antibiot 1990, 43, 8–18. [Google Scholar]
- Hanada, M; Sugawara, K; Kaneta, K; Toda, S; Nishiyama, Y; Tomita, K; Yamamoto, H; Konishi, M; Oki, T. Epoxomicin, a new antitumor agent of microbial origin. J. Antibiot 1992, 45, 1746–1752. [Google Scholar]
- Meng, L; Mohan, R; Kwok, BHB; Elofsson, M; Crews, CM. Epoxomicin, a potent and selective proteasome inhibitor, exhibits in vivo antiinflammatory activity. Med. Sci 1999, 96, 10403–10408. [Google Scholar]
- Groll, M; Kim, KB; Kairies, N; Huber, R; Crews, CM. Crystal structure of epoxomicin: 20S proteasome reveals a molecular basis for selectivity of α’, β’-epoxyketone proteasome inhibitors. J. Am. Chem. Soc 2000, 122, 1237–1238. [Google Scholar]
- Elofsson, M; Splittgerber, U; Myung, J; Mohan, R; Crews, CM. Towards subunit-specific proteasome inhibitors: Synthesis and evaluation of peptide alpha’, beta’-epoxyketones. Chem. Biol 1999, 6, 811–822. [Google Scholar]
- Momose, I; Sekizawa, R; Hashizume, H; Kinoshita, N; Homma, Y; Hamada, M; Iinuma, H; Takeuchi, T. Tyropeptins A and B, new proteasome inhibitors produced by Kitasatospora sp. MK993-dF2. J. Antibiot 2001, 54(12), 997–1012. [Google Scholar]
- Watanabe, T; Abe, H; Momose, I; Takahashi, Y; Ikeda, D; Akamatsu, Y. Structure-activity relationship of boronic acid derivatives of tyropeptin: Proteasome inhibitors. Bioorg. Med. Chem. Lett 2010, 20, 5839–5842. [Google Scholar]
- Liao, SY; Chen, JC; Qian, L; Shen, Y; Zheng, KC. QSAR studies and molecular design of phenanthrene-based tylophorine derivatives with anticancer activity. QSAR Comb. Sci 2008, 27, 280–288. [Google Scholar]
- Wei, SP; Ji, ZQ; Zhang, HX; Zhang, JW; Wang, YH; Wu, WJ. Isolation, biological evaluation and 3D-QSAR studies of insecticidal/narcotic sesquiterpene polyol esters. J. Mol. Model 2010. DOI: 10.1007/s00894–010–0765-x. [Google Scholar]
- Wang, X; Yang, W; Xu, X; Zhang, H; Wang, Y. Studies of benzothiadiazine derivatives as Hepatitis C Virus NS5B polymerase inhibitors using 3D-QSAR, molecular docking and molecular dynamics. Curr. Med. Chem 2010, 17, 2788–2803. [Google Scholar]
- Zhu, Y-Q; Pei, J-F; Liu, Z-M; Lai, L-H. 3D-QSAR studies on tripeptide aldehyde inhibitors of proteasome using CoMFA and CoMSIA methods. Bioorg. Med. Chem 2006, 14, 1483–1496. [Google Scholar]
- Zhu, Y-Q; Lei, M; Lu, A-J; Zhao, X; Yin, X-J; Gao, Q-Z. 3D-QSAR studies of boron-containing dipeptides as proteasome inhibitors with CoMFA and CoMSIA methods. Europ. J. Med. Chem 2009, 44, 1486–1499. [Google Scholar]
- Zhou, H-J; Aujay, MA; Bennett, MK; Dajee, M; Demo, SD; Fang, Y; Ho, MN; Jiang, J; Kirk, CJ; Laidig, GJ; Lewis, ER; Lu, Y; Muchamuel, T; Parlati, F; Ring, E; Shenk, KD; Shields, J; Shwonek, PJ; Stanton, T; Sun, CM; Sylvain, C; Woo, TM; Yang, J. Design and synthesis of an orally bioavaliable and selective peptide epoxyketone proteasome inhibitor (PR-047). J. Med. Chem 2009, 52, 3028–3038. [Google Scholar]
- Johnsamuel, J; Byun, Y; Jones, TP; Endo, Y; Tjarks, W. A new strategy for molecular modeling and receptor-based design of carborane containing compounds. J. Organometal. Chem 2003, 680, 223–231. [Google Scholar]
- Li, Y; Wang, Y-H; Ding, J; Wang, Y; Chang, Y-Q; Zhang, S-W. In silico prediction of androgenic and nonandrogenic compounds using random forest. QSAR Comb. Sci 2009, 28(4), 396–405. [Google Scholar]
- Wang, Y-H; Li, Y; Yang, S-L; Yang, L. An in silico approach for screening flavonoids as P-glycoprotein inhibitors based on a Bayesian-regularized neural network. J. Comput. Aid Mol. Design 2005, 19, 137–147. [Google Scholar]
- Wang, Y-H; Li, Y; Yang, S-L; Yang, L. Classification of substrates and inhibitors of p-glycoprotein using unsupervised machine learning approach. J. Chem. Inf. Model 2005, 45, 750–757. [Google Scholar]
- Wang, Y-H; Li, Y; Li, Y-H; Yang, S-L; Yang, L. Modeling Km values using electrotopological state: Substrates for cytochrome P450 3A4-mediated metabolism. Bioorg. Med. Chem. Lett 2005, 15, 4076–4084. [Google Scholar]
- Todeschini, R; Consonni, V. Handbook of Molecular Descriptors; Wiley VCH: Weinheim, Germany, 2000. [Google Scholar]
- Cramer, RD, III; Patterson, DE; Bunce, JD. Comparative molecular field analysis (CoMFA). 1. Effect of shape on binding of steroids to carrier proteins. J. Am. Chem. Soc 1988, 110, 5959–5967. [Google Scholar]
- Tetko, IV; Tanchuk, VY; Villa, AE. Prediction of n-octanol/water partition coefficients from PHYSPROP database using artificial neural networks and E-state indices. J. Chem. Inf. Comput. Sci 2001, 41, 1407–1421. [Google Scholar]
- Schafferhans, A; Klebe, G. Docking ligands onto binding site representations derived from proteins built by homology modelling. J. Mol. Biol 2001, 307, 407–427. [Google Scholar]
- Thompson, JD; Higgins, DG; Gibson, TJ. CLUSTAL W: Improving the sensitivity of progressive multiple sequence alignment through sequence weighting, position-specific gap penalties and weight matrix choice. Nucleic Acids Res 1994, 22, 4673–4680. [Google Scholar]
- Arnold, K; Bordoli, L; Kopp, J; Schwede, T. The SWISS-MODEL workspace: A web-based environment for protein structure homology modeling. Bioinformatics 2006, 22, 195–201. [Google Scholar]
- Schwede, T; Kopp, J; Guex, N; Peitsch, MC. SWISS-MODEL: An automated protein homology-modeling server. Nucleic Acids Res 2003, 31, 3381–3385. [Google Scholar]
- Guex, N; Peitsch, MC. SWISS-MODEL and the Swiss-PdbViewer: An environment for comparative protein modeling. Electrophoresis 1997, 18, 2714–2723. [Google Scholar]
- Jain, AN. Surflex: Fully automatic flexible molecular docking using a molecular similarity-based search engine. J. Med. Chem 2003, 46, 499–511. [Google Scholar]
- Case, DA; Darden, TA; Cheatham, I; Simmerling, CL; Wang, J; Duke, RE; Luo, R; Crowley, M; Walker, RC; Zhang, W; et al. AMBER 10; University of California: San Francisco, CA, USA, 2008. [Google Scholar]
- Wang, J; Wolf, RM; Caldwell, JW; Kollman, PA; Case, DA. Development and testing of a general amber force field. J. Comput. Chem 2004, 25, 1157–1174. [Google Scholar]
- Jakalian, A; Jack, DB; Bayly, CI. Fast, efficient generation of high-quality atomic charges. AM1-BCC model: II. Parameterization and validation. J. Comput. Chem 2002, 23, 1623–1641. [Google Scholar]
- Hummer, G; Rasaiah, JC; Noworyta, JP. Water conduction through the hydrophobic channel of a carbon nanotube. Nature 2001, 414, 188–190. [Google Scholar]
- Jorgensen, WL; Chandrasekhar, J; Madura, JD; Klein, ML. Comparison of simple potential functions for simulating liquid water. J. Chem. Phys 1983, 79, 926–935. [Google Scholar]
- Essmann, U; Perera, L; Berkowitz, ML; Darden, T. A smooth particle mesh Ewald method. J. Chem. Phys 1995, 103, 8577–9593. [Google Scholar]
- Ryckaert, JP; Ciccotti, G; Berendsen, HJC. Numerical integration of the cartesian equations of motion of a system with constraints: Molecular dynamics of n-alkanes. J. Comput. Phys 1977, 23, 327–341. [Google Scholar]
- Hammer, MC; Steinhauer, V; Gasteiger, J. Deriving the 3D structure of organic molecules from their infrared spectra. Vib. Spectrosc 1999, 19, 151–164. [Google Scholar]
- Cavasotto, CN; Phatak, SS. Homology modeling in drug discovery: Current trends and applications. Drug Discov. Today 2009, 14(13), 676–683. [Google Scholar]
- Zhang, B; Li, Y; Zhang, H; Ai, C. 3D-QSAR and molecular docking studies on derivatives of MK-0457, GSK1070916 and SNS-314 as inhibitors against Aurora B Kinase. Int. J. Mol. Sci 2010, 11, 4326–4347. [Google Scholar]
- Lavecchia, A; Cosconati, S; Novellino, E; Calleri, E; Temporini, C; Massolini, G; Carbonara, G; Fracchiolla, G; Loiodice, F. Exploring the molecular basis of the enantioselective binding of penicillin G acylase towards a series of 2-aryloxyalkanoic acids: A docking and molecular dynamics study. J. Mol. Graph. Model 2007, 25, 773–783. [Google Scholar]
Appendix
Appendix 1. EPK structures and their chymotrypsin-like (CT-L) inhibitory activity.

| Compd. | structure | IC50(nM) | pIC50 |
|---|---|---|---|
| 1 | 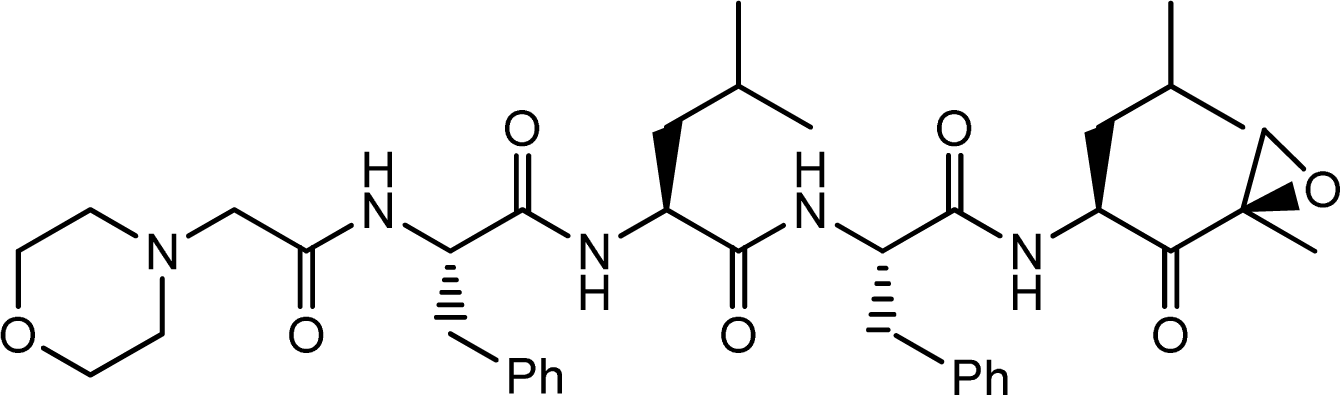 | 5.7 | 8.2441 |
| 2 |  | 1000 | 6.000 |
 | |||
|---|---|---|---|
| Compd. | N-cap | IC50(nM) | pIC50 |
| 3 | Morpholine-CH2 | 57 | 7.2441 |
| 4 | 3-furan | 34 | 7.4685 |
| 5b | 2-thiophene | 10 | 8.0000 |
| 6 | 5-oxazole | 27 | 7.5686 |
| 7 | 5-isoxazole | 5.8 | 8.2366 |
| 8 | 3-isoxazole | 7.4 | 8.1308 |
| 9 | (5-Me)-3-isoxazole | 1.8 | 8.7447 |
| 10 | (5-iPr)-3-isoxazole | 6.3 | 8.2007 |
| 11 | (5-MeOCH2)-3-isoxazole | 1.2 | 8.9208 |
| 12 | 3-pyrazole | 36 | 7.4437 |
| 13b | 2-imidazole | 107 | 6.9706 |
| 14 | (N-Me)-3-pyrazole | 76 | 7.1192 |
| 15b | (N-Me)-2-imidazole | 122 | 6.9136 |
| 16 | (5-Me)-3-pyrazole | 38 | 7.4202 |
| 17 | 4-pyridine | 20 | 7.6990 |
| 18 | 4-pyridazine | 12 | 7.9208 |
| 19 | 2-pyrazine | 752 | 6.1238 |
| 20 | 2-(R)-tetrahydrofuran | 34 | 7.4685 |
| 21 | 2-(S)-tetrahydrofuran | 42 | 7.3768 |
| 22 | (5-Me)-3- isoxazole-NH | 13 | 7.8861 |
 | ||||
|---|---|---|---|---|
| Compd. | R | P3 | IC50(nM) | pIC50 |
| 23 | 1-(1,2,4)-triazole-CH2 | Leu | 13 | 7.8861 |
| 24b | 1-imidazole-CH2 | Leu | 15 | 7.8239 |
| 25b | N-Me-piperazine-CH2 | Leu | 94 | 7.0269 |
| 26 | Me | Leu | 4.1 | 8.3872 |
| 27 | Morpholine-CH2 | Ser(OMe) | 9.3 | 8.0315 |
| 28 | Me | Ser(OMe) | 5.7 | 8.2441 |
| 29 | Me | (4-Thiazolyl)-ala | 6.7 | 8.1739 |
| 30 | Morpholine-CH2 | (4-Thiazolyl)-ala | 6.9 | 8.1611 |
| 31 | Me | (2-Py)-ala | 13 | 7.8861 |
| 32 | Morpholine-CH2 | (2-Py)-ala | 5.2 | 8.284 |
| 33b | Me | (3-Py)-ala | 1.6 | 8.7959 |
| 34b | Morpholine-CH2 | (3-Py)-ala | 6.4 | 8.1938 |
| 35b | Me | (4-Py)-ala | 2.8 | 8.5528 |
| 36 | Morpholine-CH2 | (4-Py)-ala | 5.1 | 8.2924 |
 | |||
|---|---|---|---|
| Compd. | P2 | IC50(nM) | pIC50 |
| 37 | cyhxy-ala | 13 | 7.8861 |
| 38 | 3-thienyl-ala | 9.2 | 8.0362 |
| 39 | 4-thiazolyl-ala | 16 | 7.7959 |
| 40 | Val | 44 | 7.3565 |
| 41 | Leu | 20 | 7.6990 |
| 42 | Ala | 19 | 7.7212 |
| 43 | Abu | 54 | 7.2676 |
| 44b | CN-Ala | 40 | 7.3979 |
| 45 | Ser(OMe) | 11 | 7.9586 |
Appendix 2. TBA structures and their chymotrypsin-like (CT-L) inhibitory activity.
| Compd. | R | IC50(μM) | pIC50 |
|---|---|---|---|
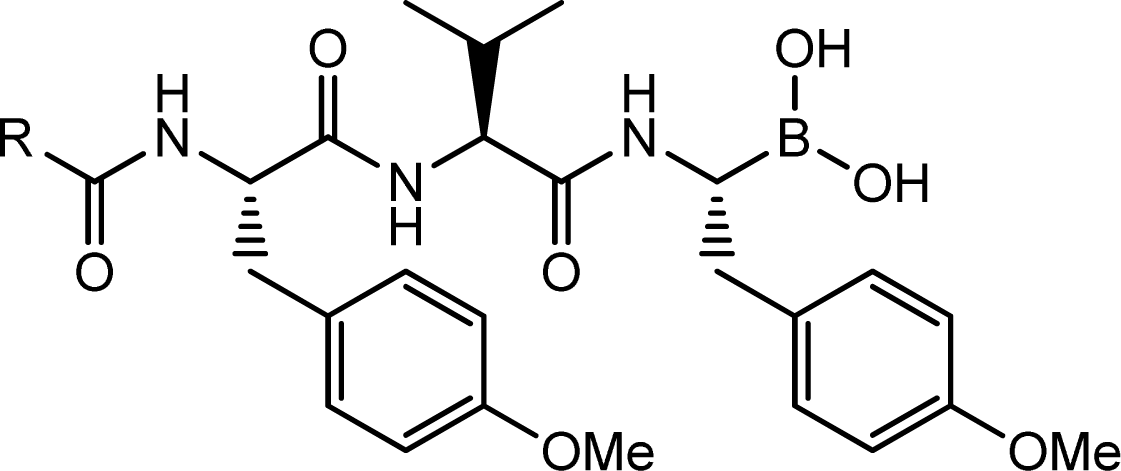
| 1b |  | 0.019 | 7.7212 |
| 2 |  | 0.022 | 7.6576 |
| 3 | 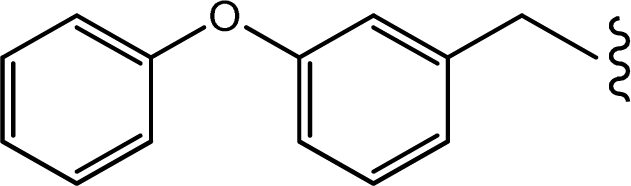 | 0.0041 | 8.3872 |
| 4 | 1-isoquinolyl | 0.041 | 7.3872 |
| 5 | 3-isoquinolyl | 0.059 | 7.2291 |
| 6 | 6-isoquinolyl | 0.38 | 6.4202 |
| 7 | 2-quinolyl | 0.10 | 7.0000 |
| 8b | 3-quinolyl | 0.056 | 7.2518 |
| 9b | 4-quinolyl | 0.049 | 7.3098 |
| 10 | 8-quinolyl | 0.093 | 7.0315 |
| 11 | pyrazyl | 0.24 | 6.6198 |
| 12 | 2-pyridyl | 0.23 | 6.6383 |
| 13b | 3-pyridyl | 0.50 | 6.3010 |
| 14 | 4-pyridyl | 2.3 | 5.6383 |
 | |||
|---|---|---|---|
| Compd. | X | IC50(μM) | pIC50 |
| 15 | 3-Me | 0.085 | 7.0706 |
| 16 | 4-Me | 0.14 | 6.8539 |
| 17 | 5-Me | 0.12 | 6.9208 |
| 18 | 6-Me | 0.088 | 7.0555 |
| 19 | 3-F | 0.14 | 6.8539 |
| 20b | 5-F | 0.081 | 7.0915 |
| 21 | 6-F | 0.11 | 6.9586 |
| 22 | 3-Cl | 0.083 | 7.0809 |
| 23 | 4-Cl | 0.088 | 7.0555 |
| 24 | 5-Cl | 0.083 | 7.0809 |
| 25 | 6-Cl | 0.10 | 7.0000 |
| 26 | 3,6-Cl2 | 0.053 | 7.2757 |
| 27 | 3-Br | 0.061 | 7.2147 |
| 28 | 4-Br | 0.095 | 7.0223 |
| 29 | 5-Br | 0.093 | 7.0315 |
| 30 | 6-Br | 0.092 | 7.0362 |
| 31b | 4-CF3 | 0.15 | 6.8239 |
| 32 | 5-CF3 | 0.11 | 6.9586 |
| 33 | 3-HO | 0.39 | 6.4089 |
| 34 | 6-HO | 0.24 | 6.6198 |
| 35b | 3-MeO | 0.13 | 6.8861 |
| 36 | 4-MeO | 0.087 | 7.0605 |
| 37 | 5-MeO | 0.094 | 7.0269 |
| 38 | 6-MeO | 0.059 | 7.2291 |
| 39 | 4-Me2N | 0.11 | 6.9586 |
 | |||
|---|---|---|---|
| Compd. | R′ | IC50(μM) | pIC50 |
| 40b | H | 0.019 | 6.5850 |
| 41 | Me | 0.039 | 6.9586 |


| EPK | TBA | |||||||
|---|---|---|---|---|---|---|---|---|
| parameters | Ligand-based | Receptor-based | Ligand-based | Receptor-based | ||||
| CoMFA | CoMSIA | CoMFA | CoMSIA | CoMFA | CoMSIA | CoMFA | CoMSIA | |
| N | 6 | 3 | 4 | 3 | 3 | 3 | 2 | 2 |
| Q2 | 0.462 | 0.409 | 0.503 | 0.467 | 0.601 | 0.622 | 0.580 | 0.560 |
| SEP | 0.478 | 0.477 | 0.445 | 0.453 | 0.282 | 0.275 | 0.284 | 0.291 |
| SEE | 0.202 | 0.339 | 0.129 | 0.188 | 0.218 | 0.208 | 0.246 | 0.232 |
| F | 45.479 | 25.021 | 176.631 | 105.373 | 30.974 | 34.777 | 32.774 | 38.905 |
| R2pred | 0.820 | 0.479 | 0.628 | 0.648 | 0.773 | 0.821 | 0.804 | 0.766 |
| Field contributions % | ||||||||
| S | 0.418 | 0.046 | 0.278 | 0.117 | 0.240 | 0.035 | 0.102 | 0.066 |
| E | 0.429 | 0.176 | 0.526 | 0.355 | 0.068 | 0.117 | 0.059 | 0.123 |
| D | 0.157 | 0.252 | ||||||
| H | 0.143 | 0.122 | 0.327 | |||||
| A | 0.107 | 0.078 | 0.512 | 0.109 | ||||
| EEig04r | 0.100 | 0.264 | 0.133 | 0.210 | ||||
| Mor24e | 0.053 | 0.107 | 0.063 | 0.066 | ||||
| RDF050M | 0.239 | 0.213 | 0.080 | 0.291 | ||||
| AlogP2 | 0.453 | 0.435 | 0.181 | 0.412 | ||||
| Symbols | Descriptor family | Definition |
|---|---|---|
| EEig04r | Topological | Eigenvalue 04 from edge adj. matrix weighted by resonance integrals |
| Mor24e | 3D-MoRSE | 3D-MoRSE-signal 24/weighted by atomic Sanderson electronegativities |
| RDF050M | RDF | Radial Distribution Function-5.0/weighted by atomic masses |
| AlogP2 | Molecular properties | Squared Ghose-Crippen octanol-water partition coeff. (logP^2) |
© 2011 by the authors; licensee MDPI, Basel, Switzerland. This article is an open-access article distributed under the terms and conditions of the Creative Commons Attribution license (http://creativecommons.org/licenses/by/3.0/).
Share and Cite
Liu, J.; Zhang, H.; Xiao, Z.; Wang, F.; Wang, X.; Wang, Y. Combined 3D-QSAR, Molecular Docking and Molecular Dynamics Study on Derivatives of Peptide Epoxyketone and Tyropeptin-Boronic Acid as Inhibitors Against the β5 Subunit of Human 20S Proteasome. Int. J. Mol. Sci. 2011, 12, 1807-1835. https://doi.org/10.3390/ijms12031807
Liu J, Zhang H, Xiao Z, Wang F, Wang X, Wang Y. Combined 3D-QSAR, Molecular Docking and Molecular Dynamics Study on Derivatives of Peptide Epoxyketone and Tyropeptin-Boronic Acid as Inhibitors Against the β5 Subunit of Human 20S Proteasome. International Journal of Molecular Sciences. 2011; 12(3):1807-1835. https://doi.org/10.3390/ijms12031807
Chicago/Turabian StyleLiu, Jianling, Hong Zhang, Zhengtao Xiao, Fangfang Wang, Xia Wang, and Yonghua Wang. 2011. "Combined 3D-QSAR, Molecular Docking and Molecular Dynamics Study on Derivatives of Peptide Epoxyketone and Tyropeptin-Boronic Acid as Inhibitors Against the β5 Subunit of Human 20S Proteasome" International Journal of Molecular Sciences 12, no. 3: 1807-1835. https://doi.org/10.3390/ijms12031807