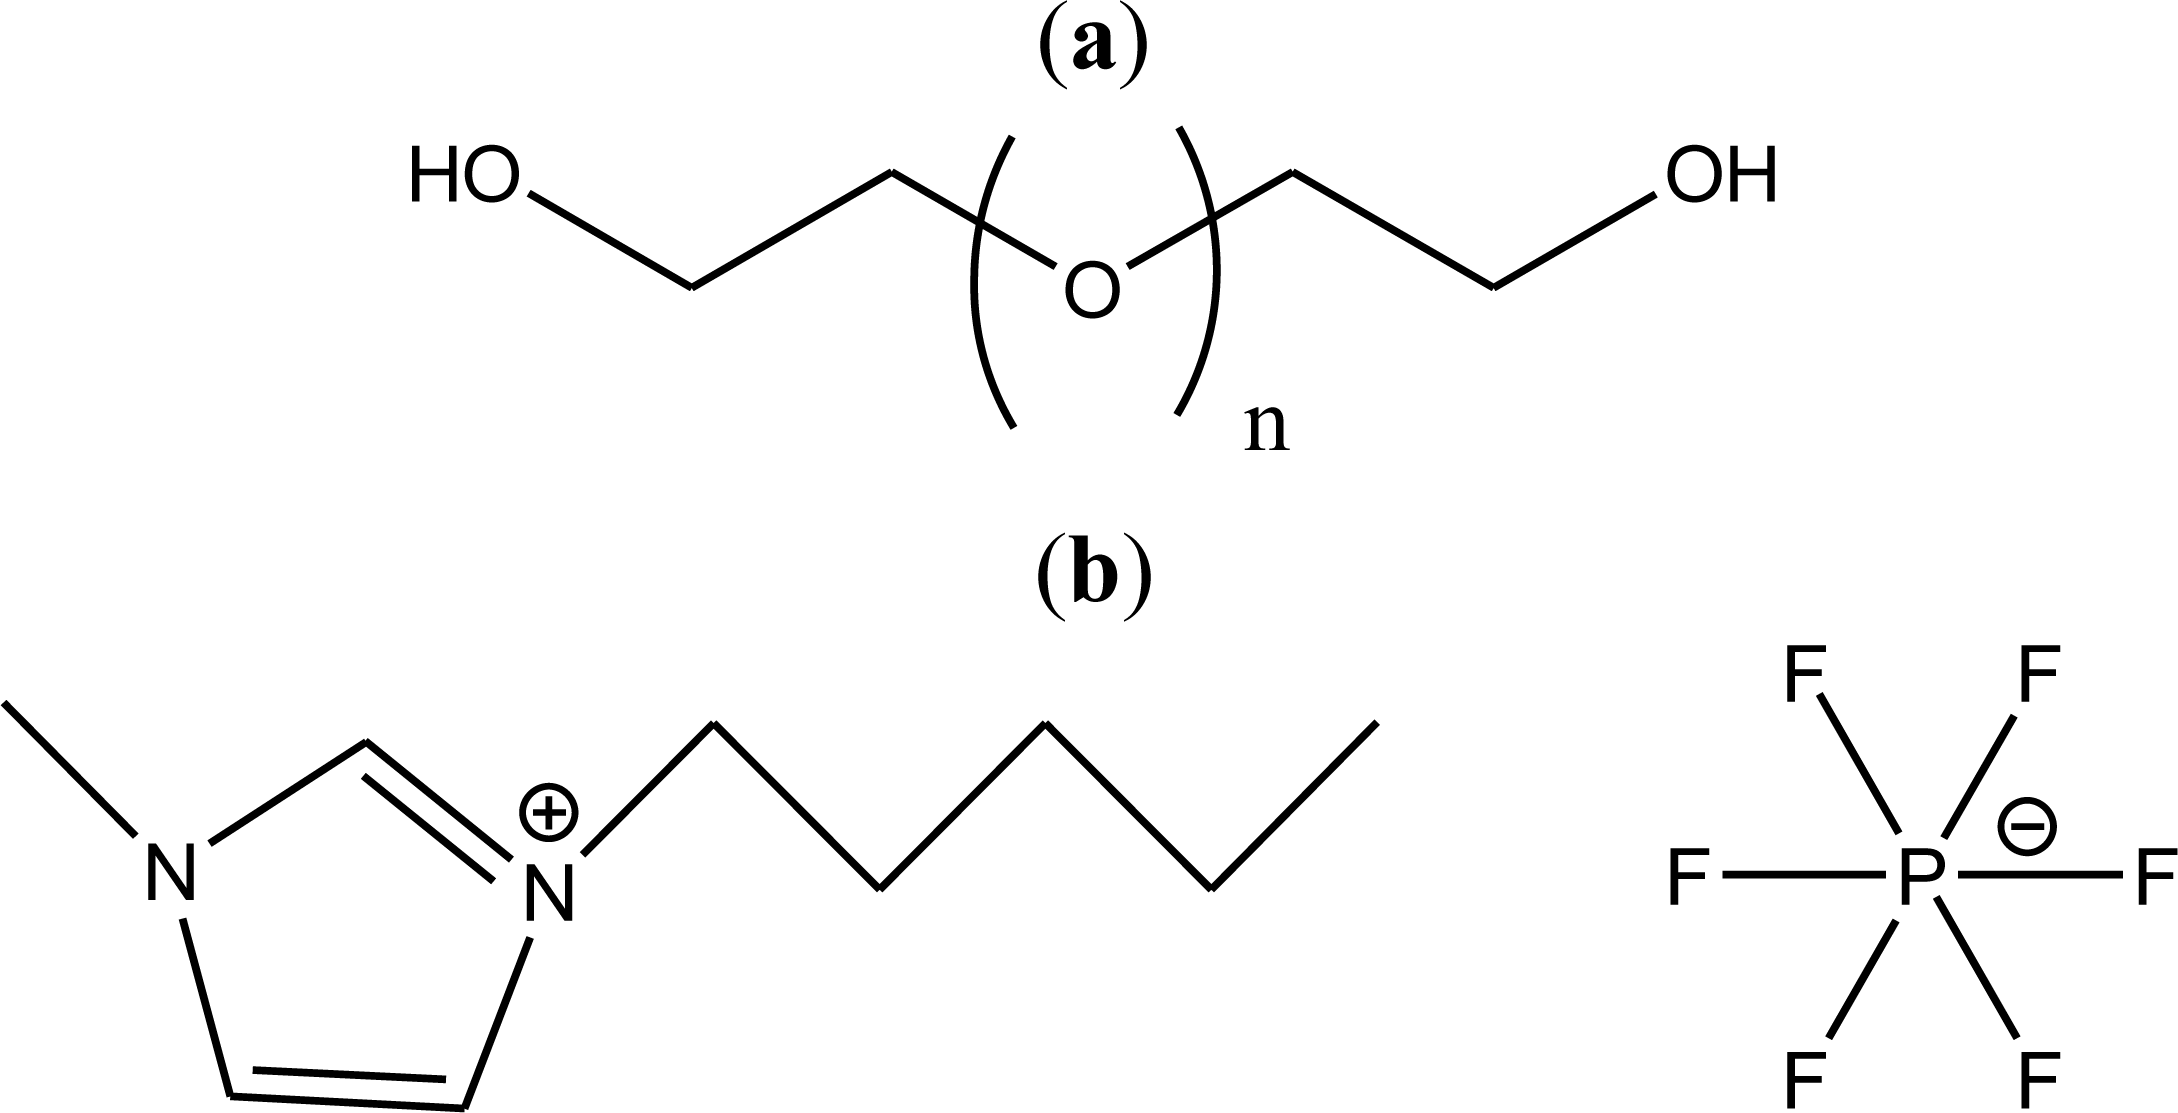
Effect of Temperature on the Physico-Chemical Properties of a Room Temperature Ionic Liquid (1-Methyl-3-pentylimidazolium Hexafluorophosphate) with Polyethylene Glycol Oligomer

Abstract
:1. Introduction
2. Results and Discussion
2.1. Neat Components
2.2. Binary System
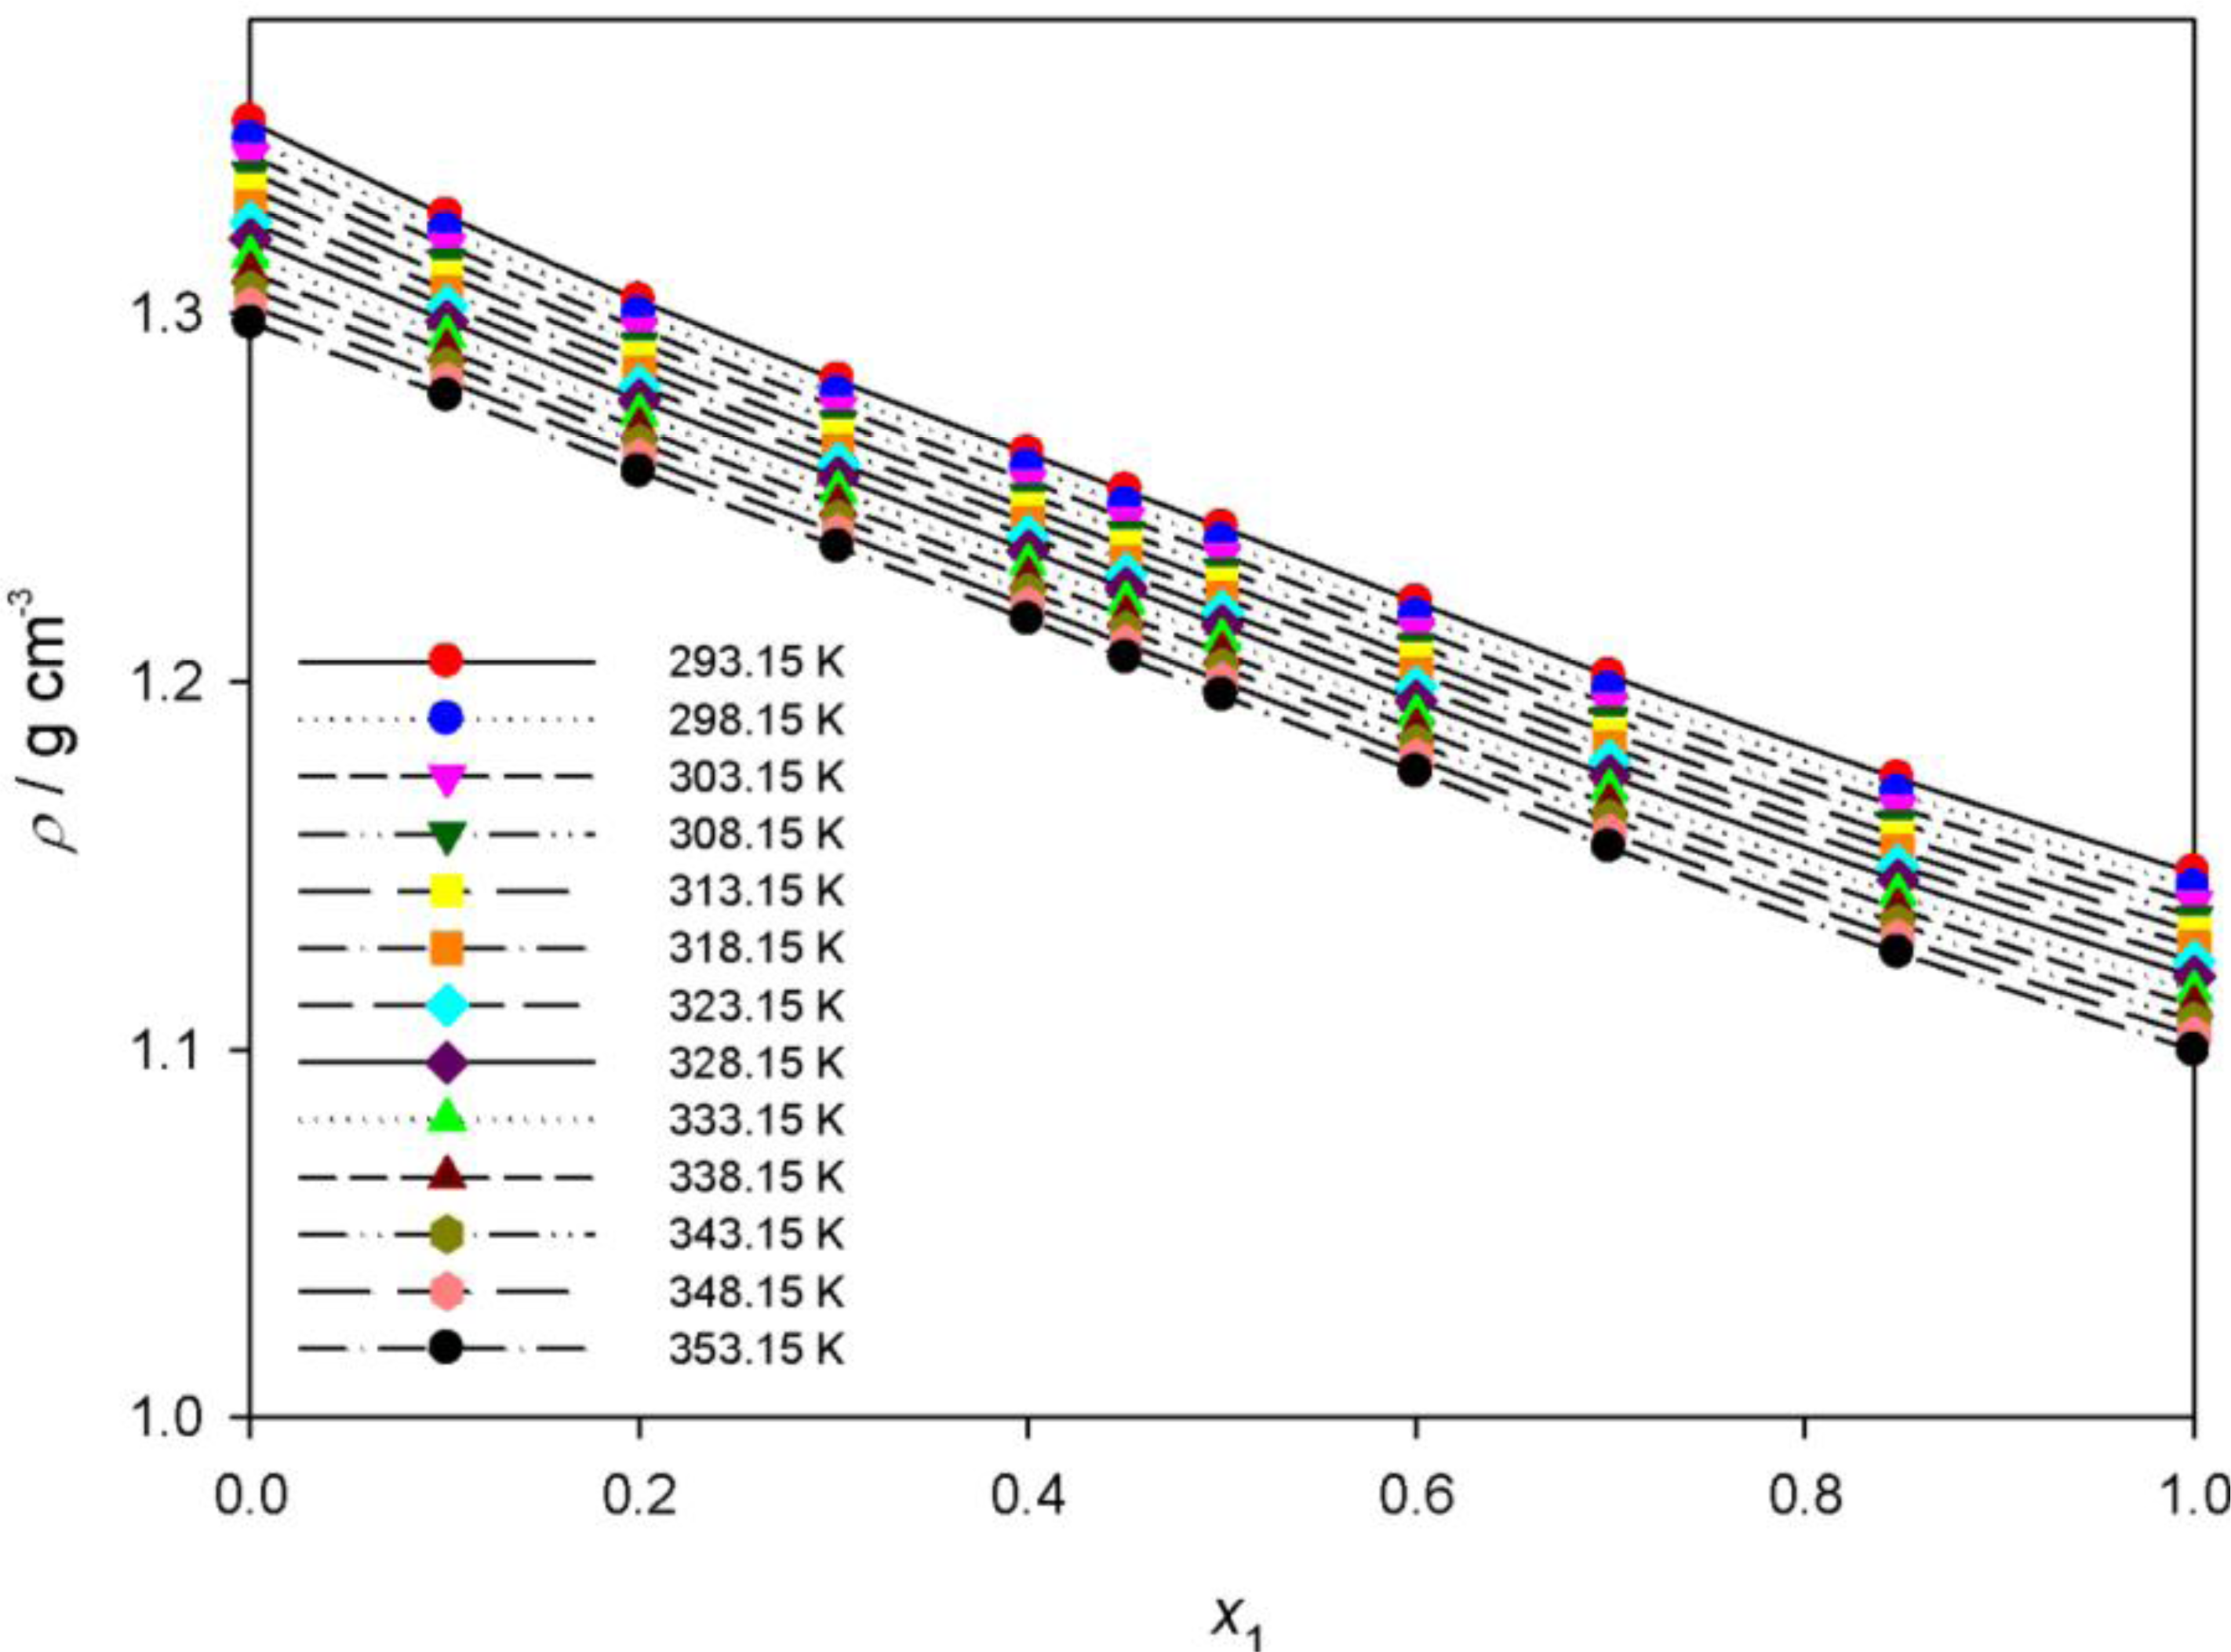
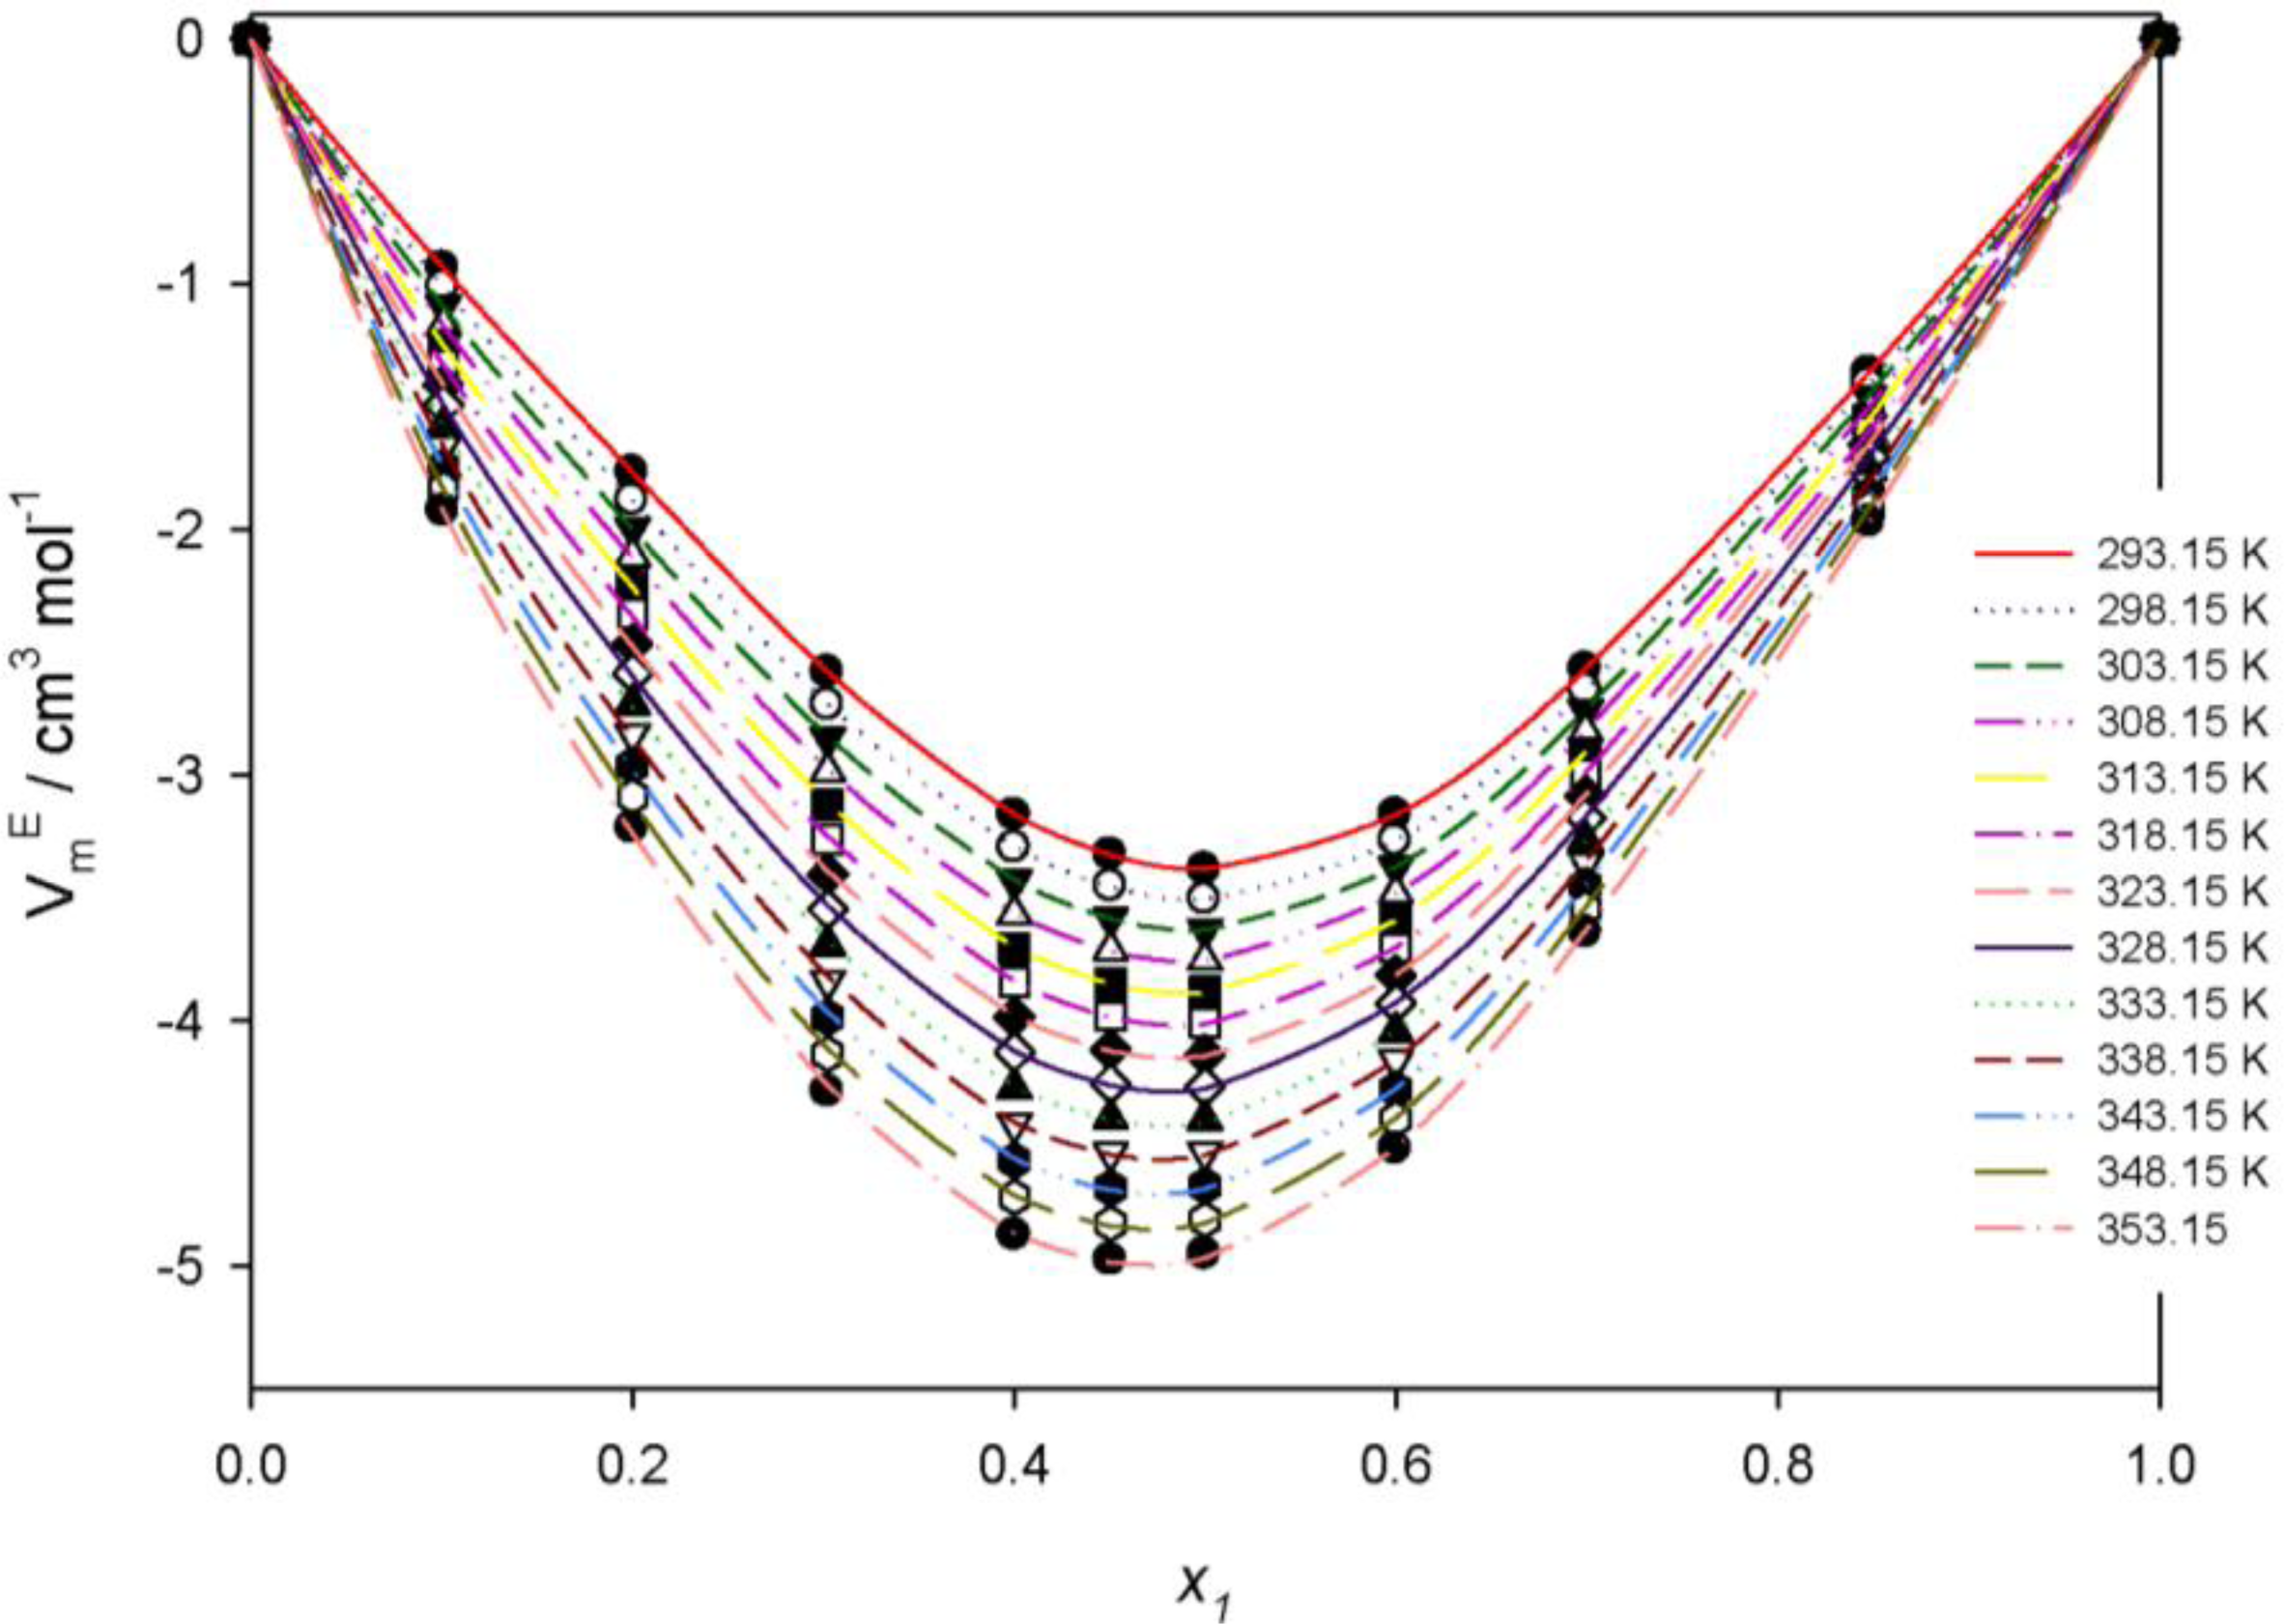
2.2.1. Effect of Composition on Density and Excess Molar Volume
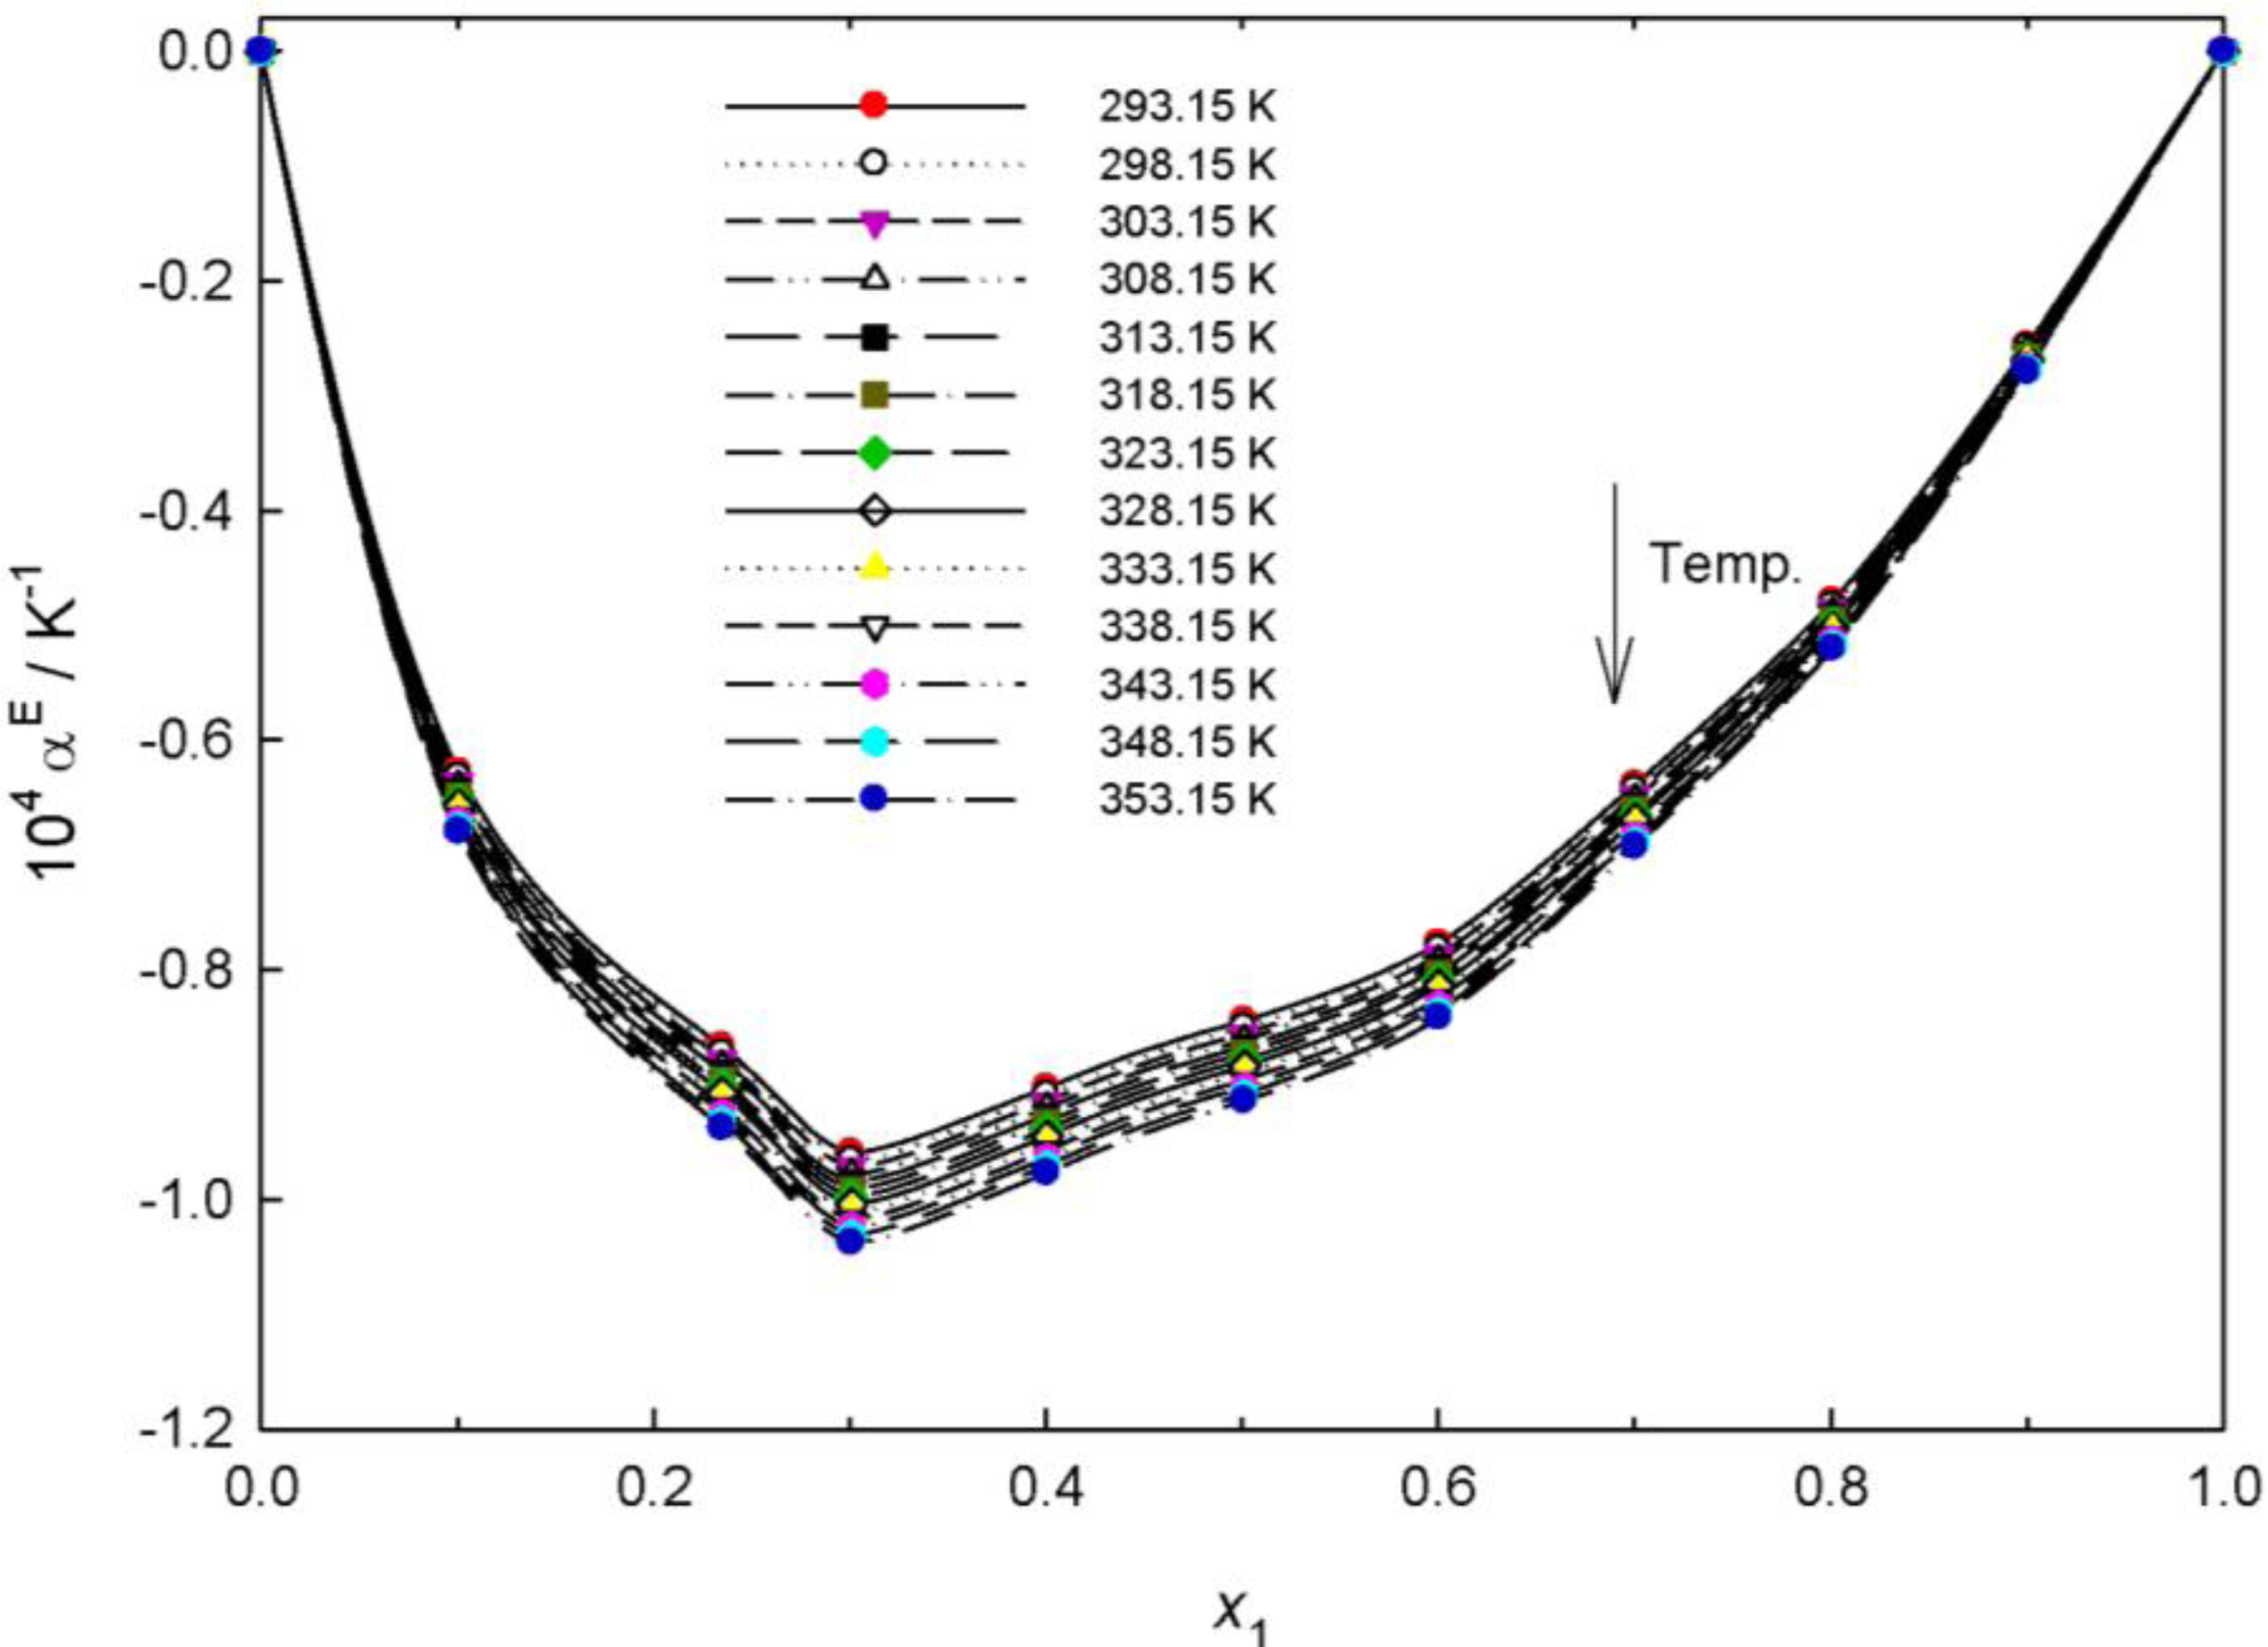
2.2.2. Volume Expansivity and Excess Volume Expansivity
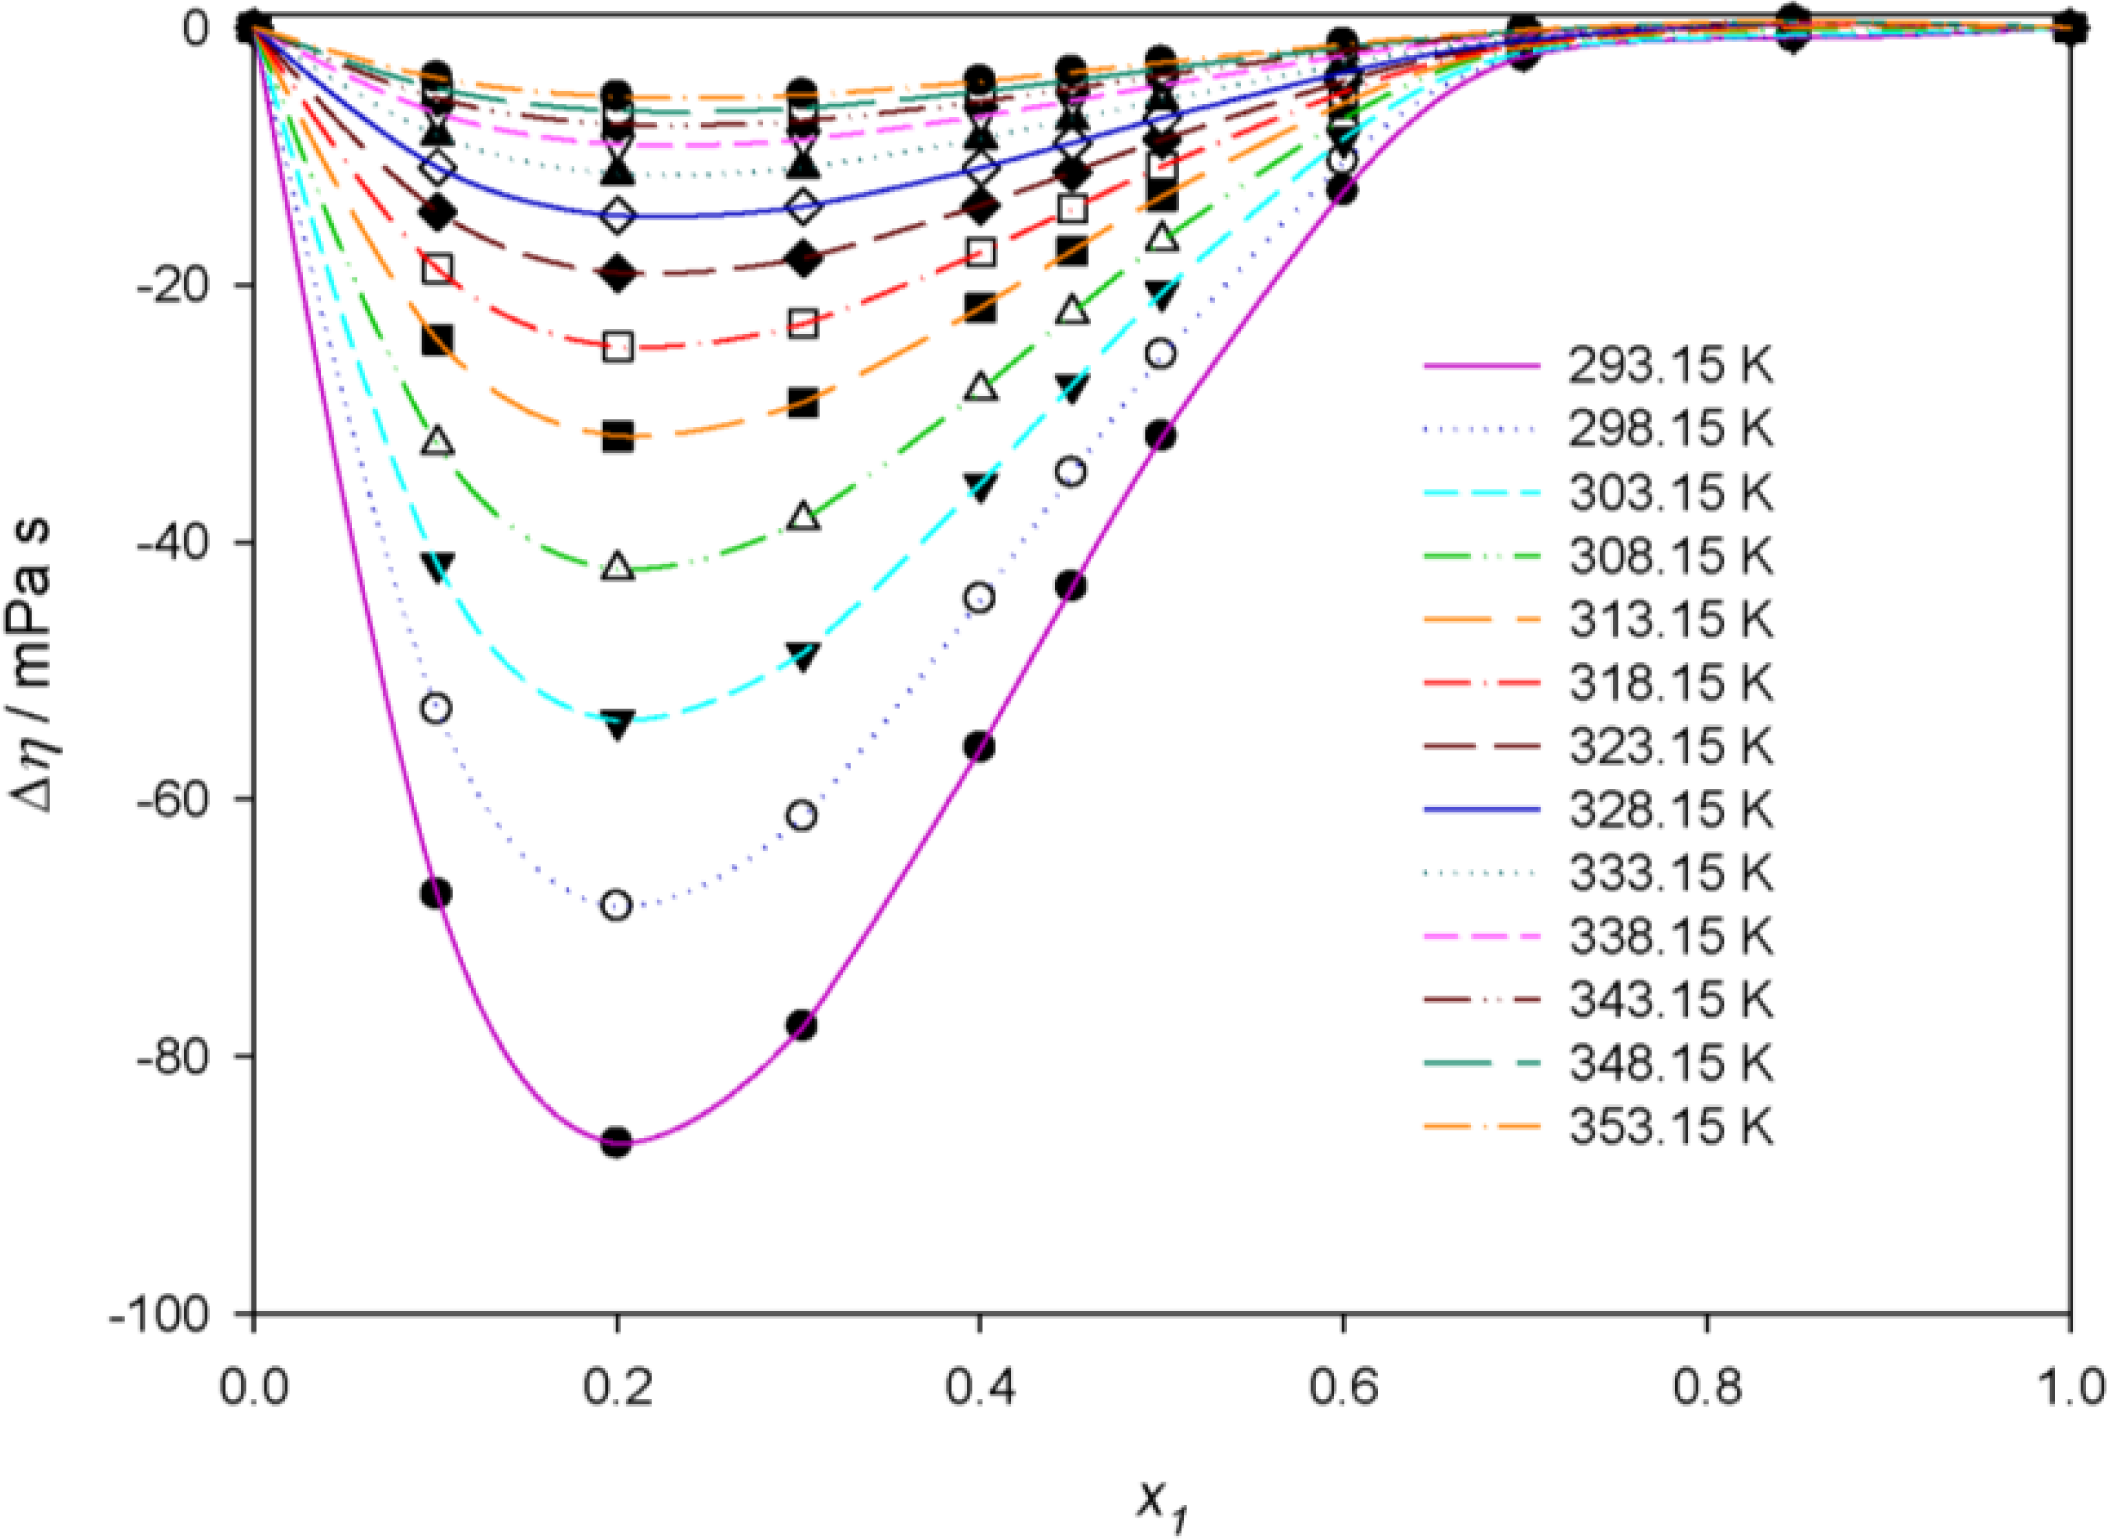
2.2.3. Effect of Composition on Viscosity Deviation
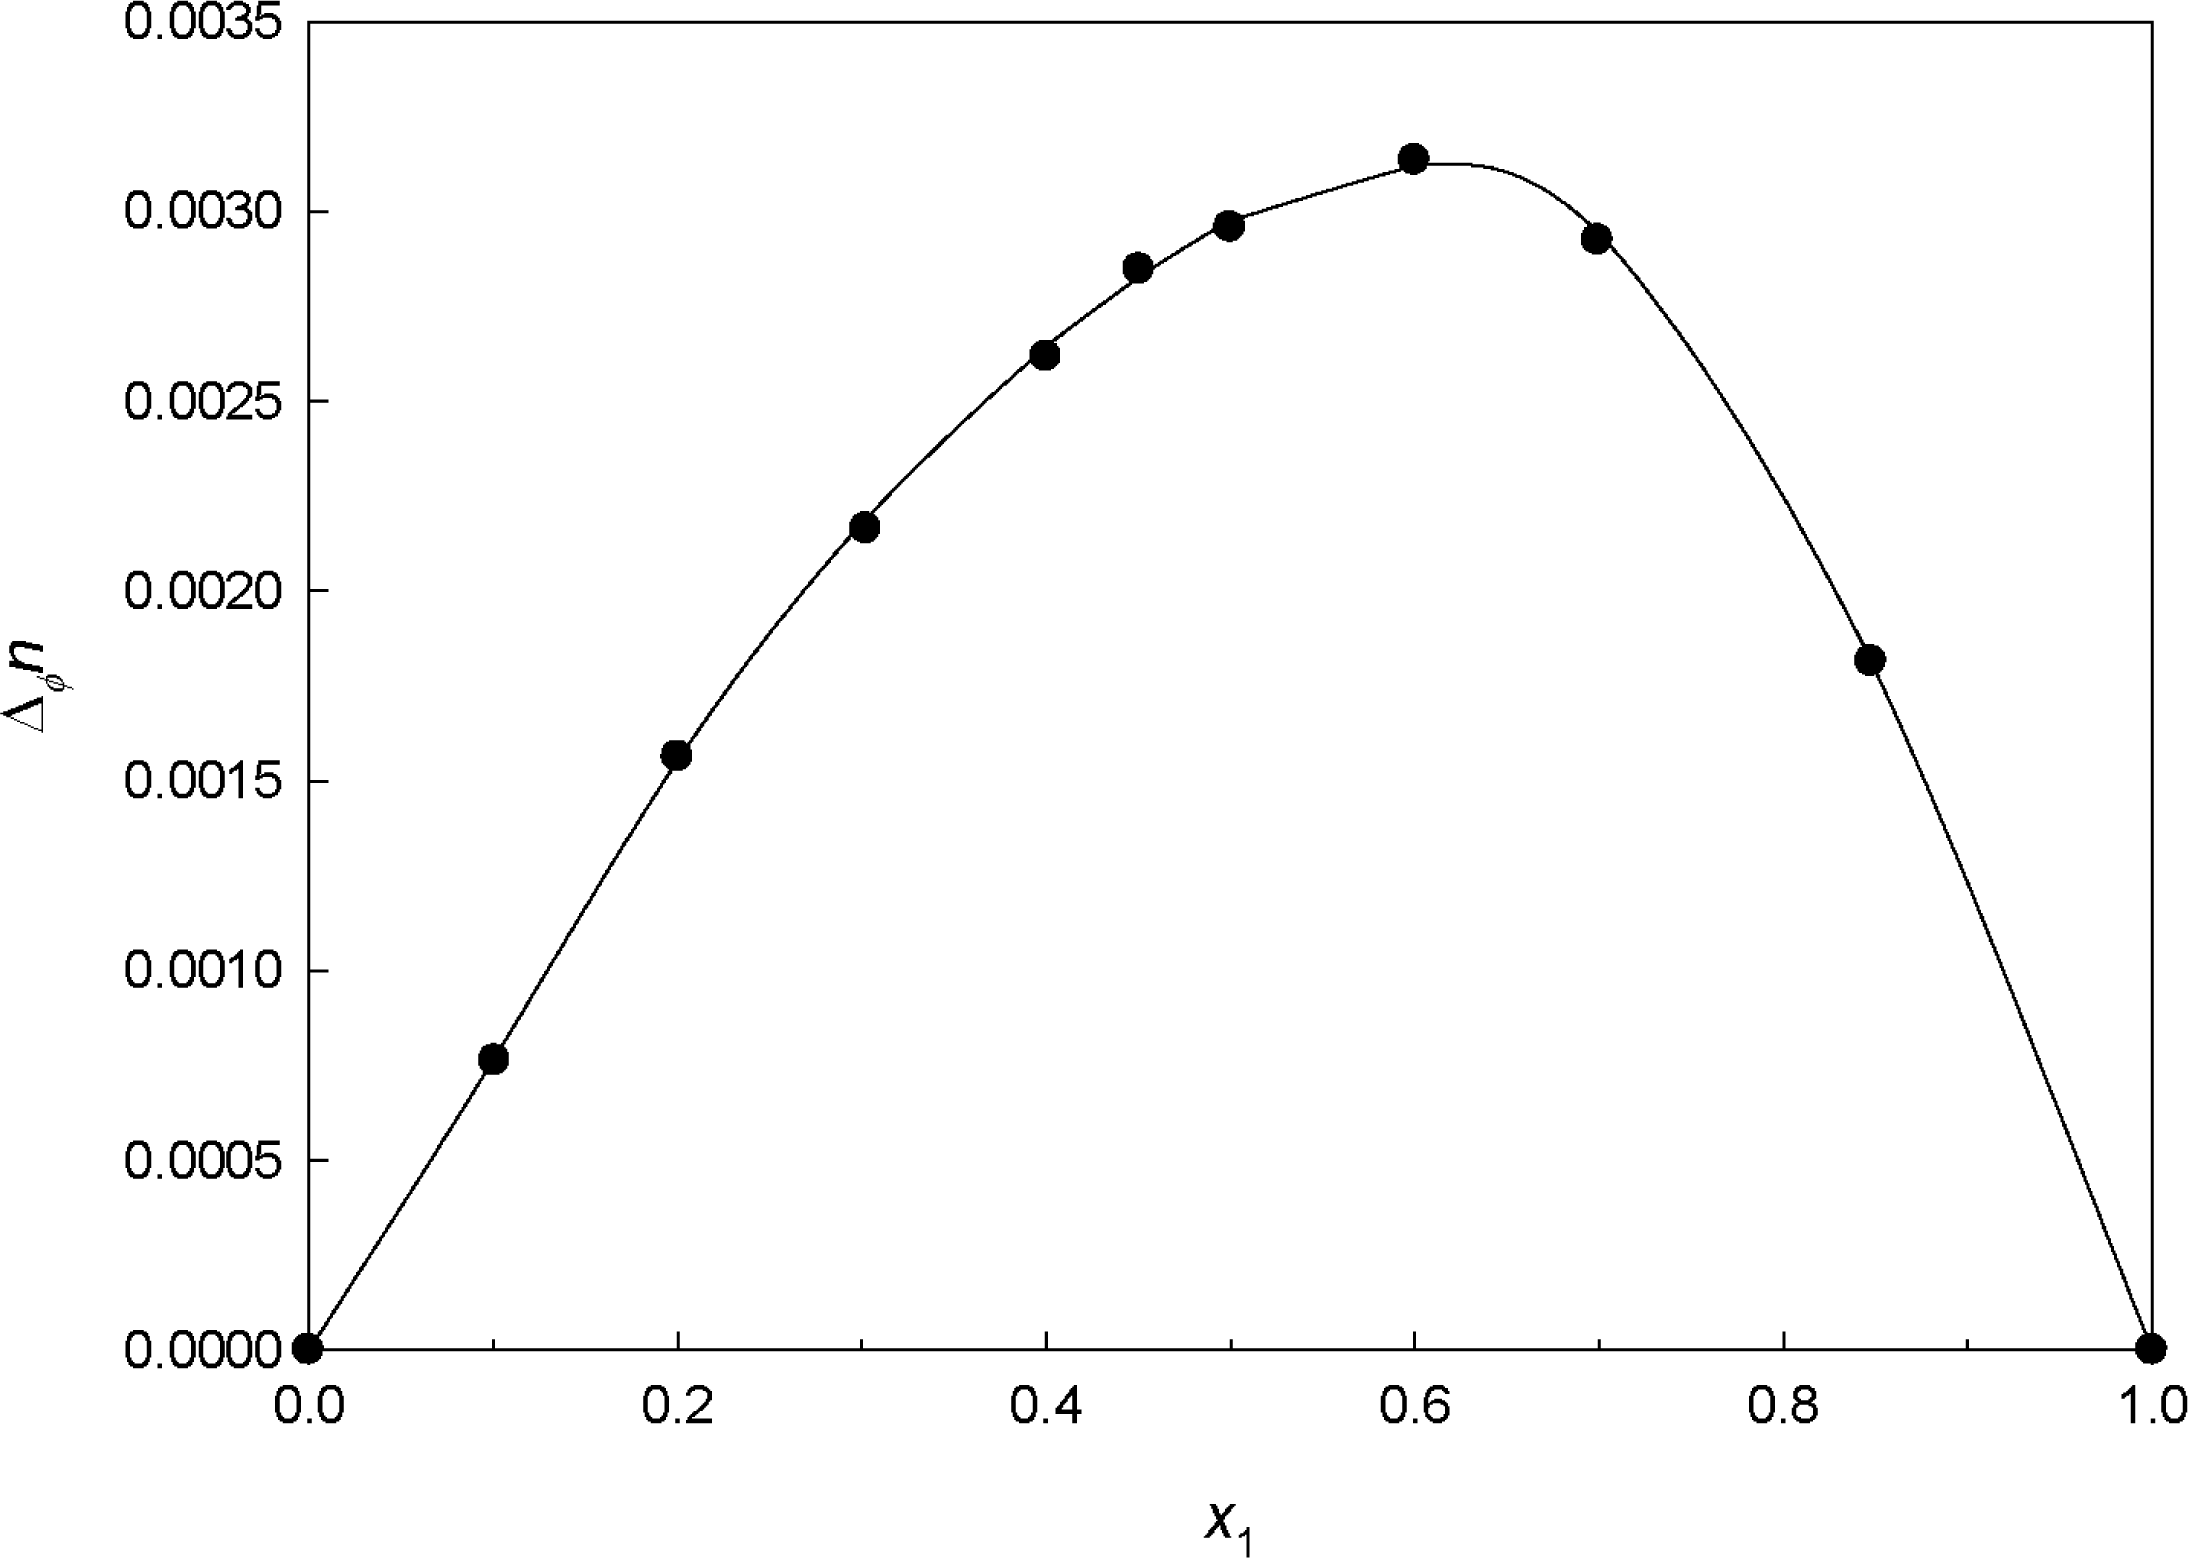
2.2.4. Effect of Composition of Deviations in the Refractive Index
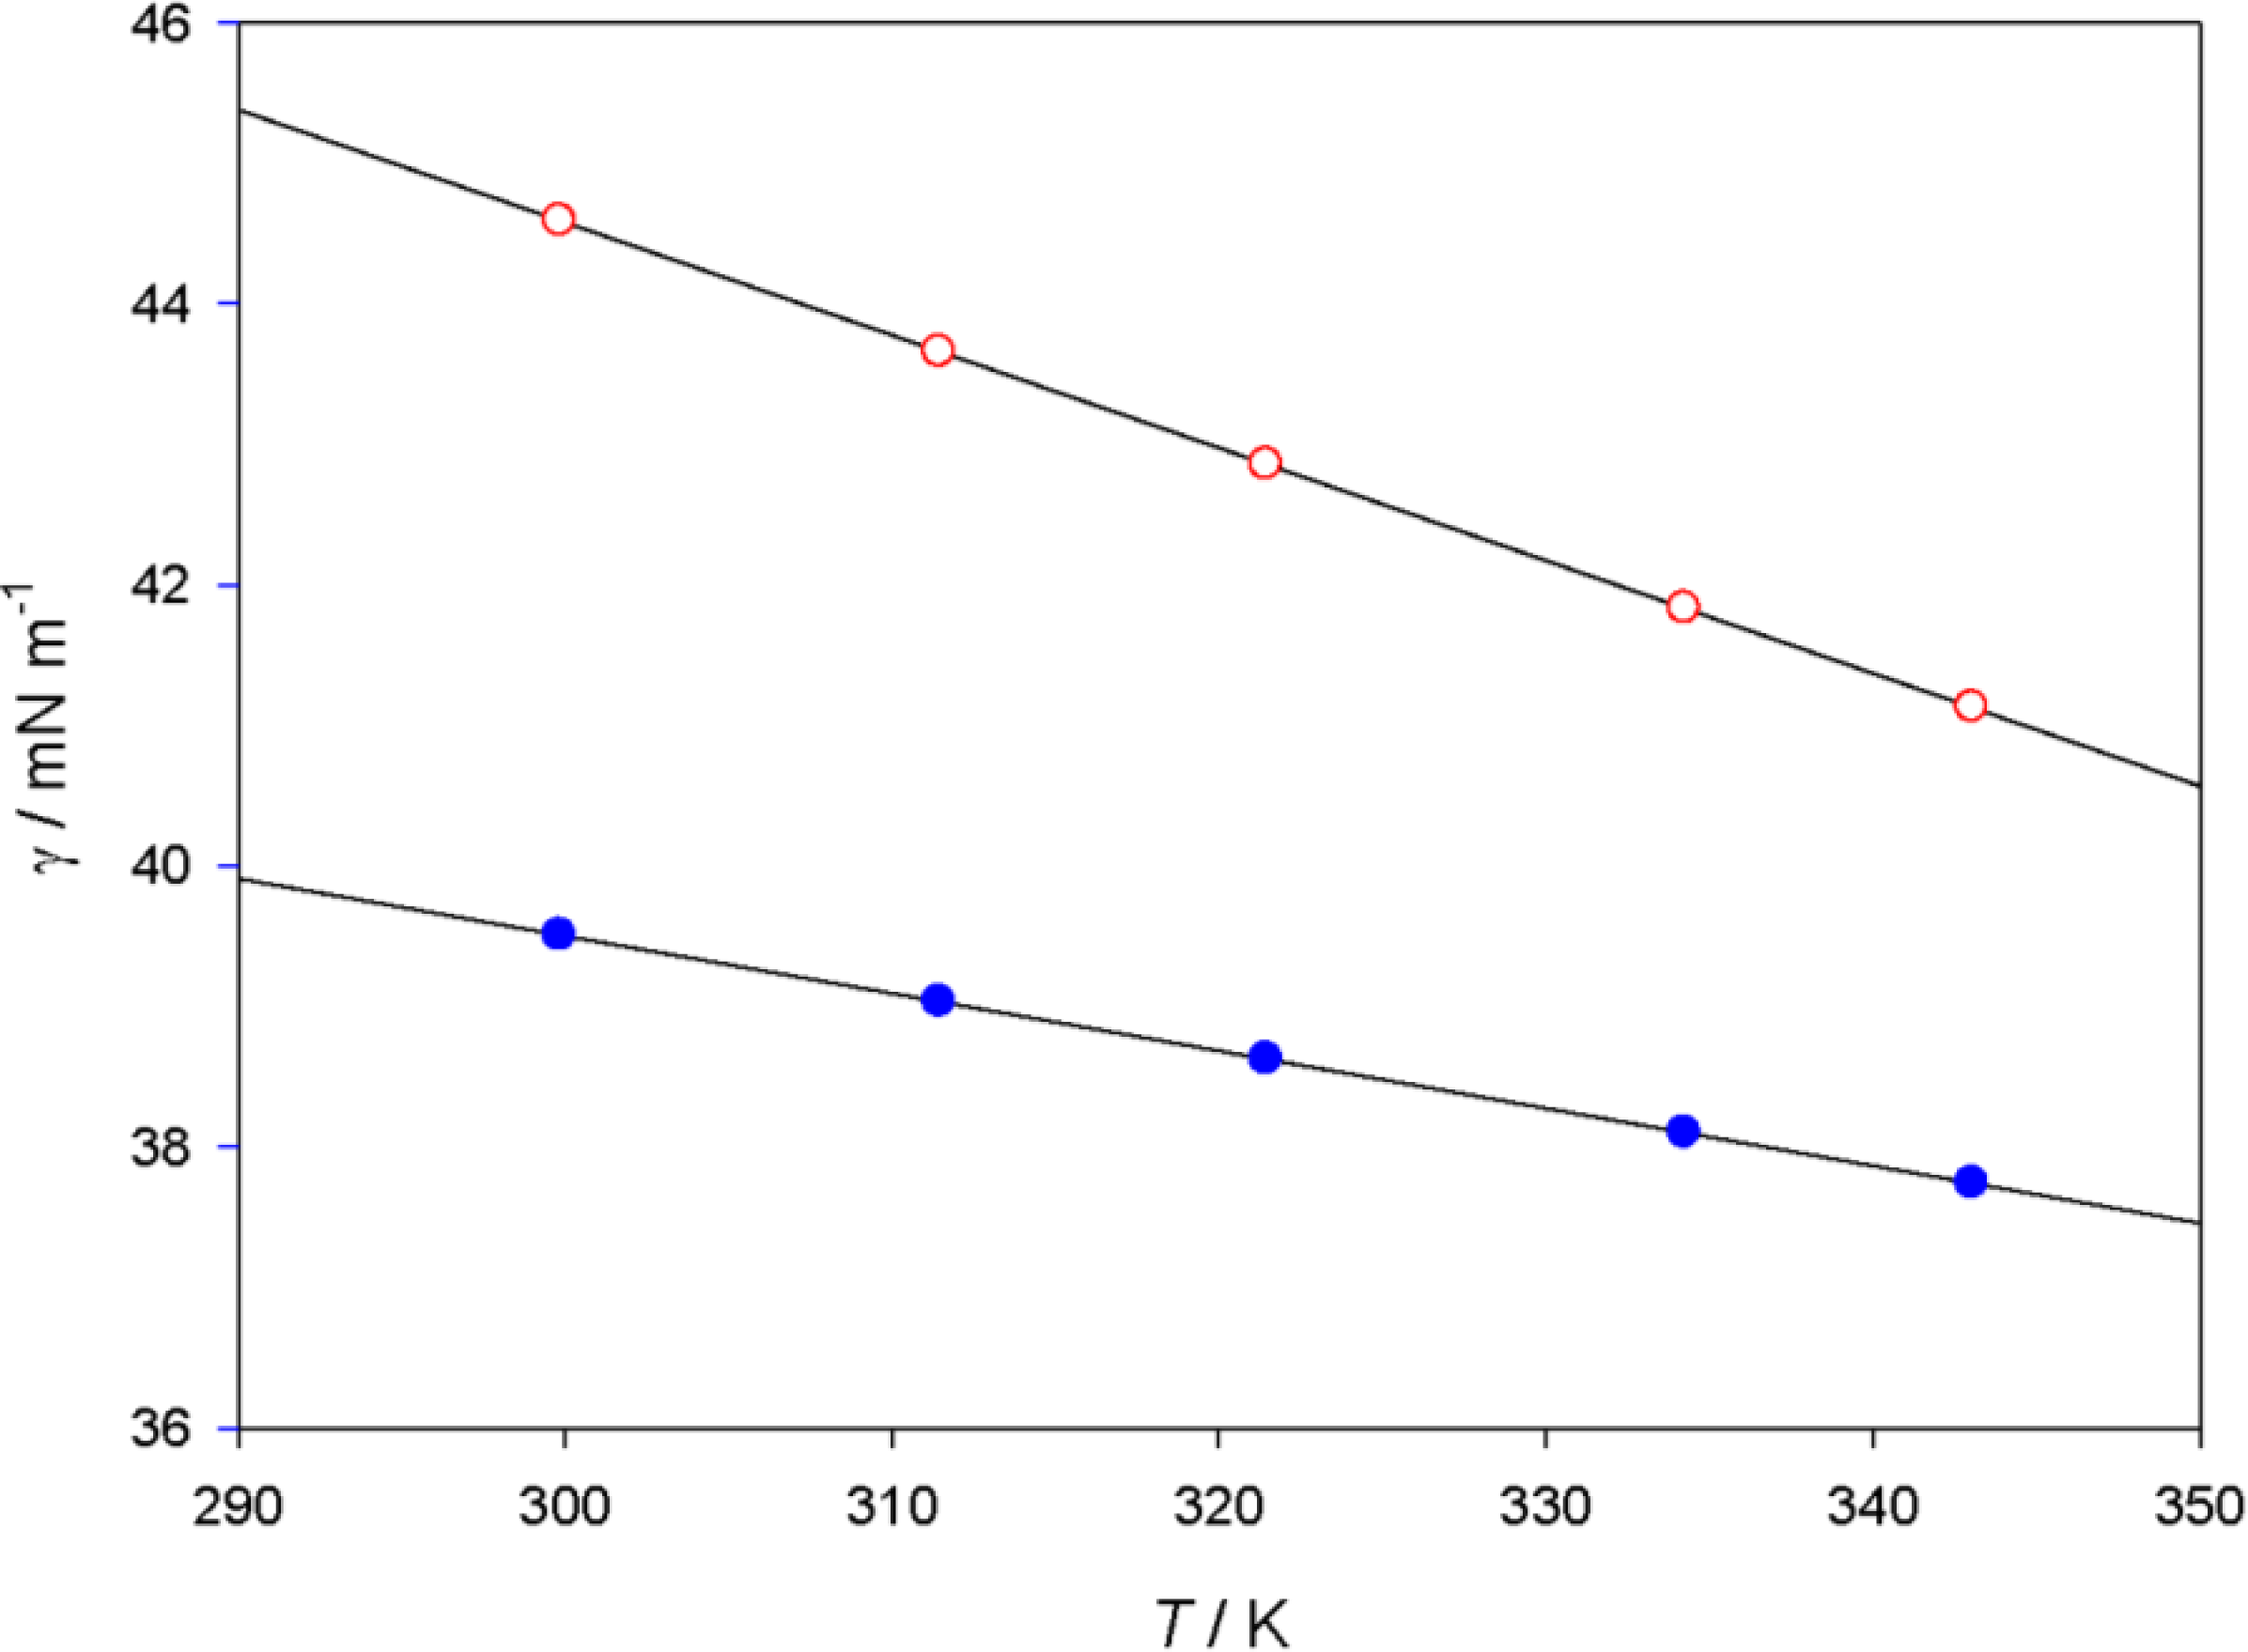
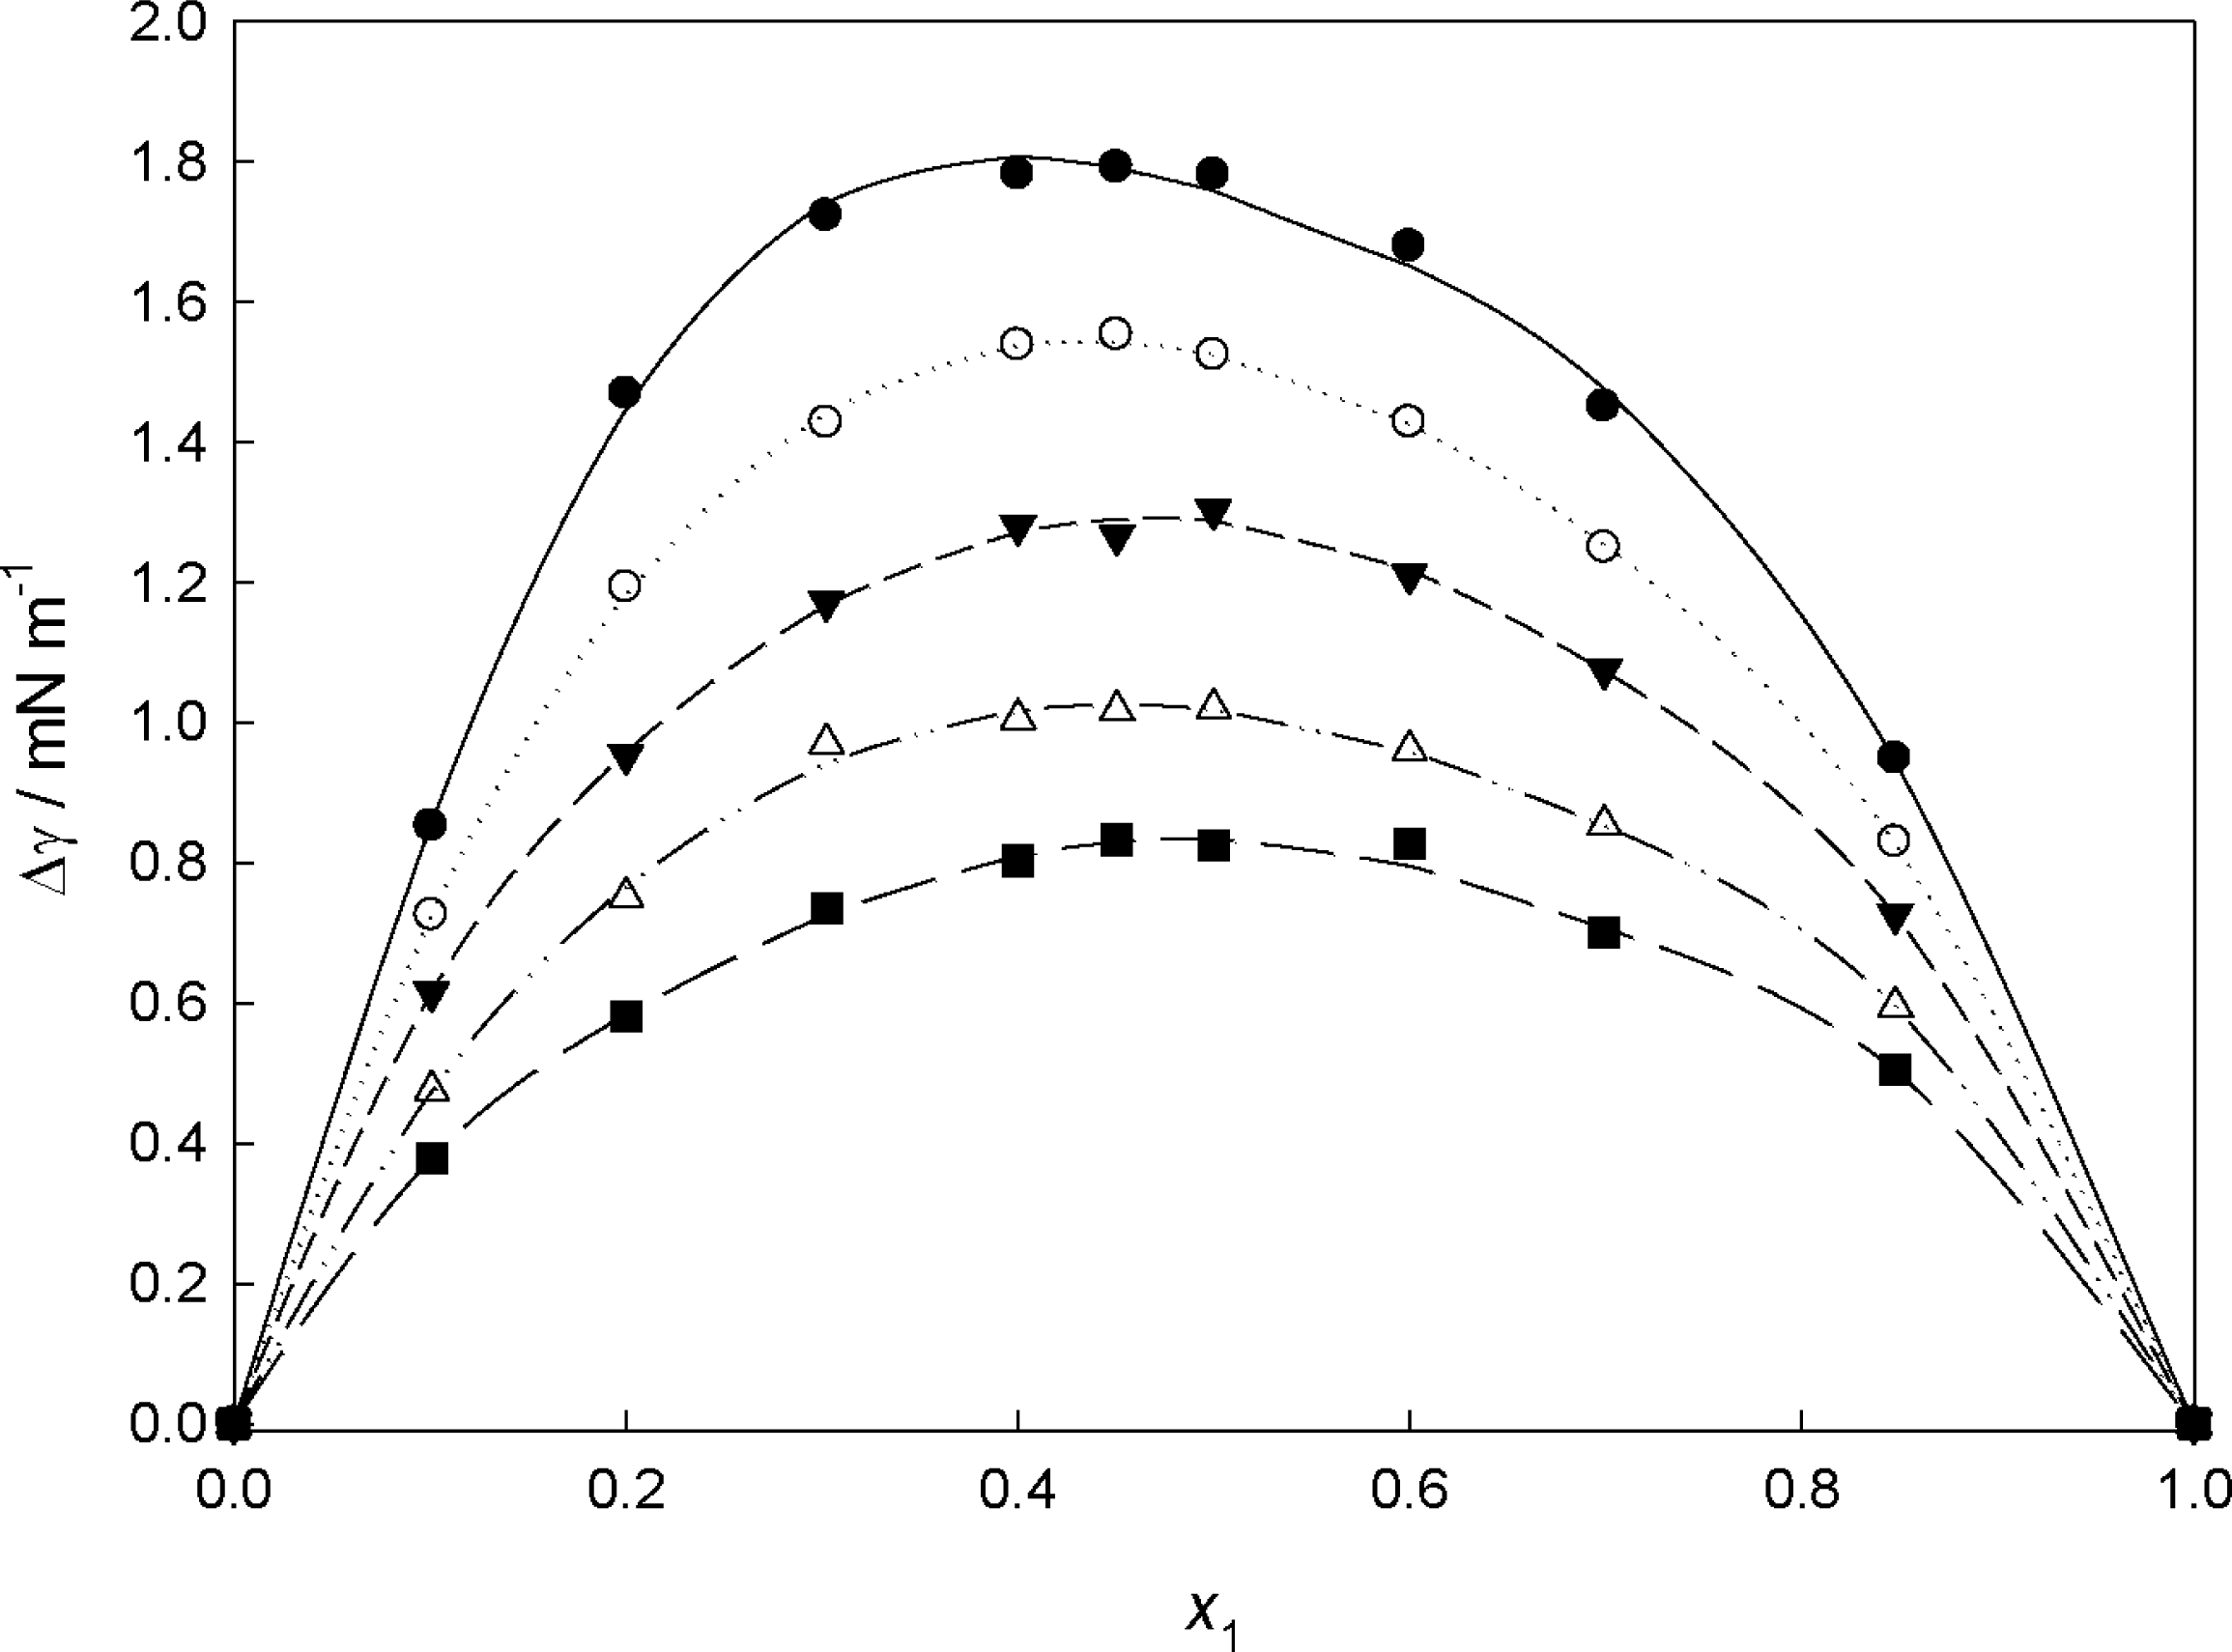
2.2.5. Effect of Composition on the Deviations of Surface Tension
2.2.6. Redlich-Kister Equation for Binary System
3. Experimental Section
3.1. Materials
3.2. Measurements
3.3. Synthetic Procedure of 1-Methyl-3-pentyl-imidazolium Hexafluorophosphate ([MPI][PF6])
4. Conclusions
Acknowledgments
References
- Walden, P. Molecular weights and electrical conductivity of several fused salts. Bull. Acad. Imper. Sci. (St. Petersburg) 1914, 8, 405–422. [Google Scholar]
- Domańska, U. Physico-chemical properties and phase behaviour of pyrrolidinium-based ionic liquids. Int. J. Mol. Sci 2010, 11, 1825–1841. [Google Scholar]
- Wu, TY; Su, SG; Wang, HP; Sun, IW. Glycine-based ionic liquids as potential electrolyte for electrochemical studies of organometallic and organic redox couples. Electrochem. Commun 2011, 13, 237–241. [Google Scholar]
- Marciniak, A. The solubility parameters of ionic liquids. Int. J. Mol. Sci 2010, 11, 1973–1990. [Google Scholar]
- Wu, TY; Wang, HC; Su, SG; Gung, ST; Lin, MW; Lin, CB. Aggregation influence of polyethyleneglycol organic solvents with ionic liquids BMIBF4 and BMIPF6. J. Chin. Chem. Soc 2010, 57, 44–55. [Google Scholar]
- Subramaniam, P; Mohamad, S; Alias, Y. Synthesis and characterization of the inclusion complex of dicationic ionic liquid and β-cyclodextrin. Int. J. Mol. Sci 2010, 11, 3675–3685. [Google Scholar]
- Wu, TY; Su, SG; Lin, YC; Lin, MW; Gung, ST; Sun, IW. Electrochemical and physicochemical properties of cyclic amine-based Brønsted acidic ionic liquids. Electrochim. Acta 2010, 56, 853–862. [Google Scholar]
- Wei, D. Dye sensitized solar cells. Int. J. Mol. Sci 2010, 11, 1103–1113. [Google Scholar]
- Wu, TY; Tsao, MH; Chen, FL; Su, SG; Chang, CW; Wang, HP; Lin, YC; Ou-Yang, WC; Sun, IW. Synthesis and characterization of organic dyes containing various donors and acceptors. Int. J. Mol. Sci 2010, 11, 329–353. [Google Scholar]
- Lane, GH; Best, AS; MacFarlane, DR; Forsyth, M; Bayley, PM; Hollenkamp, AF. The electrochemistry of lithium in ionic liquid/organic diluent mixtures. Electrochim. Acta 2010, 55, 8947–8952. [Google Scholar]
- Tsao, MH; Wu, TY; Wang, HP; Sun, IW; Su, SG; Lin, YC; Chang, CW. An efficient metal free sensitizer for dye-sensitized solar cells. Mater. Lett 2011, 65, 583–586. [Google Scholar]
- Lakshminarayana, G; Nogami, M. Inorganic-organic hybrid membranes with anhydrous proton conduction prepared from tetramethoxysilane/methyl-tri methoxysilane/trimethylphosphate and 1-ethyl-3-methylimidazolium-bis(trifluoro methanesulfonyl) imide for H2/O2 fuel cells. Electrochim. Acta 2010, 55, 1160–1168. [Google Scholar]
- Wu, TY; Tsao, MH; Chen, FL; Su, SG; Chang, CW; Wang, HP; Lin, YC; Sun, IW. Synthesis and characterization of three organic dyes with various donors and rhodanine ring acceptor for use in dye-sensitized solar cells. J. Iran. Chem. Soc 2010, 7, 707–720. [Google Scholar]
- Ranke, J; Othman, A; Fan, P; Müller, A. Explaining ionic liquid water solubility in terms of cation and anion hydrophobicity. Int. J. Mol. Sci 2009, 10, 1271–1289. [Google Scholar]
- Rilo, E; Vila, J; Pico, J; Garcia-Garabal, S; Segade, L; Varela, LM; Cabeza, O. Electrical conductivity and viscosity of aqueous binary mixtures of 1-alkyl-3-methyl imidazolium tetrafluoroborate at four temperatures. J. Chem. Eng. Data 2010, 55, 639–644. [Google Scholar]
- Li, JG; Hu, YF; Sun, SF; Liu, YS; Liu, ZC. Densities and dynamic viscosities of the binary system (water + 1-hexyl-3-methylimidazolium bromide) at different temperatures. J. Chem. Thermodyn 2010, 42, 904–908. [Google Scholar]
- Wu, TY; Wang, HC; Su, SG; Gung, ST; Lin, MW; Lin, CB. Characterization of ionic conductivity, viscosity, density, and self-diffusion coefficient for binary mixtures of polyethyleneglycol (or polyethyleneimine) organic solvent with room temperature ionic liquid BMIBF4 (or BMIPF6). J. Taiwan Inst. Chem. Eng 2010, 41, 315–325. [Google Scholar]
- Zhang, SJ; Li, X; Chen, HP; Wang, JF; Zhang, JM; Zhang, ML. Determination of physical properties for the binary system of 1-ethyl-3-methylimidazolium tetrafluoroborate + H2O. J. Chem. Eng. Data 2004, 49, 760–764. [Google Scholar]
- Zafarani-Moattar, MT; Shekarri, H. Apparent molar volume and isentropic compressibility of ionic liquid 1-butyl-3-methylimidazolium bromide in water, methanol, and ethanol at T = (298.15 to 318.15) K. J. Chem. Thermodyn 2005, 37, 1029–1035. [Google Scholar]
- Tian, Y; Wang, X; Wang, J. Densities and viscosities of 1-butyl-3-methylimidazolium tetrafluoroborate + molecular solvent binary mixtures. J. Chem. Eng. Data 2008, 53, 2056–2059. [Google Scholar]
- Li, X; Hou, M; Zhang, Z; Han, B; Yang, G; Wang, X; Zou, L. Absorption of CO2 by ionic liquid/polyethylene glycol mixture and the thermodynamic parameters. Green Chem 2008, 10, 879–884. [Google Scholar]
- Chen, J; Spear, SK; Huddleston, JG; Rogers, RD. Polyethylene glycol and solutions of polyethylene glycol as green reaction media. Green Chem 2005, 7, 64–82. [Google Scholar]
- Wu, TY; Su, SG; Gung, ST; Lin, MW; Lin, YC; Lai, CA; Sun, IW. Ionic liquids containing an alkyl sulfate group as potential electrolytes. Electrochim. Acta 2010, 55, 4475–4482. [Google Scholar]
- Pereiro, AB; Rodriguez, A. Experimental liquid-liquid equilibria of 1-alkyl-3-methylimidazolium hexafluorophosphate with 1-alcohols. J. Chem. Eng. Data 2007, 52, 1408–1412. [Google Scholar]
- Wu, TY; Su, SG; Gung, ST; Lin, MW; Lin, YC; Ou-Yang, WC; Sun, IW; Lai, CA. Synthesis and characterization of protic ionic liquids containing cyclic amine cations and tetrafluoroborate anion. J. Iran. Chem. Soc 2011, 8, 149–165. [Google Scholar]
- Freire, MGF; Carvalho, PJ; Fernandes, AM; Marrucho, IM; Queimada, AJ; Coutinho, JAP. Surface tensions of imidazolium based ionic liquids: anion, cation, temperature and water effect. J. Colloid Interface Sci 2007, 314, 621. [Google Scholar]
- Restolho, J; Mata, JL; Saramago, B. On the interfacial behavior of ionic liquids: Surface tensions and contact angles. J. Colloid Interface Sci 2009, 340, 82–86. [Google Scholar]
- Sánchez, LG; Espel, JR; Onink, F; Meindersma, GW; Haan, de AB. Density, viscosity, and surface tension of synthesis grade imidazolium, pyridinium, and pyrrolidinium based room temperature ionic liquids. J. Chem. Eng. Data 2009, 54, 2803–2812. [Google Scholar]
- Korosi, G; Kovátz, E. Density and surface tension of 83 organic liquids. J. Chem. Eng. Data 1981, 26, 323–332. [Google Scholar]
- Glasser, L. Lattice and phase transition thermodynamics of ionic liquids. Thermochim. Acta 2004, 421, 87–93. [Google Scholar]
- Jenkins, HDB; Glasser, L. Standard Absolute Entropy, S° 298, Values from Volume or Density. 1. Inorganic Materials. Inorg. Chem 2003, 42, 8702–8708. [Google Scholar]
- Handbook of Chemistry and Physics, 82nd ed; Lide, DR (Ed.) CRC Press: Boca Raton, FL, USA; pp. 2001–2002.
- Sugden, SJ. The variation of surface tension, VI. The variation of surface tension with temperature and some related functions. J. Chem. Soc 1924, 168, 1177–1180. [Google Scholar]
- Knotts, TA; Wilding, WV; Oscarson, JL; Rowley, RL. Use of the DIPPR database for development of QSPR correlations: Surface tension. J. Chem. Eng. Data 2001, 46, 1007–1012. [Google Scholar]
- Zaitsau, DH; Kabo, GJ; Strechan, AA; Paulechka, YU; Tschersich, A; Verevkin, SP; Heintz, A. Experimental vapor pressures of 1-alkyl-3-methylimidazolium bis(trifluoromethylsulfonyl)imides and a correlation scheme for estimation of vaporization enthalpies of ionic liquids. J. Phys. Chem. A 2006, 110, 7303–7306. [Google Scholar]
- Wang, JJ; Tian, Y; Zhao, Y; Zhuo, KL. A volumetric and viscosity study for the mixtures of 1-n-butyl-3-methylimidazolium tetrafluoroborate ionic liquid with acetonitrile, dichloromethane, 2-butanone and N,N-dimethylformamide. Green Chem 2003, 5, 618–622. [Google Scholar]
- Wang, JJ; Zhu, AL; Zhao, Y. Excess molar volumes and excess logarithm viscosities for binary mixtures of the ionic liquid 1-butyl-3-methylimidazolium hexaflurophosphate with some organic compounds. J. Solution Chem 2005, 34, 585–596. [Google Scholar]
- Gu, Z; Brennecke, JF. Volume expansivities and isothermal compressibilities of imidazolium and pyridinium-based ionic liquids. J. Chem. Eng. Data 2002, 47, 339–345. [Google Scholar]
- Anouti, M; Vigeant, A; Jacquemin, J; Brigouleix, C; Lemordant, D. Volumetric properties, viscosity and refractive index of the protic ionic liquid, pyrrolidinium octanoate, in molecular solvents. J. Chem. Thermodyn 2010, 42, 834–845. [Google Scholar] [Green Version]
- Brocos, P; Piñeiro, A; Bravo, R; Amigo, A. Refractive indices, molar volumes and molar refractions of binary liquid mixtures: Concepts and correlations. Phys. Chem. Chem. Phys 2003, 5, 550–557. [Google Scholar]
- Redlich, O; Kister, AT. Algebraic representation of thermodynamic properties and the classification of solutions. Ind. Eng. Chem 1948, 40, 345–348. [Google Scholar]
- Paul, A; Kumar, P; Samanta, A. On the optical properties of the imidazolium ionic liquids. J. Phys. Chem. B 2005, 109, 9148–9153. [Google Scholar]

 ) and PEG400 (
 ).
).


| [MPI][PF6] | PEG400 | ||
|---|---|---|---|
| T (K) | η (cp) | T (K) | η (cp) |
| 301.0 | 280.4 | 302.0 | 73.7 |
| 310.0 | 167.5 | 313.0 | 47.1 |
| 315.0 | 131.2 | 323.0 | 31.7 |
| 321.5 | 99.0 | 334.0 | 22.4 |
| 326.0 | 80.4 | 338.9 | 19.1 |
| 331.5 | 61.8 | 342.0 | 17.5 |
| 337.0 | 51.5 | 348.5 | 14.8 |
| 342.0 | 41.3 | 352.0 | 13.7 |
| 347.0 | 34.3 | 358.0 | 11.0 |
| 353.0 | 27.9 | ||
| 357.9 | 26.0 | ||
| T (K) | ρ (g cm−3) | T (K) | ρ (g cm−3) |
| 301.0 | 1.345 | 302.0 | 1.1415 |
| 310.0 | 1.336 | 313.0 | 1.1323 |
| 315.0 | 1.332 | 323.0 | 1.1244 |
| 321.5 | 1.327 | 334.0 | 1.1152 |
| 326.0 | 1.323 | 338.9 | 1.1113 |
| 331.5 | 1.318 | 342.0 | 1.1089 |
| 337.0 | 1.313 | 348.5 | 1.1037 |
| 342.0 | 1.308 | 352.0 | 1.1009 |
| 347.0 | 1.303 | 358.0 | 1.0966 |
| 353.0 | 1.298 | ||
| 357.9 | 1.293 | ||
| ρ | η | ||||||
|---|---|---|---|---|---|---|---|
| Species | A | 104B | R2a | ηo (mP s) | To (K) | B (K) | R2a |
| [MPI][PF6] | 1.619 | −9.111 | 0.9989 | 0.0512 | 155.7 | 1251 | 0.999 |
| PEG400 | 1.384 | −8.054 | 0.9998 | 0.0965 | 156.9 | 963.9 | 0.999 |
| Species | So (mN m−1 K−1) | HA (mN m−1) |
|---|---|---|
| [MPI][PF6] | 0.0409 | 51.77 |
| PEG400 | 0.0802 | 68.63 |
| [BMIM]BF4 a | 0.0593 | 61.80 |
| [BMPy]BF4 a | 0.0607 | 63.1 |
| [BMIM]DCA a | 0.0775 | 71.88 |
| T (K) | |||||||||||||
|---|---|---|---|---|---|---|---|---|---|---|---|---|---|
| x1 | 293.15 | 298.15 | 303.15 | 308.15 | 313.15 | 318.15 | 323.15 | 328.15 | 333.15 | 338.15 | 343.15 | 348.15 | 353.15 |
| ρ (g cm−3) | |||||||||||||
| 0 | 1.3520 | 1.3475 | 1.3429 | 1.3384 | 1.3338 | 1.3293 | 1.3247 | 1.3202 | 1.3156 | 1.3110 | 1.3065 | 1.3019 | 1.2974 |
| 0.1010 | 1.3266 | 1.3225 | 1.3184 | 1.3144 | 1.3103 | 1.3062 | 1.3021 | 1.2980 | 1.2940 | 1.2899 | 1.2858 | 1.2817 | 1.2776 |
| 0.2002 | 1.3036 | 1.2997 | 1.2958 | 1.2919 | 1.2881 | 1.2842 | 1.2803 | 1.2764 | 1.2726 | 1.2687 | 1.2648 | 1.2609 | 1.2570 |
| 0.3024 | 1.2819 | 1.2781 | 1.2743 | 1.2705 | 1.2668 | 1.2630 | 1.2592 | 1.2554 | 1.2517 | 1.2479 | 1.2441 | 1.2403 | 1.2366 |
| 0.4002 | 1.2620 | 1.2583 | 1.2545 | 1.2507 | 1.2469 | 1.2432 | 1.2394 | 1.2356 | 1.2319 | 1.2281 | 1.2243 | 1.2205 | 1.2168 |
| 0.4507 | 1.2518 | 1.2480 | 1.2443 | 1.2405 | 1.2367 | 1.2329 | 1.2291 | 1.2253 | 1.2215 | 1.2178 | 1.2140 | 1.2102 | 1.2064 |
| 0.5000 | 1.2419 | 1.2381 | 1.2343 | 1.2305 | 1.2267 | 1.2228 | 1.2190 | 1.2152 | 1.2114 | 1.2076 | 1.2038 | 1.2000 | 1.1962 |
| 0.6000 | 1.2216 | 1.2177 | 1.2139 | 1.2100 | 1.2062 | 1.2023 | 1.1985 | 1.1947 | 1.1908 | 1.1870 | 1.1831 | 1.1793 | 1.1754 |
| 0.6994 | 1.2016 | 1.1977 | 1.1938 | 1.1899 | 1.1861 | 1.1822 | 1.1783 | 1.1744 | 1.1705 | 1.1666 | 1.1627 | 1.1588 | 1.1549 |
| 0.8476 | 1.1737 | 1.1698 | 1.1658 | 1.1619 | 1.1579 | 1.1540 | 1.1500 | 1.1461 | 1.1421 | 1.1382 | 1.1342 | 1.1303 | 1.1263 |
| 1 | 1.1480 | 1.1440 | 1.1400 | 1.1359 | 1.1319 | 1.1279 | 1.1239 | 1.1198 | 1.1158 | 1.1118 | 1.1077 | 1.1037 | 1.0997 |
| 0 | 0.0000 | 0.0000 | 0.0000 | 0.0000 | 0.0000 | 0.0000 | 0.0000 | 0.0000 | 0.0000 | 0.0000 | 0.0000 | 0.0000 | 0.0000 |
| 0.1010 | −0.9351 | −1.0118 | −1.0894 | −1.1680 | −1.2477 | −1.3283 | −1.4101 | −1.4928 | −1.5767 | −1.6616 | −1.7476 | −1.8348 | −1.9230 |
| 0.2002 | −1.7666 | −1.8793 | −1.9935 | −2.1090 | −2.2260 | −2.3445 | −2.4646 | −2.5861 | −2.7091 | −2.8338 | −2.9600 | −3.0879 | −3.2173 |
| 0.3024 | −2.5811 | −2.7139 | −2.8484 | −2.9846 | −3.1225 | −3.2621 | −3.4034 | −3.5466 | −3.6915 | −3.8383 | −3.9869 | −4.1375 | −4.2899 |
| 0.4002 | −3.1625 | −3.2954 | −3.4301 | −3.5664 | −3.7044 | −3.8442 | −3.9857 | −4.1291 | −4.2742 | −4.4211 | −4.5700 | −4.7207 | −4.8733 |
| 0.4507 | −3.3238 | −3.4522 | −3.5821 | −3.7137 | −3.8469 | −3.9818 | −4.1184 | −4.2568 | −4.3969 | −4.5388 | −4.6824 | −4.8280 | −4.9753 |
| 0.5000 | −3.3847 | −3.5064 | −3.6297 | −3.7544 | −3.8808 | −4.0087 | −4.1383 | −4.2695 | −4.4024 | −4.5370 | −4.6733 | −4.8113 | −4.9511 |
| 0.6000 | −3.1618 | −3.2674 | −3.3743 | −3.4826 | −3.5923 | −3.7034 | −3.8159 | −3.9298 | −4.0453 | −4.1622 | −4.2806 | −4.4005 | −4.5220 |
| 0.6994 | −2.5687 | −2.6519 | −2.7361 | −2.8213 | −2.9077 | −2.9952 | −3.0839 | −3.1737 | −3.2646 | −3.3568 | −3.4501 | −3.5447 | −3.6405 |
| 0.8476 | −1.3611 | −1.4082 | −1.4559 | −1.5042 | −1.5532 | −1.6028 | −1.6531 | −1.7041 | −1.7557 | −1.8080 | −1.8610 | −1.9148 | −1.9692 |
| 1 | 0.0000 | 0.0000 | 0.0000 | 0.0000 | 0.0000 | 0.0000 | 0.0000 | 0.0000 | 0.0000 | 0.0000 | 0.0000 | 0.0000 | 0.0000 |
| T (K) | |||||||||||||
|---|---|---|---|---|---|---|---|---|---|---|---|---|---|
| x1 | 293.15 | 298.15 | 303.15 | 308.15 | 313.15 | 318.15 | 323.15 | 328.15 | 333.15 | 338.15 | 343.15 | 348.15 | 353.15 |
| 10−4 α (K−1) | |||||||||||||
| 0 | 6.7387 | 6.7614 | 6.7844 | 6.8075 | 6.8307 | 6.8541 | 6.8777 | 6.9014 | 6.9253 | 6.9494 | 6.9736 | 6.9980 | 7.0226 |
| 0.1006 | 6.1525 | 6.1715 | 6.1906 | 6.2098 | 6.2292 | 6.2487 | 6.2682 | 6.2879 | 6.3078 | 6.3277 | 6.3478 | 6.3680 | 6.3884 |
| 0.2349 | 5.9498 | 5.9675 | 5.9854 | 6.0034 | 6.0214 | 6.0396 | 6.0579 | 6.0763 | 6.0948 | 6.1135 | 6.1322 | 6.1511 | 6.1700 |
| 0.3010 | 5.8914 | 5.9088 | 5.9263 | 5.9439 | 5.9616 | 5.9794 | 5.9974 | 6.0154 | 6.0335 | 6.0518 | 6.0702 | 6.0886 | 6.1072 |
| 0.4007 | 5.9776 | 5.9956 | 6.0136 | 6.0317 | 6.0500 | 6.0683 | 6.0868 | 6.1054 | 6.1241 | 6.1429 | 6.1618 | 6.1808 | 6.2000 |
| 0.5013 | 6.0503 | 6.0687 | 6.0872 | 6.1057 | 6.1244 | 6.1432 | 6.1622 | 6.1812 | 6.2004 | 6.2197 | 6.2391 | 6.2586 | 6.2782 |
| 0.6002 | 6.1310 | 6.1499 | 6.1688 | 6.1879 | 6.2071 | 6.2265 | 6.2459 | 6.2655 | 6.2852 | 6.3050 | 6.3249 | 6.3450 | 6.3652 |
| 0.7003 | 6.2944 | 6.3142 | 6.3342 | 6.3544 | 6.3746 | 6.3950 | 6.4155 | 6.4362 | 6.4569 | 6.4779 | 6.4989 | 6.5201 | 6.5414 |
| 0.8010 | 6.4771 | 6.4981 | 6.5193 | 6.5406 | 6.5621 | 6.5837 | 6.6054 | 6.6273 | 6.6494 | 6.6715 | 6.6939 | 6.7164 | 6.7390 |
| 0.9000 | 6.7307 | 6.7535 | 6.7763 | 6.7994 | 6.8226 | 6.8459 | 6.8694 | 6.8931 | 6.9170 | 6.9410 | 6.9651 | 6.9895 | 7.0140 |
| 1.0000 | 7.0156 | 7.0403 | 7.0651 | 7.0902 | 7.1154 | 7.1408 | 7.1664 | 7.1922 | 7.2181 | 7.2443 | 7.2706 | 7.2971 | 7.3239 |
| 10−4 αE (K−1) | |||||||||||||
| 0.0000 | 0.0000 | 0.0000 | 0.0000 | 0.0000 | 0.0000 | 0.0000 | 0.0000 | 0.0000 | 0.0000 | 0.0000 | 0.0000 | 0.0000 | 0.0000 |
| 0.1006 | −0.6279 | −0.6320 | −0.6361 | −0.6403 | −0.6445 | −0.6487 | −0.6530 | −0.6574 | −0.6617 | −0.6662 | −0.6706 | −0.6752 | −0.6797 |
| 0.2349 | −0.8674 | −0.8729 | −0.8786 | −0.8843 | −0.8900 | −0.8958 | −0.9017 | −0.9076 | −0.9136 | −0.9196 | −0.9257 | −0.9318 | −0.9380 |
| 0.3010 | −0.9599 | −0.9660 | −0.9722 | −0.9785 | −0.9849 | −0.9913 | −0.9978 | −1.0043 | −1.0109 | −1.0176 | −1.0243 | −1.0311 | −1.0379 |
| 0.4007 | −0.9031 | −0.9090 | −0.9149 | −0.9209 | −0.9269 | −0.9330 | −0.9391 | −0.9453 | −0.9516 | −0.9579 | −0.9643 | −0.9708 | −0.9773 |
| 0.5013 | −0.8446 | −0.8502 | −0.8557 | −0.8614 | −0.8670 | −0.8728 | −0.8786 | −0.8844 | −0.8903 | −0.8963 | −0.9023 | −0.9084 | −0.9145 |
| 0.6002 | −0.7772 | −0.7823 | −0.7875 | −0.7927 | −0.7980 | −0.8033 | −0.8087 | −0.8141 | −0.8196 | −0.8251 | −0.8307 | −0.8363 | −0.8420 |
| 0.7003 | −0.6390 | −0.6433 | −0.6476 | −0.6519 | −0.6563 | −0.6608 | −0.6652 | −0.6698 | −0.6744 | −0.6790 | −0.6836 | −0.6884 | −0.6931 |
| 0.8010 | −0.4792 | −0.4825 | −0.4858 | −0.4891 | −0.4924 | −0.4958 | −0.4992 | −0.5027 | −0.5062 | −0.5097 | −0.5133 | −0.5169 | −0.5205 |
| 0.9000 | −0.2565 | −0.2583 | −0.2601 | −0.2619 | −0.2638 | −0.2656 | −0.2675 | −0.2694 | −0.2713 | −0.2732 | −0.2752 | −0.2771 | −0.2791 |
| 1.0000 | 0.0000 | 0.0000 | 0.0000 | 0.0000 | 0.0000 | 0.0000 | 0.0000 | 0.0000 | 0.0000 | 0.0000 | 0.0000 | 0.0000 | 0.0000 |
| T (K) | |||||||||||||
|---|---|---|---|---|---|---|---|---|---|---|---|---|---|
| x1 | 293.15 | 298.15 | 303.15 | 308.15 | 313.15 | 318.15 | 323.15 | 328.15 | 333.15 | 338.15 | 343.15 | 348.15 | 353.15 |
| η (mPa·s) | |||||||||||||
| 0 | 463.8 | 336.7 | 249.8 | 189.1 | 145.6 | 114.0 | 90.5 | 72.9 | 59.4 | 48.9 | 40.7 | 34.2 | 29.0 |
| 0.1010 | 360.8 | 258.6 | 190.1 | 143.3 | 111.4 | 87.6 | 70.3 | 57.4 | 47.3 | 39.3 | 32.8 | 27.5 | 23.5 |
| 0.2002 | 306.6 | 218.6 | 160.0 | 120.5 | 94.0 | 74.1 | 59.8 | 49.1 | 40.8 | 34.0 | 28.5 | 23.9 | 20.4 |
| 0.3024 | 279.8 | 200.2 | 147.0 | 110.9 | 86.5 | 68.1 | 55.0 | 45.1 | 37.5 | 31.4 | 26.3 | 22.1 | 18.9 |
| 0.4002 | 267.0 | 192.9 | 142.6 | 108.1 | 84.3 | 66.3 | 53.4 | 43.7 | 36.2 | 30.4 | 25.5 | 21.5 | 18.4 |
| 0.4507 | 261.8 | 190.1 | 141.3 | 107.4 | 83.7 | 65.9 | 53.0 | 43.3 | 35.9 | 30.1 | 25.3 | 21.4 | 18.3 |
| 0.5000 | 256.2 | 187.1 | 139.6 | 106.5 | 83.0 | 65.5 | 52.7 | 43.0 | 35.6 | 29.9 | 25.1 | 21.3 | 18.2 |
| 0.6000 | 240.1 | 177.3 | 133.6 | 102.8 | 80.4 | 63.7 | 51.4 | 41.9 | 34.8 | 29.2 | 24.7 | 21.0 | 18.1 |
| 0.6994 | 215.6 | 161.0 | 122.5 | 95.2 | 75.0 | 60.0 | 48.6 | 39.9 | 33.2 | 28.0 | 23.8 | 20.4 | 17.6 |
| 0.8476 | 165.0 | 125.5 | 97.3 | 77.0 | 61.8 | 50.3 | 41.4 | 34.5 | 29.0 | 24.6 | 21.1 | 18.2 | 15.9 |
| 1 | 112.2 | 88.4 | 70.6 | 57.1 | 46.7 | 38.6 | 32.2 | 27.1 | 23.1 | 19.7 | 17.0 | 14.8 | 12.9 |
| Δη (mPa·s) | |||||||||||||
| 0 | 0.0 | 0.0 | 0.0 | 0.0 | 0.0 | 0.0 | 0.0 | 0.0 | 0.0 | 0.0 | 0.0 | 0.0 | 0.0 |
| 0.1010 | −67.4 | −53.0 | −41.7 | −32.4 | −24.3 | −18.8 | −14.3 | −10.9 | −8.4 | −6.7 | −5.5 | −4.8 | −3.9 |
| 0.2002 | −86.8 | −68.4 | −53.9 | −42.1 | −31.8 | −24.8 | −19.1 | −14.6 | −11.3 | −9.1 | −7.5 | −6.5 | −5.4 |
| 0.3024 | −77.7 | −61.4 | −48.6 | −38.3 | −29.1 | −23.0 | −17.9 | −13.9 | −10.9 | −8.7 | −7.3 | −6.3 | −5.3 |
| 0.4002 | −56.0 | −44.5 | −35.5 | −28.2 | −21.8 | −17.5 | −13.8 | −10.9 | −8.6 | −6.9 | −5.7 | −5.0 | −4.2 |
| 0.4507 | −43.5 | −34.7 | −27.8 | −22.2 | −17.3 | −14.1 | −11.2 | −9.0 | −7.1 | −5.7 | −4.7 | −4.1 | −3.5 |
| 0.5000 | −31.8 | −25.5 | −20.6 | −16.6 | −13.1 | −10.8 | −8.7 | −7.0 | −5.6 | −4.5 | −3.7 | −3.2 | −2.7 |
| 0.6000 | −12.7 | −10.4 | −8.7 | −7.1 | −5.9 | −5.0 | −4.2 | −3.5 | −2.8 | −2.2 | −1.8 | −1.5 | −1.3 |
| 0.6994 | −2.3 | −2.1 | −1.9 | −1.6 | −1.5 | −1.3 | −1.1 | −1.0 | −0.8 | −0.5 | −0.4 | −0.3 | −0.2 |
| 0.8476 | −0.8 | −0.7 | −0.6 | −0.2 | 0.0 | 0.2 | 0.3 | 0.4 | 0.4 | 0.4 | 0.5 | 0.5 | 0.5 |
| 1 | 0.0 | 0.0 | 0.0 | 0.0 | 0.0 | 0.0 | 0.0 | 0.0 | 0.0 | 0.0 | 0.0 | 0.0 | 0.0 |
| x1 | n | ΔΦn | |
|---|---|---|---|
| 0.0000 | 1.4141 | 1.4141 | 0 |
| 0.1010 | 1.4227 | 1.4219 | 0.00076 |
| 0.2002 | 1.4304 | 1.4288 | 0.00156 |
| 0.3024 | 1.4374 | 1.4352 | 0.00216 |
| 0.4002 | 1.4434 | 1.4408 | 0.00262 |
| 0.4507 | 1.4463 | 1.4435 | 0.00285 |
| 0.5000 | 1.4489 | 1.4459 | 0.00296 |
| 0.6000 | 1.4538 | 1.4507 | 0.00313 |
| 0.6994 | 1.4579 | 1.4550 | 0.00292 |
| 0.8476 | 1.4626 | 1.4608 | 0.00181 |
| 1.0000 | 1.4661 | 1.4661 | 0 |
| T/K | A0 | A1 | A2 | A3 | A4 | σ |
|---|---|---|---|---|---|---|
| VE (cm3 mol−1) | ||||||
| 293.15 | −13.533 | 0.0247 | 9.3514 | −0.1098 | −6.6156 | 0.002215 |
| 298.15 | −14.025 | −0.2587 | 9.2842 | −0.1244 | −6.7963 | 0.002998 |
| 303.15 | −14.524 | −0.5452 | 9.2161 | −0.1395 | −6.9797 | 0.004207 |
| 308.15 | −15.029 | −0.8352 | 9.1471 | −0.1551 | −7.1658 | 0.005590 |
| 313.15 | −15.540 | −1.1284 | 9.0771 | −0.1713 | −7.3548 | 0.007056 |
| 318.15 | −16.057 | −1.4251 | 9.0062 | −0.1881 | −7.5466 | 0.008574 |
| 323.15 | −16.581 | −1.7253 | 8.9342 | −0.2055 | −7.7414 | 0.010130 |
| 328.15 | −17.112 | −2.0289 | 8.8613 | −0.2235 | −7.939 | 0.011717 |
| 333.15 | −17.65 | −2.3361 | 8.7874 | −0.2421 | −8.1397 | 0.013333 |
| 338.15 | −18.194 | −2.6469 | 8.7125 | −0.2613 | −8.3435 | 0.014974 |
| 343.15 | −18.745 | −2.9613 | 8.6365 | −0.2821 | −8.5503 | 0.016642 |
| 348.15 | −19.304 | −3.2794 | 8.5594 | −0.3018 | −8.7604 | 0.018330 |
| 353.15 | −19.87 | −3.6012 | 8.4814 | −0.323 | −8.9736 | 0.020044 |
| Δη (mPa s) | ||||||
| 293.15 | −127.31 | −451.48 | −400.09 | −1.8112 | 1.59 | 0.003938 |
| 298.15 | −101.91 | −355.24 | −311.57 | −0.4463 | −0.0828 | 0.002017 |
| 303.15 | −82.323 | −279.56 | −241.04 | −0.2917 | 0.0104 | 0.000998 |
| 308.15 | −66.223 | −219.95 | −181.46 | 0.6478 | 0.1556 | 0.002372 |
| 313.15 | −52.416 | −165.75 | −129.71 | 0.0567 | 0.0901 | 0.000574 |
| 318.15 | −43.129 | −130.22 | −93.895 | 0.2766 | −0.183 | 0.000659 |
| 323.15 | −34.858 | −100.68 | −66.419 | 0.5493 | −0.9634 | 0.000931 |
| 328.15 | −28.135 | −77.373 | −46.652 | 0.078 | −0.2221 | 0.000266 |
| 333.15 | −22.427 | −60.466 | −33.824 | 0.1233 | −0.2623 | 0.000283 |
| 338.15 | −17.873 | −49.029 | −26.275 | 0.1843 | 0.0986 | 0.000755 |
| 343.15 | −14.917 | −41.115 | −20.748 | 0.213 | 0.0925 | 0.000846 |
| 348.15 | −12.901 | −35.813 | −16.995 | 0.0273 | −0.1882 | 0.000292 |
| 353.15 | −10.905 | −30.339 | −12.82 | 0.0725 | −0.0632 | 0.000192 |
| ΔΦn | ||||||
| 293.15 | 0.0119 | −0.0051 | 0.003 | 0.0034 | −0.0073 | 0.000028 |
| Δγ (mN m−1) | ||||||
| 299.85 | 7.0343 | 1.642 | 4.4189 | −0.4598 | −3.686 | 0.029312 |
| 311.45 | 6.0978 | 1.2106 | 1.8964 | −0.6364 | 0.1312 | 0.010338 |
| 321.45 | 5.1483 | 0.5758 | 0.8036 | −0.1841 | 1.8383 | 0.015525 |
| 334.25 | 4.0704 | 0.6489 | 1.0679 | −0.8076 | 0.8691 | 0.017579 |
| 343.05 | 3.356 | 0.1029 | 0.0254 | −0.3028 | 2.1447 | 0.016906 |
© 2011 by the authors; licensee MDPI, Basel, Switzerland. This article is an open-access article distributed under the terms and conditions of the Creative Commons Attribution license (http://creativecommons.org/licenses/by/3.0/).
Share and Cite
Wu, T.-Y.; Chen, B.-K.; Hao, L.; Peng, Y.-C.; Sun, I.-W. Effect of Temperature on the Physico-Chemical Properties of a Room Temperature Ionic Liquid (1-Methyl-3-pentylimidazolium Hexafluorophosphate) with Polyethylene Glycol Oligomer. Int. J. Mol. Sci. 2011, 12, 2598-2617. https://doi.org/10.3390/ijms12042598
Wu T-Y, Chen B-K, Hao L, Peng Y-C, Sun I-W. Effect of Temperature on the Physico-Chemical Properties of a Room Temperature Ionic Liquid (1-Methyl-3-pentylimidazolium Hexafluorophosphate) with Polyethylene Glycol Oligomer. International Journal of Molecular Sciences. 2011; 12(4):2598-2617. https://doi.org/10.3390/ijms12042598
Chicago/Turabian StyleWu, Tzi-Yi, Bor-Kuan Chen, Lin Hao, Yu-Chun Peng, and I-Wen Sun. 2011. "Effect of Temperature on the Physico-Chemical Properties of a Room Temperature Ionic Liquid (1-Methyl-3-pentylimidazolium Hexafluorophosphate) with Polyethylene Glycol Oligomer" International Journal of Molecular Sciences 12, no. 4: 2598-2617. https://doi.org/10.3390/ijms12042598