Article

Multilocus Phylogenetics Show High Intraspecific Variability within Fusarium avenaceum

Department of Diagnostics and Plant Pathophysiology, University of Warmia and Mazury, Plac Łódzki 5, 10-957, Olsztyn, Poland
*
Author to whom correspondence should be addressed.
Int. J. Mol. Sci. 2011, 12(9), 5626-5640; https://doi.org/10.3390/ijms12095626
Submission received: 27 July 2011 / Revised: 16 August 2011 / Accepted: 20 August 2011 / Published: 31 August 2011
(This article belongs to the Section Biochemistry)

Abstract

:
Fusarium avenaceum is a common soil saprophyte and plant pathogen of a variety of hosts worldwide. This pathogen is often involved in the crown rot and head blight of cereals that affects grain yield and quality. F. avenaceum contaminates grain with enniatins more than any species, and they are often detected at the highest prevalence among fusarial toxins in certain geographic areas. We studied intraspecific variability of F. avenaceum based on partial sequences of elongation factor-1 alpha, enniatin synthase, intergenic spacer of rDNA, arylamine N-acetyltransferase and RNA polymerase II data sets. The phylogenetic analyses incorporated a collection of 63 F. avenaceum isolates of various origin among which 41 were associated with wheat. Analyses of the multilocus sequence (MLS) data indicated a high level of genetic variation within the isolates studied with no significant linkage disequilibrium. Correspondingly, maximum parsimony analyses of both MLS and individual data sets showed lack of clear phylogenetic structure within F. avenaceum in relation to host (wheat) and geographic origin. Lack of host specialization indicates no host selective pressure in driving F. avenaceum evolution, while no geographic lineage structure indicates widespread distribution of genotypes that resulted in nullifying the effects of geographic isolation on the evolution of this species. Moreover, significant incongruence between all individual tree topologies and little clonality is consistent with frequent recombination within F. avenaceum.

1. Introduction

Fusarium avenaceum is a widely-distributed soil saprophyte and plant pathogen of a variety of hosts [1]. This species is more common in temperate areas although its increased prevalence has also been reported in warmer regions throughout the world [24]. F. avenaceum is often involved in crown rot and head blight of barley and wheat [5]. This species is the main contaminant of grain with enniatins [6,7]. These cyclic hexadepsipeptides have antimicrobial, insecticidal and phytotoxic activities and their high cytotoxicity on mammalian cells has been reported in in vitro experiments [810].
Yli-Mattila et al. [11] revealed the closest genetic relationship of F. avenaceum to isolates identified as F. arthrosporioides, F. anguioides and morphologically distinct F. tricinctum. Based on an analysis of combined TUB (β-tubulin), ITS (internal transcribed spacer) and IGS rDNA (intergenic spacer of rDNA) sequences, F. avenaceum., F. arthrosporioides and F. anguioides isolates were resolved as five separate groups indicating conflict between phylogenetic analysis and the morphological species concept [11]. Furthermore, studies of Satyaprasad et al. [12] underlined limited clonality within F. avenaceum by showing a large number of vegetative compatibility groups (VCGs) and random amplified polymorphic DNA (RAPD) groups of European isolates. Similarly, recent phylogenetic studies by Nalim et al. [13] based on EF1α (elongation factor-1 alpha), TUB and IGS rDNA data sets showed that F. avenaceum isolates pathogenic to lisianthus in the US were not monophyletic or clonal. This situation is characteristic for fungi that reproduce sexually. However, no sexual stage of F. avenaceum has been identified, although MAT-1 and MAT-2 mating types have been identified [14] and are transcribed [15]. The studies of Satyaprasad et al. [12] and Nalim et al. [13] did not find clear geographic or host type basis of groupings within F. avenaceum. Moreover, pathogenicity tests showed that F. avenaceum isolates can cause disease lesions on more than one plant species [12,13]. To date, little is known about the genetic variability of F. avenaceum associated with head blight of wheat despite its high prevalence and diverse geographic range. The aim of this study was to: (i) determine the phylogenetic relationships among 63 F. avenaceum isolates with respect to host (wheat) and geographic origin; (ii) determine whether distinct evolutionary lineages are present within F. avenaceum; (iii) determine recombination events within F. avenaceum. MLS (multilocus sequence analysis) used in this study incorporated data sets of EF1α, IGS rDNA and RPB2 (RNA polymerase II) that are widely used in fungal phylogenetics [13,1620]. We also incorporated a partial sequence of ESYN1 (enniatin synthase) involved in enniatin synthesis by F. avenaceum and a partial sequence of NAT2 (arylamine N-acetyltransferase) [16] which belongs to the NAT gene family, encoding xenobiotic metabolizing enzymes in various prokaryotes and eukaryotes.

2. Results

2.1. Sequence Characterization

Five datasets, EF1α, ESYN1, IGS rDNA, NAT2 and RPB2 were analyzed (Table 1) in this study in order to assess intraspecific variability within a group of 63 F. avenaceum isolates.
Among the datasets analyzed, the percentage of variable sites varied. The IGS rDNA region had the highest number of variable sites (20.9%) followed by ESYN1 (14.1%), EF1α (4.3%), NAT2 (1.8%) and RPB2 (0.2%). Similarly, the percentage of parsimony informative sites also varied between data sets analyzed. The IGS rDNA region had the highest number of parsimony informative sites (16.7%) followed by ESYN1 (12.7%), EF1α (2.9%) and NAT2 (1.4%). No parsimony informative sites within RPB2 were detected. MLS had 5.4% variable sites and 4.1% parsimony informative sites. Among the F. avenaceum collection tested, 11 EF1α, 13 ESYN1, 29 IGS, 6 NAT2 and 2 RPB2 haplotypes were identified. MLS revealed 51 haplotypes within the group of 63 F. avenaceum isolates studied. Haplotype diversity (0.991) and nucleotide diversity (0.01395) for the MLS data set indicated a high level of genetic variation within the group of isolates. Overall, there was no significant (Zns = 0.0951, P > 0.05) linkage disequilibrium for the 95 parsimony informative polymorphic sites within the F. avenaceum collection.

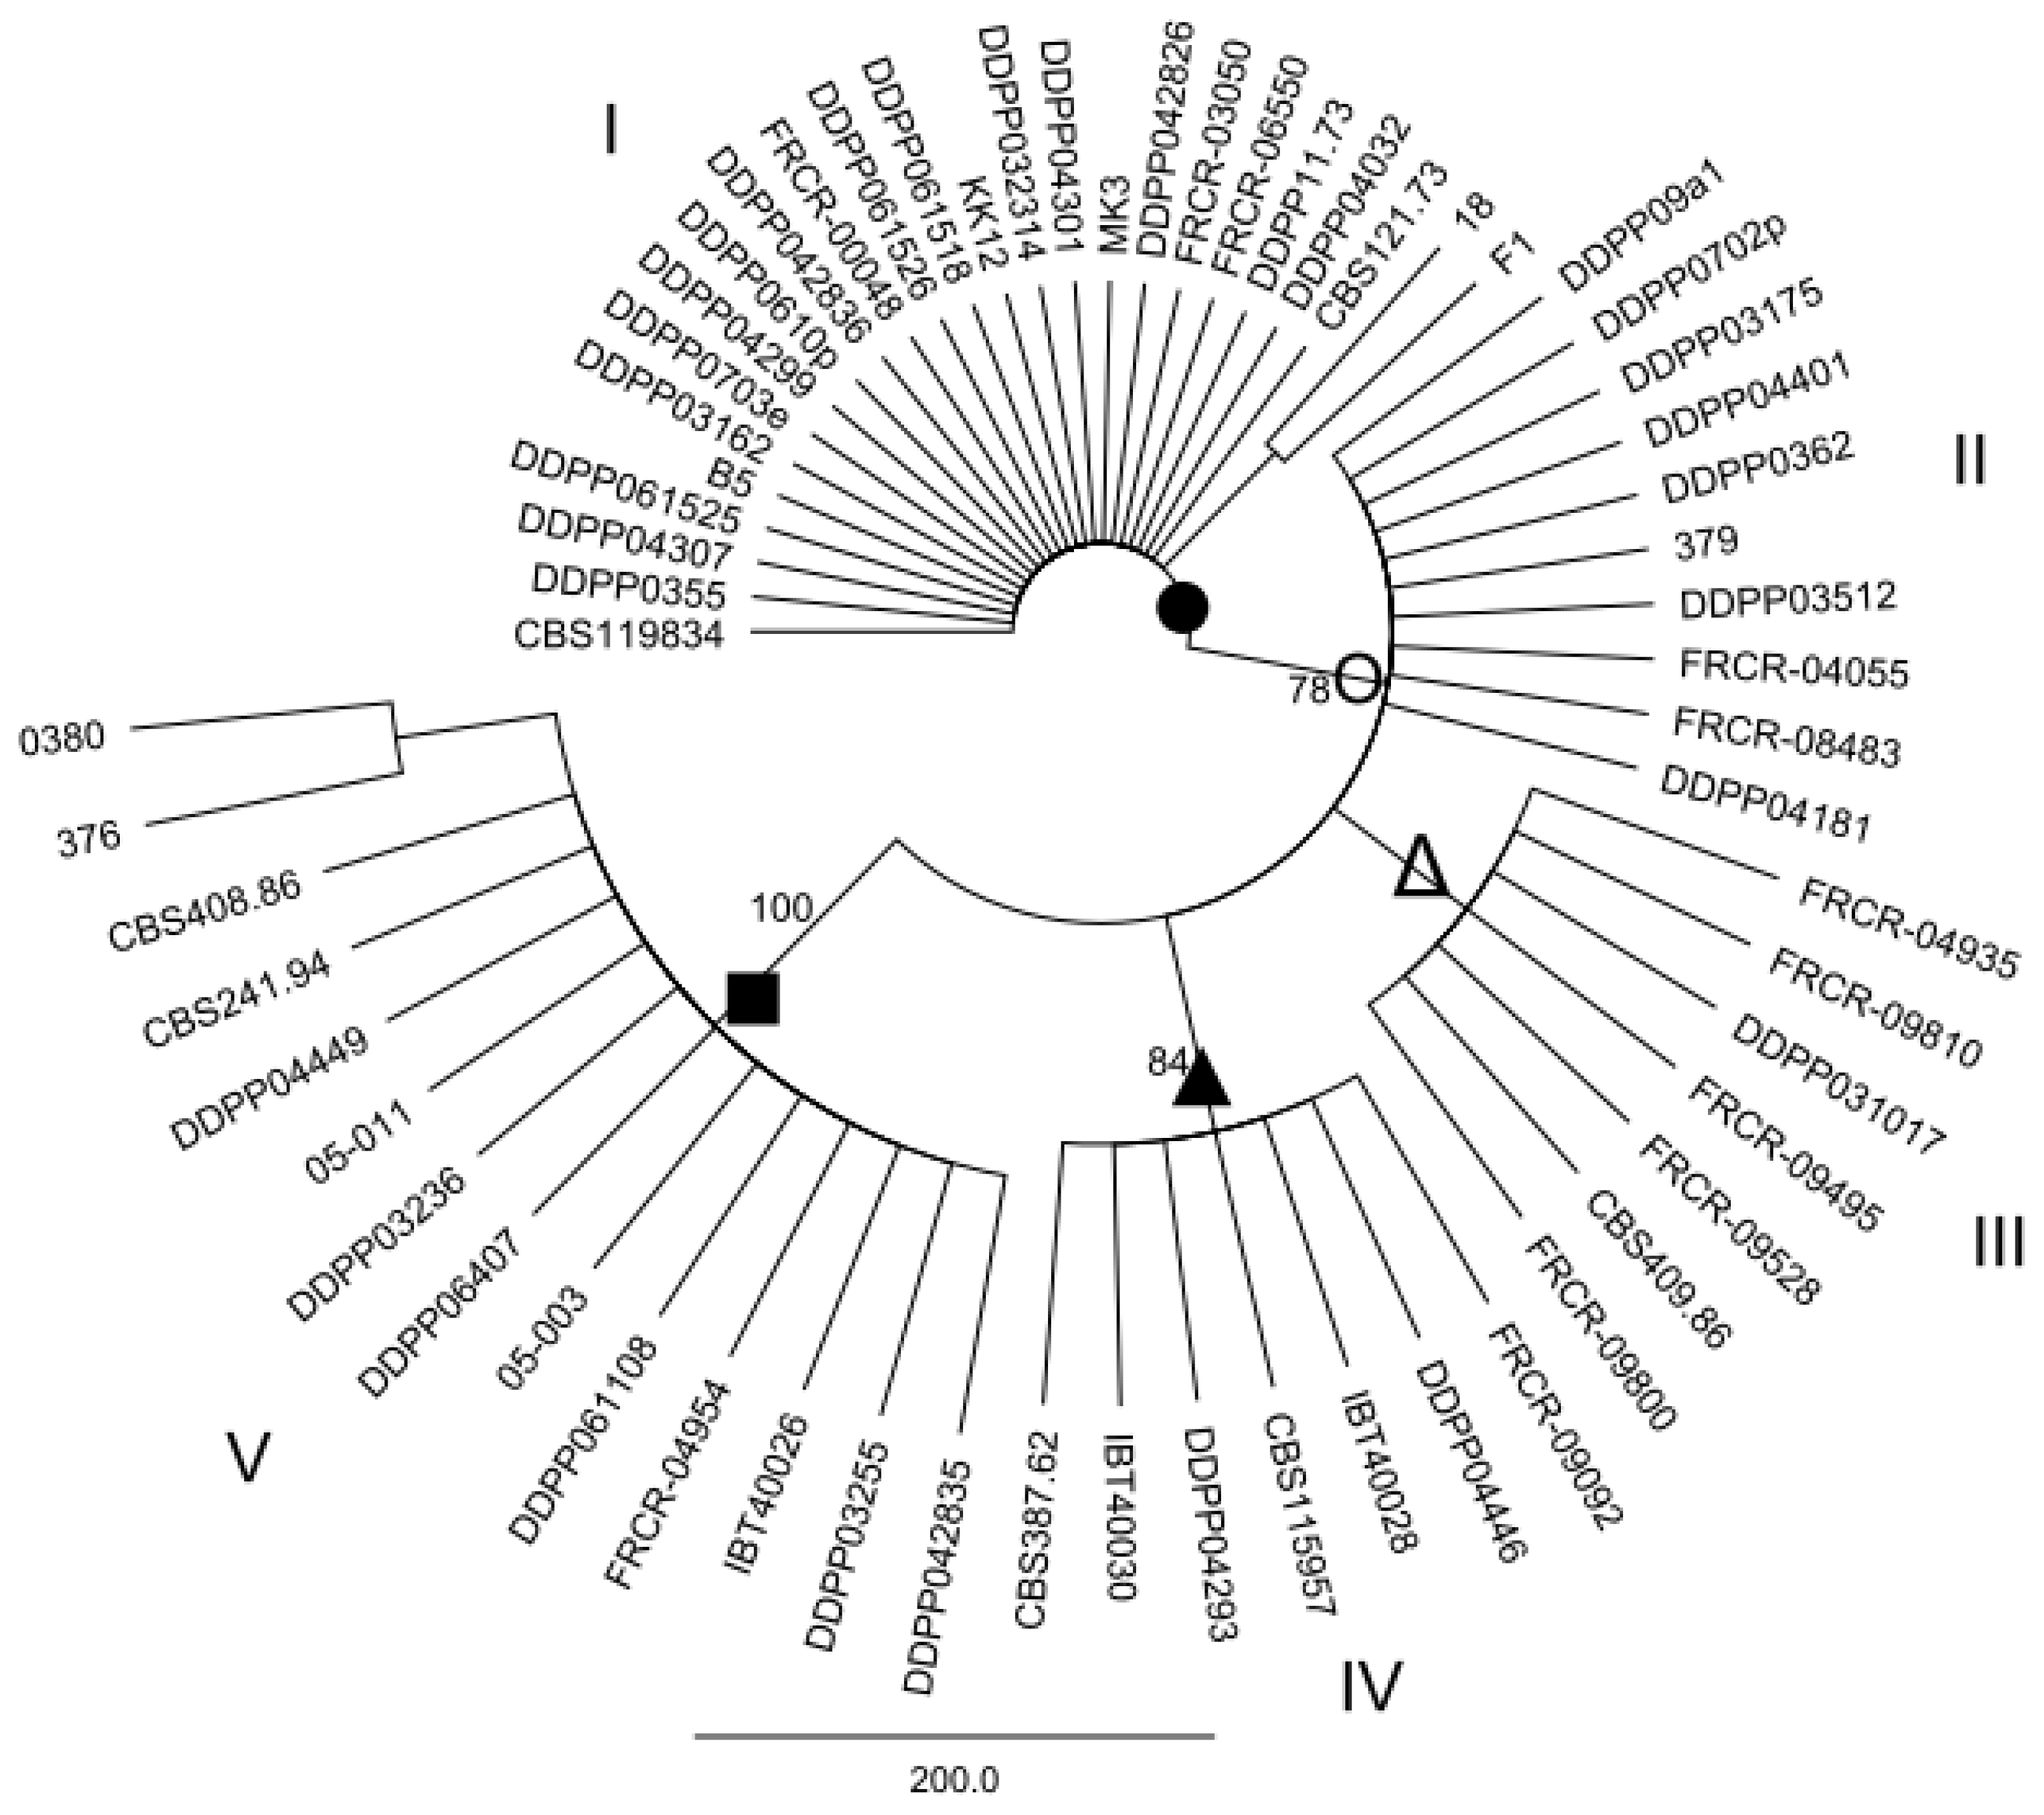
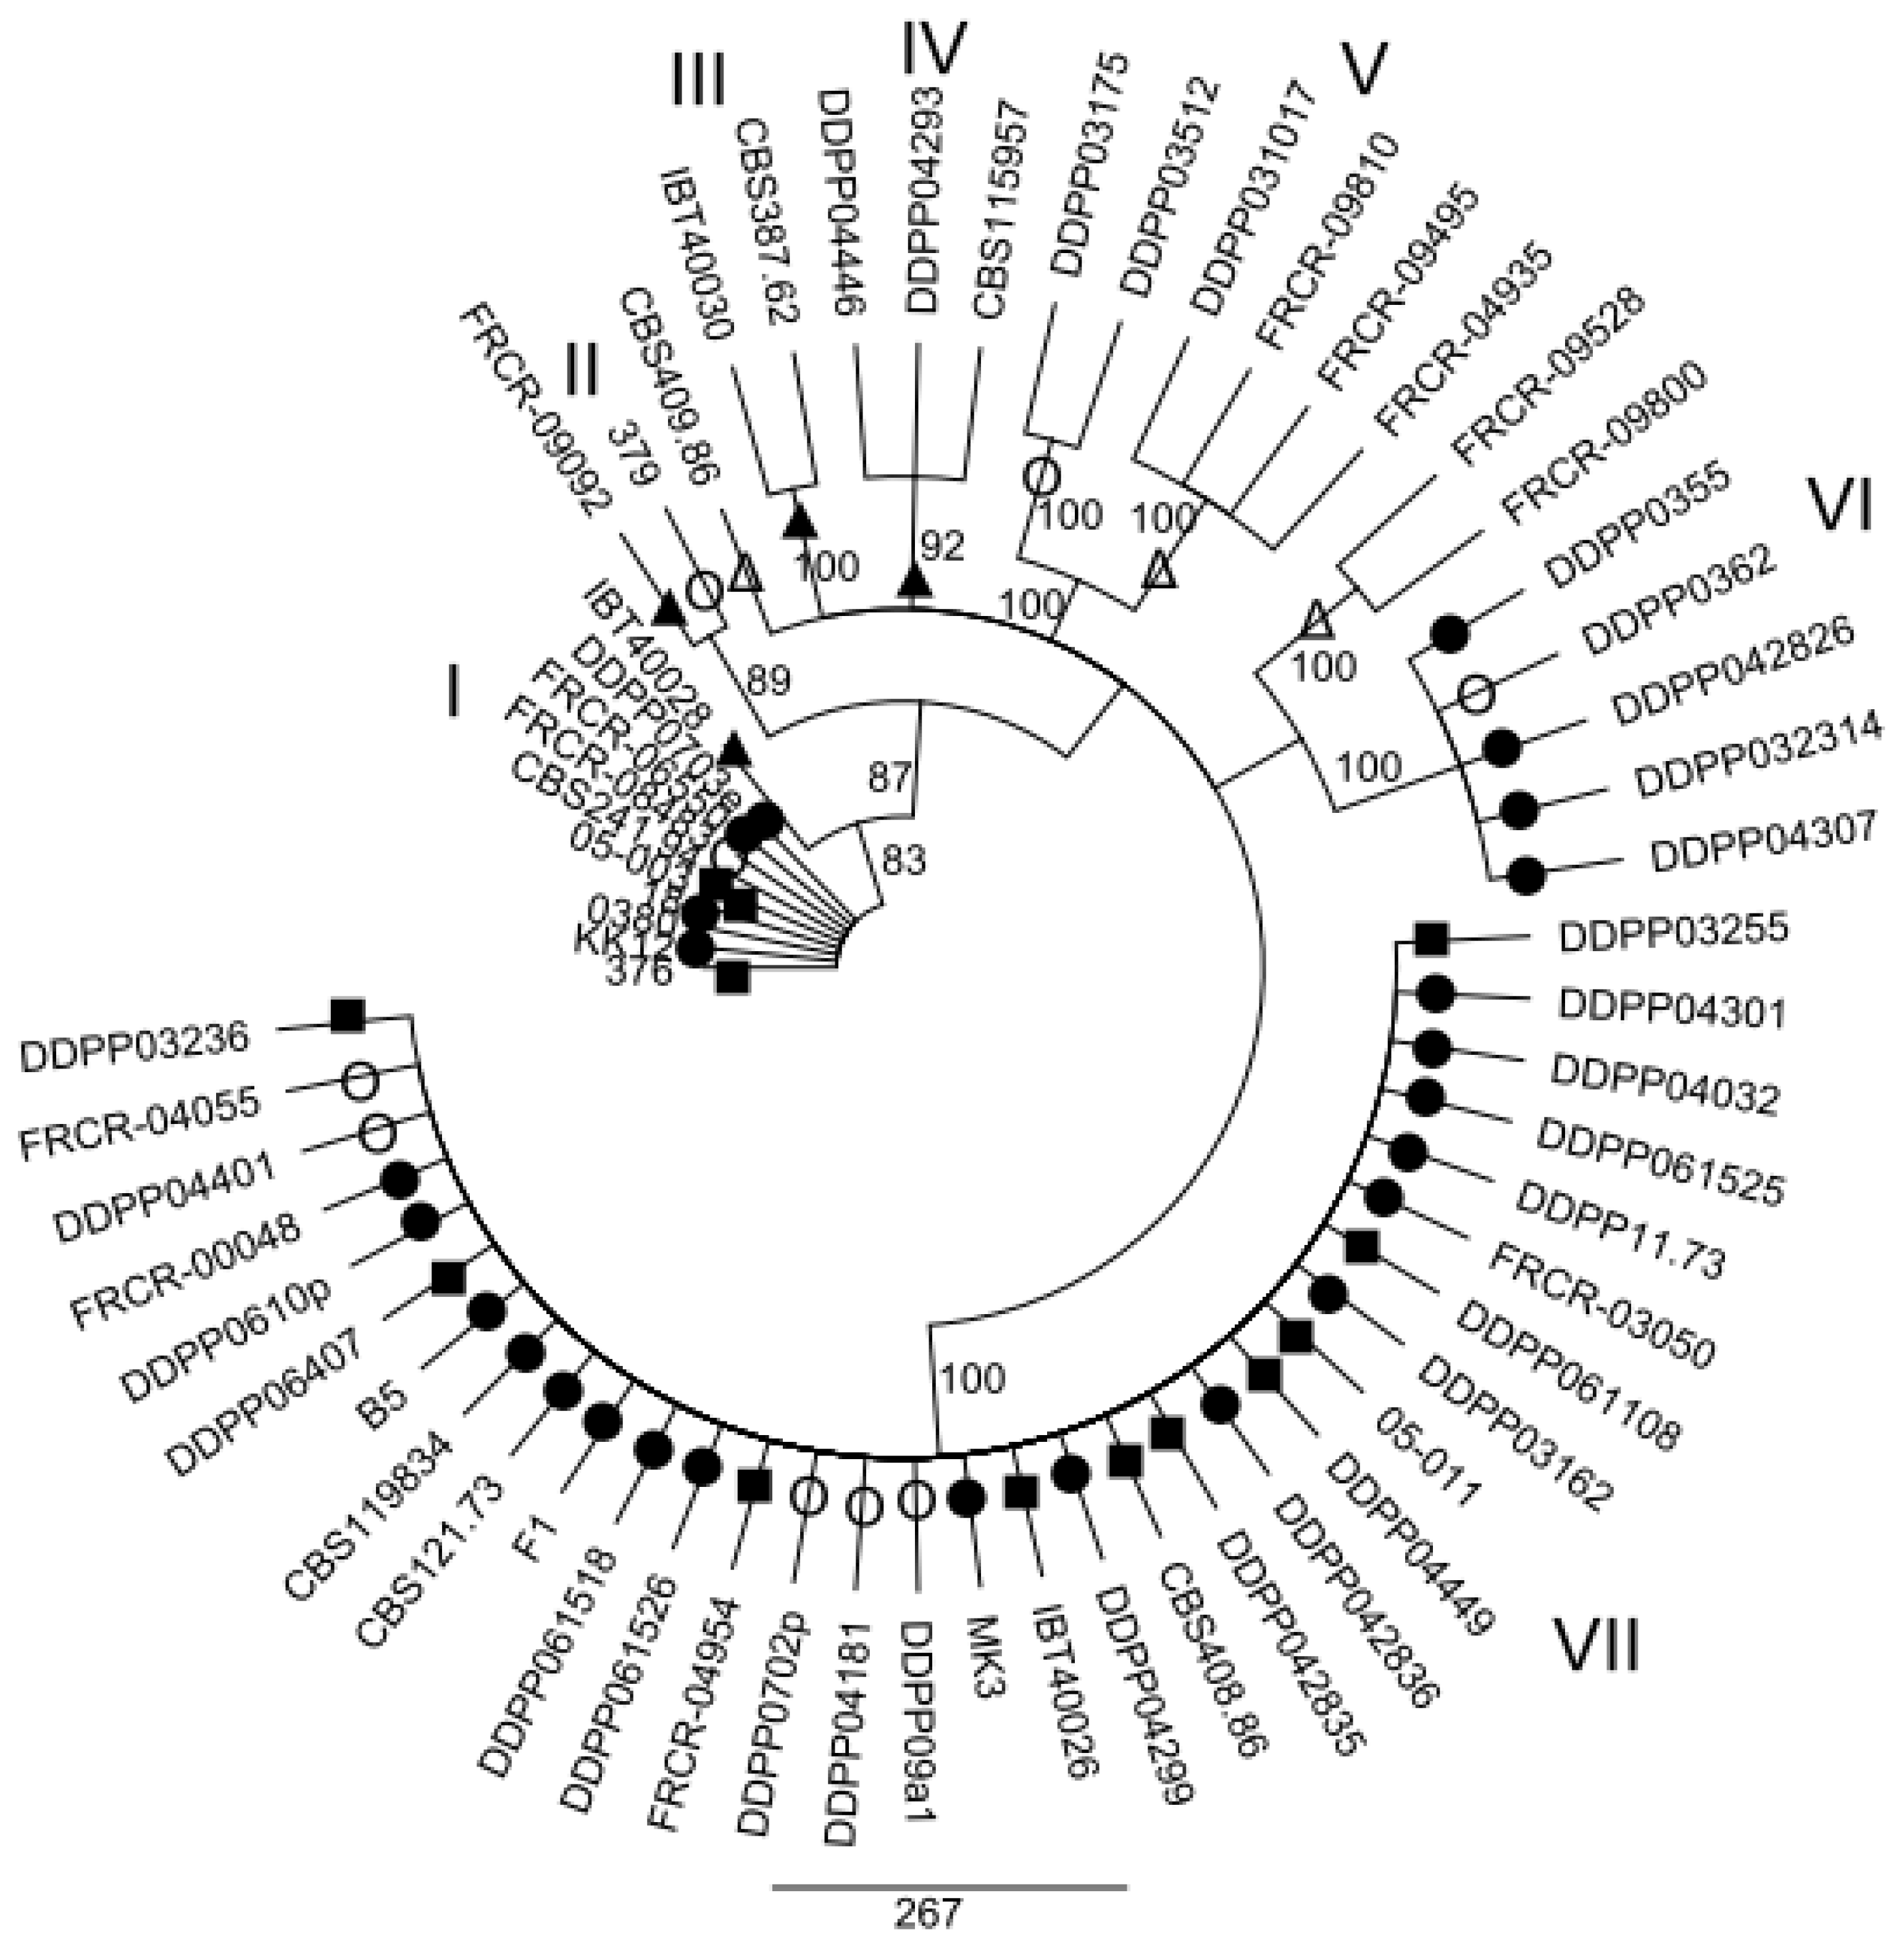
2.2. Maximum parsimony (MP) Analysis of Individual and Combined Gene Sequences

MP analysis of the EF1α, ESYN1, IGS rDNA, NAT2 data sets and MLS were performed in order to determine whether intraspecific groups exist within F. avenaceum (Figures 15). MP analysis of RPB2 was not conducted since only 2 haplotypes were identified within this gene. Analysis of the individual EF1α, ESYN1, IGS rDNA, NAT2 data sets data set revealed 5, 7, 11 and 4 main groups, respectively (Figures 14), however bootstrap values of some groups were not strongly supported. The groups identified within the individual data sets were not correlated with wheat as the host; however, little correlation according to origin of the isolates was observed. For example, EF1α groups IV and V included only isolates from Europe and one isolate (CBS 387.62) from Turkey. IGS rDNA groups I, III, V, VI and XI only included isolates from Europe, while three isolates from group IV originated from the US. The bootstrap consensus tree inferred from MLS analysis of the combined data set resolved 14 major groups within the collection of F. avenaceum isolates tested (Figure 5). Two isolates, CBS 387.62 and IBT 40030 formed outgroup of the tree. A moderate correlation between the groups and the origin of the isolates can be observed in the MLS tree. 30 isolates formed eight groups related to their origin. Groups II, VI, VII, IX, X and XIV included only European isolates, while groups V and VIII included isolates only originating from the US.

2.3. Partition Homogeneity Test

The partition homogeneity test showed significant incongruence in the phylogenetic signal between the five data sets (P = 0.002). Furthermore, after the ESYN1 gene was excluded from the analysis the combined EF1α, RPB2, IGS rDNA and NAT2 was significantly incongruent (P = 0.001).

3. Discussion

In this study, high intraspecific variability within F. avenaceum was observed with no significant linkage disequilibrium. MLS and analyses of the individual EF1α, ESYN1, IGS rDNA and NAT2 data sets identified intraspecific groups within the collection of F. avenaceum isolates studied. Among the 63 isolates analyzed, 41 were associated with wheat, however, no clear link between phylogenetic groups and wheat was observed. Lack of host specialization indicates host selective pressure is not driving F. avenaceum evolution. Previous work by Satyaprasad et al. [12] did not reveal a clear separation of groups within F. avenaceum in relation to hosts such as lupin and wheat, based on restriction fragment length polymorphism (RFLP) and RAPD analysis. Correspondingly, subsequent studies by Nalim et al. [13] indicated that F. avenaceum isolates from lisianthus are not phylogenetically distinct from those isolated from other hosts. Recent phylogenetic studies of other Fusarium species such as F. culmorum [17], F. poae [18,19] and F. pseudograminearum [20] showed that intraspecific groups within these morphospecies are not clearly associated with a particular geographic area. Similarly, no such association was found in F. avenaceum [13]. Widespread distribution of local fungal genotypes is most probably the consequence of long-distance transport of plant materials that resulted in nullifying the effects of geographic isolation on the evolution of this species. In this study, moderate correlation between phylogenetic groups and the origin of the F. avenaceum isolates was detected based on the MLS tree, however, this may be a reflection of the isolate collection used in this work. Although isolates analyzed in this study originated from different geographic areas, the majority were of European origin. Consistent with previous reports [12,13], limited clonality within F. avenaceum was observed in this study. From the collection of F. avenaceum isolates analyzed, only 12 (19%) isolates could be classified in five separate clonal groups (Table 2).
In order to assess the genotype distribution within single wheat heads, 2–3 isolates were recovered for analysis from 6 single wheat samples (Table 2). Interestingly, among this group of 14 isolates only two isolates (DDPP 061525 and DDPP 061526) appeared to be clonal. This result showed that the distribution and co-occurrence of different F. avenaceum genotypes is not restricted to a single field sample. Little clonality of F. avenaceum could suggest sexual reproduction, although a teleomorph has not been reported from laboratory or field studies. However, MAT-1 and MAT-2 mating types have been detected [14] and they are transcribed in the genome of F. avenaceum [15]. Recombination events generate incongruence between individual tree topologies, whereas under a model of clonality, the topologies of all trees should be congruent [21]. To address the question of reproductive mode in F. avenaceum, the partition homogeneity test was performed to assess whether the gene genealogies for the five different loci were significantly different from each other. Significant incongruence (P = 0.002) in phylogenetic signal between all combined data sets is consistent with recombination within F. avenaceum. Furthermore, the high level of genetic variation detected and the lack of significant linkage disequilibrium in the MLS data suggest recombination rather than a predominantly clonally-propagated species. Incongruence in phylogenetic signal between genes can also suggest different evolutionary histories or evolutionary origins of genes. Several processes, including incomplete lineage sorting, variable evolutionary rates or hybridization could generate differences in tree topologies [20]. Some clusters involved in secondary metabolism appear to have moved into fungal genomes by horizontal gene transfer from either prokaryotes or other fungi [22]. Evidence that trichothecene metabolite profiles are not well correlated with evolutionary relationships within the F. graminearum clade has been previously reported [23]. Discord between ESYN1 or TRI5 data sets and EF1α, RPB2 and IGS rDNA has also been documented within F. poae [18]. However, these results showed that after the ESYN1 gene was excluded from the analysis the combined EF1α, RPB2, IGS rDNA and NAT2 was still significantly incongruent (P = 0.001). In conclusion, results of the present study provide new insights into population biology, reproductive mode and the degree of clonality within F. avenaceum. The lack of significant linkage disequilibrium within F. avenaceum indicates that the risk of introducing genotypes representing new lineages is probably low. However, it should be noted that sexual recombination can lead to the generation of more aggressive or toxigenic strains. Thus, further phylogenetic studies are needed to monitor population changes within F. avenaceum to promote more informed disease control and plant breeding strategies.

4. Materials and Methods

4.1. Collection of F. avenaceum Isolates

All isolates analyzed in this study are listed in Table 2. CBS isolates are held in the CBS (CBS Fungal Biodiversity Centre, Utrecht, The Netherlands) fungal collection. IBT isolates were kindly provided by Dr Ulf Thrane and are held in the IBT culture collection (Center for Microbial Biotechnology (CMB), Department of Systems Biology, Technical University of Denmark). 0380, 379, 376, 05-011 and 05-003 isolates were kindly provided by Dr S. Vogelgsang (Federal Department of Economic Affairs FDEA Agroscope Reckenholz-Taenikon ART Research for Agriculture and Nature Reckenholzstrasse 191 8046 Zurich, Switzerland). 18, MK3, B5, F1 and KK12 isolates were kindly provided by Á. Szécsi (Hungarian Academy of Sciences Plant Protection Institute P.O. Box 102 H-1525 Budapest, Hungary). All FRC (Fusarium Research Center Culture Collection) isolates were kindly provided by D.M. Geiser (Department of Plant Pathology, 121 Buckhout Laboratory, The Pennsylvania State University, University Park, PA 16802, US).
26 Polish and 1 English field isolate were obtained from wheat seed samples collected during 2003–2009 and are stored in 15% glycerol at −80 °C in the fungal collection of the DDPP (Department of Diagnostics & Plant Pathophysiology, University of Warmia and Mazury in Olsztyn, Poland). The isolates were cultured on PDA (potato dextrose agar) [24] at 25 °C prior to DNA extraction. Species identity of all F. avenaceum isolates were confirmed by BLAST searches [25] using the EF1α gene sequence data to query GenBank.

4.2. DNA Extraction, PCR and DNA Sequencing

DNA extraction, PCR analyses and DNA sequencing were carried out as previously described [26]. Except for the ESYN1 gene [26], all other primers used were designed in this study. Primer pairs: avef11 CGACTCTGGCAAGTCGACCA, avef12 TACCAATGACGGTGACATAG; esy1 TTCAAGGGCTGGACGTCTATG, esyave2 GTTGGTGGCCTTCATGTTCTT; igs1 GGTGGATTTGGCTGGTTTGGG, igs2 CTCCGAGACCGTTTTAGTGGG; nat211 GGAAAGCAACCTCTTTTTCTGTTA, nat22 CTCCTTCAACGCCTCCACTCTCTC; rpbave1 ACAGGCTTGTGGTCTGGTCAA, rpbave2 GGATTGACCTTTGTCTTCAATC were used for amplification of partial EF1α, ESYN1, IGS rDNA, NAT2 and RPB2 datasets, respectively. All sequences were deposited in NCBI database under accession numbers: EF1α (HQ704072-HQ704121), ESYN1 (HQ704122-HQ704181), IGS rDNA (HQ704182-HQ704234), NAT2 (HQ914964-HQ915026), RPB2 (HQ704235-HQ704297). The sequence identity of each gene was confirmed by BLAST searches [25].

4.3. Phylogenetic Analyses

Sequence data were edited and then aligned using Clustal W [27] implemented in Geneious Pro 4.0.4 with the default settings [28]. Data for each gene were analyzed separately and as a combined multilocus sequence data set (MLS). Variable sites, parsimony informative sites, number of haplotypes, haplotype and nucleotide diversity were calculated using DnaSP v. 5.0 [29]. DnaSP was also used to detect linkage disequilibrium (Zns statistic) [30] within a group of isolates tested. GC % was determined using Geneious Pro 4.0.4. Maximum parsimony (MP) was conducted using PAUP* v4.0b10 [31] implemented in Geneious Pro 4.0.4 using the heuristic search option. In addition, Modeltest version 3.06 [32] with Akaike Information Criterion (AIC) [33] model selection was used to determine the nucleotide substitution model best suited to the data set. Stability of clades was assessed by 1000 MP bootstrap replications.

4.4. Partition Homogeneity Test

Congruence between individual gene data sets was tested using the partition homogeneity test [34] implemented in PAUP* v4.0b10 [31]. 500 replicates were analyzed in a heuristic search. The maximum number of trees was set to 1000. Invariant characters were deleted prior to analysis and 0.01 was used as the significance threshold [35].

5. Conclusions

Analysis of multilocus sequence (MLS) data indicated a high level of genetic variation within a group of isolates studied with no significant linkage disequilibrium. Correspondingly, maximum parsimony analyses of both MLS and individual data sets did not detect any phylogenetic structure within F. avenaceum in relation to host (wheat) and geographic origin. Lack of host specialization indicates host selective pressure is not driving F. avenaceum evolution, while no geographic lineage structure indicates widespread distribution of genotypes that resulted in nullifying the effects of geographic isolation on the evolution of this species. Significant incongruence between all individual tree topologies and little clonality is consistent with frequent recombination within F. avenaceum.

Acknowledgements

This study was fully supported by the Polish Ministry of Education and Science, grant N N310 182237.

References

  1. Leslie, JF; Summerell, BA. The Fusarium Laboratory Manual; Blackwell Publishing: Ames, IA, USA, 2006. [Google Scholar]
  2. Spanic, V; Lemmens, M; Drezner, G. Morphological and molecular identification of Fusarium species associated with head blight on wheat in East Croatia. Eur J Plant Pathol 2010, 128, 511–516. [Google Scholar]
  3. Tan, DC; Flematti, GR; Ghisalberti, EL; Sivasithamparam, K; Barbetti, MJ. Toxigenicity of enniatins from Western Australian Fusarium species to brine shrimp (Artemia franciscana). Toxicon 2011, 57, 817–825. [Google Scholar]
  4. Tunali, B; Nicol, JM; Hodson, D; Uçkun, Z; Büyük, O; Erdurmuþ, D; Hekimhan, H; Aktaþ, H; Akbudak, MA; Bađcý, SA. Root and crown rot fungi associated with spring, facultative, and winter wheat in Turkey. Plant Dis 2008, 92, 1299–1306. [Google Scholar]
  5. Vogelgsang, S; Sulyok, M; Hecker, A; Jenny, E; Krska, R; Schuhmacher, R; Forrer, HR. Toxigenicity and pathogenicity of Fusarium poae and Fusarium avenaceum on wheat. Eur J Plant Pathol 2008, 122, 265–276. [Google Scholar]
  6. Jestoi, M; Rokka, M; Yli-Mattila, T; Parikka, P; Pizz, A; Peltonen, K. Presence and concentrations of the Fusarium-related mycotoxins beauvericin, enniatins and moniliformin in Finnish grain samples. Food Addit Contam 2004, 21, 794–802. [Google Scholar]
  7. Logrieco, A; Rizzo, A; Ferracane, R; Ritieni, A. Occurrence of beauvericin and enniatins in wheat affected by Fusarium avenaceum head blight. Appl Environ Microbiol 2002, 68, 82–85. [Google Scholar]
  8. Ivanova, L; Skjerv, E; Eriksen, GS; Uhlig, S. Cytotoxicity of enniatins A, A1, B, B1, B2 and B3 from Fusarium avenaceum. Toxicon 2006, 47, 868–876. [Google Scholar]
  9. Kamyar, M; Rawnduzi, P; Studenik, P; Kouri, CR; Lemmens-Gruber, R. Investigation of the electrophysiological properties of enniatins. Arch Biochem Biophys 2004, 429, 215–223. [Google Scholar]
  10. Macchia, L; Dipaola, R; Fornelli, F; Nenna, S; Moretti, A; Napolitano, R; Logrieco, A; Caiaffa, MF; Tursi, A; Bottalico, A. Cytotoxity of Beauvericin to Mammalian Cells. Proceedings of Book of Abstracts for International Seminar on Fusarium: Mycotoxins, Taxonomy And Pathogenicity Martina Franca, Bari, Italy, 9–13 May 1995.
  11. Yli-Mattila, T; Paavanen-Huhtala, S; Bulat, SA; Alekhina, IA; Nirenberg, HI. Molecular, morphological and phylogenetic analysis of the Fusarium avenaceum/F. arthrosporioides/F. tricinctum species complex—a polyphasic approach. Mycol Res 2002, 106, 655–669. [Google Scholar]
  12. Satyaprasad, K; Bateman, GL; Ward, E. Comparisons of isolates of Fusarium avenaceum from white lupin and other crops by pathogenicity tests, DNA analyses, and vegetative compatibility tests. J Phytopathol 2000, 148, 211–219. [Google Scholar]
  13. Nalim, FA; Elmer, WH; McGovern, RJ; Geiser, DM. Multilocus phylogenetic diversity of Fusarium avenaceum pathogenic on Lisianthus. Phytopathology 2009, 99, 462–468. [Google Scholar]
  14. Kerényi, Z; Hornok, L. Structure and function of mating type genes in Fusarium species. Acta Microbiol Immunol Hung 2002, 49, 313–314. [Google Scholar]
  15. Kerényi, Z; Moretti, A; Waalwijk, C; Oláh, B; Hornok, L. Mating type sequences in asexually reproducing Fusarium species. Appl Environ Microbiol 2004, 70, 4419–4423. [Google Scholar]
  16. Glenn, AE; Bacon, CW. FDB2 encodes a member of the arylamine N-acetyltransferase family and is necessary for biotransformation of benzoxazolinones by Fusarium verticillioides. J Appl Microbiol 2009, 107, 657–671. [Google Scholar]
  17. Obanor, F; Erginbas-Orakci, G; Tunali, B; Nicol, JM; Chakraborty, S. Fusarium culmorum is a single phylogenetic species based on multilocus sequence analysis. Fungal Biol 2010, 114, 753–765. [Google Scholar]
  18. Kulik, T; Pszczółkowska, A. Multilocus sequence analysis of Fusarium poae. J Plant Pathol 2011, 93, 119–126. [Google Scholar]
  19. Stenglein, SA; Rodriguero, MS; Chandler, E; Jennings, P; Salerno, GL; Nicholson, P. Phylogenetic relationships of Fusarium poae based on EF-1a and mtSSU sequences. Fungal Biol 2009, 114, 96–106. [Google Scholar]
  20. Scott, JB; Chakraborty, S. Multilocus sequence analysis of Fusarium pseudograminearum reveals a single phylogenetic species. Mycol Res 2006, 110, 1413–1425. [Google Scholar]
  21. Geiser, DM; Pitt, JI; Taylor, JW. Cryptic speciation and recombination in the aflatoxin producing fungus Aspergillus flavus. Proc Natl Acad Sci USA 1998, 95, 388–393. [Google Scholar]
  22. Khaldi, N; Collemare, J; Lebrun, M-H; Wolf, KH. Evidence for horizontal transfer of a secondary metabolite gene cluster between fungi. Genome Biol 2008, 9, R18. [Google Scholar]
  23. Ward, TJ; Bielawski, JP; Kistler, HC; Sullivan, E; O’Donnell, K. Ancestral polymorphism and adaptive evolution in the trichothecene mycotoxin gene cluster of phytopathogenic Fusarium. Proc Natl Acad Sci USA 2002, 99, 9278–9283. [Google Scholar]
  24. Booth, C. The Genus. In Fusarium; CABI Publishing: Oxford, UK, 1971. [Google Scholar]
  25. Altschul, SF; Gish, W; Miller, W; Myers, EW; Lipman, DJ. Basic local alignment search tool. J Mol Biol 1990, 215, 403–410. [Google Scholar]
  26. Kulik, T; Pszczółkowska, A; Fordoński, G; Olszewski, J. PCR approach based on the esyn1 gene for the detection of potential enniatin-producing Fusarium species. Int J Food Microbiol 2007, 116, 319–324. [Google Scholar]
  27. Thompson, JD; Higgins, DG; Gibson, TJ. CLUSTAL W: Improving the sensitivity of progressive multiple sequence alignment through sequence weighting, position specific gap penalties and weight matrix choice. Nucleic Acids Res 1994, 22, 4673–4680. [Google Scholar]
  28. Drummond, AJ; Ashton, B; Cheung, M; Heled, J; Kearse, M; Moir, R; Stones-Havas, S; Thierer, T; Wilson, A. Geneious. 4.7. Available online: http://www.geneious.com/ (accessed on 4 February 2011).
  29. Librado, P; Rozas, J. DnaSP v5: A software for comprehensive analysis of DNA polymorphism data. Bioinformatics 2009, 25, 1451–1452. [Google Scholar]
  30. Kelly, JK. A test of neutrality based on interlocus associations. Genetics 1997, 146, 1197–1206. [Google Scholar]
  31. Swofford, DL. PAUP*. Phylogenetic Analysis Using Parsimony (*and Other Methods), Version 4th ed; Sinauer Associates: Sunderland, MA, USA, 2001. [Google Scholar]
  32. Posada, D; Crandall, KA. MODELTEST: Testing the model of DNA substitution. Bioinformatics 1998, 14, 817–818. [Google Scholar]
  33. Akaike, H. Information Theory and an Extension of the Maximum Likelihood Principle. In Second International Symposium on Information Theory; Petrov, PN, Csaki, F, Eds.; Akad Kiado: Budapest, Hungary, 1973; pp. 267–281. [Google Scholar]
  34. Farris, JS; Kallersjo, M; Kluge, AG; Bult, C. Testing significance of incongruence. Cladistics 1995, 10, 315–319. [Google Scholar]
  35. Cunningham, CW. Can three incongruence tests predict when data should be combined? Mol Biol Evol 1997, 14, 733–740. [Google Scholar]
Figure 1. Bootstrap consensus tree inferred from the MP analysis of EF1α sequence data. Values at branches indicate branch support, with bootstrapping percentages based on maximum parsimony analysis. Bootstrap values ≥70% are indicated. EF1α groups were marked with individual symbols (•○Δ▴■) in order to visualize discord (see Figures 2, 3 and 4) between EF1α as an example and ESYN1, IGS rDNA and NAT2.
Ijms 12 05626f1
Figure 2. Bootstrap consensus tree inferred from the MP analysis of ESYN1 sequence data. Values at branches indicate branch support, with bootstrapping percentages based on maximum parsimony analysis. Bootstrap values ≥70% are indicated. Symbols •○Δ▴■ represent five EF1α groups shown in Figure 1 in order to visualize discord between EF1α and ESYN1 as an example.
Ijms 12 05626f2
Figure 3. Bootstrap consensus tree inferred from the MP analysis of IGS rDNA sequence data. Values at branches indicate branch support, with bootstrapping percentages based on maximum parsimony analysis. Bootstrap values ≥70% are indicated. Symbols •○Δ▴■ represent five EF1α groups shown in Figure 1 in order to visualize discord between EF1α and IGS rDNA as an example.
Ijms 12 05626f3
Figure 4. Bootstrap consensus tree inferred from the MP analysis of NAT2 sequence data. Values at branches indicate branch support, with bootstrapping percentages based on maximum parsimony analysis. Bootstrap values ≥70% are indicated. Symbols •○Δ▴■ represent five EF1α groups shown in Figure 1 in order to visualize discord between EF1α and NAT2 as an example.
Ijms 12 05626f4
Figure 5. Bootstrap consensus tree inferred from the MP of combined data set (EF1α, ESYN1, IGS rDNA, NAT2 and RPB2). Only values of the main internal branches are shown and indicate branch support, with bootstrapping percentages based on maximum parsimony analysis. Bootstrap values ≥70% are indicated.
Ijms 12 05626f5
Table 1. Sequence characteristics and phylogenetic information of individual EF1α, ESYN1, IGS rDNA, NAT2, RPB2 and MLS datasets for F. avenaceum collection analyzed.
DatasetSequence Range% GCNo. Variable Sites (%)No. Parsimony Informative Sites (%)Nucleotide DiversityNo. of HaplotypesHaplotype Diversity
EF1α510–51453.122 (4.3%)15 (2.9%)0.00931110.814
ESYN1508–5105672 (14.1%)65 (12.7%)0.03303130.710
IGS rDNA482–51649.1108 (20.9%)86 (16.7%)0.04662290.929
NAT251350.99 (1.8%)7 (1.4%)0.0035460.598
RPB251851.31 (0.2%)00.0000620.032
MLS combined2023–257251.8138 (5.4%)106 (4.1%)0.01395510.991
Table 2. List of F. avenaceum isolates used for phylogenetic analyses.
Isolate Number 1Geographical Origin, Host/Habitat of OriginF. avenaceum Haplotypes 2
EF1αESYN1IGS rDNANAT2RPB2MLS
KK12Hungary, wheat kerne1124111
MK31135112
FRC R-03050Australia, soil11313513
FRC R-00048Pennsylvania, turf11319114
DDPP 061526 a*Poland, wheat kernel11327115
DDPP 0615251 a*11327115
DDPP 03162 *11327115
DDPP 0703eEngland, wheat kernel1115516
CBS 121.73 *United Kingdom, Dianthus caryophyllus11326117
DDPP 11.73 *unknown11326117
DDPP 04301 bPoland, wheat kernel1136618
DDPP 04307 b1126618
DDPP 0610pPoland, currant11328619
DDPP 061518 aPoland, wheat kernel113272110
DDPP 04299 d113181111
DDPP 042836 c113276112
DDPP 042826 c112151113
DDPP 04032113141114
DDPP 0355 *112116115
DDPP 032314 e*112116115
CBS 119834unknown113151116
B5Hungary, wheat kernel113231117
1831181118
F131321119
FRC R-06550California, carnation21251120
FRC R-08483Sweden, Salix viminalis51226121
FRC R-04055South Africa, carnation513166122
DDPP 0702pPoland, currant513131123
DDPP 04401Poland, wheat kernel513151124
379Switzerland, wheat kernel63151124
DDPP 04181Poland, wheat kernel513275125
CBS 115957Italy, Fagus sylvatica88243126
CBS 387.62Turkey, Camellia sinensis86233127
DDPP 04293 dPoland, wheat kernel87204128
DDPP 04446 f8893129
IBT 40028Denmark, wheat kernel82211130
IBT 40030Denmark rye kernel85103131
FRC R-09092Sweden, barley93175132
DDPP 0362Poland, wheat kernel512271133
CBS 409.86USA, barley kernel7471134
FRC R-09495California, lisianthus71071134
FRC R-09800Connecticut, lisianthus71171134
DDPP 031017Poland, wheat kernel710271135
FRC R-09528North Dakota, barley71141136
FRC R-09810Florida, lisianthus71011137
FRC R-04935Brazil, wheat71031138
DDPP 03512Poland, wheat kernel59196139
DDPP 0317559271240
DDPP 09a1413151141
0380Switzerland, wheat kernel11181142
37611185143
05-003101271144
DDPP 03236 e*Poland, wheat kernel1013271144
DDPP 042835 c*1013271144
DDPP 06407 *1013271144
05-011Switzerland, wheat kernel1013275145
CBS 241.94The Netherlands, Dianthus caryophyllus101121146
CBS 408.86Denmark, barley kernel1013185147
DDPP 03255Poland, wheat kernel1013196148
IBT 40026 *Denmark, wheat kernel1013191149
DDPP 04449 f*Poland, wheat kernel1013191149
DDPP 061108101325150
FRC R-04954Germany, barley1013273151
1Information concerning the availability of isolates analyzed in this study is given in the materials and methods section.
2(EF1α) elongation factor-1 alpha, (ESYN1) enniatin synthase, (IGS rDNA) intergenic spacer of rDNA, (NAT2) arylamine N-acetyltransferase, (RPB2) RNA polymerase II, (MLS) multilocus sequence analysis. DDPP isolates recovered from the same wheat sample are designated by identical letters
a, b, c, d, e, f, respectively. Isolates belonging to the five separate clonal groups are designated by an asterisk.

