Article

KCNQ1 Haplotypes Associate with Type 2 Diabetes in Malaysian Chinese Subjects

1
Department of Molecular Medicine, Faculty of Medicine, University of Malaya, Kuala Lumpur 50603, Malaysia
2
Faculty of Medicine, Sana’a University, Sana’a, P.O. Box 13078, Yemen
3
Department of Medicine, Faculty of Medicine, University of Malaya Medical Center, University of Malaya, Kuala Lumpur 50603, Malaysia
4
Department of Parasitology, Faculty of Medicine, University of Malaya, Kuala Lumpur 50603, Malaysia
5
Faculty of Agriculture and Biotechnology, Universiti Sultan Zainal Abidin, Kuala Terengganu 21030, Malaysia
*
Authors to whom correspondence should be addressed.
Int. J. Mol. Sci. 2011, 12(9), 5705-5718; https://doi.org/10.3390/ijms12095705
Submission received: 13 July 2011 / Revised: 24 August 2011 / Accepted: 26 August 2011 / Published: 5 September 2011

Abstract

:
The aim of this study was to investigate the association of single nucleotide polymorphisms (SNPs) and haplotypes of potassium voltage-gated channel, KQT-like subfamily, member 1 (KCNQ1) with type 2 diabetes (T2D) in Malaysian Chinese subjects. The KCNQ1 SNPs rs2237892, rs2283228 and rs2237895 were genotyped in 300 T2D patients and 230 control subjects without diabetes and metabolic syndrome. Two logistic regression models of analysis were applied, the first adjusted for age and gender while the second adjusted for age, gender and body mass index. The additive genetic analysis showed that adjusting for body mass index (BMI) even strengthened association of rs2237892, rs2283228 and rs2237895 with T2D (OR = 2.0, P = 5.1 × 10⁻⁵; OR = 1.9, P = 5.2 × 10⁻⁵; OR = 1.9, P = 7.8 × 10⁻⁵, respectively). The haplotype TCA containing the allele of rs2237892 (T), rs2283228 (C) and rs2237895 (A) was highly protective against T2D (Second model; OR = 0.17, P = 3.7 × 10⁻¹¹). The KCNQ1 rs2237892 (TT), and the protective haplotype (TCA) were associated with higher beta-cell function (HOMA-B) in normal subjects (P = 0.0002; 0.014, respectively). This study found that KCNQ1 SNPs was associated with T2D susceptibility in Malaysian Chinese subjects. In addition, certain KCNQ1 haplotypes were strongly associated with T2D.

Graphical Abstract

1. Introduction

The KCNQ1 gene has a total of 17 exons, spans 404 kb of chromosome sequence and is located on chromosome 11p15.5 [1]. KCNQ1 codes for the pore-forming alpha subunit of the voltage-gated K+ channel (KvLQT1) that is highly expressed in the heart. This channel plays an important role in controlling repolarization of the ventricles [2]. KCNQ1 is ubiquitously expressed in epithelial cells, including the endocrine and exocrine pancreatic cells [3]. KCNQ1 was reported to be expressed in insulin-secreting cells, and inhibition of this potassium channel has been shown to significantly increase insulin secretion [4].
Genome wide association study (GWAS) has been applied to complex diseases, including T2D and has resulted in the identification of a growing number of trait susceptibility loci for T2D [5]. Two independent GWAS have identified KCNQ1 as a novel T2D susceptibility gene in East Asian subjects [6,7]. More recently, two GWAS on Chinese Han and European populations confirmed KCNQ1 as T2D susceptibility gene [8,9]. The association of T2D with KCNQ1 variants was replicated in studies among Chinese [1012], Singaporean [13,14], Indians [15], Pakistani [16] and in some Euro-Caucasians [6,17,18]. However, there is little data about the association of haplotypes of KCNQ1 with T2D. The focus of this study was on the association of common variants of KCNQ1 single nucleotide polymorphisms (SNPs) (rs2237892, rs2283228 and rs2237895), haplotypes and diplotypes with T2D in Malaysian Chinese subjects.

2. Results

Three hundred and forty-eight T2D and 354 control subjects who gave informed consent forms were recruited for this study. An application of the new metabolic syndrome criteria [19] on the control group resulted in 123 subjects with metabolic syndrome; therefore, they were excluded from the study. As a result of calculating % beta-cell insulin secretion using HOMA calculator, 3 diabetic and 1 normal subjects were excluded due to fasting insulin <20 pmol/L while 45 diabetic subjects were excluded due to fasting insulin >300 pmol/L. Consequently, 300 diabetic and 230 normal subjects without diabetes and metabolic syndrome were included in this study. The demography and biochemical parameters of the subjects are shown in Table 1.

2.1. Association of KCNQ1 SNPs with T2D

The SNPs included in this study did not deviate from the Hardy-Weinberg Equilibrium in the control group. The risk allele frequencies of rs2237892 (C), rs2283228 (A) and rs2237895 (C) in normal subjects were 0.69, 0.64 and 0.27 versus 0.78, 0.73 and 0.34 in diabetic patients, respectively. The first logistic regression model (adjusted for age and gender) showed that rs2237892, rs2283228, rs2237895 were associated with T2D (additive, OR = 1.6; 1.5; 1.5, P = 0.0005; 0.002; 0.004, respectively) (Table 2). Adjusting for body mass index (BMI) even strengthened the association of rs2237892, rs2283228, rs2237895 with T2D (additive, OR = 2.1; 1.9; 1.9, P = 5.1 × 10⁻⁵, 5.2 × 10⁻⁵, 7.8 × 10⁻⁵, respectively).

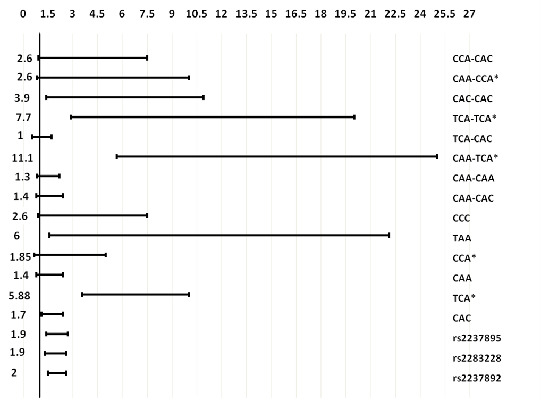
2.2. Association of KCNQ1 Haplotypes and Diplotypes with T2D

Three-SNP haplotypes and diplotypes block were identified with significant linkage disequilibrium (LD). This block was constructed from rs2237892, rs2283228 and rs2237895 (Figure 1). The possible haplotype for each individual was adjusted to more than 0.5 resulting in 8 haplotypes and 23 diplotypes. The rare haplotypes (those below 2% frequency in cases or controls) were excluded from the analysis. Thus, 6 haplotypes and 8 diplotypes were further analyzed for their association with T2D.
The overall association of haplotypes with T2D was significant (P = 7.49 × 10⁻⁶). The haplotype TCA containing the protective alleles of rs2237892, rs2283228 and rs2237895 is more frequent in the normal (0.33) compared to diabetic subjects (0.15). Both logistic regression models showed that this haplotype was strongly protective against T2D (first model, OR = 0.33, P = 8.4 × 10⁻⁷; second model, OR = 0.17, P = 3.7 × 10⁻¹¹) (Table 3). The haplotype CAC containing the risk allele of the SNPs included in this study was the most frequent haplotype (0.44 in normal subjects vs. 0.51 in diabetic subjects). Second logistic regression models showed that this haplotype was a risk for T2D (OR = 1.7, P = 0.008) whereas the first model showed this haplotype as borderline risk for T2D (OR = 1.4, P = 0.057).
The less frequent haplotype TAA (0.01 in normal vs. 0.06 in diabetic subjects was strongly associated with T2D (first model, OR = 4.6, P = 0.017; second model, OR = 6.0, P = 0.007). The results showed that haplotype CCC was significantly associated with T2D in the first logistic regression model (OR = 3.2, P = 0.021) whereas this significance was less evident in the second model (OR = 2.6, P = 0.083). Both logistic regression models showed that the haplotype CAA and CCA were no association with T2D.
The overall association of diplotypes with T2D was significant (P = 8.1 × 10⁻⁷). The diplotypes TCA-TCA and CAA-TCA containing the protective haplotype (TCA) showed a protection against T2D (first model, OR = 0.16, P = 8 × 10⁻⁵; OR = 0.4, P = 0.0003, respectively) (second model, OR = 0.13, P = 4.4 × 10⁻⁵; OR = 0.09, P = 2.9 × 10⁻¹⁰, respectively) (Table 4). In addition, the second logistic regression model showed that the diplotype CAC-CAC containing the risk haplotype (CAC) was strongly a risk for T2D (OR = 3.9, P = 0.008) and diplotype CCA-CAC was a borderline risk for T2D (OR = 2.6, P = 0.07) whereas the first model did not show such effect. Both logistic regression models showed that the other diplotypes (CAA-CAC, CAA-CAA, TCA-CAC and CAA-CCA) were not significantly associated with T2D.

2.3. Impact of KCNQ1 SNPs, Haplotypes and Diplotypes on Beta-Cell Function in Normal Subjects

Two general linear models (GLM), the first adjusted for age and gender and the second adjusted for age, gender and BMI were approached to identify potential mediators who link the KCN Q1 variants, with T2D. The three SNPs were tested for their associations with diabetes-related quantitative traits, beta cell function (HOMA-B). Both GLM models showed that HOMA-B in normal subjects those had the variant of KCNQ1 rs2237892 (TT) was higher than CC and CT genotype (P = 0.002, 0.0002, respectively) (Table 5). The second GLM showed little effect of rs2283228 CC genotype on HOMA-B (P = 0.034) compared to other genotypes of this SNP. The results showed that rs2237895 had no effect on beta-cell function.
Three haplotypes (CAA, CAC and TCA) and 5 diplotypes (CAA-CAA, CAA-CAC, CAA-TCA, TCA-CAC and TCA-TCA) fitted the criteria of parametric analysis (count ≥ 25) to evaluate their impact on the beta-cell function. Both GLM showed that HOMA-B was higher in normal subjects, which had the protective haplotype TCA than those normal subjects carrying the risk haplotyype CAC or CAA (P = 0.003; 0.014, respectively). Furthermore, the two protective diplotype (TCA-TCA, and CAA-TCA) showed a higher HOMA-B than the other diplotypes (first GLM, P = 1.5 × 10⁻⁶; second GLM, P = 5.7 × 10⁻⁶).

3. Discussion

The association of KCNQ1 SNPs, haplotypes and diplotypes with T2D among Malaysian Chinese was studied. Common variants of KCNQ1 SNPs rs2237892, rs2283228 and rs2237895 were selected for this study based on the Unoki and Yasuda findings [6,7] that these SNPs showed an association with T2D in Asian populations. The present study found that the common KCNQ1 SNPs rs2237892, rs2237895 and rs2283228 were strongly associated with T2D, which is in agreement with previous reports [615,18,20,21]. Adjusting for BMI even strengthened the association of KCNQ1 variants with T2D. The odds ratios of the second logistic regression model were 1.9–3.7 (additive genetic analysis) which are higher than the previous reported odds ratios (1.2–1.6) [615,18,20,21].
The haplotypes and diplotypes showed a higher association with T2D than single individual SNPs did. Plotting the second logistic regression odds ratios and 95% CI of the association of SNPs (additive genetic models), haplotypes and diplotypes with T2D resulted in, the reciprocal 95% CI of the more associated haplotype (TAA) and diplotypes (CAA-TCA and TCA-TCA) were higher than 95% CI of individual SNPs, and were not overlapping each other (Figure 2). Other haplotype blocks have been reported to be associated with T2D [11,12,15].
The current study confirmed the association of the KCNQ1 variants with impaired b-cell function estimated by HOMA-B, and the risk alleles of rs2237892 and rs2283228 were significantly associated with lower HOMA-B values. This finding is in agreement with a previous report [12]. The increased risk for T2D linked to KCNQ1 gene is likely to be caused by a reduction in insulin secretion [1013]. The pore-forming alpha subunit of the voltage-gated K+ channel (KvLQT1) (encoded by KCNQ1) and the regulatory beta subunit ISK (encoded by potassium channel, voltage-gated, ISK-related subfamily, member 1; KCNE1 gene) co-assemble to form the I(KS) potassium channel in the pancreas [22]. Intrinsically, there is a possibility that KCNQ1 polymorphisms alter the role of the I(KS) potassium channel, causing decreased insulin secretion, leading in time to T2D [13]. However, homozygous Kcnq1−/− mice have been reported not to show hyperglycaemia or glucose intolerance, and the contribution of the kcnq1-encoded protein to the molecular pathogenesis of T2D remains unclear [6]. A recent study, found that both blood glucose and insulin levels were lower in kcnq1−/− than in kcnq1+/+mice and the uptake of glucose into skeletal muscle, liver, kidney and lung tissue was significantly higher in kcnq1−/− than inkcnq1+/+mice [23] leading to a suggestion that kcnq1 is a novel molecule affecting insulin sensitivity.

4. Materials and Methods

4.1. Subjects and Data Collection

T2D Malaysian Chinese subjects aged between 30 and 70 years who attended the University Malaya Medical Centre (UMMC), Kuala Lumpur for treatment were randomly approached and asked to participate voluntarily in this study (target group). For the control group, the physically normal Malaysian Chinese subjects who attended the UMMC for routine medical check-ups were approached. The study was approved by the Medical Ethics Committee of the University of Malaya Medical Centre. Venous Blood (10 mL) was collected from each subject after obtaining written consent.

4.2. Biochemical Analyses

Glucose, triacylglycerol, total cholesterol and HDLc were measured by an automated analyzer (Dimension® RxL Max® Integrated Chemistry System), and insulin was measured by ADVIA Centaur assay XP Immunoassay System (Siemens Healthcare Diagnostics Inc. Deerfield, IL USA). % beta-cell insulin secretion (HOMA-B) was calculated using the Homeostasis Model Assessment (HOMA2) Calculator v2.2, which is available online from Oxford Center for Diabetes, Endocrinology and Metabolism.

4.3. Genetic Analyses

Single nucleotide polymorphisms of KCNQ1; rs2237892, rs2283228 and rs2237895 were selected for genotypic analysis in Malaysian T2D subjects based on the findings of Unoki and Yasuda [6,7] that these SNPs are associated with T2D in Asian populations. The SNPs sequences were obtained from the database of the US National Library of Medicine [24]. Specific primers were designed for each SNP by FastPCR program. DNA extraction was achieved through the salt precipitation method. All SNPs were amplified using a 96 microwell plate StepOnePlus thermocycler (Applied Biosystems Inc, Foster City, USA). The SNPs rs2237892, rs2283228 and rs2237895 were genotyped by restriction enzymes BsoBI, BstNI and SmaI, respectively. Polyacrylamide gel electrophoresis (7%) was used for detection the digested product of the PCR amplicons. The Polyacrylamide gel was stained by 0.1 μg/mL ethidium bromide for 5 minutes and then visualized by exposure to ultraviolet light in the gel imaging system (Infinity 3026, Vilber Lourmat, Marnela Valled, France). To confirm the restriction enzyme results, approximately 10% of each SNPs PCR amplicons (54 samples) was sequenced by automated DNA sequencer (3130xl Genetic Analyzer, Applied Biosystems, Foster City, CA, USA) using terminator cycle sequencing kit v3.1 (Applied Biosystems). The sequencing results were identical to the restriction enzymes’ results of rs2237892 and rs2237895 (kappa = 1) where the kappa was 0.932 for rs2283228.

4.4. Statistical Analysis

HelixTree 7.0 SNP and Variation Suite for Genetic Statistics (SVS) was used to study the linkage disequilibrium (LD) between SNP and construct haplotypes and diplotypes of related SNPs. The deviation from the Hardy-Weinberg Equilibrium was tested by De Finetti program [25]. The other statistical analyses were performed on SPSS version 11.5. Two logistic regression models were applied for the evaluation of associations of the KCNQ1 SNPs, recessive, dominant and additive genetic analysis and the association of haplotypes and diplotypes with T2D. The first model was adjusted for age and gender while the second model, adjusted for age, gender and body mass index.
The overall association of haplotypes and diplotypes with T2D was evaluated by crosstabs (chi-square test). The impact of the KCNQ1 SNPs variants, haplotypes and diplotypes on beta-cell insulin secretion (HOMA-B), was evaluated by two general linear models (GLM). The first adjusted for age and gender while the second adjusted for age, gender and BMI. HOMA-B values were skewed and, therefore, normalized by logarithmic transformation. Means were subsequently back transformed for presentation as geometric means.

5. Conclusions

This study showed that KCNQ1 common variants were associated with T2D in Malaysian Chinese subjects. In addition, analysis of KCNQ1 haplotypes and diplotypes supported the association of KCNQ1 gene polymorphisms with T2D. Furthermore, KCNQ1 SNPs, haplotypes and diplotypes were associated with beta-cell function in normal subjects without diabetes and metabolic syndrome.

Acknowledgments

The authors wish to thank University of Malaya for supporting this research.
  • Conflict of InterestThe authors declare no conflict of interest.

References

  1. Neyroud, N; Richard, P; Vignier, N; Donger, C; Denjoy, I; Demay, L; Shkolnikova, M; Pesce, R; Chevalier, P; Hainque, B; et al. Genomic organization of the KCNQ1 K+ channel gene and identification of C-terminal mutations in the long-QT syndrome. Circ Res 1999, 84, 290–297. [Google Scholar]
  2. Barhanin, J; Lesage, F; Guillemare, E; Fink, M; Lazdunski, M; Romey, G. KVLQT1 and lsK (minK) proteins associate to form the IKScardiac potassium current. Nature 1996, 384, 78–80. [Google Scholar]
  3. Thevenod, F. Ion channels in secretory granules of the pancreas and their role in exocytosis and release of secretory proteins. Am J Physiol Cell Physiol 2002, 283, C651–C672. [Google Scholar]
  4. Ullrich, S; Su, J; Ranta, F; Wittekindt, OH; Ris, F; Rosler, M; Gerlach, U; Heitzmann, D; Warth, R; Lang, F. Effects of IKs channel inhibitors in insulin-secreting INS-1 cells. Pflüg Arch Eur J Physiol 2005, 451, 428–436. [Google Scholar]
  5. Prokopenko, I; McCarthy, MI; Lindgren, CM. Type 2 diabetes: New genes, new understanding. Trends Genet 2008, 24, 613–621. [Google Scholar]
  6. Unoki, H; Takahashi, A; Kawaguchi, T; Hara, K; Horikoshi, M; Andersen, G; Ng, DP; Holmkvist, J; Borch-Johnsen, K; Jorgensen, T; et al. SNPs in KCNQ1 are associated with susceptibility to type 2 diabetes in East Asian and European populations. Nat Genet 2008, 40, 1098–1102. [Google Scholar]
  7. Yasuda, K; Miyake, K; Horikawa, Y; Hara, K; Osawa, H; Furuta, H; Hirota, Y; Mori, H; Jonsson, A; Sato, Y; et al. Variants in KCNQ1 are associated with susceptibility to type 2 diabetes mellitus. Nat Genet 2008, 40, 1092–1097. [Google Scholar]
  8. Tsai, FJ; Yang, CF; Chen, CC; Chuang, LM; Lu, CH; Chang, CT; Wang, TY; Chen, RH; Shiu, CF; Liu, YM; et al. A genome-wide association study identifies susceptibility variants for type 2 diabetes in Han Chinese. PLoS Genet 2010, 6. [Google Scholar] [CrossRef]
  9. Voight, BF; Scott, LJ; Steinthorsdottir, V; Morris, AP; Dina, C; Welch, RP; Zeggini, E; Huth, C; Aulchenko, YS; Thorleifsson, G; et al. Twelve type 2 diabetes susceptibility loci identified through large-scale association analysis. Nat Genet 2010, 42, 579–589. [Google Scholar]
  10. Hu, C; Wang, C; Zhang, R; Ma, X; Wang, J; Lu, J; Qin, W; Bao, Y; Xiang, K; Jia, W. Variations in KCNQ1 are associated with type 2 diabetes and beta cell function in a Chinese population. Diabetologia 2009, 52, 1322–1325. [Google Scholar]
  11. Liu, Y; Zhou, DZ; Zhang, D; Chen, Z; Zhao, T; Zhang, Z; Ning, M; Hu, X; Yang, YF; Zhang, ZF; et al. Variants in KCNQ1 are associated with susceptibility to type 2 diabetes in the population of mainland China. Diabetologia 2009, 52, 1315–1321. [Google Scholar]
  12. Qi, Q; Li, H; Loos, RJ; Liu, C; Wu, Y; Hu, FB; Wu, H; Lu, L; Yu, Z; Lin, X. Common variants in KCNQ1 are associated with type 2 diabetes and impaired fasting glucose in a Chinese Han population. Hum Mol Genet 2009, 18, 3508–3515. [Google Scholar]
  13. Tan, JT; Nurbaya, S; Gardner, D; Ye, S; Tai, ES; Ng, DP. Genetic variation in KCNQ1 associates with fasting glucose and beta-cell function: a study of 3,734 subjects comprising three ethnicities living in Singapore. Diabetes 2009, 58, 1445–1449. [Google Scholar]
  14. Tan, JT; Ng, DP; Nurbaya, S; Ye, S; Lim, XL; Leong, H; Seet, LT; Siew, WF; Kon, W; Wong, TY; et al. Polymorphisms identified through genome-wide association studies and their associations with type 2 diabetes in Chinese, Malays, and Asian-Indians in Singapore. J Clin Endocrinol Metab 2010, 95, 390–397. [Google Scholar]
  15. Been, LF; Ralhan, S; Wander, GS; Mehra, NK; Singh, JR; Mulvihill, JJ; Aston, CE; Sanghera, DK. Variants in KCNQ1 increase type II diabetes susceptibility in South Asians: A study of 3,310 subjects from India and the US. BMC Med Genet 2011, 12. [Google Scholar] [CrossRef]
  16. Rees, SD; Hydrie, MZ; Shera, AS; Kumar, S; O’Hare, JP; Barnett, AH; Basit, A; Kelly, MA. Replication of 13 genome-wide association (GWA)-validated risk variants for type 2 diabetes in Pakistani populations. Diabetologia 2011, 54, 1368–1374. [Google Scholar]
  17. Holmkvist, J; Banasik, K; Andersen, G; Unoki, H; Jensen, TS; Pisinger, C; Borch-Johnsen, K; Sandbaek, A; Lauritzen, T; Brunak, S; et al. The type 2 diabetes associated minor allele of rs2237895 KCNQ1 associates with reduced insulin release following an oral glucose load. PLoS One 2009, 4. [Google Scholar] [CrossRef]
  18. Jonsson, A; Isomaa, B; Tuomi, T; Taneera, J; Salehi, A; Nilsson, P; Groop, L; Lyssenko, V. A variant in the KCNQ1 gene predicts future type 2 diabetes and mediates impaired insulin secretion. Diabetes 2009, 58, 2409–2413. [Google Scholar]
  19. Alberti, KG; Eckel, RH; Grundy, SM; Zimmet, PZ; Cleeman, JI; Donato, KA; Fruchart, JC; James, WP; Loria, CM; Smith, SC, Jr. Harmonizing the metabolic syndrome: A joint interim statement of the International Diabetes Federation Task Force on Epidemiology and Prevention; National Heart, Lung, and Blood Institute; American Heart Association; World Heart Federation; International Atherosclerosis Society; and International Association for the Study of Obesity. Circulation 2009, 120, 1640–1645. [Google Scholar]
  20. Xu, M; Bi, Y; Xu, Y; Yu, B; Huang, Y; Gu, L; Wu, Y; Zhu, X; Li, M; Wang, T; et al. Combined effects of 19 common variations on type 2 diabetes in Chinese: results from two community-based studies. PLoS One 2010, 5. [Google Scholar] [CrossRef]
  21. Lee, YH; Kang, ES; Kim, SH; Han, SJ; Kim, CH; Kim, HJ; Ahn, CW; Cha, BS; Nam, M; Nam, CM; et al. Association between polymorphisms in SLC30A8, HHEX, CDKN2A/B, IGF2BP2, FTO, WFS1, CDKAL1, KCNQ1 and type 2 diabetes in the Korean population. J Hum Genet 2008, 53, 991–998. [Google Scholar]
  22. Warth, R; Garcia Alzamora, M; Kim, JK; Zdebik, A; Nitschke, R; Bleich, M; Gerlach, U; Barhanin, J; Kim, SJ. The role of KCNQ1/KCNE1 K+ channels in intestine and pancreas: lessons from the KCNE1 knockout mouse. Pflüg Arch Eur J Physiol 2002, 443, 822–828. [Google Scholar]
  23. Boini, KM; Graf, D; Hennige, AM; Koka, S; Kempe, DS; Wang, K; Ackermann, TF; Foller, M; Vallon, V; Pfeifer, K; et al. Enhanced insulin sensitivity of gene-targeted mice lacking functional KCNQ1. Am J Physiol Regul Integr Comp Physiol 2009, 296, R1695–R1701. [Google Scholar]
  24. The United States National Library of Medicine. Available online: http://www.ncbi.nlm.nih.gov/snp (assessed on 22 February 2010).
  25. Institute of Human Genetics, Technical University Munich; Munich, Germany. Available online: http://ihg.gsf.de/cgi-bin/hw/hwa1.pl (accessed on 6 August 2011).
Figure 1. Pairwise linkage disequilibrium among KCNQ1 single nucleotide polymorphisms (SNPs) in Malaysian Chinese. Values in the upper represent KCNQ1 SNPs while values in the left represent D′ value.
Ijms 12 05705f1
Figure 2. Odds ratios and 95% confidence intervals of the association of individual SNPs (additive genetic models), haplotypes and diplotypes with T2D. Left number, odds ratio; bar, 95% confidence interval; * reciprocal odds ratio and 95% confidence interval were represented.
Ijms 12 05705f2
Table 1. Demography and biochemical parameters.
ParametersNormal n = 230Type 2 diabetes n = 300P-value
GenderMale %61.351
Female %38.749

Family history of diabetes %Male %3276
Female %3463

Age (years)52.9 ± 9.1549.8 ± 7.42<0.001
Height (m)1.62 ± 0.081.63 ± 0.090.18
Weight (kg)63.1 ± 15.575.0 ± 15.2<0.001
BMI(kg/m2)24.1 ± 5.1428.3 ± 5.15<0.001
Waist (cm)84.7 ± 13.195.7 ± 12.3<0.001
Hip (cm)99 ± 10.1104 ± 10.10.001
Waist/Hip0.85 ± 0.070.92 ± 0.07<0.001
Systolic blood pressure136 ± 18.5136 ± 18.50.97
81 ± 9.782 ± 10.50.20
Fasting insulin (pmol/L)63.8 ± 44.6103 ± 56.6<0.001
Fasting glucose (mmol/L)5.1 ± 0.498.3 ± 2.74<0.001
Triacylglycerol (mmol/L)1.1 ± 0.442.1 ± 1.20<0.001
HDL cholesterol (mmol/L)1.52 ± 0.321.21 ± 0.28<0.001
Insulin resistance (IR)1.4 ± 0.932.5 ± 1.44<0.001
Table 2. Association of KCNQ1 single nucleotide polymorphisms with type 2 diabetes evaluated by recessive, dominant and additive genetic models.
Recessive modelDominant modelAdditive model

NPsGroupGenotype n (distribution %)OR (95% CI)P-valueOR (95% CI)P-valueOR (95% CI)P-value
First logistic regression model, analysis adjusted for age and gender
rs2237892TTCTCC1.9 (1.29–2.66)0.0012.1 (1.09–3.94)0.0261.6 (1.25–2.18)0.0005
normal27(11.7)90(39.1)113(49.1)
diabetic18(6.0)99(33.0)183(61.0)
rs2283228CCACAA1.8 (1.24–2.52)0.0021.7 (0.97–2.93)0.061.5 (1.17–1.97)0.002
normal33(14.3)98(42.6)99(43.0)
diabetic27(9.0)105(35.0)168(56.0)
rs2237895CCACAA1.6 (0.83–3.17)0.161.7 (1.17–2.39)0.0041.5 (1.14–2.01)0.004
normal14(6.1)96(41.7)120(52.2)
diabetic30(10.0)147(49.0)123(41.0)

Second logistic regression model, analysis adjusted for age, gender, and body mass index
rs2237892 *TTCTCC2.2 (1.5–3.4)0.00022.7 (1.3–5.5)0.0072.0 (1.4–2.7)5.1 × 10⁻⁵
normal27(12.6)81(37.7)107(49.8)
diabetic18(6.0)99(33.0183(61.0)
rs2283228 *CCACAA2.3 (1.5–3.5)7.3 × 10−52.2 (1.2–4.1)0.0111.9 (1.4–2.5)5.2 × 10⁻⁵
normal33(14.9)89(40.3)99(44.8)
diabetic27(9.0)105(35.0)168(56.0)
rs2237895 *CCACAA3.7 (1.7–8.1)0.0012.0 (1.3–3.0)0.0011.9 (1.4–2.7)7.8 × 10⁻⁵
normal11(5.0)96(44.0)111(50.9)
diabetic30(10.0)147(49.0)123(41.0)
In the additive model, genotype of homozygote for the non-risk allele (0/0), heterozygote (1/0) and homozygote for the risk allele (1/1 were coded as 0, 1 and 2 respectively). The recessive model was defined as 1/1 vs. 1/0 + 0/0 and dominant model as 1/1+1/0 vs 0/0;
*The outlier (studentized residual is greater than 2.0 or less than −2.0) were excluded.
Table 3. Association of common haplotypes with type 2 diabetes.
Haplotypes rs2237892, rs2283228, rs2237895Frequency
Normal n (230)Type 2 diabetes n (300)Odds ratio95% CIP-ValueOverall P-value
First logistic regression model, analysis adjusted for age and gender
CAC0.440.511.40.99–2.010.0577.49 × 10−6 a
TCA0.330.150.330.21–0.518.4 × 10−7
CAA0.130.161.30.86–2.210.263
CCA0.050.040.70.30–1.630.41
TAA0.010.064.61.31–16.190.017
CCC0.020.073.21.20–8.810.021

Second logistic regression model, analysis adjusted for age, gender and body mass index
CAC *0.440.511.71.1–2.40.008
TCA *0.340.150.170.1–0.283.7 × 10−11
CAA *0.140.161.40.79–2.40.26
CCA *0.050.040.540.2–1.50.23
TAA *0.010.066.01.6–22.10.007
CCC *0.020.072.60.88–7.50.083
*The outlier (studentized residual is greater than 2.0 or less than −2.0) were excluded;
anon-adjusted overall P-value.
Table 4. Association of common diplotypes with type 2 diabetes.
Diplotypes rs2237892, rs2283228, rs2237895(Frequency)
Normal n (230)Type 2 diabetes n (300)Odds ratio95% CIP-ValueOverall P-value
First logistic regression model, analysis adjusted for age and gender
CAA-CAC0.220.251.30.86–1.990.218.1 × 10−7 a
CAA-CAA0.130.161.30.81–2.210.26
CAA-TCA0.180.090.40.21–0.630.0003
TCA-CAC0.130.120.920.54–1.570.77
TCA-TCA0.120.020.160.06–0.408 × 10⁻⁵
CAC-CAC0.030.062.20.85–5.740.104
CAA-CCA0.050.030.480.19–1.190.11
CCA-CAC0.040.061.80.78–4.100.17

Second logistic regression model, analysis adjusted for age, gender, and body mass index
CAA-CAC *0.230.251.40.79–2.40.26
CAA-CAA *0.140.161.30.82–1.30.26
CAA-TCA *0.190.080.090.04–0.182.9 × 10−10
TCA-CAC *0.140.121.00.54–1.70.88
TCA-TCA *0.120.020.130.05–0.344.4 × 10−5
CAC-CAC *0.010.063.91.4–10.90.008
CAA-CCA *0.050.030.380.12–1.20.09
CCA-CAC *0.030.062.60.92–7.50.07
*The outlier (studentized residual is greater than 2.0 or less than −2.0) were excluded;
a, non-adjusted overall P-value.
Table 5. 3 Impact of KCNQ1, haplotypes and diplotypes on beta-cell function (HOMA-B) in normal subjects.
Non adjusted HOMA-B means(CI)Adjusted for age, genderAdjusted for age, gender, BMI

HOMA-B mean(CI)Parameter estimate P-valueUnivariate P-valueHOMA-B Mean(CI)Parameter estimate P-valueUnivariate P-value
rs2237892

CC(n = 113)96(90–103)98(92–105)0.0060.002100(95–106)0.010.0002
CT(n = 90)94(87–101)92(85–98)0.000490(85–96)0.0003
TT(n = 27) Ref120(104–137)121(106–138)118(105–132)

rs2283228

AA(99)97(90–104)97(90–104)0.330.584102(96–109)0.800.034
AC(98)97(87–101)97(90–103)0.3092(86–97)0.039
CC(33) Ref104(92–118)104(92–118)104(94–115)

rs2237895

CC(14)100(83–122)98(81–119)0.910.74106(90–125)0.360.554
AC(96)95(88–102)96(89–103)0.4496(91–103)0.70
AA(120) Ref100(94–107)99(93–106)98(93–104)

haplotypes

CAA(n = 30)84(74–95)85(75–97)0.0010.00390(81–100)0.0070.014
CAC(n = 102)97(91–104)97(91–104)0.02697(92–103)0.026
TCA(n = 75) Ref111(103–120)110(102–119)107(101–115)

Diplotype

CAA-CAA(n = 30)84(75–94)85(76–95)4.0 × 10−51.5 × 10−690(81–99)0.00015.7 × 10−6
CAA-CAC(n = 51)106(97–115)107(98–116)0.12110(102–119)0.20
CAA-TCA(n = 42)117(107–129)114(104–126)0.55105(96–115)0.062
TCA-CAC(n = 30)83(75–93)84(75–94)1.9 × 10−585(77–94)5.8 × 10⁻⁶
TCA-TCA(n = 27) Ref120(106–134)120(107–135)120(108–133)
% beta-cell insulin secretion was log-transformed before analyses, and the data were presented as geometric means; Ref, reference, the protective genotype, haplotypes and diplotypes were selected to be a reference for the comparison; CI, confidence interval.

