Article

Differential Expression Profile of MicroRNAs during Differentiation of Cardiomyocytes Exposed to Polychlorinated Biphenyls

1
State Key Laboratory of Reproductive Medicine, Department of Pediatrics, Nanjing Maternity and Child Health Care Hospital Affiliated to Nanjing Medical University, Nanjing 210029, China
2
State Key Laboratory of Reproductive Medicine, Center of Prenatal Diagnosis, Nanjing Maternity and Child Health Care Hospital Affiliated to Nanjing Medical University, Nanjing 210029, China
3
Department of Cardiology, the First Affiliated Hospital of Nanjing Medical University, Nanjing 210029, China
*
Authors to whom correspondence should be addressed.
Int. J. Mol. Sci. 2012, 13(12), 15955-15966; https://doi.org/10.3390/ijms131215955
Submission received: 14 September 2012 / Revised: 9 November 2012 / Accepted: 20 November 2012 / Published: 28 November 2012
(This article belongs to the Section Biochemistry)

Abstract

:
Exposure to persistent environmental pollutants, such as polychlorinated biphenyls (PCBs), is a risk factor for the development of congenital heart defects. MicroRNAs (miRNAs) have been shown to be involved in cardiac development. The objective of this study was to investigate changes in miRNA expression profiles during the differentiation of cardiomyocytes exposed to PCBs. For that purpose, PCBs (Aroclor 1254) at a concentration of 2.5 μmol/L were added on day 0 of differentiation of P19 mouse embryonal carcinoma cells into cardiac myocytes. The relative expression of miRNA genes was determined by miRNA microarray and real-time reverse transcriptase polymerase chain reaction (real-time RT-PCR) analyses. The microarray results revealed that 45 miRNAs, of which 14 were upregulated and 31 were downregulated, were differentially expressed in P19 cells treated with PCBs compared with control cells. The miRNA expression data was validated with real-time RT-PCR. The expression of certain potential target genes (Wnt1) was found to be reduced in P19 cells treated with PCBs, whereas the expression of other potential predicted target genes (GSK3β) was increased. Our results demonstrate a critical role of miRNAs in mediating the effect of PCBs during the differentiation of P19 cells into cardiac myocytes.

1. Introduction

Polychlorinated biphenyls (PCBs), which belong to a class of chemicals called chlorinated hydrocarbons, are well-known environmental pollutants that have been widely used industrially and commercially for more than half a century [1,2]. PCB contamination is a serious environmental problem in China. For example, the total concentration of PCBs in some surface water and surface microlayers exceeds the limits set by the “Environmental Quality Standard for Surface Water” in the Jiangsu Province [3]. Numerous reports and studies have confirmed that PCB exposure leads to an increase in the incidence and severity of cardiovascular disease [4,5], but little is known about the underlying molecular mechanisms.
MicroRNAs (miRNAs) are an abundant class of small non-protein-coding RNAs that have been shown to play critical roles in a wide range of biological and pathological processes, including cardiac development and congenital heart defects [6]. However, the role of miRNAs in the differentiation of cardiomyocytes that have been exposed to PCBs has not been investigated thus far. The P19 mouse embryonal carcinoma cell line is a suitable model for studying cardiac differentiation at the molecular and functional levels. In the present study, we initially investigated the differential expression profiles of miRNAs during the differentiation of P19 cells exposed to Aroclor 1254. We used Aroclor 1254 because it is a well-known hepatotoxin and consists of a complex mixture of PCBs [7]. We subsequently confirmed the microarray results by real-time reverse transcription polymerase chain reaction (real-time RT-PCR). Furthermore, we investigated changes in the expression of the target genes of some miRNAs.

2. Results and Discussion

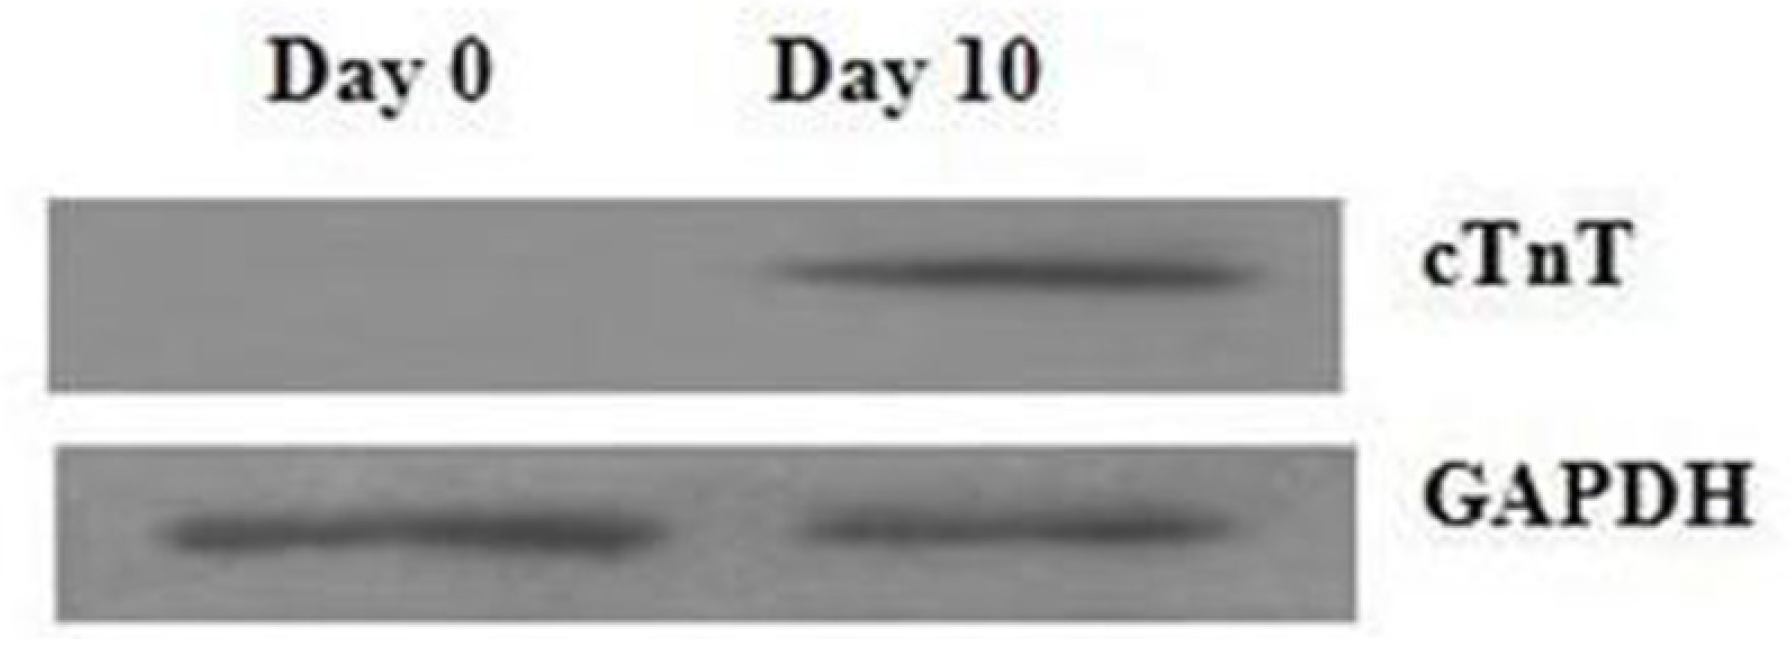
2.1. Assessment of Cell Differentiation

To investigate the differentiation of P19 cells into mature cardiomyocytes, we used Western blotting to identify the expression of cTnT protein (a myocyte differentiation marker). Figure 1 shows the increase in cTnT expression, indicating the differentiation of the cells into cardiac myocytes.

2.2. Morphology of P19 Cells during Differentiation

The changes in the morphology of P19 cells during differentiation were examined and photographed with an inverted microscope. P19 cells were allowed to aggregate from day 0 to day 4, and beating colonies were found on day 10. No significant differences in morphology were observed between P19 cells that had been exposed to PCBs and the control cells (Figure 2).

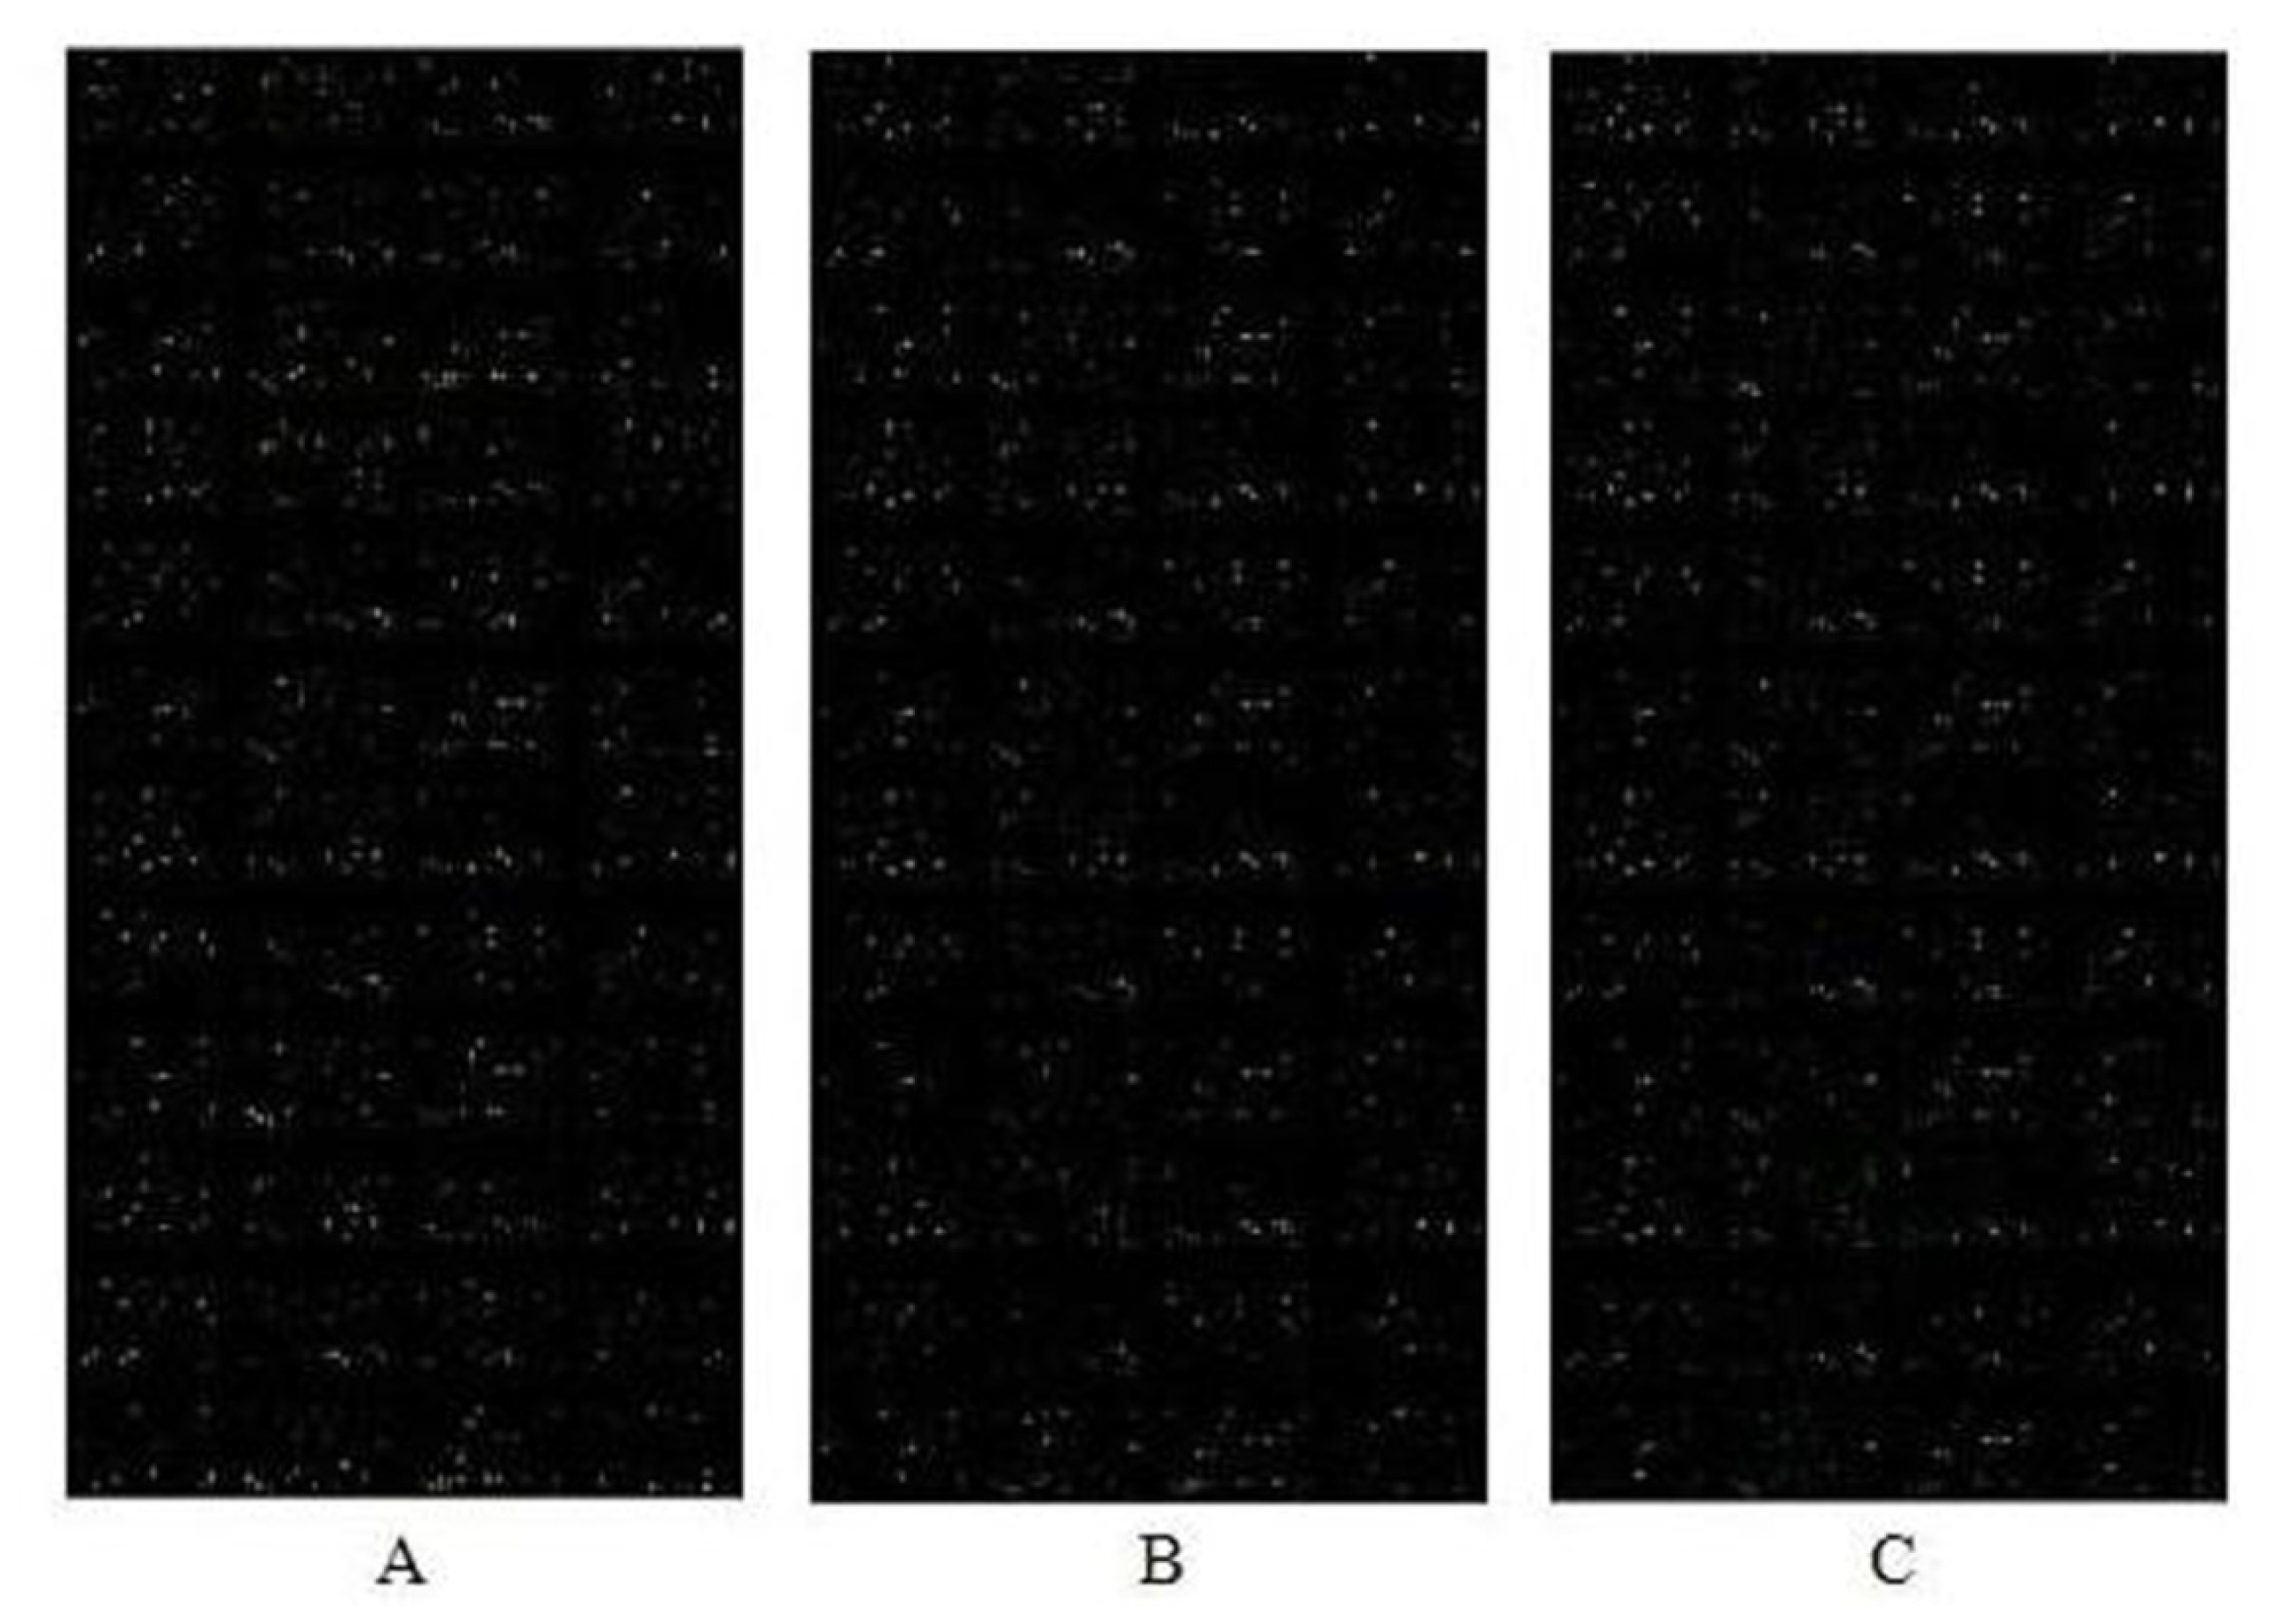
2.3. miRNA Expression Profiles in P19 Cells Exposed to PCBs Relative to Control Cells

miRNA microarrays are a powerful tool for studying the biological function of miRNAs. Every sample was repeated three times to improve miRNA microarray accuracy (Figure 3). The miRNA expression pattern was found to be significantly different between cells that had been exposed to PCBs and controls (Table 1). A total of 45 miRNAs were differentially expressed in cardiomyocytes that differentiated from P19 cells exposed to PCBs (day 10) compared with normal cells (day 10). Specifically, 14 miRNAs were found to be upregulated and 31 miRNAs were downregulated in P19 cells exposed to PCBs.

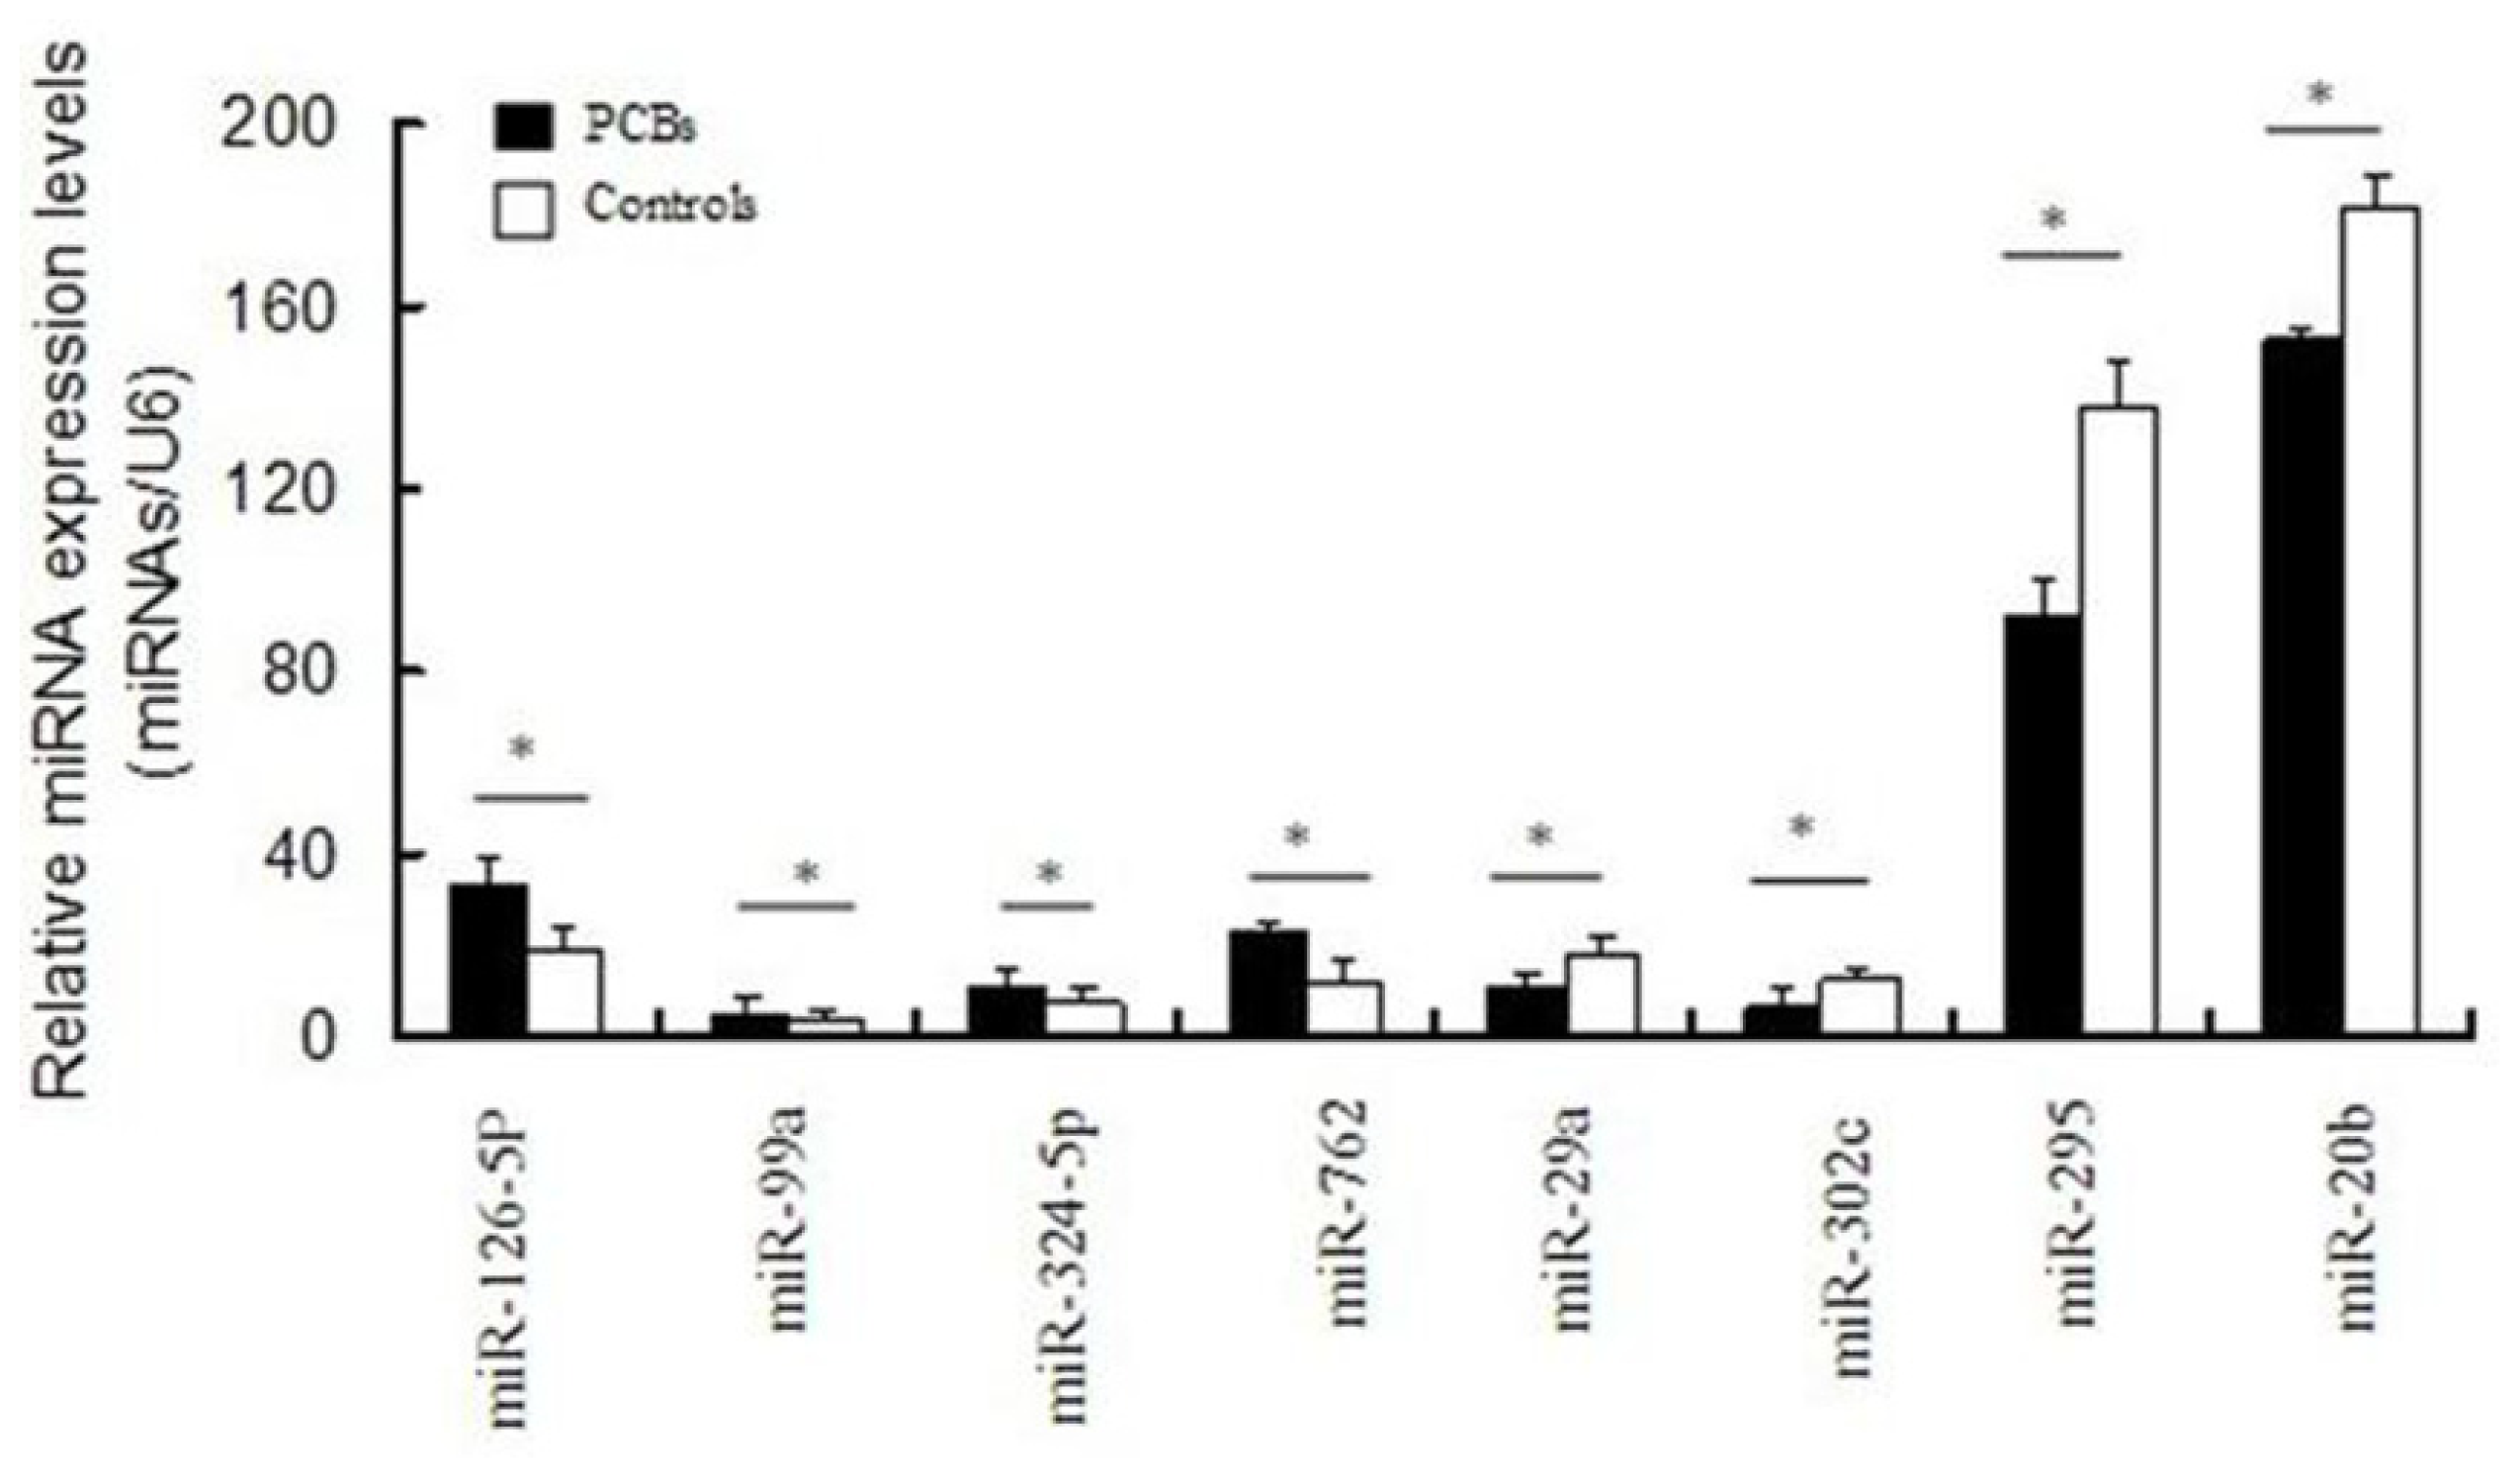
2.4. Validation of Differentially Expressed miRNAs

Eight miRNAs (miR-126-5p, miR-99a, miR-324-5p, miR-762, miR-29a, miR-302c, miR-295, miR-20b) were randomly selected to confirm the microarray results using real-time RT-PCR. The expression data obtained by real-time RT-PCR analysis were comparable to the results of the miRNA microarray analysis (Figure 4).

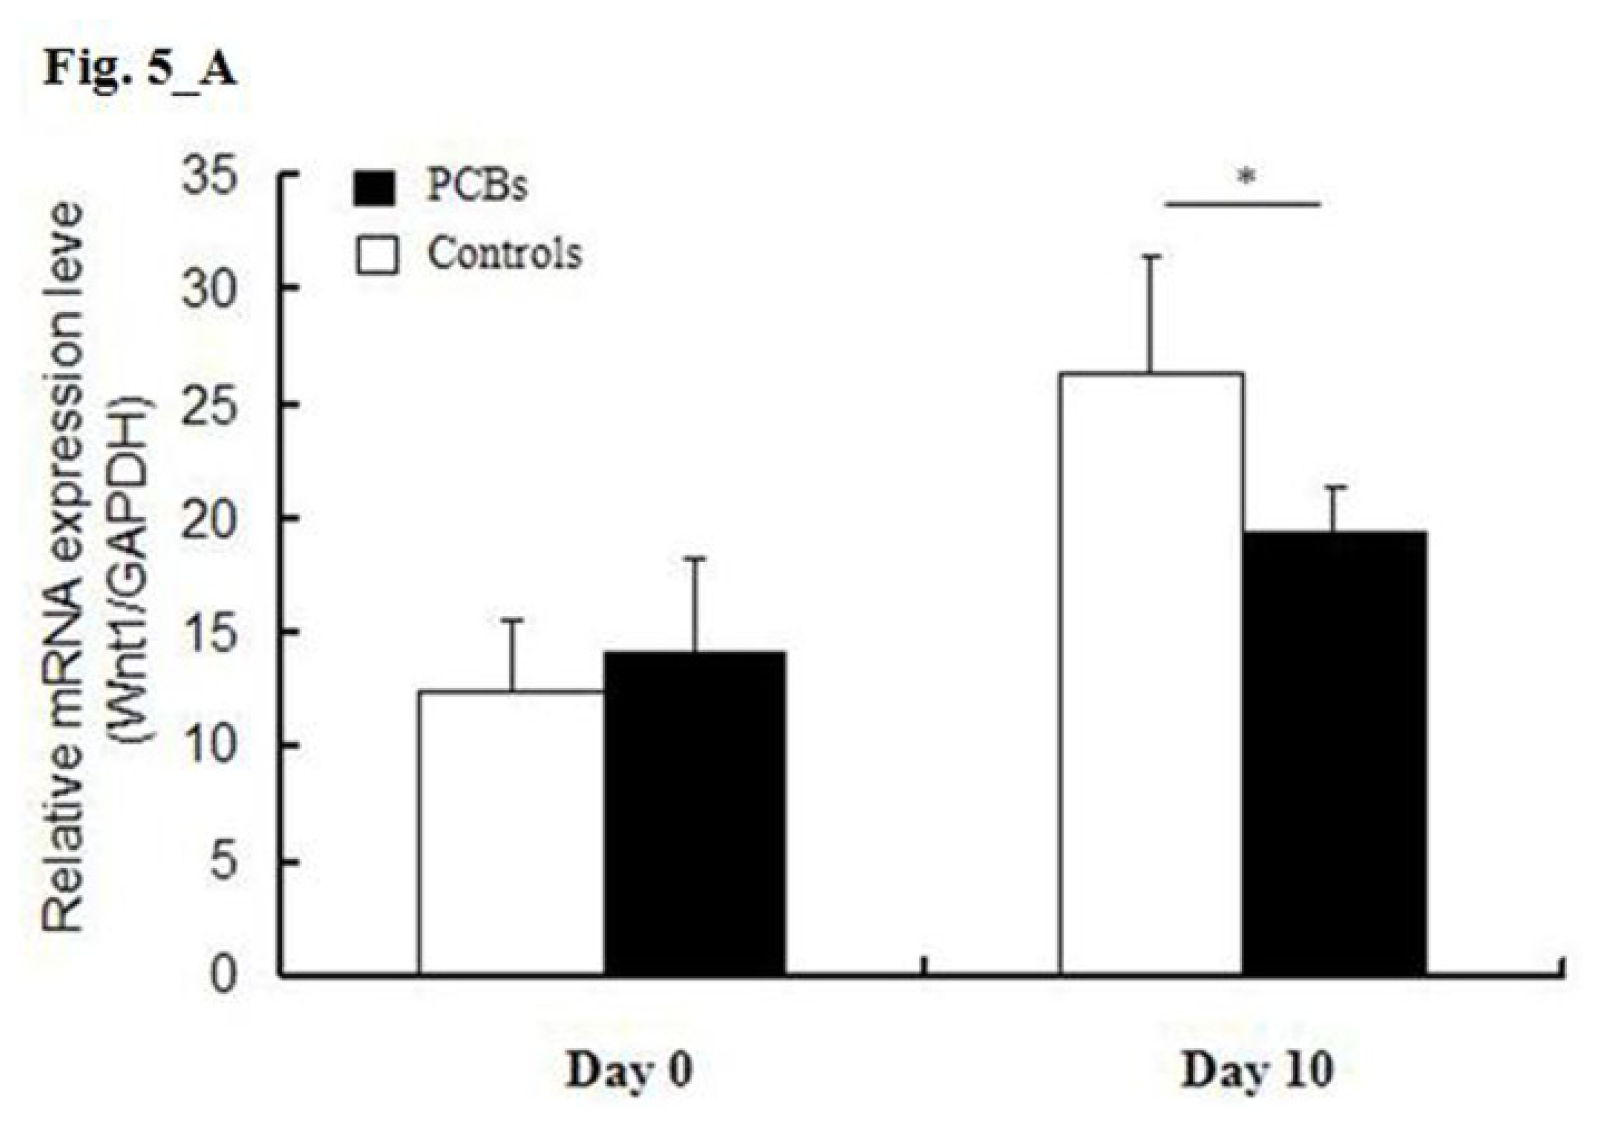
2.5. miRNA Target Predictions

In the course of exploring the targets of these miRNAs by computational prediction, we found that Wnt1, GSK3β, and NKX2.5 were potential targets of miR-762, miR-29a, and miR-324-5p, respectively. The results of real-time RT-PCR analysis showed that the expression of Wnt1 and NKX2.5 was downregulated in P19 cells that were treated with PCBs, whereas the expression of GSK3β was upregulated (Figure 5).

2.6. Discussion

The heart is the first organ formed in the developing embryo. Exposure to PCBs, some of the most ubiquitous environmental contaminants, is a risk factor for the development of cardiovascular diseases. In this study, we simulated the exposure of PCBs with Aroclor 1254 at a concentration of 2.5 μmol/L, which is the concentration used in most experiments that examine the effect of PCBs on cells [2]. The P19 mouse embryonal carcinoma cell line can be specifically induced to differentiate into cardiac muscle cells, and is therefore one of the most suitable models for studying cardiac differentiation at the molecular and functional levels [8]. Thus, we selected the P19 cell line to investigate the differential expression profiles of miRNAs in the differentiation of P19 cells exposed to PCBs into cardiomyocytes.
In our initial expression profiling experiment we identified 45 miRNAs that were differentially expressed between P19 cells treated with PCBs and control cells. In particular, 14 miRNAs were upregulated and 31 were downregulated in P19 cells that had been exposed to PCBs during the differentiation process. To validate the microarray results, eight miRNAs were selected for further experimental confirmation: miR-126-5p, miR-99a, miR-324-5p, miR-762, miR-29a, miR-302c, miR-295, miR-20b. The expression levels of these miRNAs were measured with real-time RT-PCR, and the changes in the expression of all eight miRNAs were found to be consistent with the microarray data.
The role of miRNAs in cardiac development and cardiovascular disease has begun to be uncovered. MiR-208a has been previously shown to be necessary for normal cardiac conduction. The expression level of miR-208a has been demonstrated to gradually increase during mouse heart development. Transgenic overexpression of miR-208a was sufficient to induce hypertrophic growth in the mouse heart [9]. In the present study, miR-208a was upregulated in P19 cells exposed to PCBs, and could therefore have a role in the development of heart disease caused by PCB exposure. The results of a previous study suggest that miR-21 can protect against H2O2-induced injury via the induction of its target gene in cardiac myocytes [10]. Dong et al. also demonstrated the protective effect of miR-21 against ischemia-induced cardiac myocyte damage, an effect mediated by decreased cell apoptosis [11]. In our study, miR-21 was downregulated during differentiation in P19 cells exposed to PCBs. We speculate that PCBs might cause heart disease by downregulating the expression of miR-21. In the present study, the expression of NKX2.5 was reduced in P19 cells treated with PCBs and NKX2.5 is a potential target of miR-324-5p. NKX2.5, a member of the NK2 class homeodomain protein, is one of the earliest genes expressed in vertebrate heart development. Nkx2.5 plays an important role in the development of heart tube, ventricular septal and endocardial cushion [12,13]. This suggests that miR-324-5p might be important in controlling pathological events in congenital heart disease caused by exposure to PCBs.
Numerous reports and studies show that the Wnt signaling pathway has a key role in the process of cardiovascular differentiation and morphogenesis [14,15]. At the cell surface, Wnt proteins activate the pathway through binding a receptor complex containing Frizzled, whereas GSK3β negatively regulates the pathway [16]. During the differentiation of P19 cells treated with PCBs, we found that increased expression of miR-762 was associated with a decrease in the expression of Wnt1 and an increase in GSK3β expression. These findings indicate that miRNAs usually cause translational repression or target degradation and gene silencing [17]. The function of these miRNAs, and the relationship between miRNAs and their targets, requires further confirmation and study.

3. Experimental Methods

3.1. Cell Culture

The P19 mouse embryonal carcinoma cells used in this study were obtained from the American Type Culture Collection (ATCC, Manassas, VA, USA). In order to induce cardiac differentiation, the cells were cultured in α-MEM (Gibco BRL, Grand Island, NY, USA) containing 10% fetal bovine serum (FBS; Gibco BRL), 100 U/mL penicillin, and 100 μg/mL streptomycin at 37 °C in 5% CO2 until confluence. After 48 h, at which point the cells had reached confluence (day 0), the cells were cultured in α-MEM, 1% DMSO (Sigma, St. Louis, MO, USA), 10% FBS, 100 U/mL penicillin, and 100 μg/mL streptomycin for 96 h (day 4) in bacteriological dishes. The cell aggregates were transferred to 6 cm bacterial dishes, and cultured in α-MEM containing 10% FBS for an additional 4 or 6 days (day 10) until the cells differentiated into beating cardiomyocytes. The morphological changes of the cells were examined and photographed with an inverted microscope (Nikon, Japan).
Solutions of Aroclor 1254 at a concentration of 2.5 μmol/L were prepared in DMSO. The Aroclor 1254 was added into the medium on day 0 of differentiation. We chose this concentration because it has been used in a previous study [2]. The same amount of DMSO diluted with the culture medium was used as a control.

3.2. Western Blotting

Treated cells were washed with ice-cold PBS and lysis buffer (50 mmol/L Tris-HCl, 1% Triton X-100, 0.2% sodium deoxycholate, 0.2% SDS, and 1 mmol/L EDTA at pH 7.4) and vortexed briefly. The lysate supernatant was collected after centrifugation at 15,200× g at 4 °C for 15 min. Protein levels were quantified using a protein assay reagent kit, and quantification was performed as described previously [18]. Western blotting was carried out using a monoclonal rabbit anti-cTnT antibody (Chemicon, Temecula, CA, USA) and a monoclonal rabbit anti-GAPDH antibody (Proteintech Group, Inc., Wuhan, China).

3.3. Total RNA Preparation

Total RNA was extracted from cardiac myocytes (on day 10) that had been exposed to either Aroclor 1254 or the control solution. Total RNA was extracted by using Trizol (Invitrogen, Carlsbad, CA, USA) according to the manufacturer’s instructions. Total RNA was quantified by a nanodrop spectrophotometer (ND-1000; NanoDrop Technologies, Wilmington, DE, USA).

3.4. MiRNA Microarray

Microarrays were performed by utilizing the miRCURY LNA™ microRNA Array (Version 14.0 Exiqon, Vedbaek, Denmark). All procedures were carried out according to the manufacturer’s instructions. After having passed RNA measurement on the NanoDrop instrument, the samples were labeled using the miRCURY™ Hy5™/Hy3™ Power labeling kit (Exiqon) and hybridized on the miRCURY LNA™ Array (v.14.0), which contains more than 1700 capture probes covering all miRNAs listed in miRBase version 14.0. After stopping the labeling procedure, the Hy3™-labeled samples and a Hy5™-labeled reference RNA sample were mixed pairwise and hybridized to the miRCURY LNA™ Array version 14.0 (Exiqon). The hybridization and subsequent wash steps were performed according to the miRCURY LNA™ array manual. The microarray slides were scanned using the ScanArray™ 4000 XL scanner (Packard Biochip Technologies, Billerica, MA, USA) and the image analysis was carried out using the ImaGeneTM 6.1.0 software (BioDiscovery, Inc., El Segundo, CA, USA). The normalized data was analyzed using the locally weighted scatter plot smoothing (lowess) regression algorithm (MIDAS, TIGR Microarray Data Analysis System). Statistical comparisons were performed by using the analysis of variance (ANOVA) statistic.

3.5. Validation of Microarray Experiments

Real-time RT-PCR analysis was performed to validate the miRNA microarray results. Total RNA was isolated from cultured cells with Trizol (Invitrogen, Carlsbad, CA, USA). The reverse transcription mixture contained 1 μg total RNA, 0.5 μL miRNA reverse primer (1 μM) (Table 2), 0.3 μL RNase inhibitor (40 U/μL), 2 μL 10× buffer, 2 μL RNasin (10 U/μL), and an appropriate amount of RNAse-free H2O to a total volume of 20 μL. The reverse transcription reaction was performed at 16 °C for 30 min, then 42 °C for 40 min, followed by heat inactivation at 85 °C for 5 min. Real-time PCR analysis was performed on an ABI 7300 real-time PCR system (Applied Biosystems, Carlsbad, CA, USA) with a 25 μL volume reaction containing 2.5 μL reverse transcription product, 0.5 μL forward and reverse primer (Table 3), and 12.5 μL SYBR-Green real-time PCR master mix. The reactions were incubated in 96-well plates at 95 °C for 5min, followed by 40 cycles (95 °C for 10 s, 60 °C for 20 s, 72 °C for 20 s, 78 °C for 20 s), and then ramped from 72 °C to 99 °C to obtain the melting curve. The U6 expression level was used as an internal control for miRNA expression levels. All reactions were run at least in triplicate.

3.6. MiRNA Target Predictions and Real-Time RT-PCR

Predicted targets of miR-762, miR-29a, and miR-324-5p were analyzed in the Sanger Center miRNA registry [19], TargetScan and PicTar target predictions [20]. The expression of the target genes was measured using real-time RT-PCR. Briefly, RNA extraction, purification, and reverse transcription were performed as stated above. Real-time RT-PCR using the universal TaqMan probe was performed and the results were analyzed using a 7300 Real-Time PCR system under the following conditions: samples were incubated at 95 °C for 10 min for initial denaturation, followed by 40 cycles of amplification that were performed at 95 °C for 15 s and at 60 °C for 1 min. A modification of the 2ΔΔCt method was used to analyze the relative quantification data [21]. GAPDH was used as the internal control gene. The sequences of the primers used are shown in Table 4.

4. Conclusion

In summary, we identified miRNAs that are differentially expressed during the differentiation of cardiomyocytes from P19 cells exposed to PCBs and control cells. Our results suggest that specific miRNAs could be directly involved in the development of cardiovascular disease resulting from exposure to PCBs. The function of these miRNAs will be analyzed in depth in the future.

Acknowledgements

This work was supported by grants from the National Natural Science Foundation of China (Grant No. 30973213), the Key Medical Personnel Foundation of Jiangsu Province (Grant No. RC2011021), the Science and Technology Development Foundation of Nanjing Medical University (Grant No. 2010NJMUZ15), and the Medical Innovation Team and Leading Talent of Jiangsu Province (Grant No. LJ201109).

References

  1. Crinnion, W.J. Polychlorinated biphenyls: Persistent pollutants with immunological, neurological, and endocrinological consequences. Altern. Med. Rev 2011, 16, 5–13. [Google Scholar]
  2. Han, S.G.; Eum, S.Y.; Toborek, M.; Smart, E.; Hennig, B. Polychlorinated biphenyl-induced VCAM-1 expression is attenuated in aortic endothelial cells isolated from caveolin-1 deficient mice. Toxicol. Appl. Pharmacol 2010, 246, 74–82. [Google Scholar]
  3. Hong, Y.; Chunhong, Z.; Xiaoxiong, Z. Investigation of pollution characteristics of polychlorinated biphenyls in the typical drinking water sources in Jiangsu Province, China. Environ. Monit. Assess 2009, 158, 573–579. [Google Scholar]
  4. Kopf, P.G.; Walker, M.K. Overview of developmental heart defects by dioxins, PCBs, and pesticides. J. Environ. Sci. Health C 2009, 27, 276–285. [Google Scholar]
  5. Goncharov, A.; Bloom, M.; Pavuk, M.; Birman, I.; Carpenter, D.O. Blood pressure and hypertension in relation to levels of serum polychlorinated biphenyls in residents of Anniston, Alabama. J. Hypertens 2010, 28, 2053–2060. [Google Scholar]
  6. Van Rooij, E.; Olson, E.N. MicroRNAs: Powerful new regulators of heart disease and provocative therapeutic targets. J. Clin. Invest 2007, 117, 2369–2376. [Google Scholar]
  7. Reymann, S.; Borlak, J. Transcriptome profiling of human hepatocytes treated with Aroclor 1254 reveals transcription factor regulatory networks and clusters of regulated genes. BMC Genomics 2006, 7, 217. [Google Scholar]
  8. Van der Heyden, M.A.; Defize, L.H. Twenty one years of P19 cells: What an embryonal carcinoma cell line taught us about cardiomyocyte differentiation. Cardiovasc. Res 2003, 58, 292–302. [Google Scholar]
  9. Callis, T.E.; Pandya, K.; Seok, H.Y.; Tang, R.H.; Tatsuguchi, M.; Huang, Z.P.; Chen, J.F.; Deng, Z.; Gunn, B.; Shumate, J.; et al. MicroRNA-208a is a regulator of cardiac hypertrophy and conduction in mice. J. Clin. Invest 2009, 119, 2772–2786. [Google Scholar]
  10. Cheng, Y.; Liu, X.; Zhang, S.; Lin, Y.; Yang, J.; Zhang, C. MicroRNA-21 protects against the H2O2-induced injury on cardiac myocytes via its target gene PDCD4. J. Mol. Cell. Cardiol 2009, 47, 5–14. [Google Scholar]
  11. Dong, S.; Cheng, Y.; Yang, J.; Li, J.; Liu, X.; Wang, X.; Wang, D.; Krall, T.J.; Delphin, E.S.; Zhang, C. MicroRNA expression signature and the role of microRNA-21 in the early phase of acute myocardial infarction. J. Biol. Chem 2009, 284, 29514–29525. [Google Scholar]
  12. Schwartz, R.J.; Olson, E.N. Building the heart piece by piece: Modularity of cis-elements regulating Nkx2-5 transcription. Development 1999, 126, 4187–4192. [Google Scholar]
  13. Ma, Q.; Zhou, B.; Pu, W.T. Reassessment of Isl1 and Nkx2-5 cardiac fate maps using a Gata4-based reporter of Cre activity. Dev. Biol. 2008, 323, 98–104. [Google Scholar]
  14. Cohen, E.D.; Tian, Y.; Morrisey, E.E. Wnt signaling: An essential regulator of cardiovascular differentiation, morphogenesis and progenitor self-renewal. Development 2008, 135, 789–798. [Google Scholar]
  15. Kwon, C.; Arnold, J.; Hsiao, E.C.; Taketo, M.M.; Conklin, B.R.; Srivastava, D. Canonical Wnt signaling is a positive regulator of mammalian cardiac progenitors. Proc. Natl. Acad. Sci. USA 2007, 104, 10894–10899. [Google Scholar]
  16. Maye, P.; Zheng, J.; Li, L.; Wu, D. Multiple mechanisms for Wnt11-mediated repression of the canonical Wnt signaling pathway. J. Biol. Chem 2004, 279, 24659–24665. [Google Scholar]
  17. Bartel, D.P. MicroRNAs: Target recognition and regulatory functions. Cell 2009, 136, 215–233. [Google Scholar]
  18. Yamasaki, F.; Zhang, D.; Bartholomeusz, C.; Sudo, T.; Hortobagyi, G.N.; Kurisu, K.; Ueno, N.T. Sensitivity of breast cancer cells to erlotinib depends on cyclin-dependent kinase 2 activity. Mol. Cancer Ther 2007, 6, 2168–2177. [Google Scholar]
  19. miRBase Sequence database. Available online: http://microrna.sanger.ac.uk/sequences/index.shtml accessed on 9 March 2012.
  20. TargetScan and PicTar target prediction databases. Available online: http://pictar.mdc-berlin.de/cgi-bin/new_PicTar_mouse.cgi accessed on 9 March 2012.
  21. Livak, K.J.; Schmittgen, T.D. Analysis of relative gene expression data using real-time quantitative PCR and the 2−ΔΔC T Method. Methods 2001, 25, 402–408. [Google Scholar]
Figure 1. Assessment of cell differentiation. Expression of cTnT protein as shown by Western blotting. Abbreviations: D0, day 0; D10, day 10.
Ijms 13 15955f1
Figure 2. Morphology of P19 cells during differentiation into cardiac myocytes (day 0, 4, 10). No significant difference in morphology was observed between P19 cells exposed to PCBs and the control cells. Abbreviation: PCBs, polychlorinated biphenyls.
Ijms 13 15955f2
Figure 3. Detection of miRNAs by miRCURY LNA™ microarrays. The microarray slides contained three replicate subarrays, Abbreviation: miRNA, microRNA.
Ijms 13 15955f3
Figure 4. Validation of microarray data using real-time RT-PCR. The real-time RT-PCR reactions were repeated three times for every miRNA. Error bars indicate standard error. * p < 0.05. Abbreviations: miRNA, microRNA; PCBs, polychlorinated biphenyls; RT-PCR, reverse transcription polymerase chain reaction.
Ijms 13 15955f4
Figure 5. Expression of the miRNA targets as determined by real-time RT-PCR during the stimulation of differentiation (days 0 and 10). (A, B) The expression of Wnt1 and NKX2.5 was downregulated in P19 cells that were treated with PCBs, (C) whereas the expression of GSK3β was upregulated. * p < 0.05. Abbreviations: miRNA, microRNA; PCBs, polychlorinated biphenyls; RT-PCR, reverse transcription polymerase chain reaction.
Ijms 13 15955f5aIjms 13 15955f5b
Table 1. miRNAs differentially expressed between cardiomyocytes that differentiated from P19 cells exposed to PCBs (day 10) compared with normal cells (day 10).
miRNARegulationLog2p-Value
mmu-miR-99aUp1.740.0060
mmu-miR-214*Up1.510.0365
mmu-miR-345-5pUp1.570.0128
mmu-miR-126-5pUp2.890.0338
mmu-miR-762Up2.200.0242
mmu-miR-324-5pUp1.900.0071
mmu-miR-181aUp1.760.0318
mmu-miR-302b*Up2.830.0404
mmu-miR-155Up1.970.0333
mmu-miR-33Up1.900.0487
mmu-miR-208aUp2.130.0465
mmu-miR-10aUp1.840.0226
mmu-miR-154Up1.640.0392
mmu-miR-500Up1.530.0079
mmu-miR-29aDown0.600.0139
mmu-miR-302cDown0.650.0093
mmu-miR-302bDown0.730.0249
mmu-miR-293Down0.450.0349
mmu-miR-294Down0.520.0284
mmu-miR-295Down0.560.0410
mmu-miR-7aDown0.620.0435
mmu-miR-302a*Down0.670.0203
mmu-miR-1949Down0.580.0337
mmu-miR-21Down0.630.0039
mmu-miR-494Down0.540.0165
mmu-miR-20bDown0.550.0349
mmu-miR-200bDown0.140.0021
mmu-miR-136Down0.370.0346
mmu-miR-141Down0.050.0249
mmu-miR-194Down0.020.0147
mmu-miR-29bDown0.170.0350
mmu-miR-32Down0.480.0075
mmu-miR-710Down0.290.0120
mmu-miR-290-3pDown0.350.0204
mmu-miR-2133Down0.450.0072
mmu-miR-18bDown0.610.0213
mmu-miR-101aDown0.650.0273
mmu-miR-326Down0.470.0095
mmu-miR-669cDown0.350.0428
mmu-miR-302dDown0.580.0113
mmu-miR-2141Down0.250.0286
mmu-miR-183Down0.600.0151
mmu-miR-363Down0.560.0174
mmu-miR-706Down0.640.0216
mmu-miR-290-3pDown0.340.0439
Table 2. Real time (RT) primer sequences.
Gene nameRT primer
mmu-miR-126-5p5′ GTCGTATCCAGTGCGTGTCGTGGAGTC
GGCAATTGCACTGGATACGACCGCGTA 3′
mmu-miR-99a5′ GTCGTATCCAGTGCGTGTCGTGGAGTC
GGCAATTGCACTGGATACGACCACAAG 3′
mmu-miR-324-5p5′ GTCGTATCCAGTGCGTGTCGTGGAGTC
GGCAATTGCACTGGATACGACACACCA 3′
mmu-miR-7625′ GTCGTATCCAGTGCGTGTCGTGGAGTC
GGCAATTGCACTGGATACGACGCTCTG 3′
mmu-miR-29a5′ GTCGTATCCAGTGCGTGTCGTGGAGTC
GGCAATTGCACTGGATACGACTAACCG 3′
mmu-miR-302c5′ GTCGTATCCAGTGCGTGTCGTGGAGTC
GGCAATTGCACTGGATACGACCCACTG 3′
mmu-miR-2955′ GTCGTATCCAGTGCGTGTCGTGGAGTC
GGCAATTGCACTGGATACGACAGACTCAA 3′
mmu-miR-20b5′ GTCGTATCCAGTGCGTGTCGTGGAGTC
GGCAATTGCACTGGATACGACCTACCT 3′
U65′ CGCTTCACGAATTTGCGTGTCAT 3′
Table 3. Primers for real-time RT-PCR.
Gene namePrimersProduct size (bp)
mmu-miR-126-5pF: 5′ GGGGCATTATTACTTTTGG 3′65
R: 5′ CAGTGCGTGTCGTGGA 3′
mmu-miR-99aF: 5′ GATAACCCGTAGATCCGAT 3′65
R: 5′ CAGTGCGTGTCGTGGA 3′
mmu-miR-324-5pF: 5′ CGCATCCCCTAGGGCA 3′61
R: 5′ GTGCGTGTCGTGGAGTCG 3′
mmu-miR-762F: 5′ ATGCTGGGGCCGGGA 3′59
R: 5′ GTGCGTGTCGTGGAGTCG 3′
mmu-miR-29aF: 5′ GGGTAGCACCATCTGAAAT 3′62
R: 5′ TGCGTGTCGTGGAGTC 3′
mmu-miR-302cF: 5′ GGCAAGTGCTTCCATGTTT 3′65
R: 5′ CAGTGCGTGTCGTGGAGT 3′
mmu-miR-295F: 5′ GGGGGAAAGTGCTACTACTT 3′68
R: 5′ CAGTGCGTGTCGTGGAG 3′
mmu-miR-20bF: 5′ GGACAAAGTGCTCATAGTGC 3′66
R: 5′ CAGTGCGTGTCGTGGAGT 3′
U6F: 5′ GCTTCGGCAGCACATATACTAAAAT 3′89
R: 5′ CGCTTCACGAATTTGCGTGTCAT 3′
Table 4. Primers used for miRNA target prediction.
Gene namePrimersProduct size (bp)
Wnt1F: 5′ GGTTTCTACTACGTTGCTACTGG 3′121
R: 5′ GGAATCCGTCAACAGGTTCGT 3′
GSK3βF: 5′ TGGCAGCAAGGTAACCACAG 3′189
R: 5′ CGGTTCTTAAATCGCTTGTCCTG 3′
NKX2.5F: 5′ CCTGCGGCCTCTACATGA 3′222
R: 5′ AGGGTCTCACCAGCAGGA 3′
GAPDHF: 5′ TTCACCACCATGGAGAAGGC 3′237
R: 5′ GGCATGGACTGTGGTCATGA 3′

