Virtual Screening of Specific Insulin-Like Growth Factor 1 Receptor (IGF1R) Inhibitors from the National Cancer Institute (NCI) Molecular Database

Abstract
:1. Introduction
2. Results
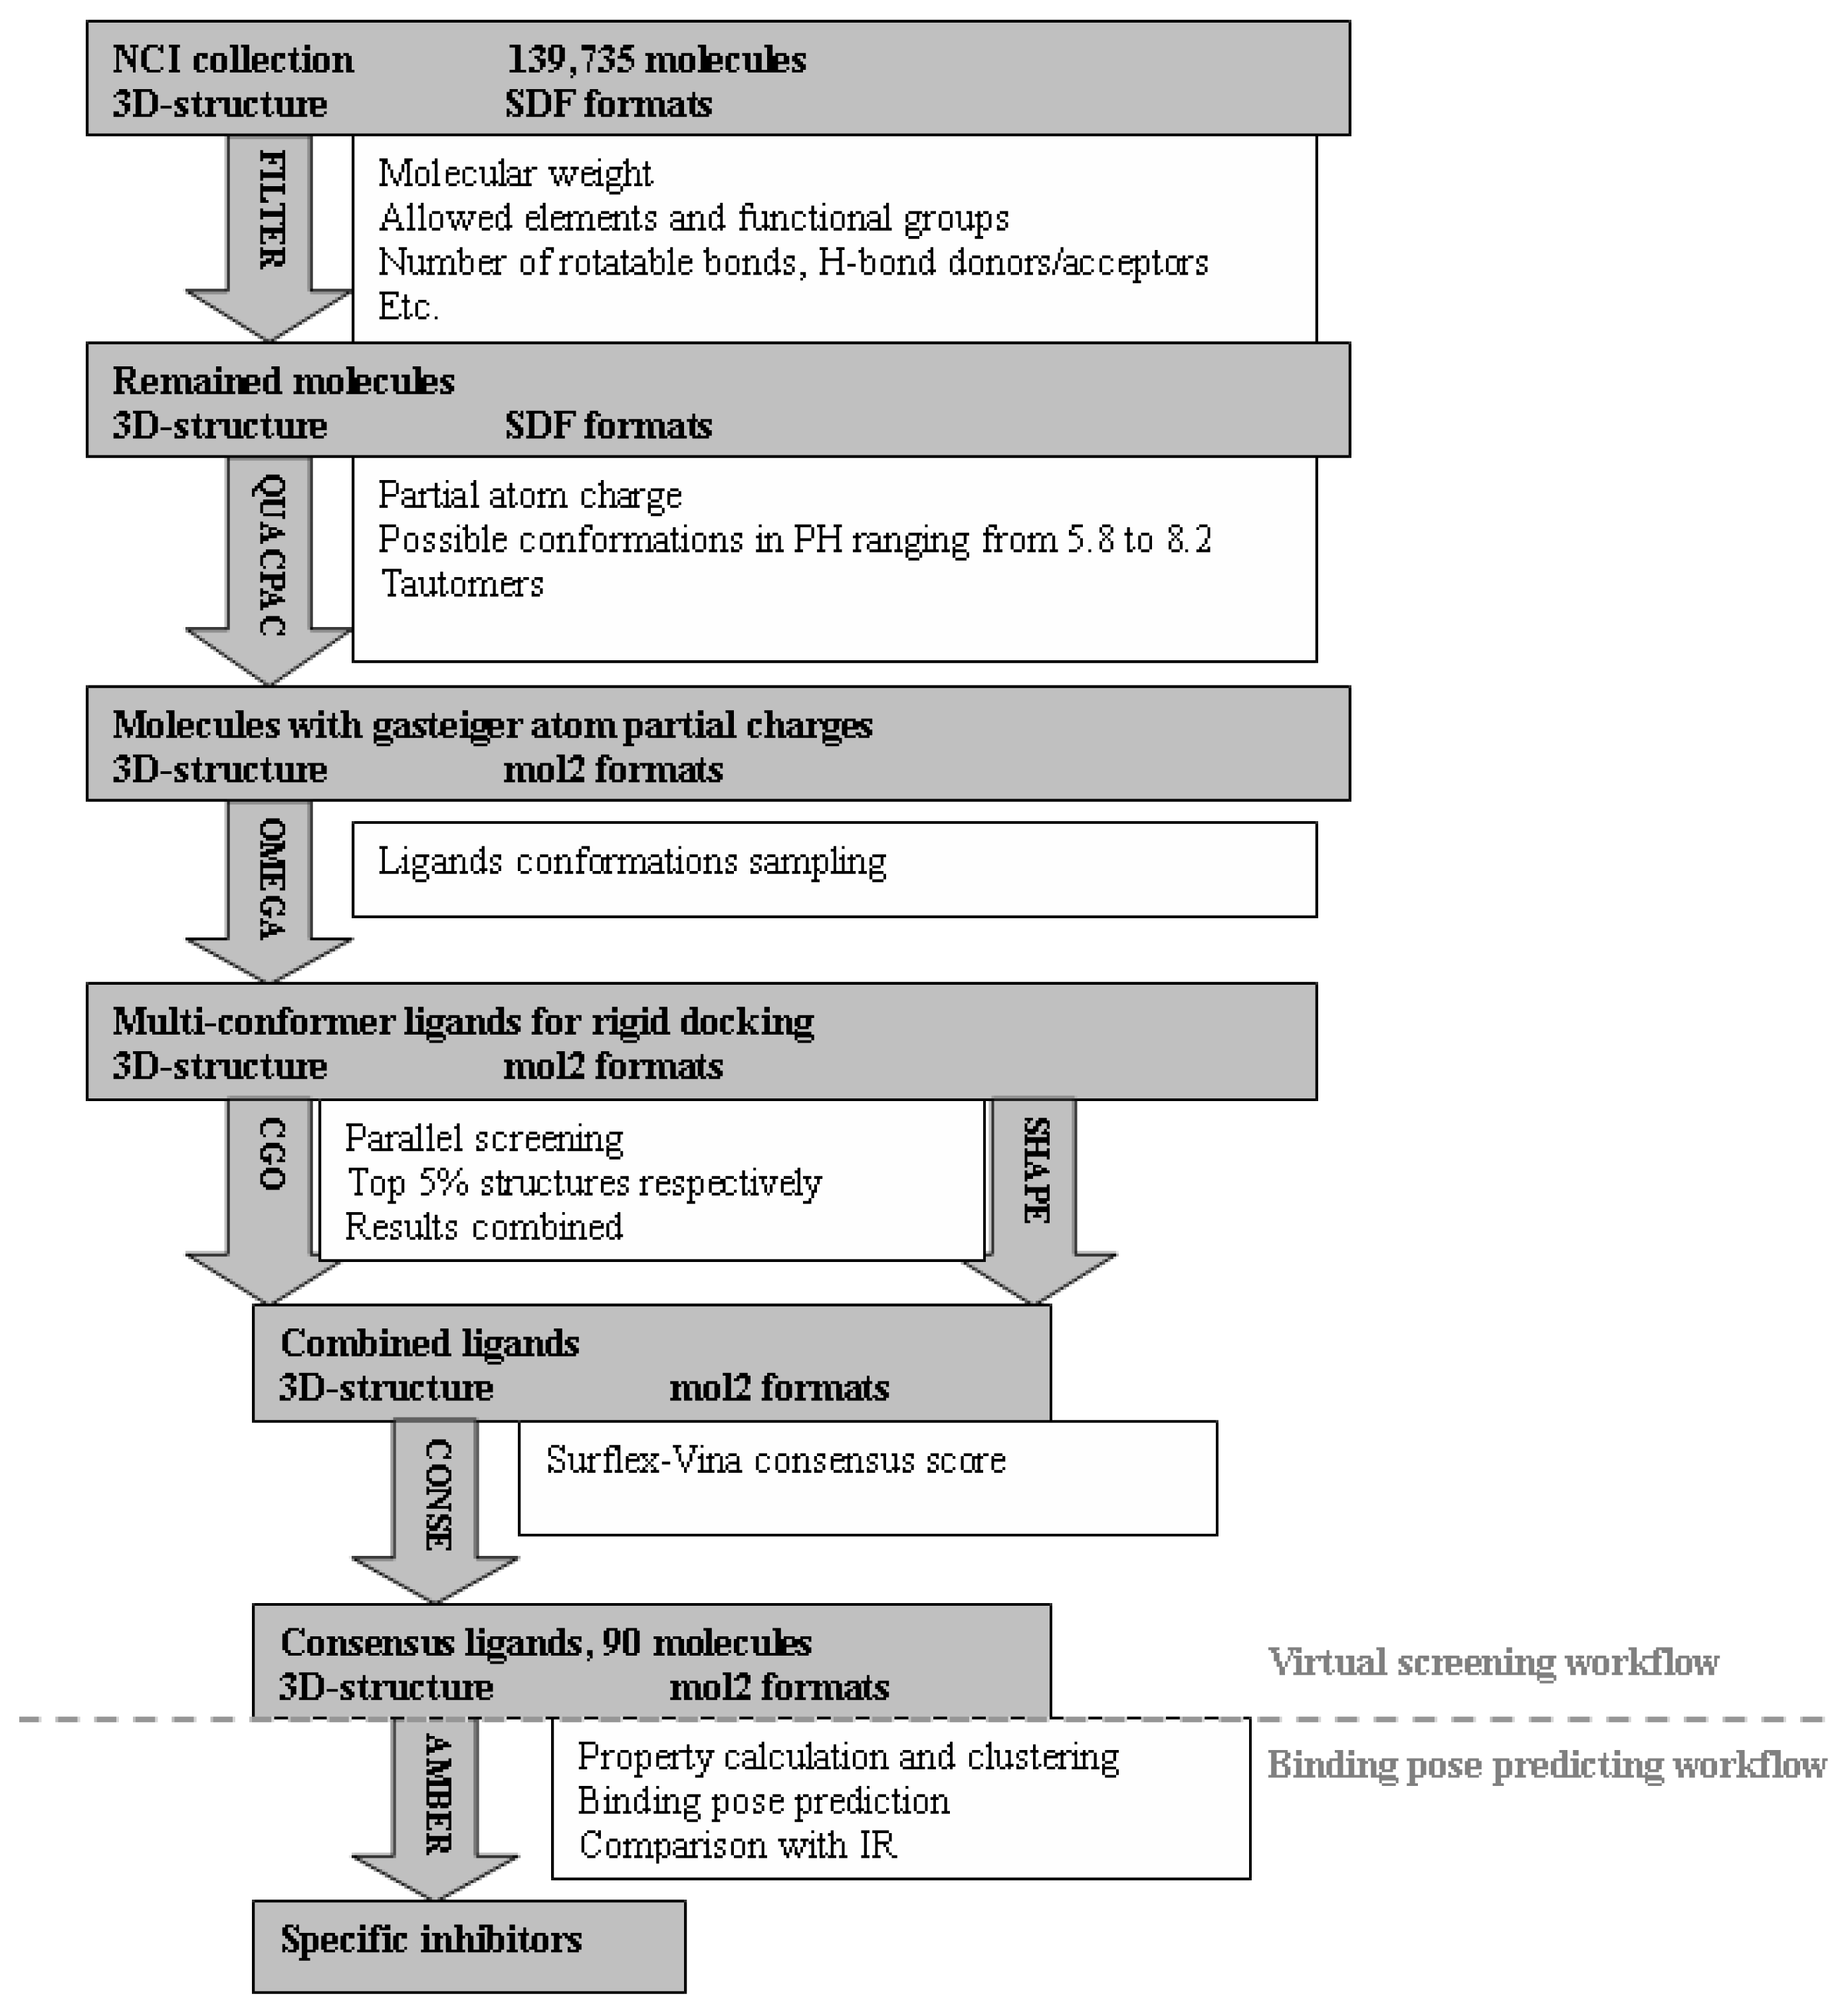
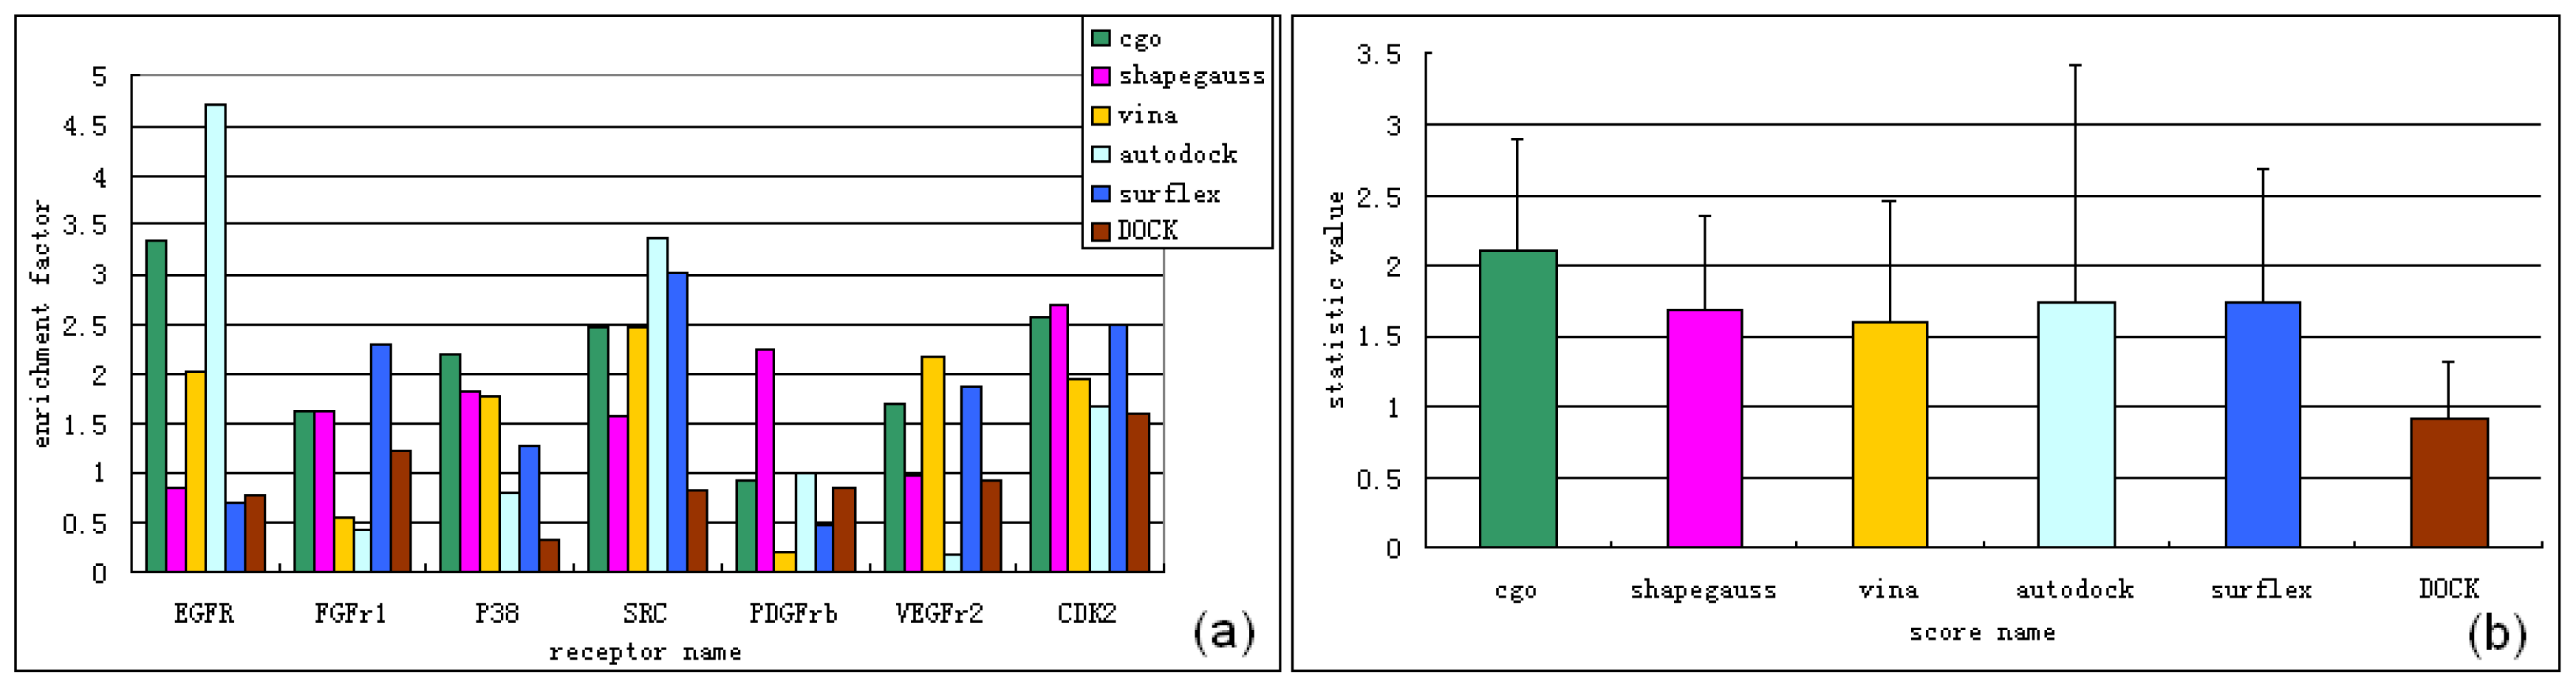
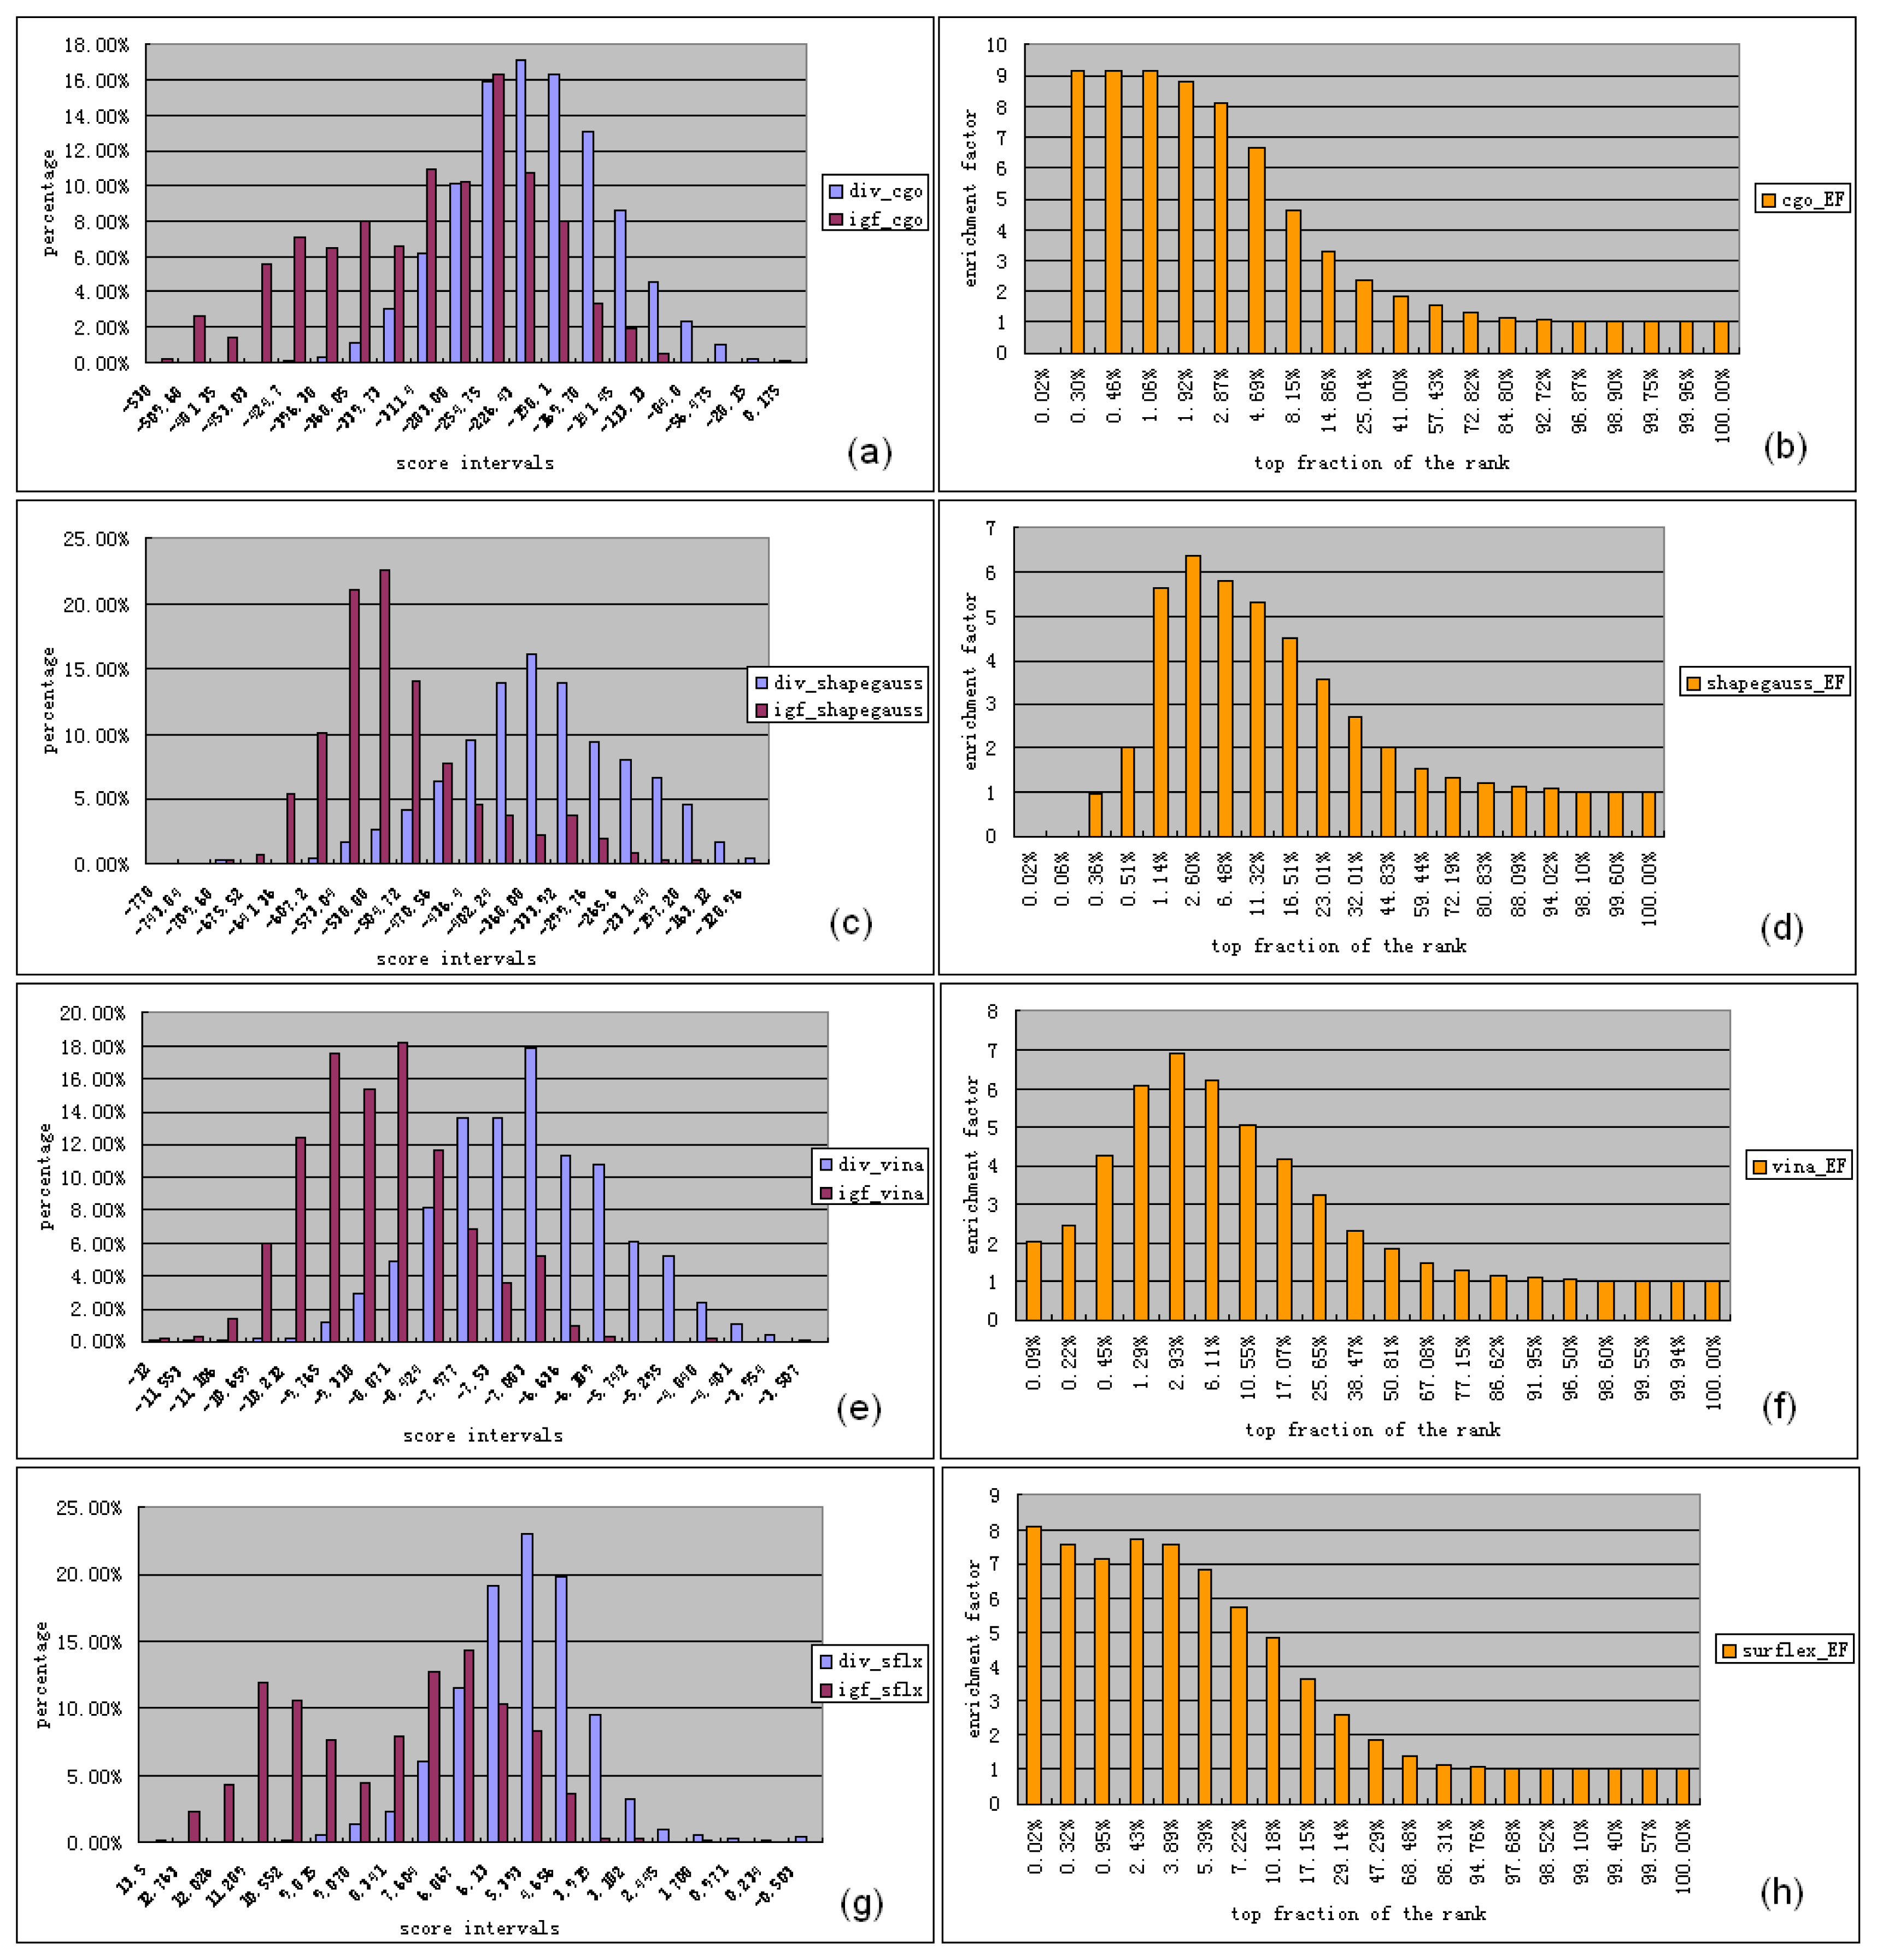
2.1. Virtual Screening Workflow
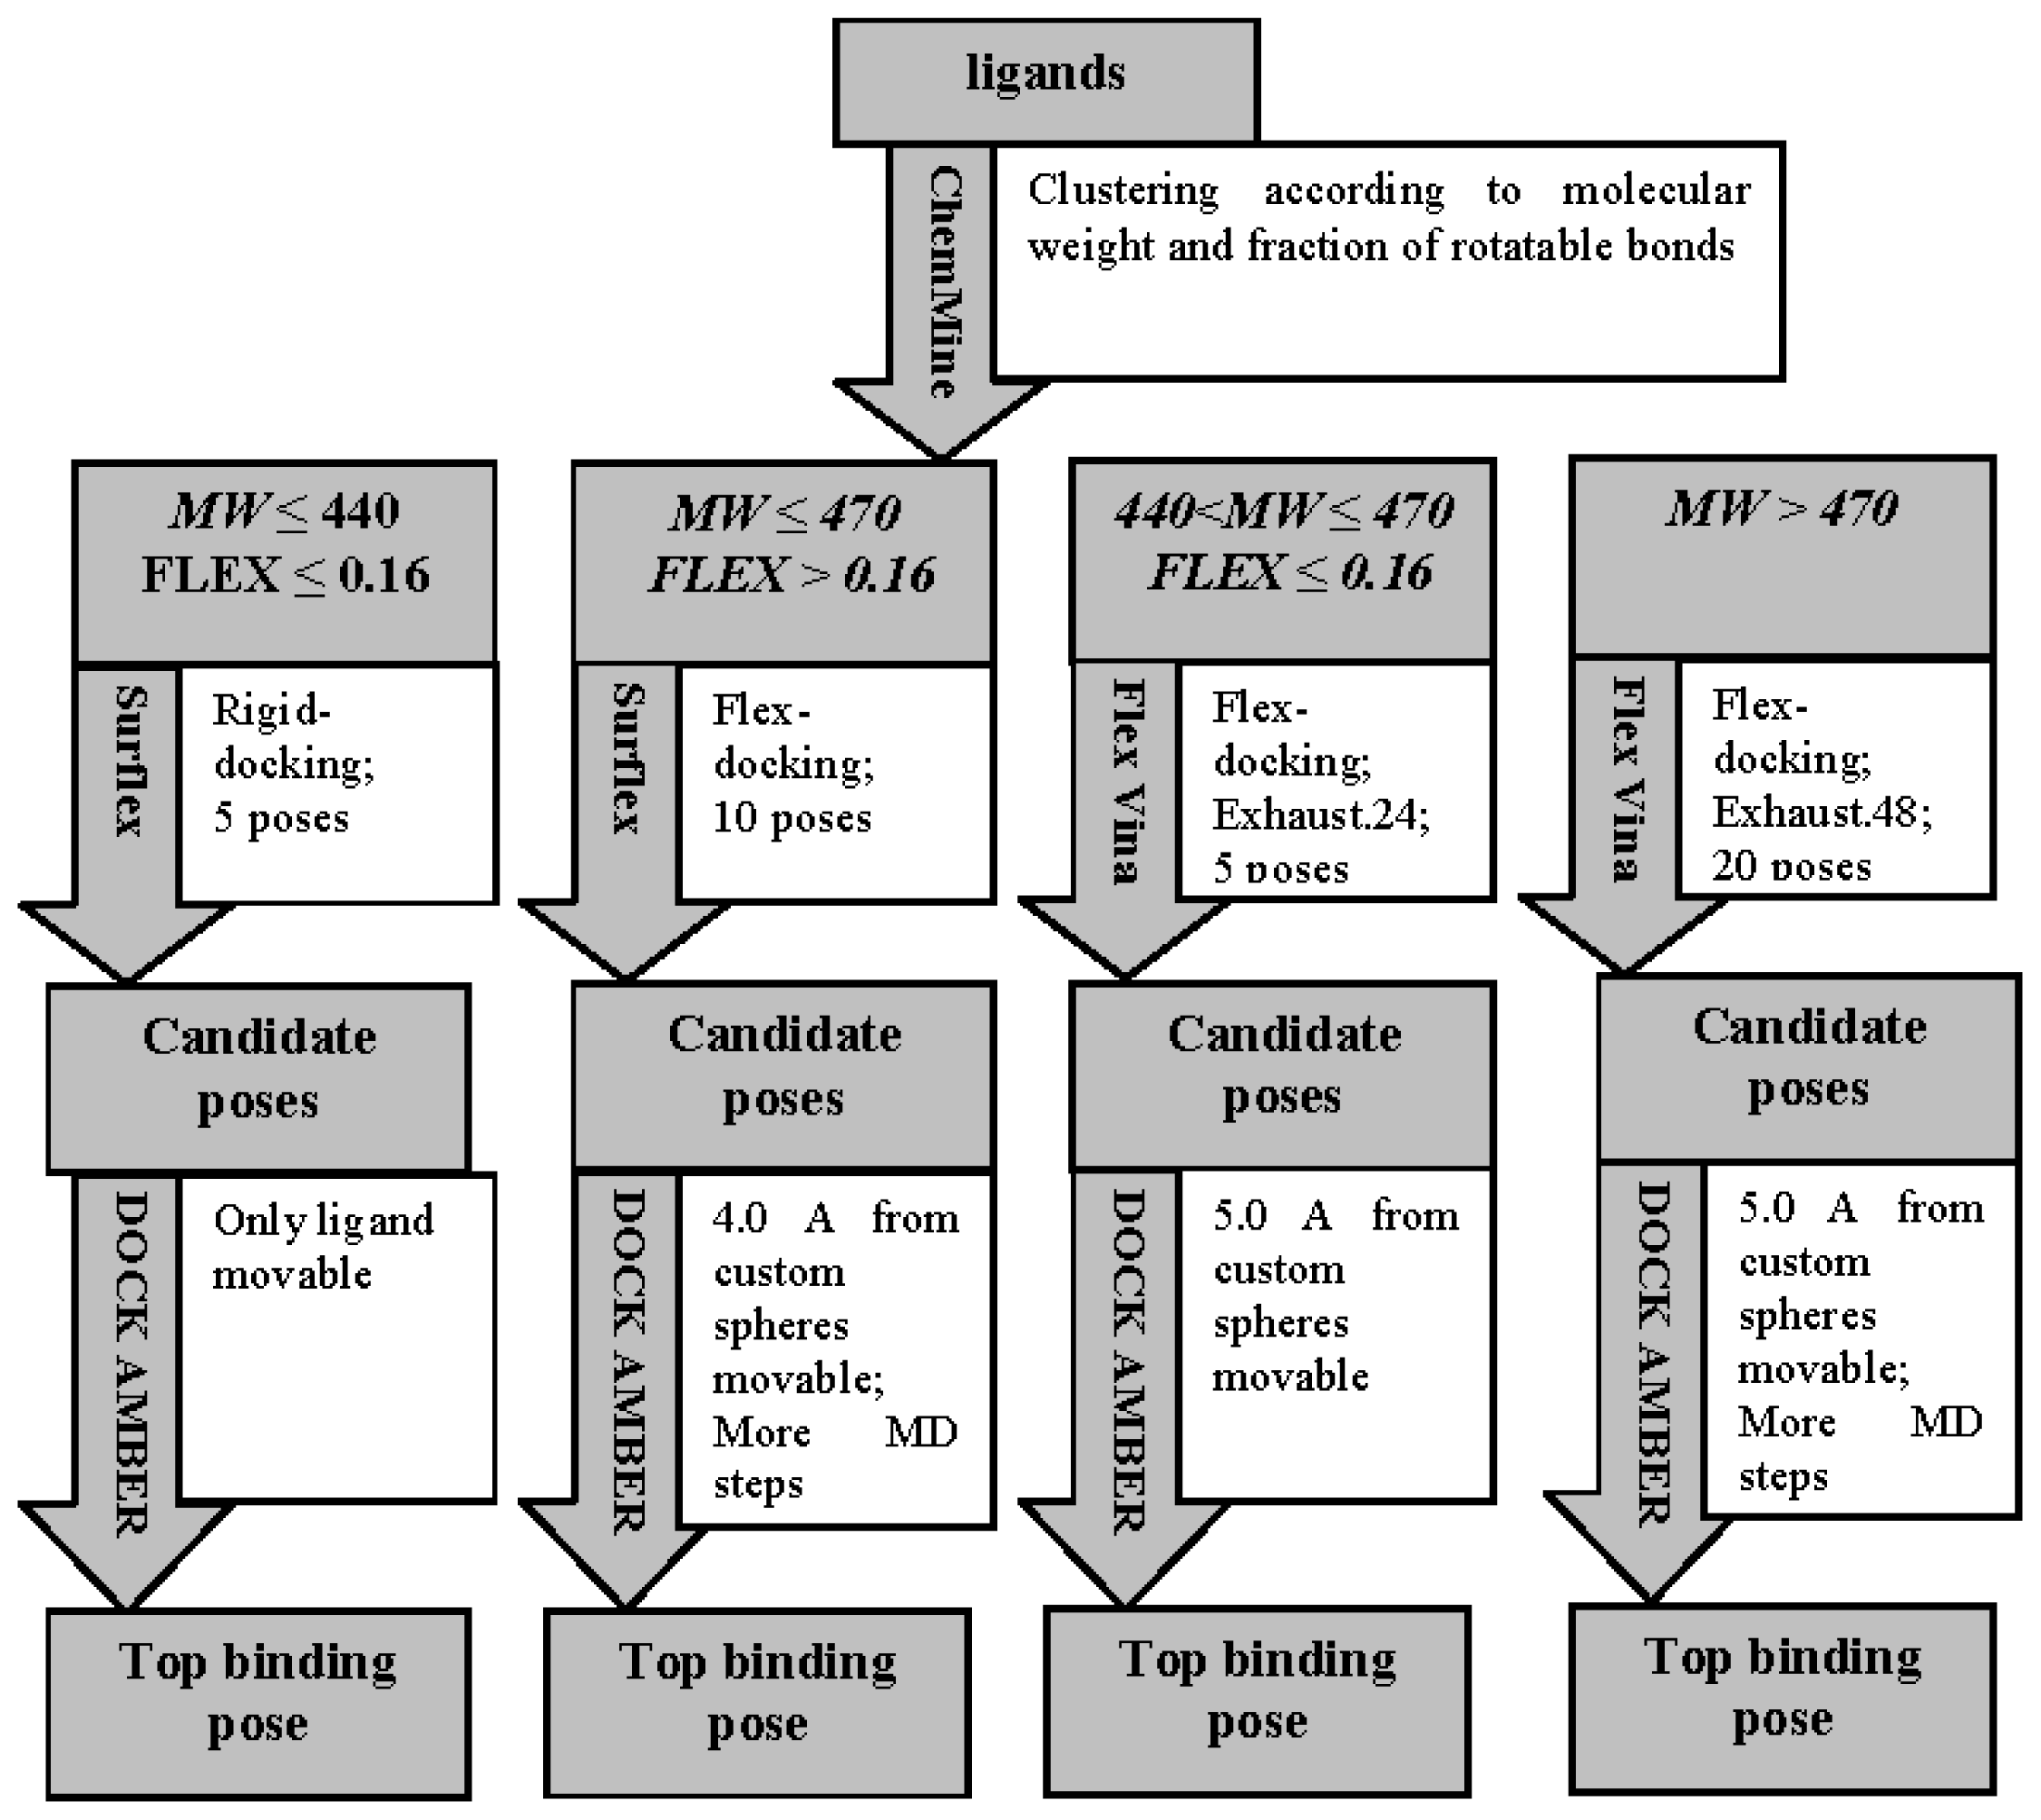
2.2. Binding Mode Predicting Workflow
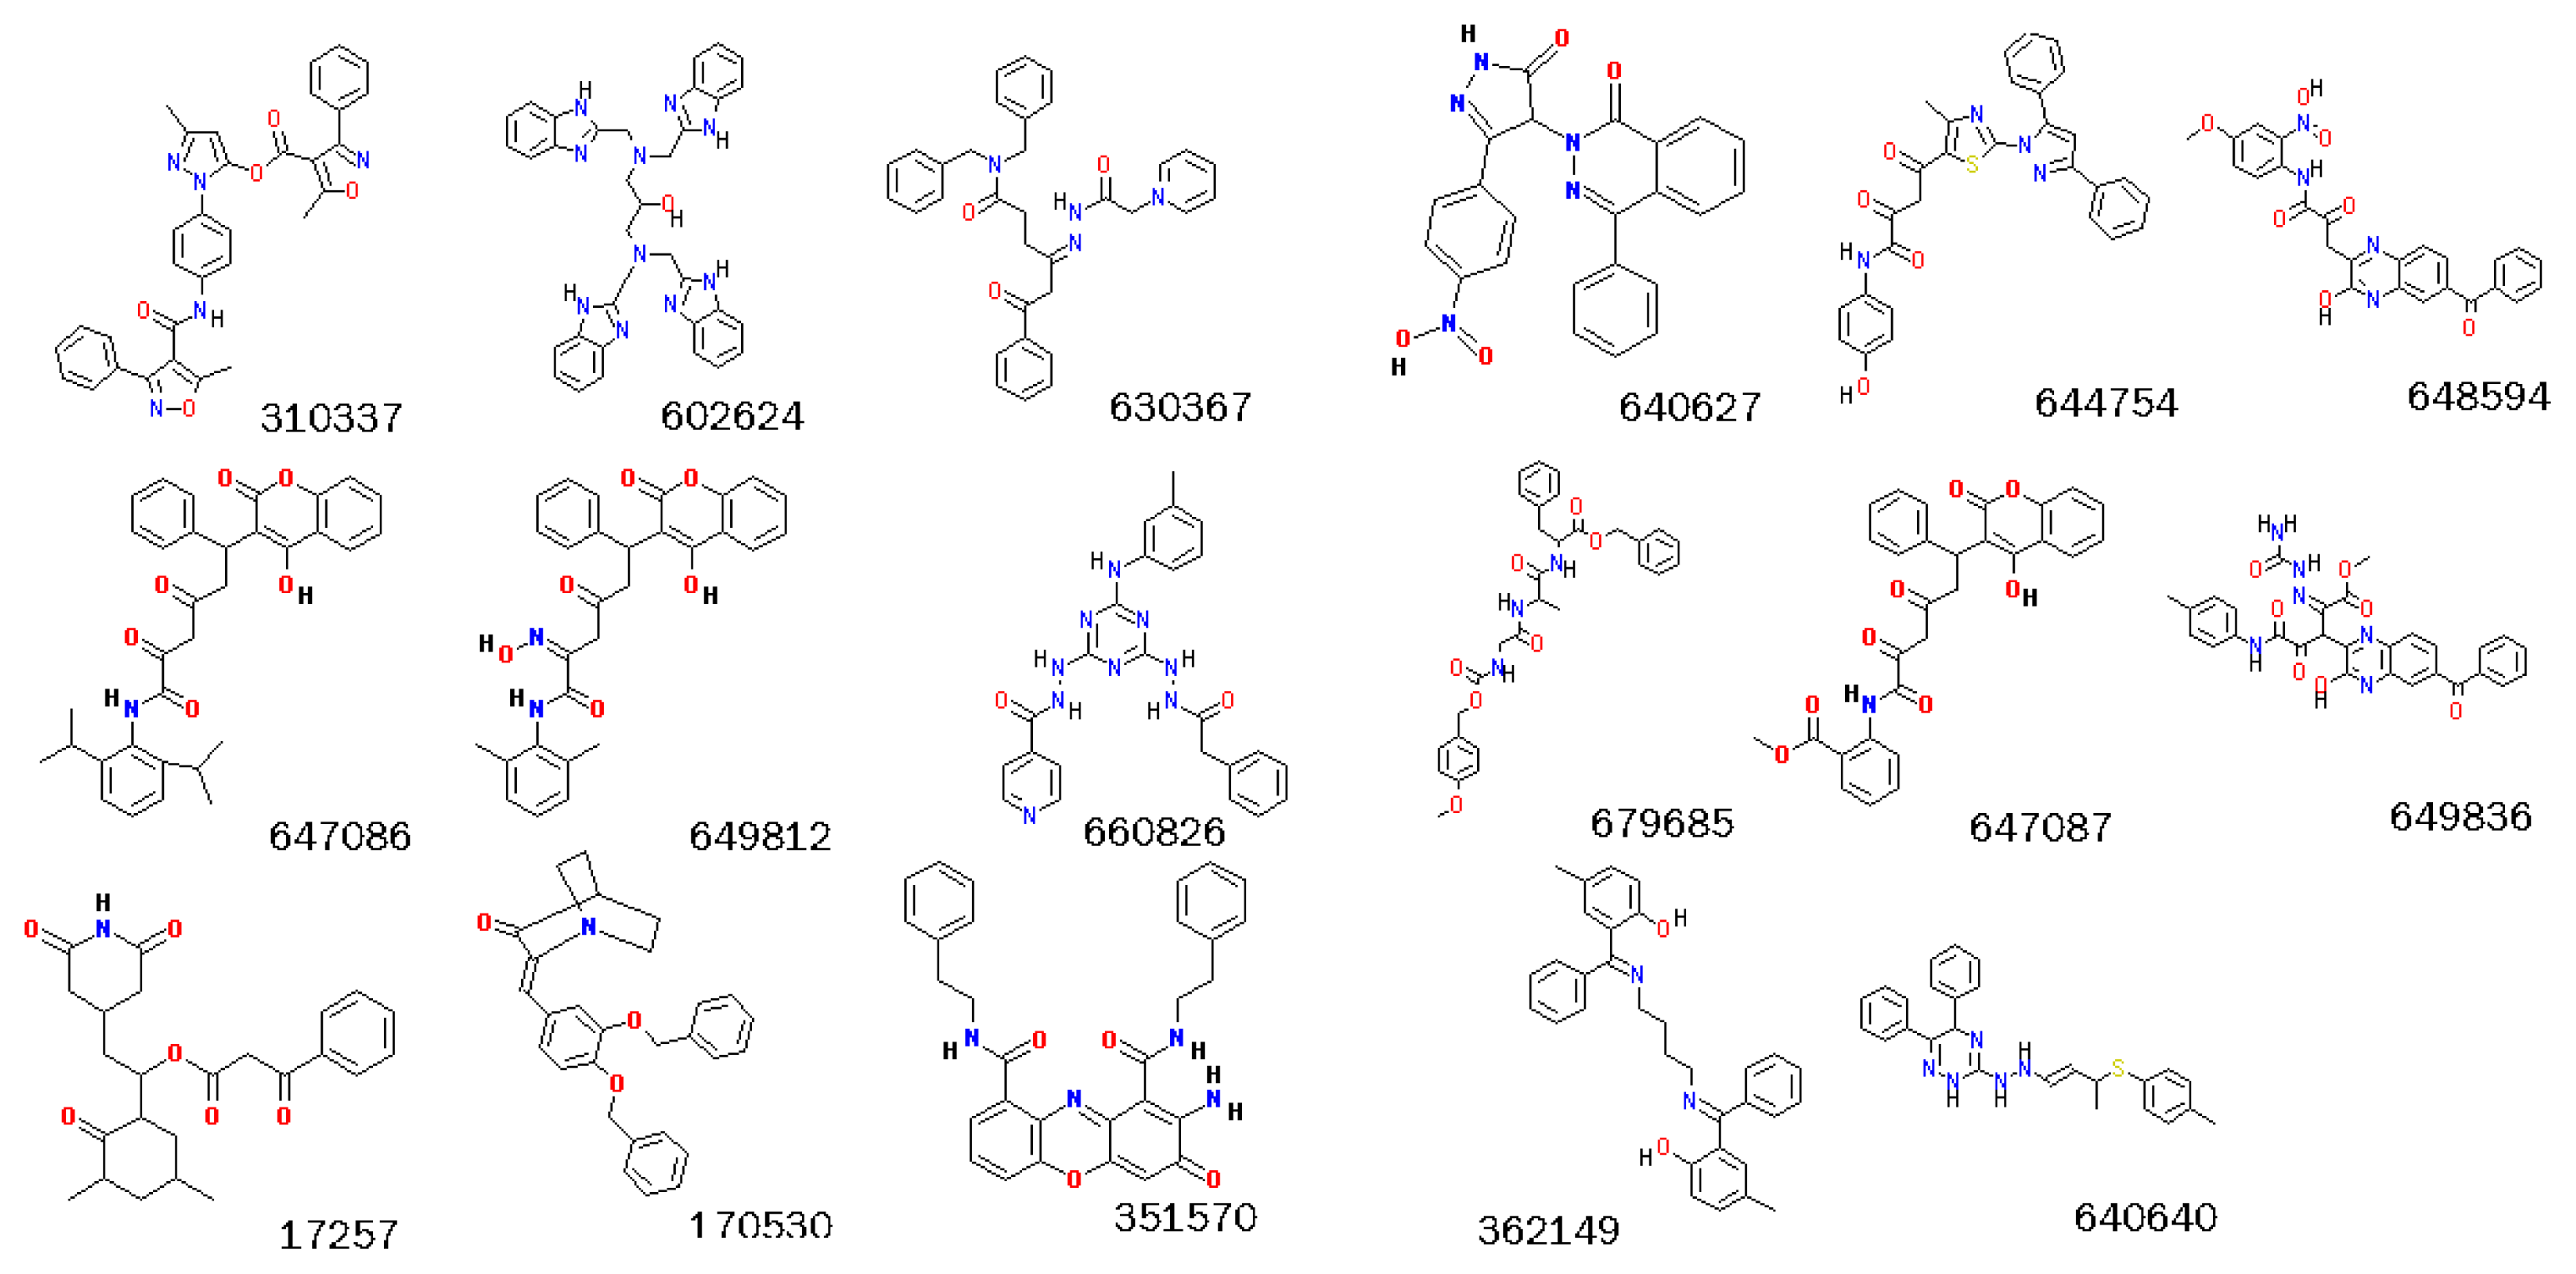
2.3. Screening Potential Specific Inhibitors of IGF1R from the NCI Database
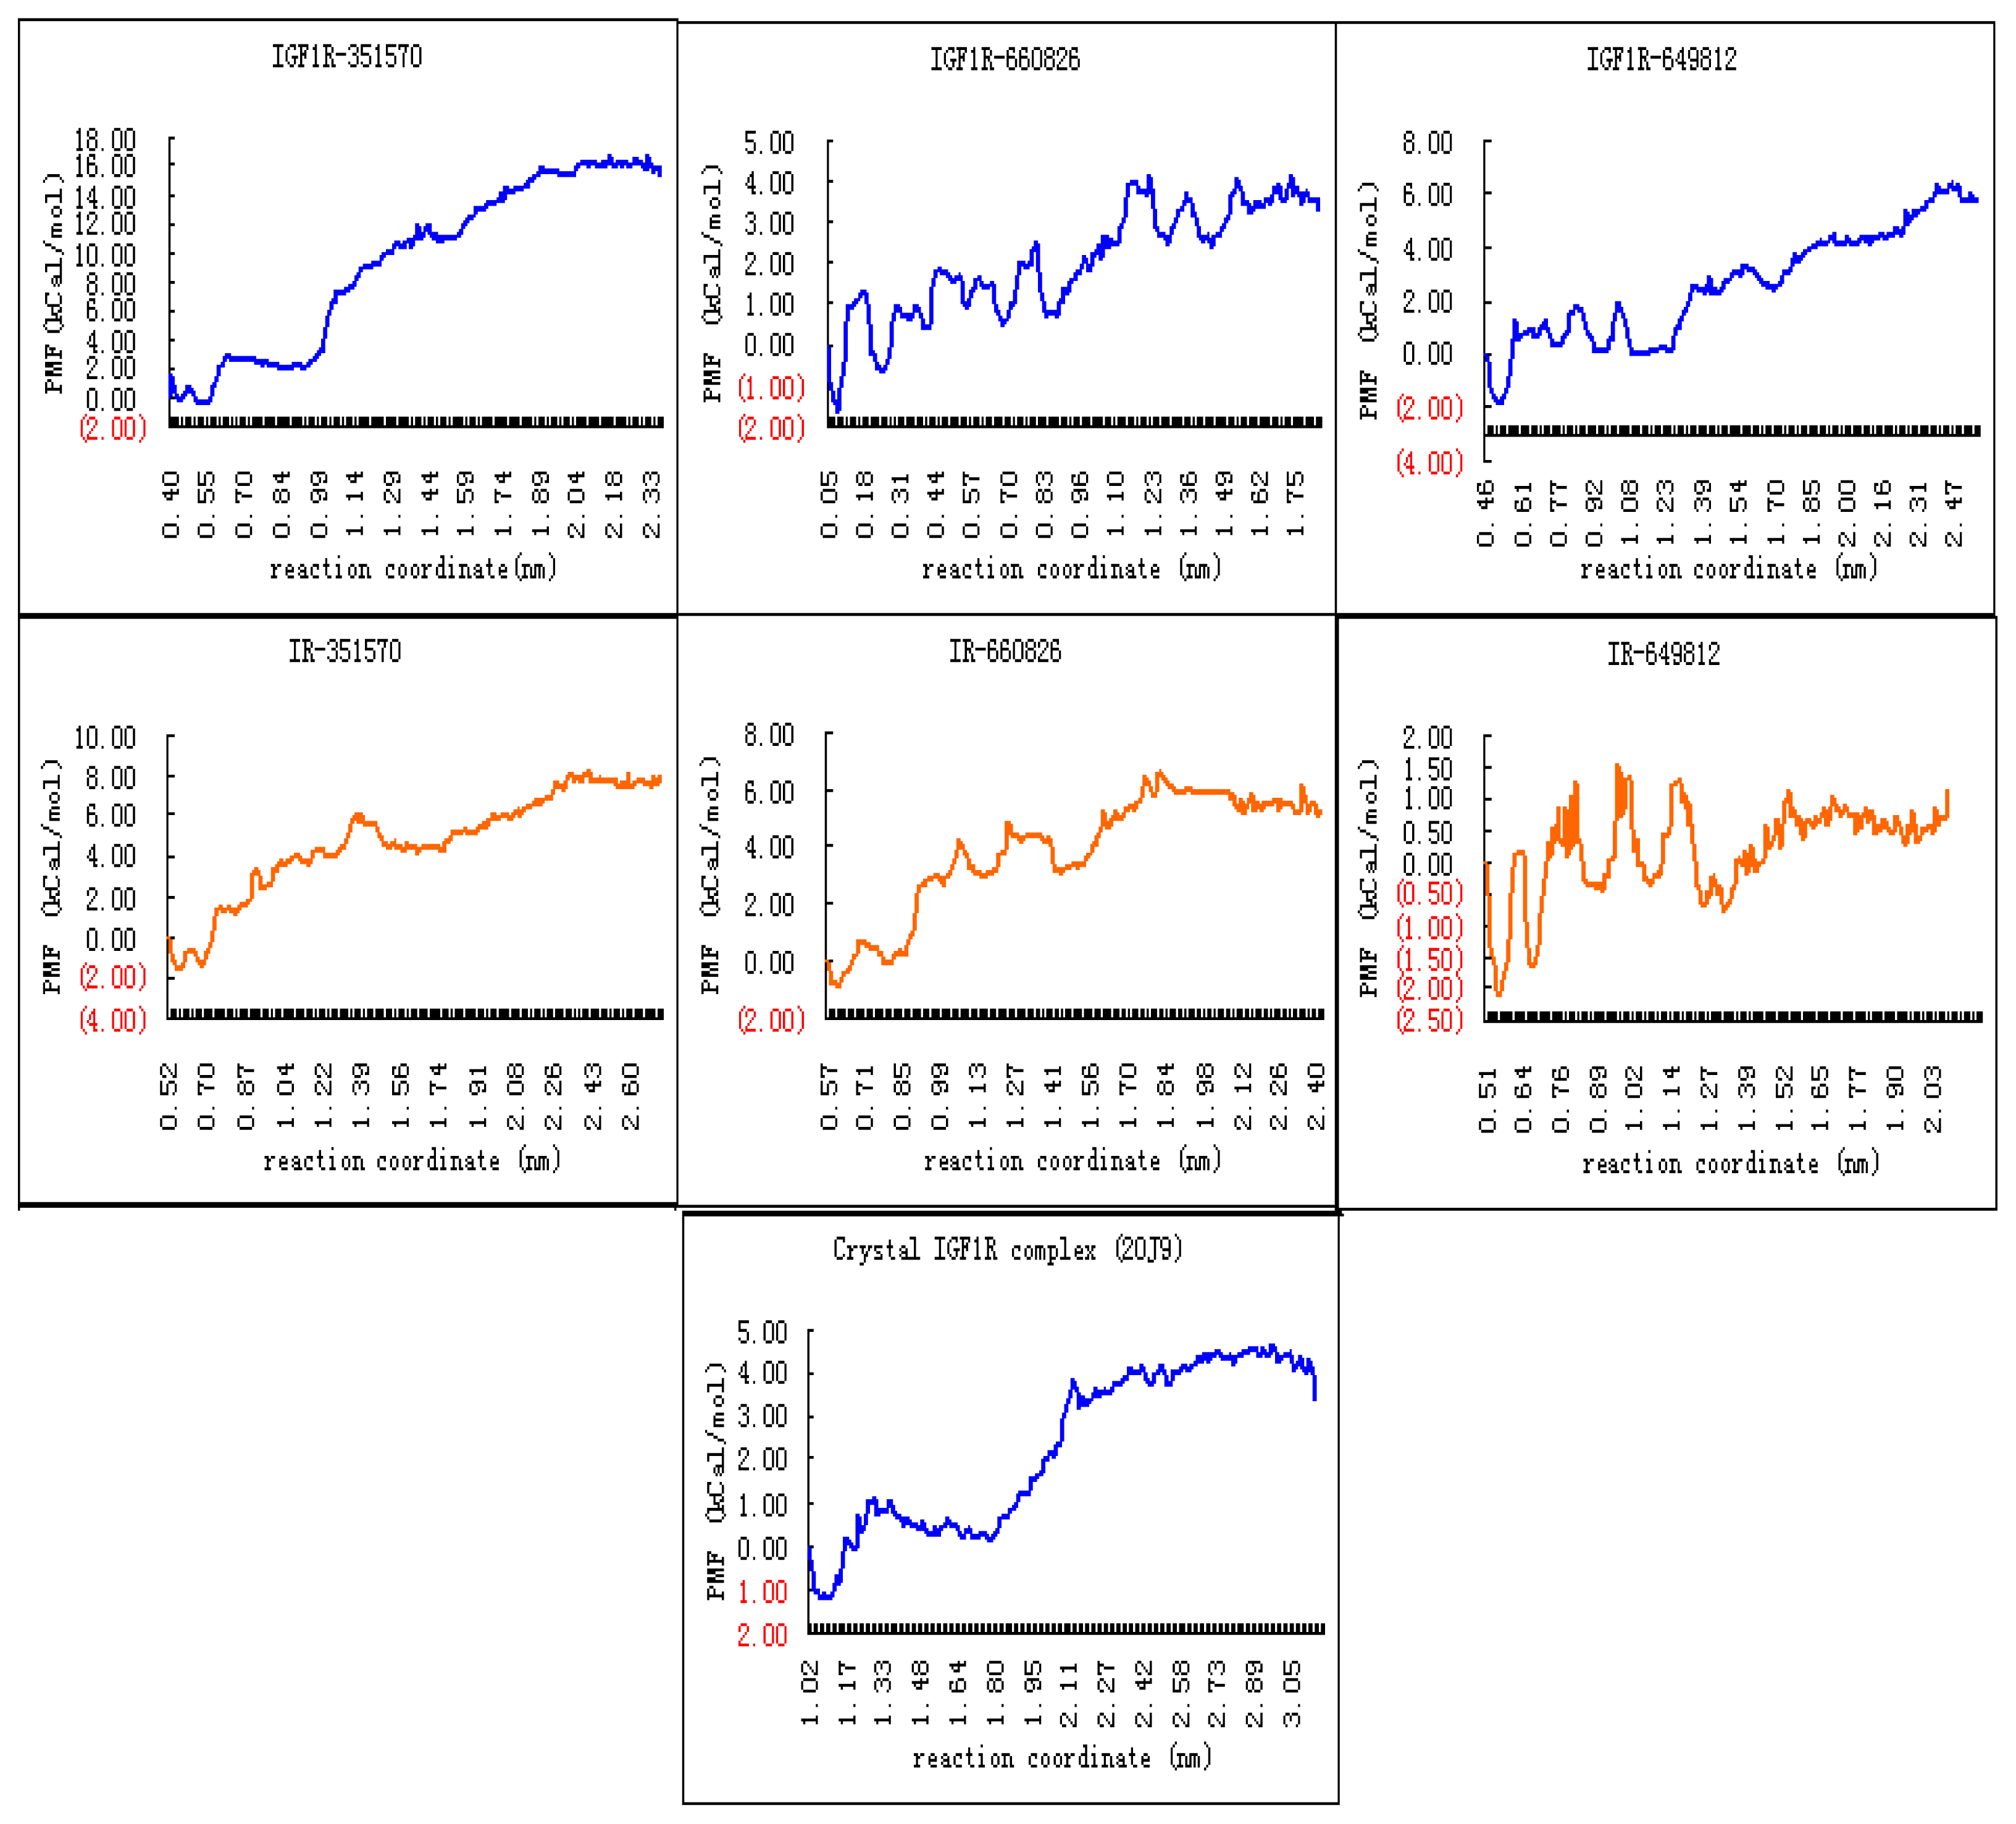
2.4. Binding Affinity Comparisons for Ligands of IGF1R and IR with PMF Calculations
3. Experimental Section
3.1. Experimental Data Set for Virtual Screening Benchmarking
3.2. Software for Virtual Screening Benchmarking
3.2.1. Surflex-Dock v2.5.1
3.2.2. Autodock v4.2.3
3.2.4. FRED v2.2.5
3.2.5. DOCK v6.5
3.3. Ligand-Binding Mode Prediction
3.3.1. Ligand Preparation and Clustering Analysis
3.3.2. Binding Mode Predictions
3.3.2.1. Ligands with small MW (MW ≤ 440) and low FLEX (FLEX ≤ 0.16)
3.3.2.2. Ligands with small MW (MW ≤ 470) and high FLEX (FLEX > 0.16)
3.3.2.3. Ligands with small MW (440 < MW ≤ 470) and low FLEX (FLEX < 0.16)
3.3.2.4. Ligands with large MW (MW > 470)
3.4. Virtual Screening of NCI Database
3.4.1. Preparations of Protein Receptors and Dockable Ligand Database
3.4.2. Identification of Potential Specific Inhibitors of IGF1R
3.5. PMF Calculations with GROMACS
4. Discussion
5. Conclusions
Supplementary Information
ijms-13-17185-s001.pdfAcknowledgments
- Conflict of InterestThe authors declare no conflict of interest.
References
- Adams, T.E.; Epa, V.C.; Garrett, T.P.; Ward, C.W. Structure and function of the type 1 insulin-like growth factor receptor. Cell Mol. Life Sci 2000, 57, 1050–1093. [Google Scholar]
- Li, R.; Pourpak, A.; Morris, S.W. Inhibition of the insulin-like growth factor-1 receptor (IGF1R) tyrosine kinase as a novel cancer therapy approach. J. Med. Chem 2009, 52, 4981–5004. [Google Scholar]
- Levitzki, A.; Gazit, A. Tyrosine kinase inhibition: An approach to drug development. Science 1995, 267, 1782–1788. [Google Scholar]
- Garcia-Echeverria, C.; Pearson, M.A.; Marti, A.; Meyer, T.; Mestan, J.; Zimmermann, J.; Gao, J.; Brueggen, J.; Capraro, H.G.; Cozens, R.; et al. In vivo antitumor activity of NVP-AEW541-A novel, potent, and selective inhibitor of the IGF-IR kinase. Cancer Cell 2004, 5, 231–239. [Google Scholar]
- Wittman, M.; Carboni, J.; Attar, R.; Balasubramanian, B.; Balimane, P.; Brassil, P.; Beaulieu, F.; Chang, C.; Clarke, W.; Dell, J.; et al. Discovery of a (1H-benzoimidazol-2-yl)-1H-pyridin-2-one (BMS-536924) inhibitor of insulin-like growth factor I receptor kinase with in vivo antitumor activity. J. Med. Chem 2005, 48, 5639–5643. [Google Scholar]
- Mulvihill, M.J.; Ji, Q.S.; Werner, D.; Beck, P.; Cesario, C.; Cooke, A.; Cox, M.; Crew, A.; Dong, H.; Feng, L.; et al. 1,3-Disubstituted-imidazo[1,5-α]pyrazines as insulin-like growth-factor-1 receptor (IGF-IR) inhibitors. Bioorg. Med. Chem. Lett 2007, 17, 1091–1097. [Google Scholar]
- Girnita, A.; Girnita, L.; del Prete, F.; Bartolazzi, A.; Larsson, O.; Axelson, M. Cyclolignans as inhibitors of the insulin-like growth factor-1 receptor and malignant cell growth. Cancer Res 2004, 64, 236–242. [Google Scholar]
- Blum, G.; Gazit, A.; Levitzki, A. Substrate competitive inhibitors of IGF-1 receptor kinase. Biochemistry 2000, 39, 15705–15712. [Google Scholar]
- Steiner, L.; Blum, G.; Friedmann, Y.; Levitzki, A. ATP non-competitive IGF-1 receptor kinase inhibitors as lead anti-neoplastic and anti-papilloma agents. Eur. J. Pharmacol 2007, 562, 1–11. [Google Scholar]
- Carlberg, M.; Dricu, A.; Blegen, H.; Wang, M.; Hjertman, M.; Zickert, P.; Hoog, A.; Larsson, O. Mevalonic acid is limiting for N-linked glycosylation and translocation of the insulin-like growth factor-1 receptor to the cell surface. Evidence for a new link between 3-hydroxy-3-methylglutaryl-coenzyme a reductase and cell growth. J. Biol. Chem 1996, 271, 17453–17462. [Google Scholar]
- Opgaard, O.S.; Wang, P.H. IGF-I is a matter of heart. Growth Horm. IGF Res 2005, 15, 89–94. [Google Scholar]
- Bell, I.M.; Stirdivant, S.M.; Ahern, J.; Culberson, J.C.; Darke, P.L.; Dinsmore, C.J.; Drakas, R.A.; Gallicchio, S.N.; Graham, S.L.; Heimbrook, D.C.; et al. Biochemical and structural characterization of a novel class of inhibitors of the type 1 insulin-like growth factor and insulin receptor kinases. Biochemistry 2005, 44, 9430–9440. [Google Scholar]
- Krug, M.; Erlenkamp, G.; Sippl, W.; Schachtele, C.; Totzke, F.; Hilgeroth, A. Discovery and selectivity-profiling of 4-benzylamino 1-aza-9-oxafluorene derivatives as lead structures for IGF-1R inhibitors. Bioorg. Med. Chem. Lett 2010, 20, 6915–6919. [Google Scholar]
- Liu, X.; Xie, H.; Luo, C.; Tong, L.; Wang, Y.; Peng, T.; Ding, J.; Jiang, H.; Li, H. Discovery and SAR of thiazolidine-2,4-dione analogues as insulin-like growth factor-1 receptor (IGF-1R) inhibitors via hierarchical virtual screening. J. Med. Chem 2010, 53, 2661–2665. [Google Scholar]
- Jamakhani, M.A. In-silico designing and docking analysis on insulin-like growth factor 1 receptor. J. Adv. Bioinforma. Appl. Res 2010, 1, 69–83. [Google Scholar]
- Huang, N.; Shoichet, B.K.; Irwin, J.J. Benchmarking sets for molecular docking. J. Med. Chem 2006, 49, 6789–6801. [Google Scholar]
- NCI/DTP. Available online: http://dtp.cancer.gov accessed on 13 December 2012.
- DesJarlais, R.L.; Dixon, J.S. A shape- and chemistry-based docking method and its use in the design of HIV-1 protease inhibitors. J. Comput. Aided Mol. Des 1994, 8, 231–242. [Google Scholar]
- Pham, T.A.; Jain, A.N. Customizing scoring functions for docking. J. Comput. Aided Mol. Des 2008, 22, 269–286. [Google Scholar]
- Sheridan, R.P. Alternative global goodness metrics and sensitivity analysis: Heuristics to check the robustness of conclusions from studies comparing virtual screening methods. J. Chem. Inf. Model 2008, 48, 426–433. [Google Scholar]
- Morris, G.M.; Huey, R.; Lindstrom, W.; Sanner, M.F.; Belew, R.K.; Goodsell, D.S.; Olson, A.J. AutoDock4 and AutoDockTools4: Automated docking with selective receptor flexibility. J. Comput. Chem 2009, 30, 2785–2791. [Google Scholar]
- Trott, O.; Olson, A.J. AutoDock Vina: Improving the speed and accuracy of docking with a new scoring function, efficient optimization, and multithreading. J. Comput. Chem 2010, 31, 455–461. [Google Scholar]
- Miteva, M.A.; Lee, W.H.; Montes, M.O.; Villoutreix, B.O. Fast structure-based virtual ligand screening combining FRED, DOCK, and Surflex. J. Med. Chem 2005, 48, 6012–6022. [Google Scholar]
- Sussman, J.L.; Lin, D.; Jiang, J.; Manning, N.O.; Prilusky, J.; Ritter, O.; Abola, E.E. Protein Data Bank (PDB): Database of three-dimensional structural information of biological macromolecules. Acta Crystallogr. D 1998, 54, 1078–1084. [Google Scholar]
- PyMol. Available online: http://www.pymol.org accessed on 13 December 2012.
- Warren, G.L.; Andrews, C.W.; Capelli, A.M.; Clarke, B.; LaLonde, J.; Lambert, M.H.; Lindvall, M.; Nevins, N.; Semus, S.F.; Senger, S.; et al. A critical assessment of docking programs and scoring functions. J. Med. Chem 2006, 49, 5912–5931. [Google Scholar]
- Favelyukis, S.; Till, J.H.; Hubbard, S.R.; Miller, W.T. Structure and autoregulation of the insulin-like growth factor 1 receptor kinase. Nat. Struct. Biol 2001, 8, 1058–1063. [Google Scholar]
- Parrizas, M.; Gazit, A.; Levitzki, A.; Wertheimer, E.; LeRoith, D. Specific inhibition of insulin-like growth factor-1 and insulin receptor tyrosine kinase activity and biological function by tyrphostins. Endocrinology 1997, 138, 1427–1433. [Google Scholar]
- Nemecek, C.; Metz, W.A.; Wentzler, S.; Ding, F.X.; Venot, C.; Souaille, C.; Dagallier, A.; Maignan, S.; Guilloteau, J.P.; Bernard, F.; et al. Design of potent IGF1-R inhibitors related to bis-azaindoles. Chem. Biol. Drug Des 2010, 76, 100–106. [Google Scholar]
- Mayer, S.C.; Banker, A.L.; Boschelli, F.; Di, L.; Johnson, M.; Kenny, C.H.; Krishnamurthy, G.; Kutterer, K.; Moy, F.; Petusky, S.; et al. Lead identification to generate isoquinolinedione inhibitors of insulin-like growth factor receptor (IGF-1R) for potential use in cancer treatment. Bioorg. Med. Chem. Lett 2008, 18, 3641–3645. [Google Scholar]
- Miller, L.M.; Mayer, S.C.; Berger, D.M.; Boschelli, D.H.; Boschelli, F.; Di, L.; Du, X.; Dutia, M.; Floyd, M.B.; Johnson, M.; et al. Lead identification to generate 3-cyanoquinoline inhibitors of insulin-like growth factor receptor (IGF-1R) for potential use in cancer treatment. Bioorg. Med. Chem. Lett 2009, 19, 62–66. [Google Scholar]
- Wittman, M.D.; Carboni, J.M.; Yang, Z.; Lee, F.Y.; Antman, M.; Attar, R.; Balimane, P.; Chang, C.; Chen, C.; Discenza, L.; et al. Discovery of a 2,4-disubstituted pyrrolo[1,2-f][1,2,4]triazine inhibitor (BMS-754807) of insulin-like growth factor receptor (IGF-1R) kinase in clinical development. J. Med. Chem 2009, 52, 7360–7363. [Google Scholar]
- Wu, J.; Li, W.; Craddock, B.P.; Foreman, K.W.; Mulvihill, M.J.; Ji, Q.S.; Miller, W.T.; Hubbard, S.R. Small-molecule inhibition and activation-loop trans-phosphorylation of the IGF1 receptor. EMBO. J 2008, 27, 1985–1994. [Google Scholar]
- Martin, M.W.; Newcomb, J.; Nunes, J.J.; McGowan, D.C.; Armistead, D.M.; Boucher, C.; Buchanan, J.L.; Buckner, W.; Chai, L.; Elbaum, D.; et al. Novel 2-aminopyrimidine carbamates as potent and orally active inhibitors of Lck: Synthesis, SAR, and in vivo antiinflammatory activity. J. Med. Chem 2006, 49, 4981–4991. [Google Scholar]
- Sampognaro, A.J.; Wittman, M.D.; Carboni, J.M.; Chang, C.; Greer, A.F.; Hurlburt, W.W.; Sack, J.S.; Vyas, D.M. Proline isosteres in a series of 2,4-disubstituted pyrrolo[1,2-f][1,2,4]triazine inhibitors of IGF-1R kinase and IR kinase. Bioorg. Med. Chem. Lett 2010, 20, 5027–5030. [Google Scholar]
- Baştuğ, T.; Chen, P.C.; Patra, S.M.; Kuyucak, S. Potential of mean force calculations of ligand binding to ion channels from Jarzynski’s equality and umbrella sampling. J. Chem. Phys 2008, 128, 155–104. [Google Scholar]
- Lemkul, J.A.; Bevan, D.R. Assessing the stability of Alzheimer’s amyloid protofibrils using molecular dynamics. J. Phys. Chem. B 2010, 114, 1652–1660. [Google Scholar]
- Irwin, J.J.; Shoichet, B.K. ZINC—A free database of commercially available compounds for virtual screening. J. Chem. Inf. Model 2005, 45, 177–182. [Google Scholar]
- Park, H.; Lee, J.; Lee, S. Critical assessment of the automated AutoDock as a new docking tool for virtual screening. Proteins 2006, 65, 549–554. [Google Scholar]
- van der Spoel, D.; Lindahl, E.; Hess, B.; Groenhof, G.; Mark, A.E.; Berendsen, H.J. GROMACS: Fast, flexible, and free. J. Comput. Chem 2005, 26, 1701–1718. [Google Scholar]
- Chen, X.; Lin, Y.; Liu, M.; Gilson, M.K. The Binding Database: Data management and interface design. Bioinformatics 2002, 18, 130–139. [Google Scholar]
- Liu, T.; Lin, Y.; Wen, X.; Jorissen, R.N.; Gilson, M.K. BindingDB: A web-accessible database of experimentally determined protein-ligand binding affinities. Nucleic Acids Res 2007, 35, D198–D201. [Google Scholar]
- OPENEYE. Available online: http://www.eyesopen.com accessed on 13 December 2012.
- Hawkins, P.C.; Skillman, A.G.; Warren, G.L.; Ellingson, B.A.; Stahl, M.T. Conformer generation with OMEGA: Algorithm and validation using high quality structures from the Protein Databank and Cambridge Structural Database. J. Chem. Inf. Model 2010, 50, 572–584. [Google Scholar]
- Sanner, M.F.; Olson, A.J.; Spehner, J.C. Reduced surface: An efficient way to compute molecular surfaces. Biopolymers 1996, 38, 305–320. [Google Scholar]
- DesJarlais, R.L.; Sheridan, R.P.; Seibel, G.L.; Dixon, J.S.; Kuntz, I.D.; Venkataraghavan, R. Using shape complementarity as an initial screen in designing ligands for a receptor binding site of known three-dimensional structure. J. Med. Chem 1988, 31, 722–729. [Google Scholar]
- Pettersen, E.F.; Goddard, T.D.; Huang, C.C.; Couch, G.S.; Greenblatt, D.M.; Meng, E.C.; Ferrin, T.E. UCSF Chimera—A visualization system for exploratory research and analysis. J. Comput. Chem 2004, 25, 1605–1612. [Google Scholar]
- Makino, S.; Kuntz, I.D. Automated flexible ligand docking method and its application for database search. J. Comput. Chem 1997, 18, 1812–1825. [Google Scholar]
- Backman, T.W.; Cao, Y.; Girke, T. ChemMine tools: An online service for analyzing and clustering small molecules. Nucleic Acids Res 2011, 39, W486–W491. [Google Scholar]
- Wang, J.; Wolf, R.M.; Caldwell, J.W.; Kollman, P.A.; Case, D.A. Development and testing of a general amber force field. J. Comput. Chem 2004, 25, 1157–1174. [Google Scholar]
- Graves, A.P.; Shivakumar, D.M.; Boyce, S.E.; Jacobson, M.P.; Case, D.A.; Shoichet, B.K. Rescoring docking hit lists for model cavity sites: Predictions and experimental testing. J. Mol. Biol 2008, 377, 914–934. [Google Scholar]
- ProFit. Available online: http://www.bioinf.org.uk/software/profit accessed on 13 December 2012.
- Humphrey, W.; Dalke, A.; Schulten, K. VMD: Visual molecular dynamics. J. Mol. Graph 1996, 14, 33–38. [Google Scholar]
- AMBER Tools 12. Available online: http://www.ambermd.org/#AmberTools accessed on 13 December 2012.
- Bartels, C.M.K. Probability distributions for complex systems: Adaptive umbrella samplings of the potential energy. J. Phys. Chem. B 1998, 102, 865–880. [Google Scholar]
- Kumar, S.D.; Bouzida, R.H.; Swendsen, P.A.; Kollman, and; Rosenberg, J.M. The weighted histogram analysis method for free-energy calculations on biomolecules. J. Comput. Chem. 1992, 13, 1011–1021. [Google Scholar]
- Hub, J.S.; Groot, B.L.D.; Spoel, D.V. g_wham—A free weighted histogram analysis implementation including robust error and autocorrelation estimates. J. Chem. Theory Comput 2010, 6, 3713–3720. [Google Scholar]
- Sauton, N.; Lagorce, D.; Villoutreix, B.O.; Miteva, M.A. MS-DOCK: Accurate multiple conformation generator and rigid docking protocol for multi-step virtual ligand screening. BMC Bioinforma 2008, 9, 184. [Google Scholar]


| Software/time | Per (s) | Total (s) | Days (d) |
|---|---|---|---|
| Fred | 0.415 | 41500 | 0.480 |
| Surflex | 7.461 | 746100 | 8.635417 |
| Dock | 8.474 | 847400 | 9.80787 |
| Autodock | 94.787 | 9478700 | 109.7072 |
| Vina | 33.497 | 3349700 | 38.76968 |
| PDB.ID | Molecular weight | Fraction of rotatable bonds | RMSD value (ångstroms) |
|---|---|---|---|
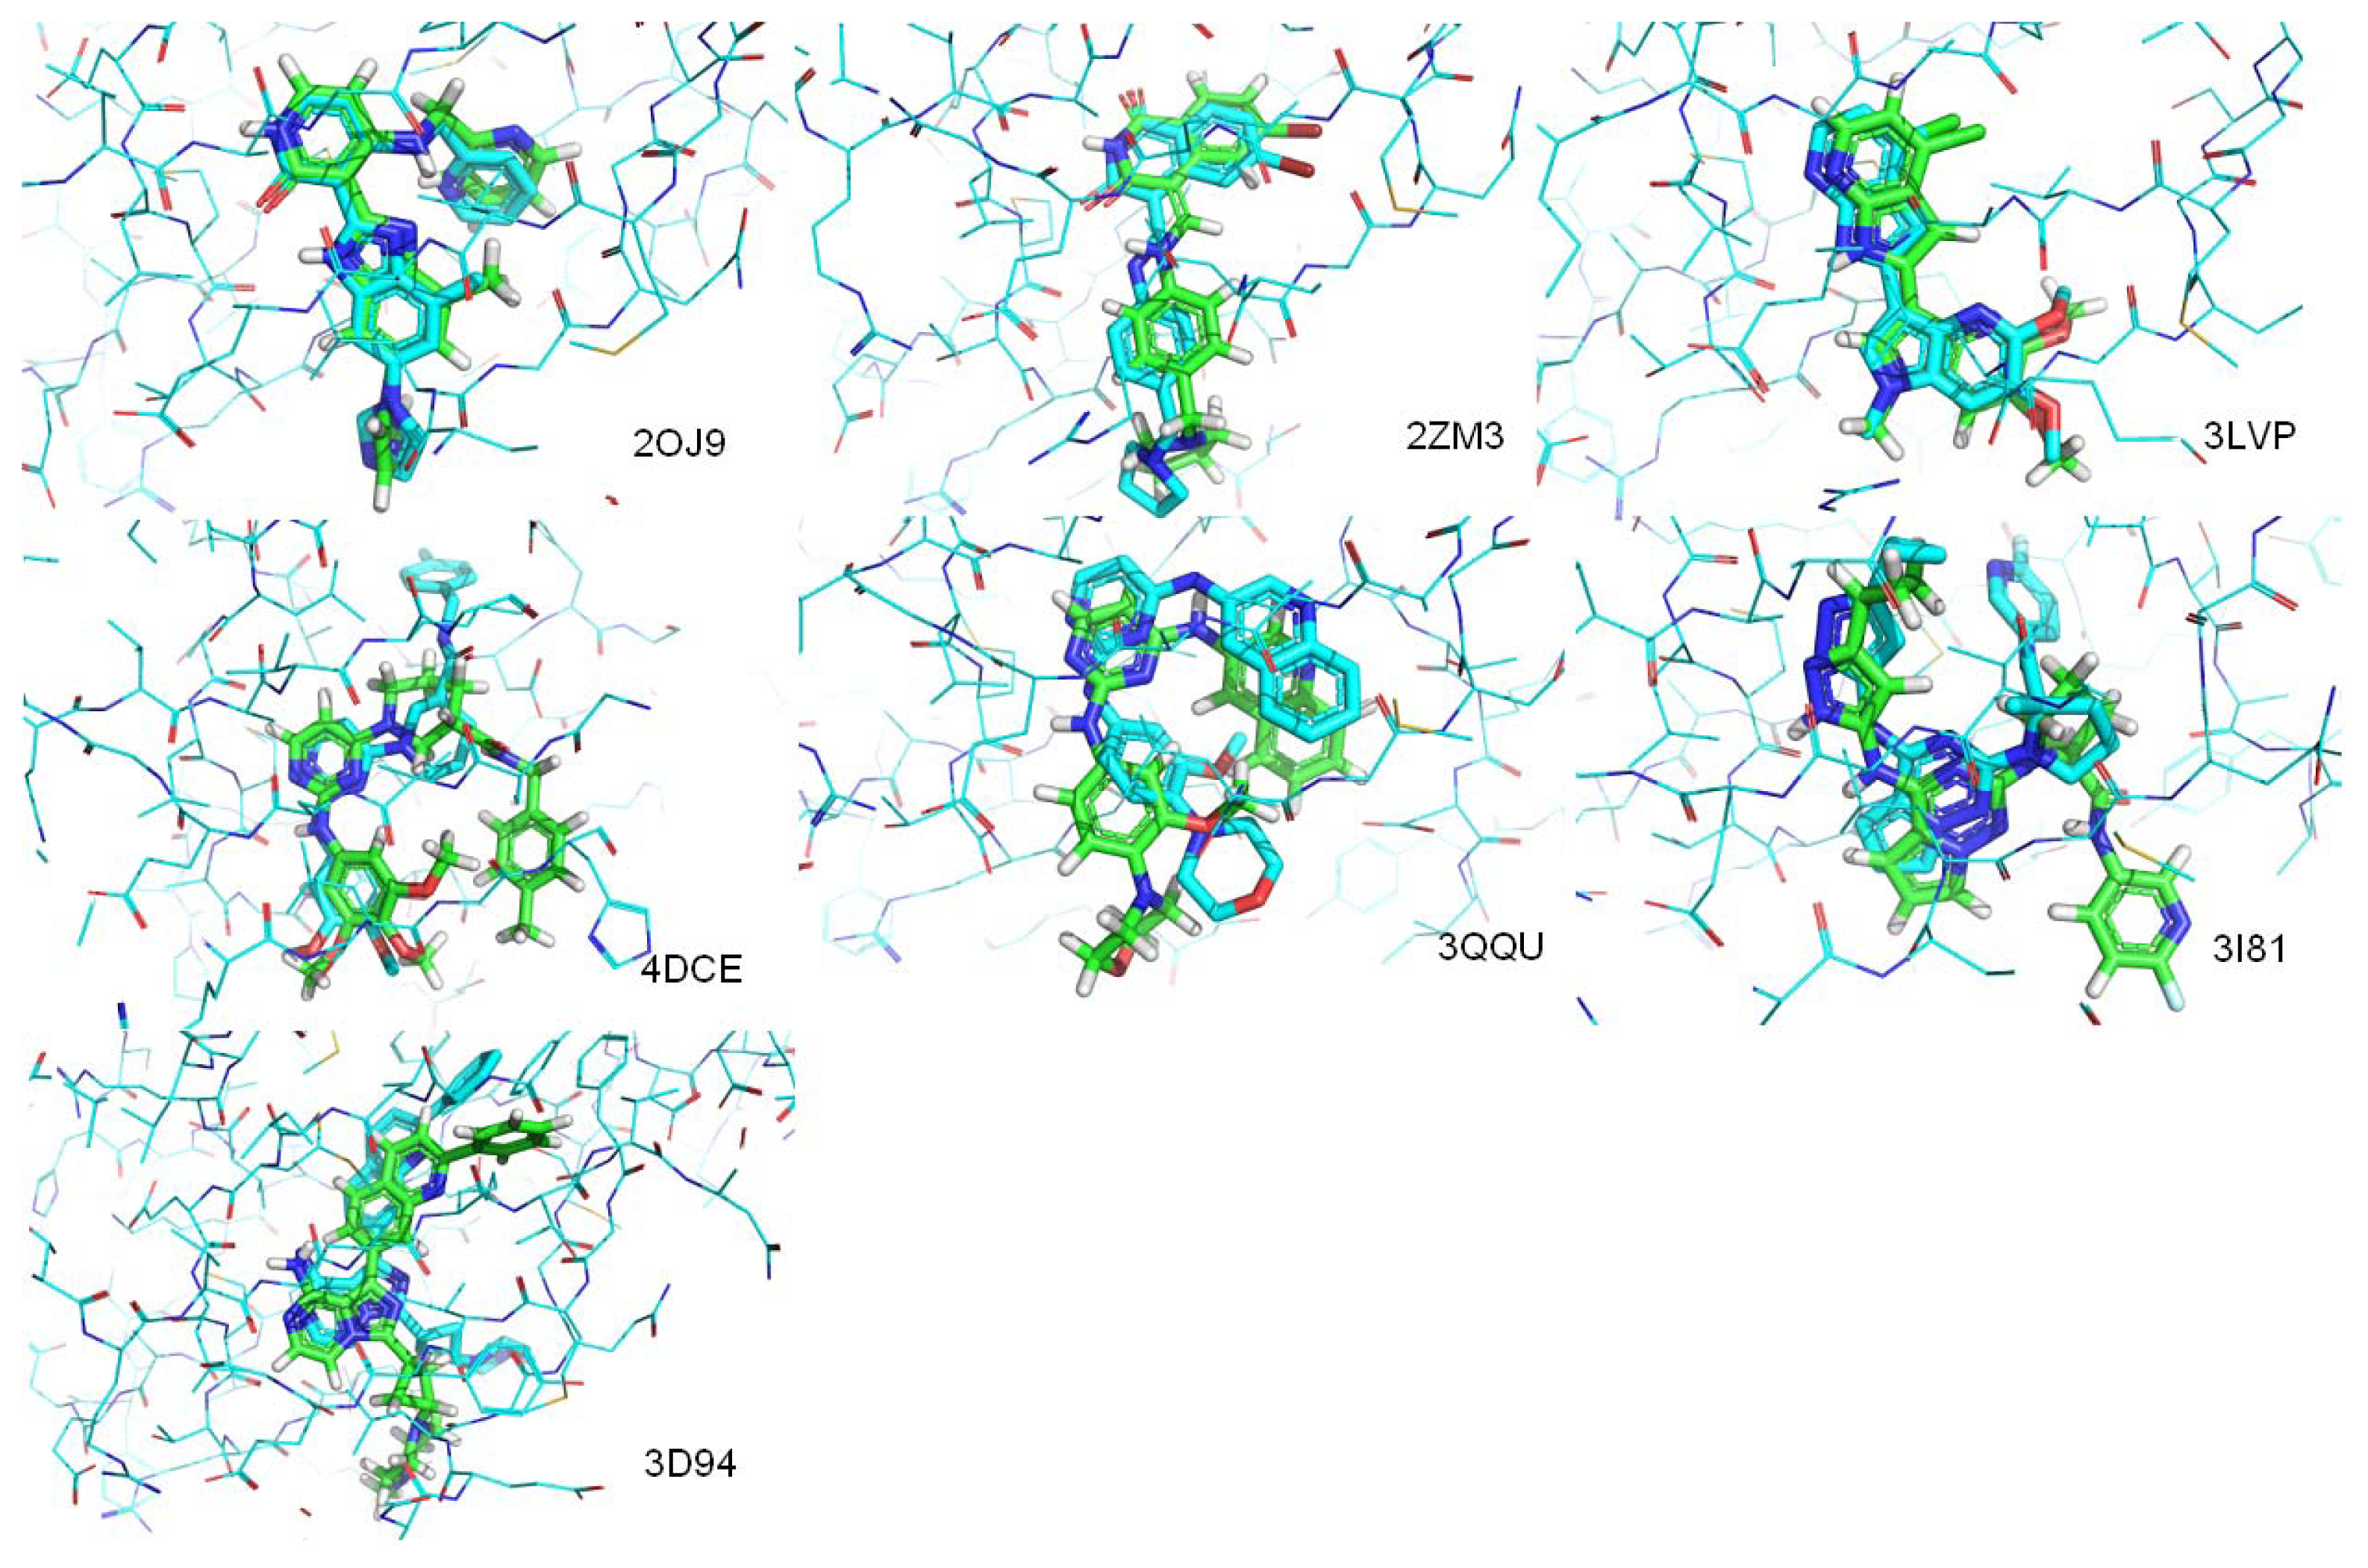
| 2OJ9 | 380 | 0.147 | 1.104 |
| 2ZM3 | 406 | 0.133 | 1.250 |
| 3LVP | 329 | 0.111 | 0.218 |
| 3QQU | 404 | 0.167 | 1.866 |
| 3I81 | 438 | 0.179 | 3.836 |
| 4DCE | 459 | 0.256 | 4.071 |
| 3D94 | 460 | 0.093 | 1.512 |
| 3O23 | 448 | 0.111 | Mismatch |
| 3F5P | 524 | 0.293 | Mismatch |
| PDB.ID | Molecular weight | Fraction of rotatable bonds | RMSD value (ångstroms) |
|---|---|---|---|
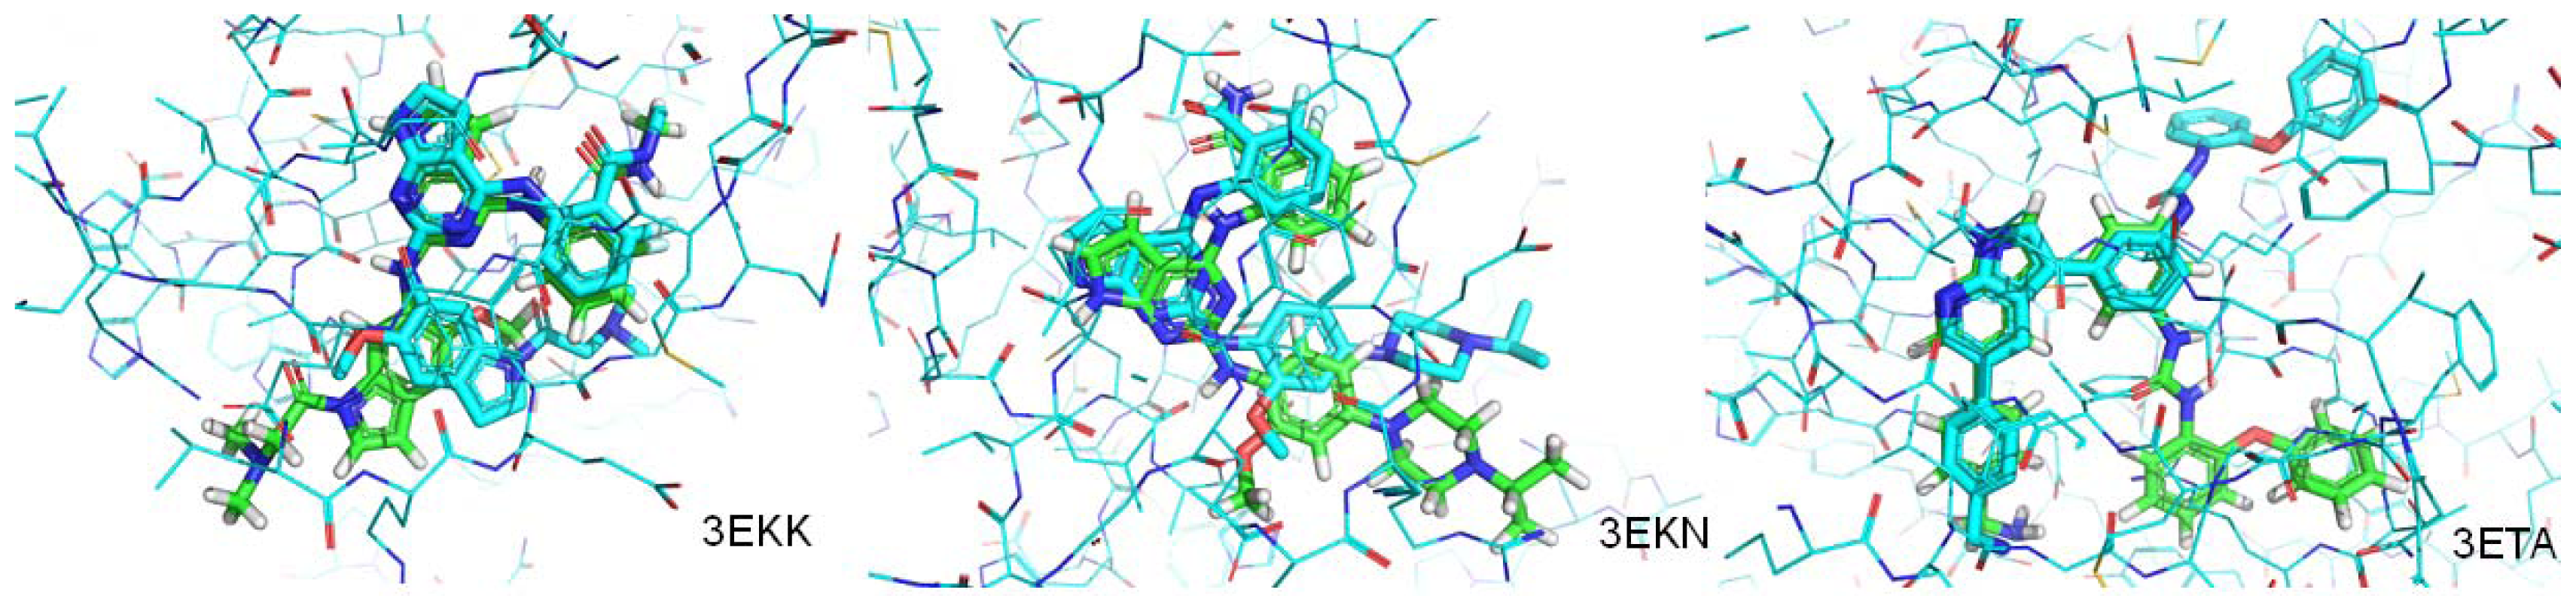
| 3EKN | 443 | 0.190 | 1.207 |
| 3ETA | 499 | 0.200 | 3.693 |
| 3EKK | 504 | 0.233 | 4.065 |
| 2Z8C | 358 | 0.233 | Mismatch |
| Receptor name | Compound ID | ΔGbind (kCal mol−1) |
|---|---|---|
| IGF1R | 351570 | −13.5 |
| 660826 | −3.09 | |
| 649812 | −5.92 | |
| 2OJ9 | −4.38 | |
| IR | 351570 | −7.2 |
| 660826 | −5.39 | |
| 649812 | −0.60 |
© 2012 by the authors; licensee Molecular Diversity Preservation International, Basel, Switzerland. This article is an open-access article distributed under the terms and conditions of the Creative Commons Attribution license (http://creativecommons.org/licenses/by/3.0/).
Share and Cite
Fan, C.; Huang, Y.-X.; Bao, Y.-L.; Sun, L.-G.; Wu, Y.; Yu, C.-L.; Zhang, Y.; Song, Z.-B.; Zheng, L.-H.; Sun, Y.; et al. Virtual Screening of Specific Insulin-Like Growth Factor 1 Receptor (IGF1R) Inhibitors from the National Cancer Institute (NCI) Molecular Database. Int. J. Mol. Sci. 2012, 13, 17185-17209. https://doi.org/10.3390/ijms131217185
Fan C, Huang Y-X, Bao Y-L, Sun L-G, Wu Y, Yu C-L, Zhang Y, Song Z-B, Zheng L-H, Sun Y, et al. Virtual Screening of Specific Insulin-Like Growth Factor 1 Receptor (IGF1R) Inhibitors from the National Cancer Institute (NCI) Molecular Database. International Journal of Molecular Sciences. 2012; 13(12):17185-17209. https://doi.org/10.3390/ijms131217185
Chicago/Turabian StyleFan, Cong, Yan-Xin Huang, Yong-Li Bao, Lu-Guo Sun, Yin Wu, Chun-Lei Yu, Yu Zhang, Zhen-Bo Song, Li-Hua Zheng, Ying Sun, and et al. 2012. "Virtual Screening of Specific Insulin-Like Growth Factor 1 Receptor (IGF1R) Inhibitors from the National Cancer Institute (NCI) Molecular Database" International Journal of Molecular Sciences 13, no. 12: 17185-17209. https://doi.org/10.3390/ijms131217185