Article

Expression Analysis of MYC Genes from Tamarix hispida in Response to Different Abiotic Stresses

State Key Laboratory of Tree Genetics and Breeding, Northeast Forestry University, 26 Hexing Road, 150040 Harbin, China
*
Author to whom correspondence should be addressed.
Int. J. Mol. Sci. 2012, 13(2), 1300-1313; https://doi.org/10.3390/ijms13021300
Submission received: 6 December 2011 / Revised: 11 January 2012 / Accepted: 12 January 2012 / Published: 25 January 2012
(This article belongs to the Special Issue Advances in Molecular Plant Biology)

Abstract

:
The MYC genes are a group of transcription factors containing both bHLH and ZIP motifs that play important roles in the regulation of abscisic acid (ABA)-responsive genes. In the present study, to investigate the roles of MYC genes under NaCl, osmotic and ABA stress conditions, nine MYC genes were cloned from Tamarix hispida. Real-time reverse-transcriptase (RT)-PCR showed that all nine MYC genes were expressed in root, stem and leaf tissues, but that the levels of the transcripts of these genes in the various tissues differed notably. The MYC genes were highly induced in the roots in response to ABA, NaCl and osmotic stresses after 3 h; however, in the stem and leaf tissues, MYC genes were highly induced only when exposed to these stresses for 6 h. In addition, most of these MYC genes were highly expressed in roots in comparison with stems and leaves. Furthermore, the MYC genes were more highly induced in roots than in stem and leaf tissues, indicating that these genes may play roles in stress responses mainly in the roots rather than the stems and leaves. The results of this present study suggest that MYCs are involved in salt and osmotic stress tolerances and are controlled by the ABA signal transduction pathway.

1. Introduction

MYCs (myelocytomatosis proteins) are a group of transcription factors found in plants and animals [1]. MYC2, which is allelic to Jasmonate insensitive 1 (JAI1/JIN1), was firstly identified from a mutant screen for reduced sensitivity to jasmonic acid (JA) [2]. Previous studies have shown that MYC2 plays an important role in the regulation of JA- and abscisic acid (ABA)-responsive genes [36]. MYC family members belong to a group of bHLH proteins that contain both bHLH and ZIP motifs [7]. The presence of both ZIP and bHLH motifs in a protein determine its specificity and affinity for sequence-specific DNA binding and can facilitate the formation of various hetero- and homodimers [8]. Through the interaction of their two amphipathic helices, MYCs can form homodimers or heterodimers [1,9]. Many MYC transcription factors bind to a consensus hexanucleotide sequence called the E-box (CANNTG) [10]. E-boxes can be divided into several types based on the identity of the two central bases in the sequence, and these include the G-box sequence “CACGTG” and the G-box-related motif “CACATG” [1113]. The MYC2 transcription factor can bind with both the G-box-related motif [14,15] and the G-box sequence [16]. MYCs are involved in various processes, including the biosynthesis of anthocyanins, Tryptophan (Trp), proanthocyanidins and flavonoids; controlling the development of the trichome, carpel margin tissues, embryonic epidermis and root hairs; regulating floral initiation, the formation of the ER body, seed germination, stomatal differentiation, and endosperm breakdown; certain roles in the signaling pathways of jasmonate, ABA, phytochrome-mediated light, and gibberellin; and finally, mediating tolerances to biotic and abiotic stresses [1721]. Gene expression analysis is an important way to elucidate the biological functions of certain genes. The genes responding to abiotic stresses are most likely to be involved in stress responses and tolerance. MYC transcription factors are involved in many biological processes, including important roles in the regulation of abiotic stress tolerance. However, there are few reports concerning the expression patterns of MYCs in response to different abiotic stresses.
Salt and drought are common adverse environmental factors and these have greatest impacts on plant productivity. Therefore, there is interest in selectively breeding plants that are tolerant to high salt and drought stresses. Studying plant tolerance to salty and arid soil at the molecular level may provide valuable information for improving salt and drought tolerances of plants by introducing targeted molecular breeding methods. Tamarisk (Tamarix hispida) is a shrub that is well adapted to arid, soda or saline soils. The ability of T. hispida to thrive in arid and saline soils indicates that this species has molecular and physiological systems that enable it to adapt and tolerate these stressful conditions, making it a desirable species for investigations into salt and drought tolerance in plants.
In this present study, nine unique MYC genes were cloned from T. hispida, and phylogenetic analysis was performed to uncover the genetic relationships between these genes. To elucidate the biological functions of the MYCs in responding to abiotic stresses, time-course expression of each gene was assessed in root, stem and leaf tissues during exposure to salt and drought stresses and the exogenous application of ABA. This study provides further insights into the roles of MYCs in abiotic stress tolerance in plants.

2. Results

2.1. Identification and Bioinformatics Analysis of MYC Genes from T. hispida

In total, nine unique MYC genes were identified from transcriptomes of T. hispida. These genes were designated as ThMYC1 to ThMYC9, and these sequences have been deposited in the GenBank under accession numbers JN166785 to JN166790 and JN166792 to JN166794 (Table 1).
Among the nine unique ThMYCs identified, five had full open reading frames (ORFs) that encoded deduced polypeptides of 160 to 492 amino acids in length, with predicted MWs of 17.89 to 55.06 kDa and pI values of 4.77 to 7.67 (Table 2). The phylogenetic relationships between these ThMYCs were deduced from aligned sequences. The phylogenetic tree showed that these nine ThMYCs formed into three main subgroups: subgroup 1 contained ThMYC1, ThMYC9, ThMYC2, ThMYC6 and ThMYC5; subgroup 2 contained ThMYC3, ThMYC4 and ThMYC8; and subgroup 3 that contained ThMYC7 only. ThMYC7 showed similar genetic distances to subgroups 1 and 2 (Figure 1).

2.2. Relative Abundances of ThMYCs in Root, Stem and Leaf tissues

The relative abundances of the nine ThMYCs were determined by calculating CT values for each ThMYC in the leaves, stems and roots under normal growth conditions following real-time RT-PCR. The ThMYC3 gene with the lowest expression level in roots (i.e., highest delta-delta CT value) was used as a calibrator (designated as 1.0) to determine relative gene expression levels. Relative gene expression levels were log2 transformed and these data are shown in Table 3. There were notable differences in the abundances of the nine ThMYCs expressed in each tissue, particularly in the root tissues. The greatest differences in transcript abundances of the ThMYCs when cultivated under normal growth conditions were 511,604-fold in roots, 9.3-fold in stems and 12.7-fold in leaves in the ThMYC1. ThMYC3 in root tissue was the transcript of lowest abundance, while ThMYC4 was the gene of lowest abundance in stems and leaves.

2.3. Expression Patterns of ThMYCs in Response to Different Stresses

The molecular function of MYCs in leaves, stems and roots was determined by examining the expression profiles of the nine ThMYCs in response to different abiotic stresses using real-time RT-PCR. The genes were clustered according to similarities in their expression profiles for different treatments and after different treatment times. The clustering observed demonstrated a similar pattern as seen in the phylogenetic tree.

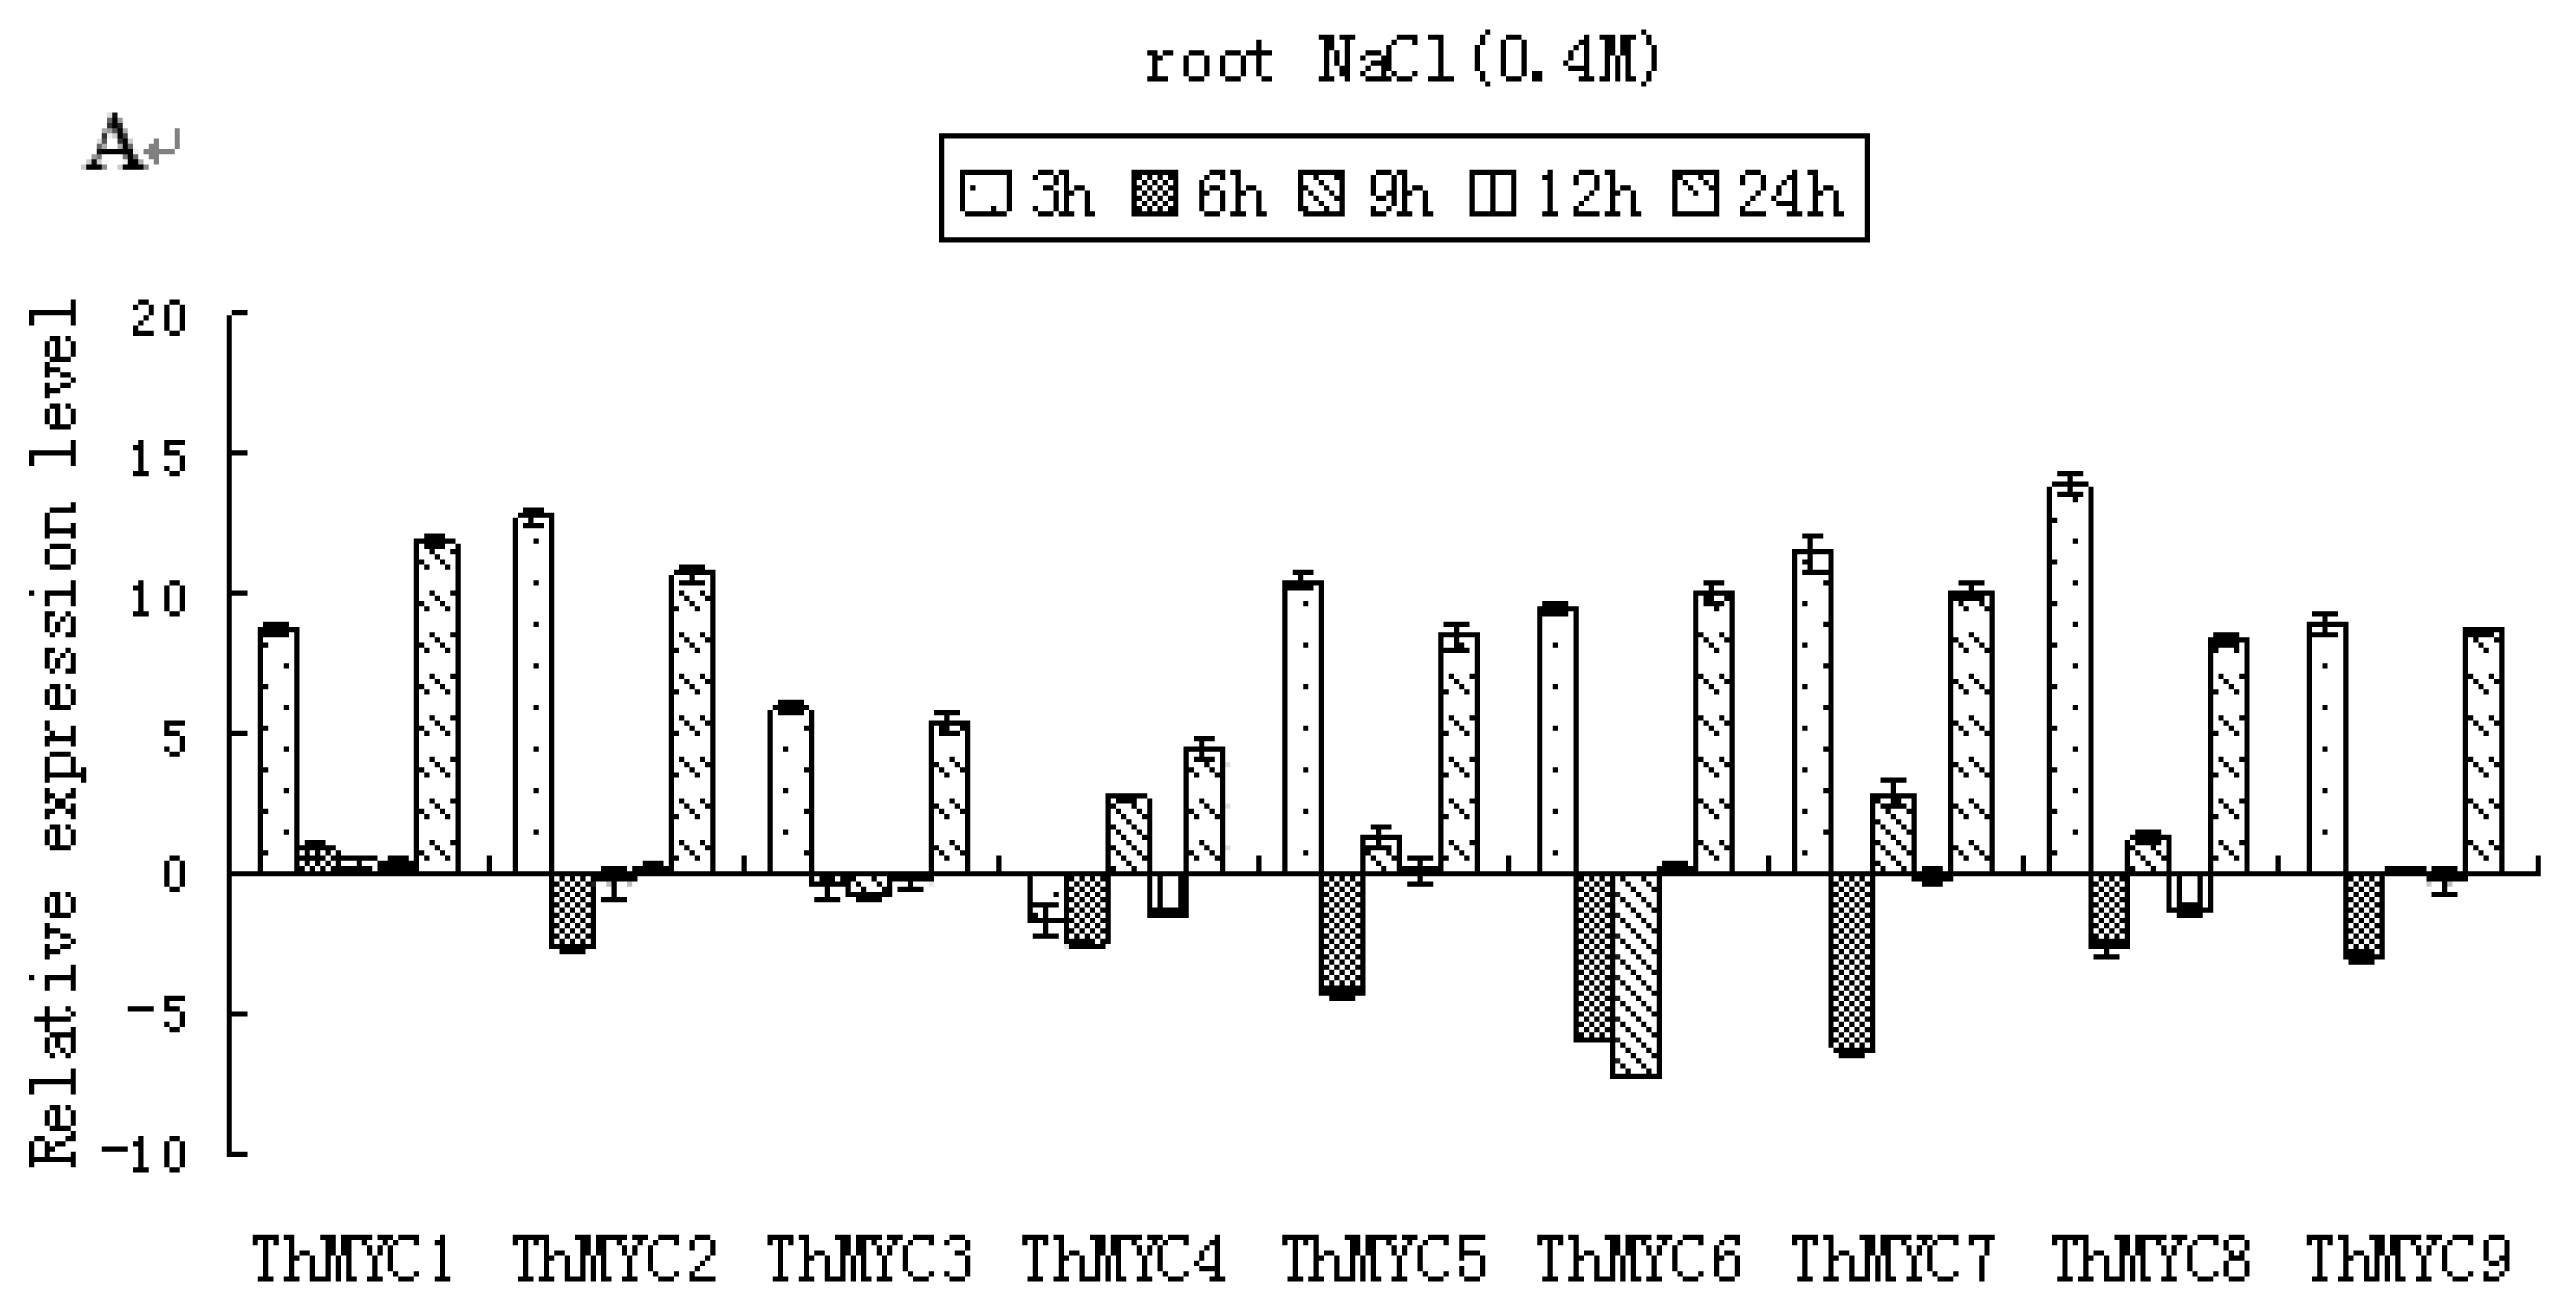
2.4. Expression Patterns of ThMYCs in Response to NaCl Stress

The expression patterns of the ThMYCs in response to NaCl treatment were investigated. In the roots, all the ThMYCs, except ThMYC4, displayed similar expression patterns. They were highly induced by NaCl stress at 3 h, but then their transcription levels decreased at 6, 9 and 12 h. At 24 h, the ThMYCs were highly expressed (increases of up to 128-fold), suggesting that the ThMYCs (except ThMYC4) play roles in NaCl stress tolerance in roots (Figure 2A). In stem tissues, ThMYC5, ThMYC6, ThMYC7, ThMYC8 and ThMYC9 displayed similar expression patterns. They were highly induced by NaCl stress and reached peak expression levels at 6 h. ThMYC1 was induced after 3 h of NaCl stress, but the expression of this gene was not significantly different from expression in the control stem tissues at the other time points. ThMYC3 was induced after 3 h of NaCl treatment, but was highly down-regulated at 9 h. ThMYC2 and ThMYC4 were generally down-regulated after NaCl stress treatment (Figure 2B). In leaves, the ThMYCs displayed similar expression profiles. They were highly induced by NaCl stress at 6 h, before being down-regulated at 9 h. At subsequent time points, ThMYC expression levels were relatively similar to the controls, except ThMYC8 that showed a down regulation at 24 h (Figure 2C).

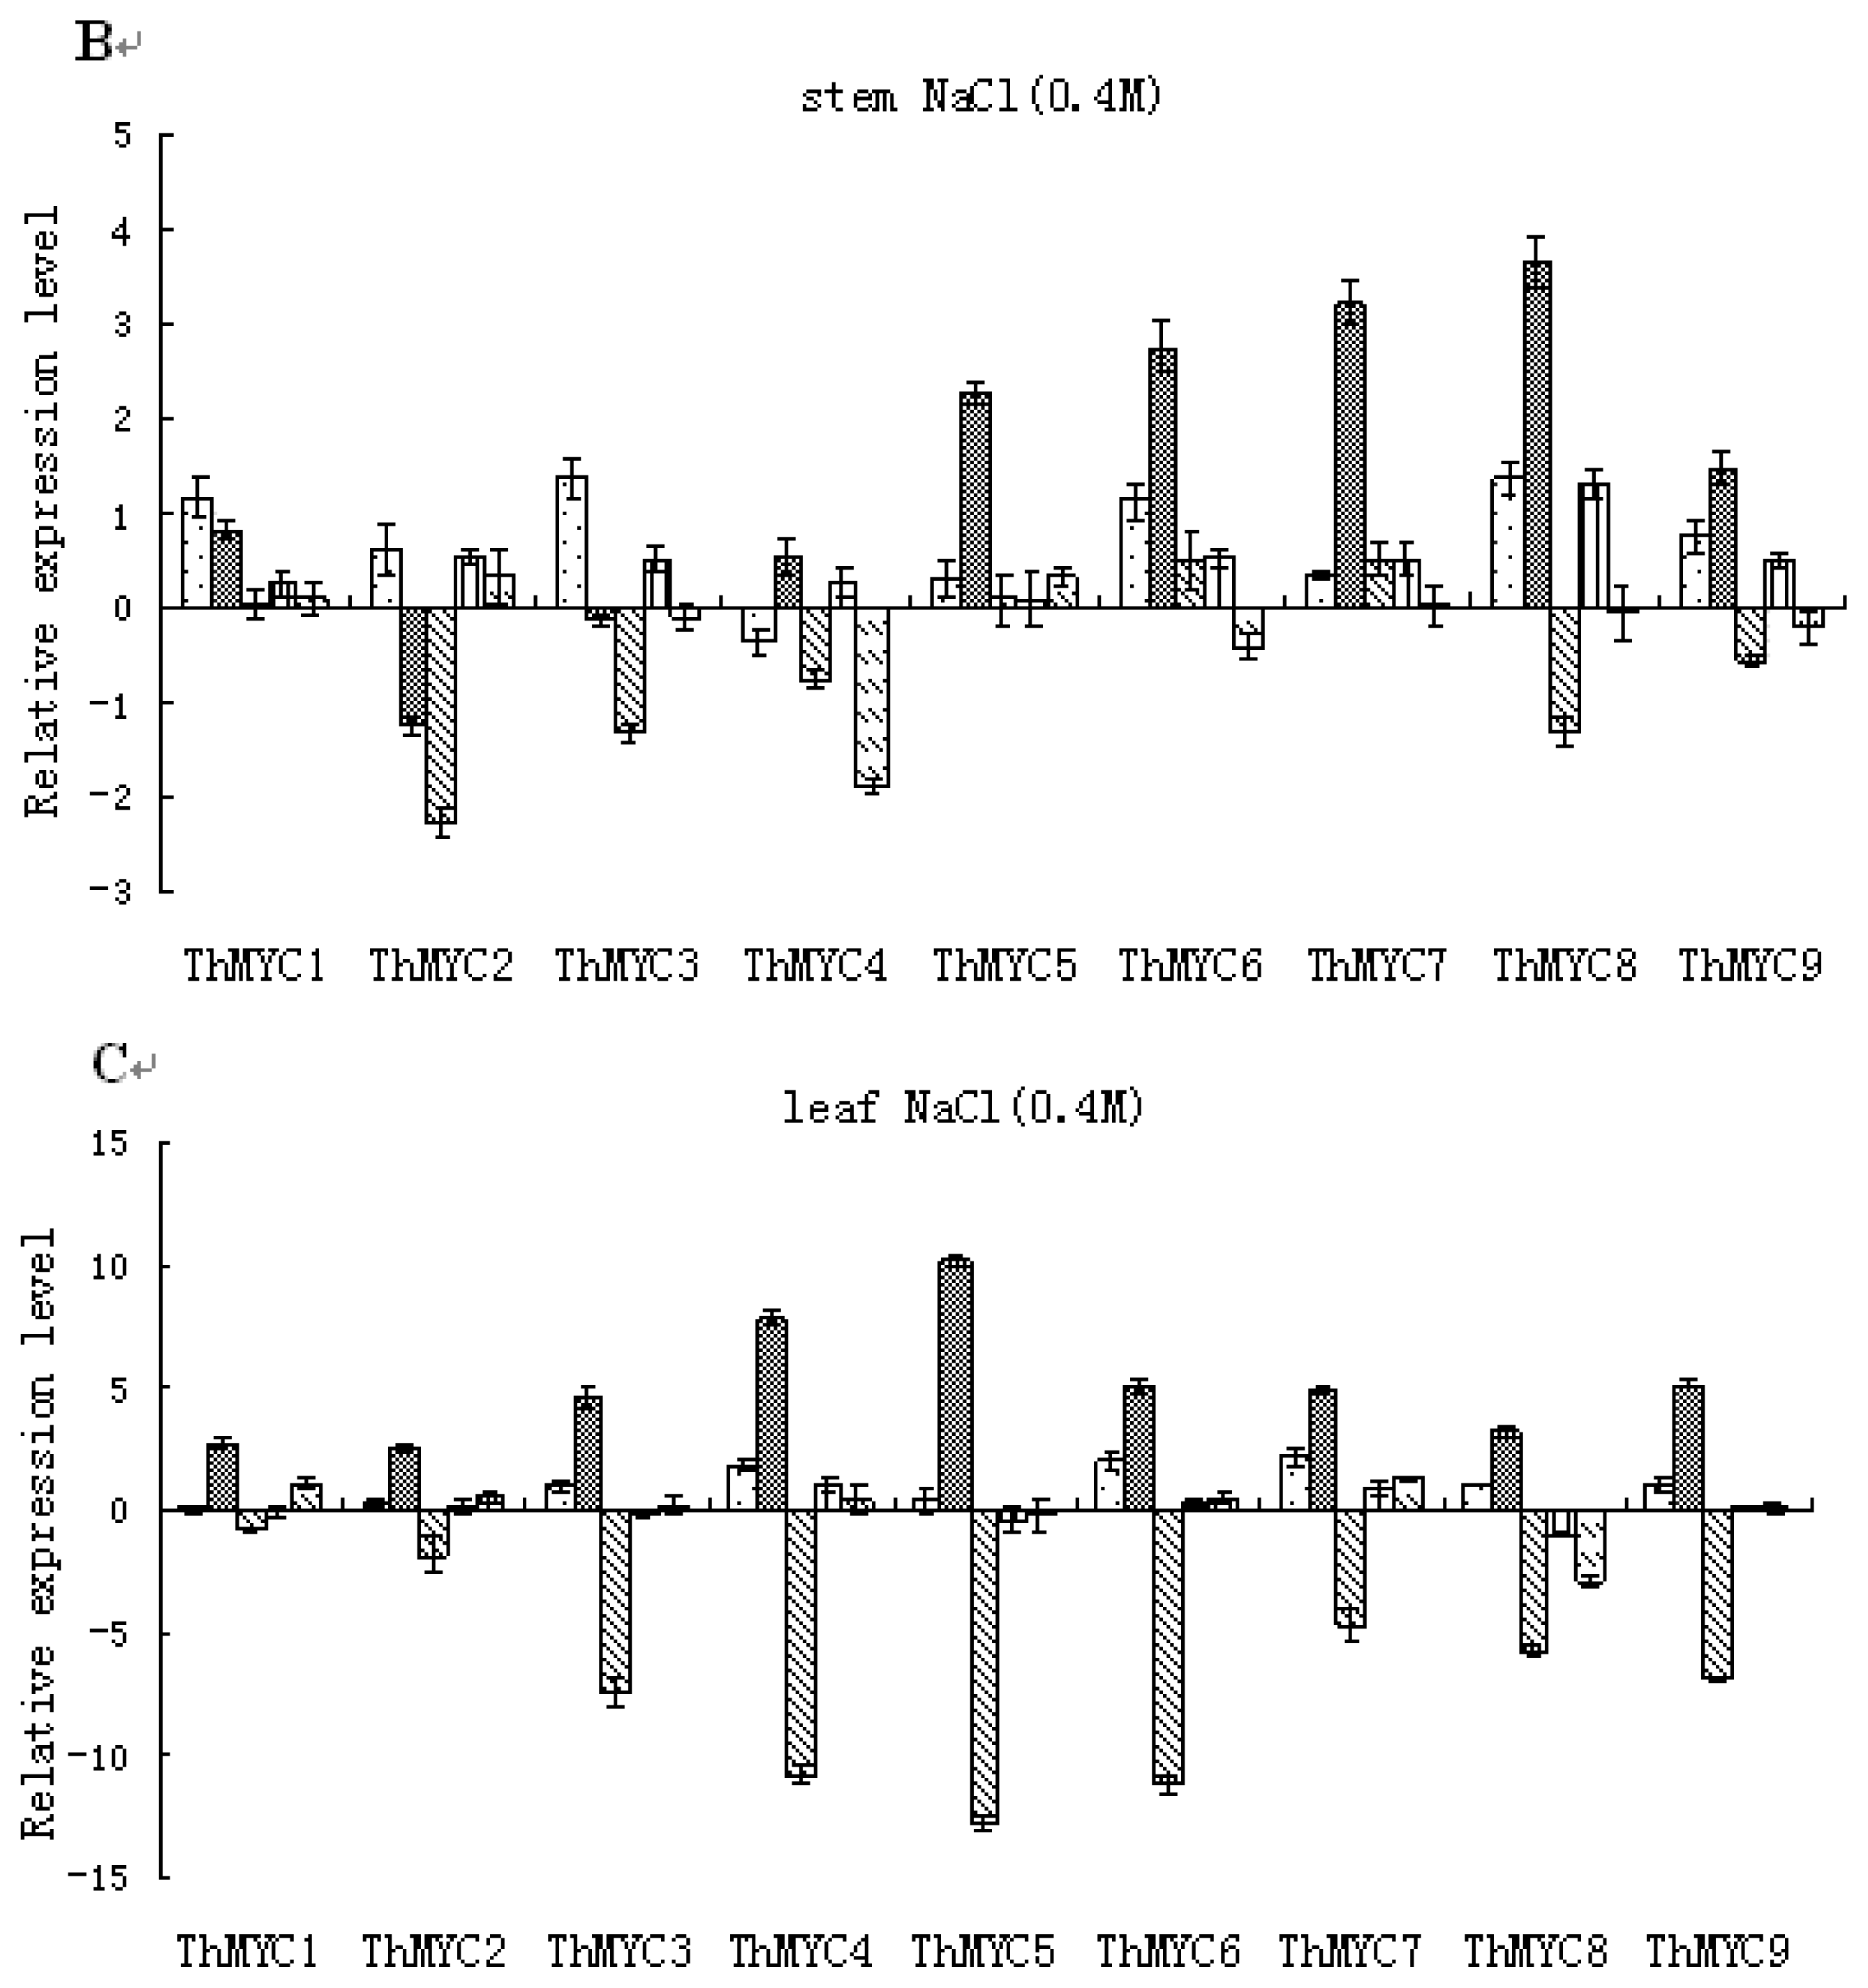
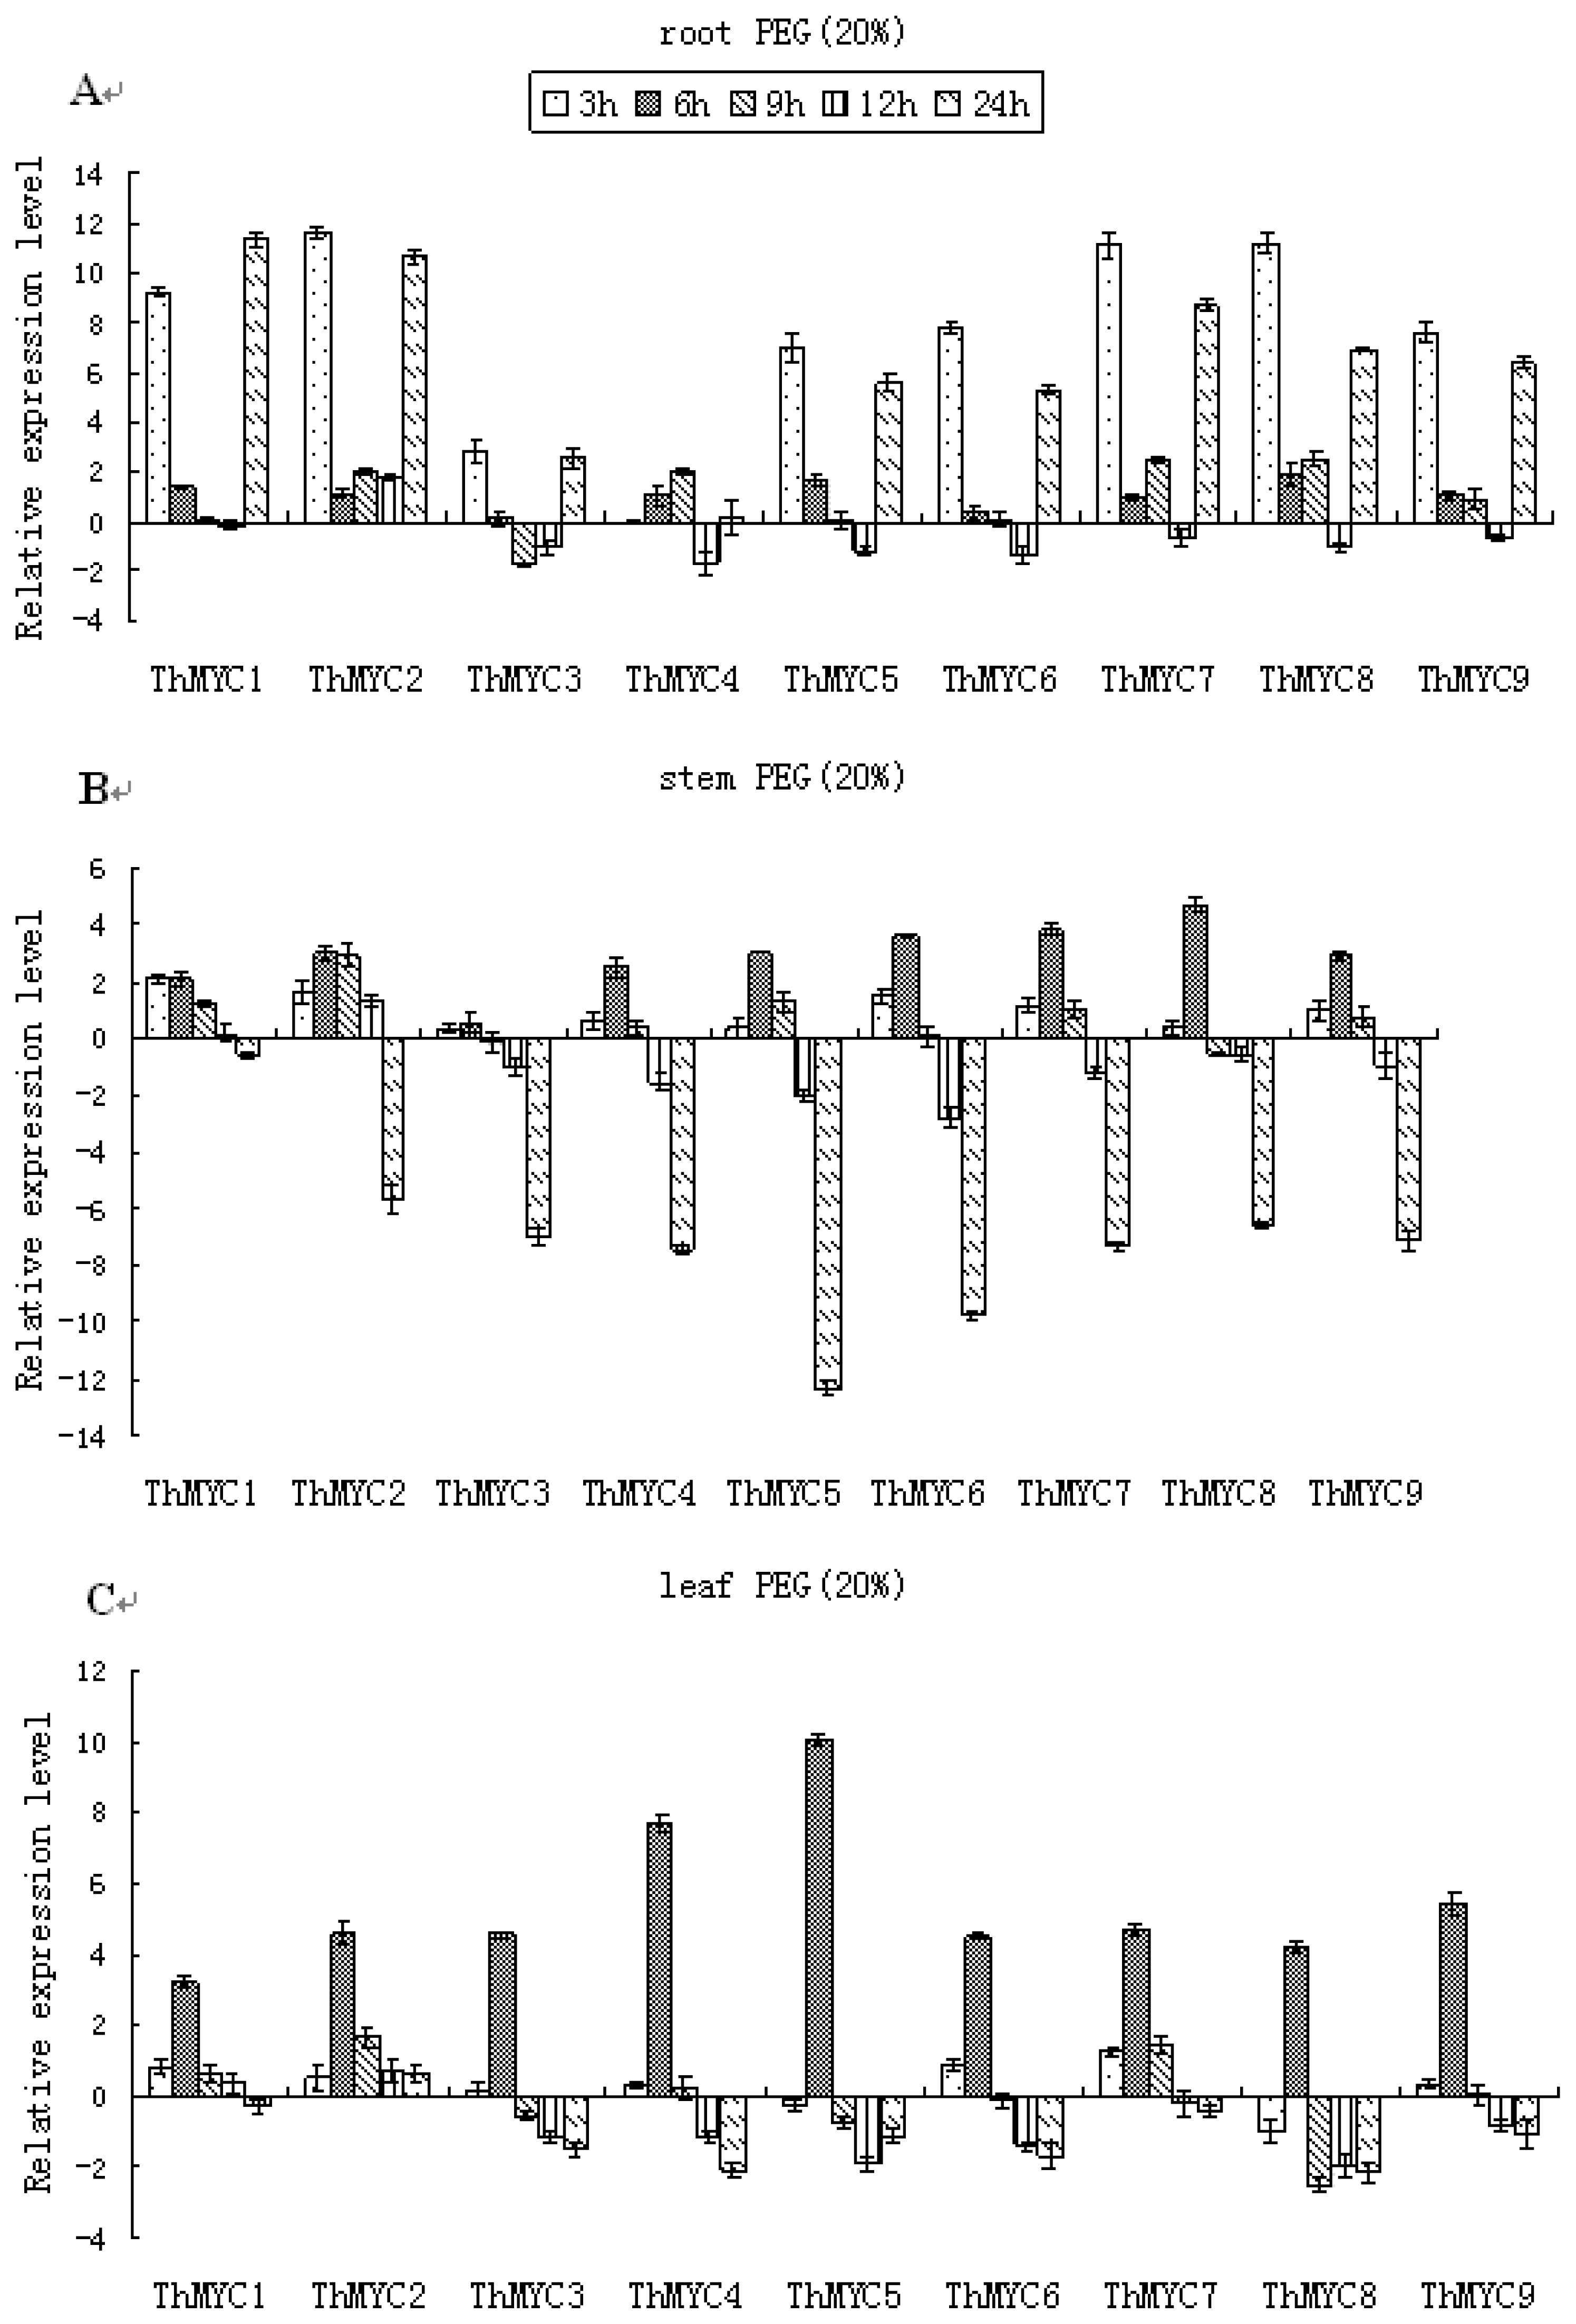
2.5. Expression Patterns of ThMYCs in Response to PEG Stress

In roots, as with NaCl stress, all of the ThMYC genes (except for ThMYC4) were highly induced by PEG stress at 3 and 24 h, and generally transcript levels peaked at 3 h. However, at the other time points tested, the expression of these genes in the roots did not differ notably from the controls (Figure 3A). In stems, ThMYC1 was significantly induced by PEG stress at 3, 6 and 9 h, but expression was not significantly different from the controls at later time points. The other ThMYCs generally showed similar expression patterns in which the expression peaked at 6 h of PEG stress before decreasing to their lowest levels at 24 h. In other words, the ThMYCs were down-regulated at 24 h. (Figure 3B). In leaves, ThMYC1 was significantly up-regulated by PEG treatment at 3, 6, 9 and 12 h, but expression did not differ significantly from the control at 24 h. The other ThMYCs genes were highly up-regulated by PEG at 6 h (typically peak expression levels), but at the other time points their expression did not differ significantly from the control or were even down-regulated (Figure 3C).

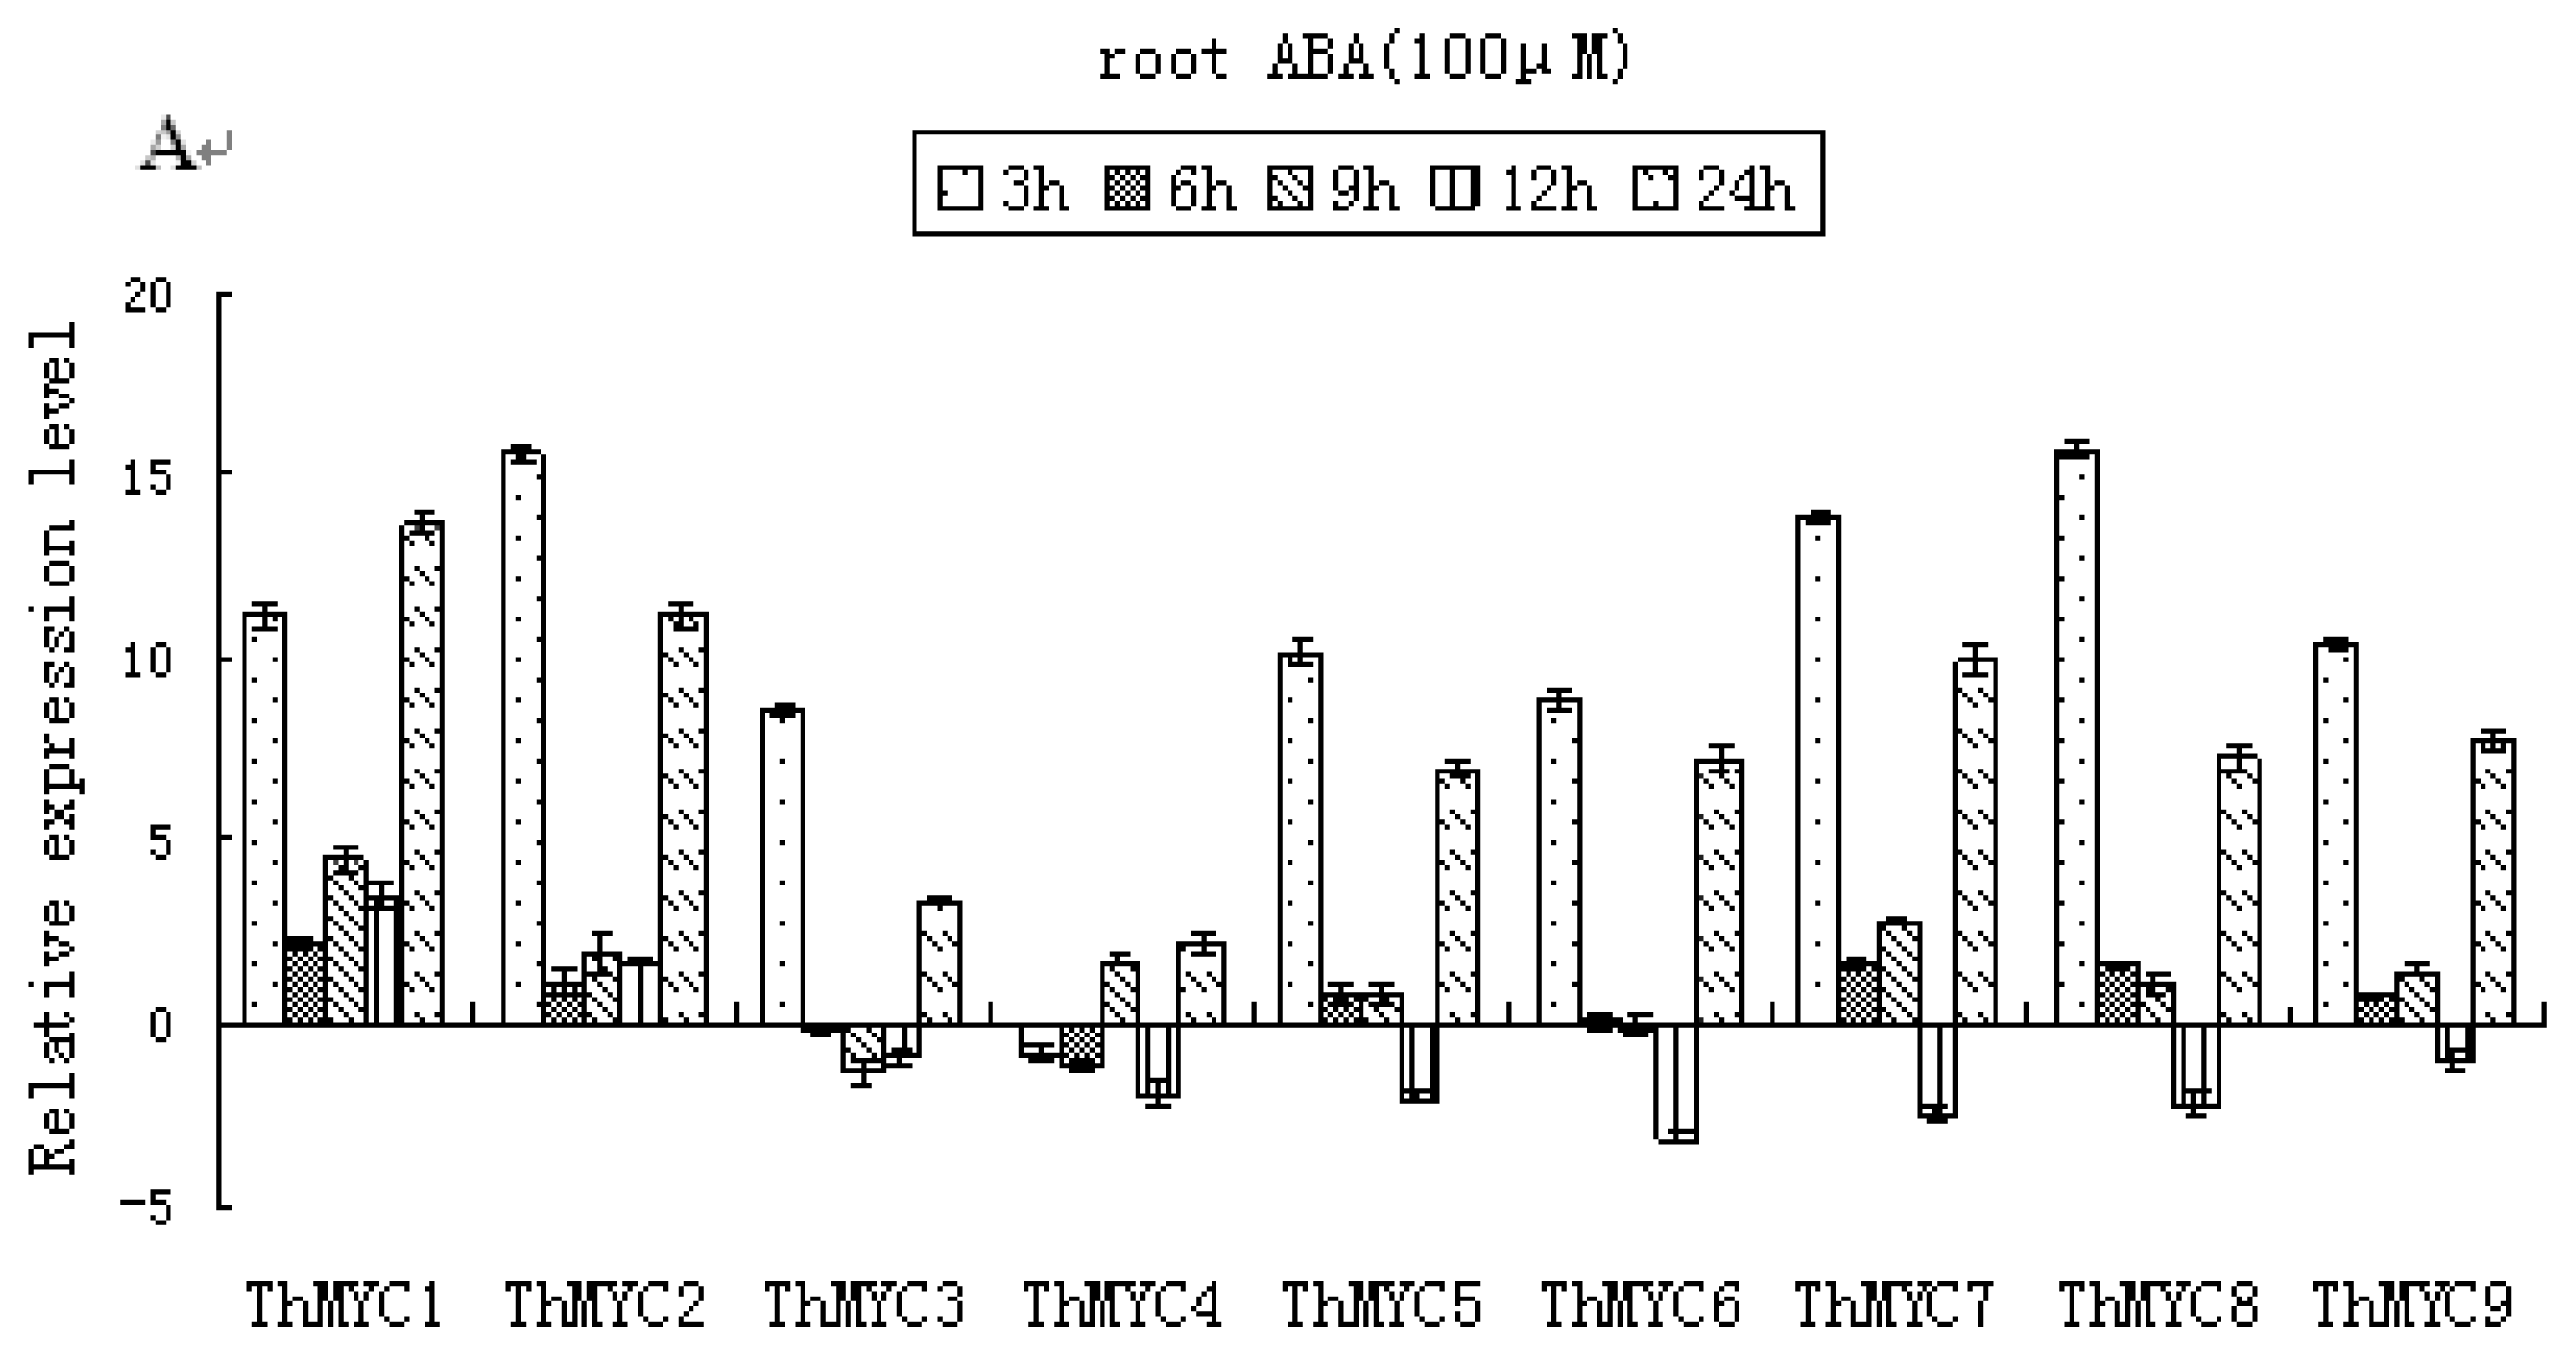
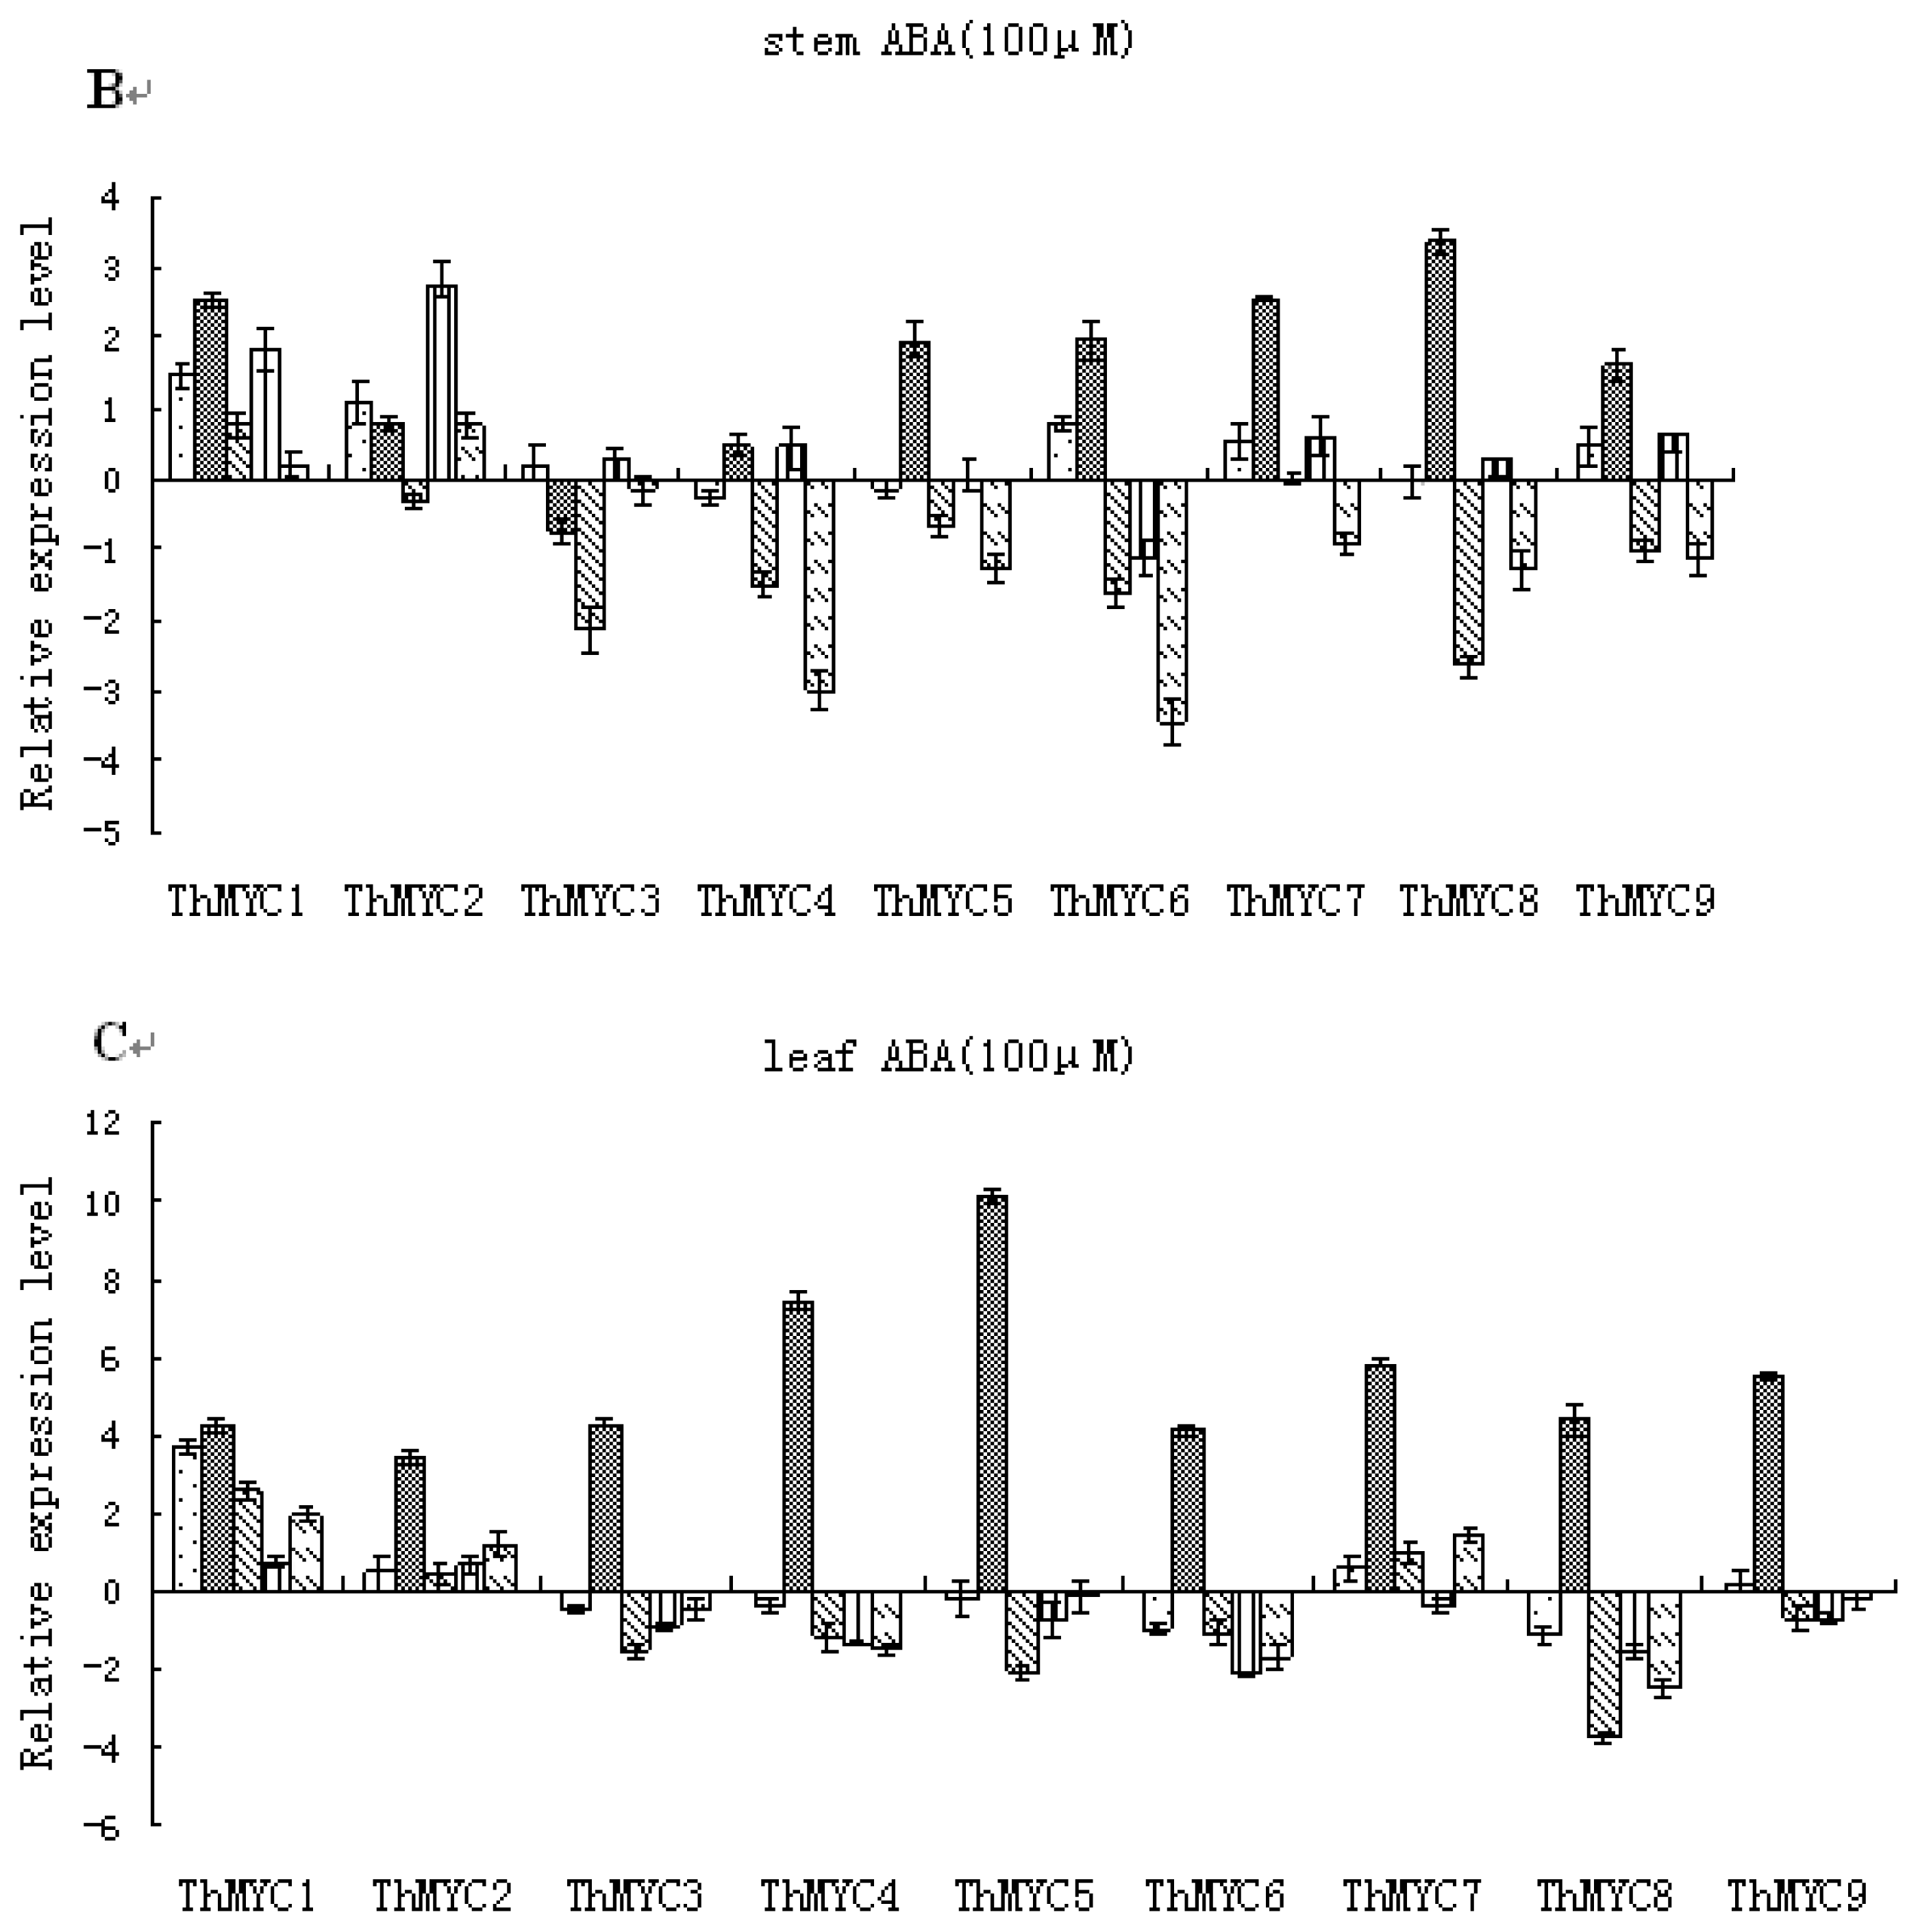
2.6. Expression Patterns of ThMYCs in Response to ABA Treatment

Real-time RT-PCR results demonstrated that all the ThMYCs in the roots (except ThMYC4) were highly induced by ABA exposure at 3 and 24 h; indeed, peak expression levels generally occurred at 3 h (except ThMYC1). Nevertheless, the expression of these genes was much lower at the other time points examined compared with 3 and 24 h (Figure 4A). In stems, ThMYC5, ThMYC6, ThMYC7, ThMYC8 and ThMYC9 showed similar expression patterns, and these genes were significantly induced 6 h after ABA treatment, but were down-regulated or did not differ significantly from controls at the other time points investigated. While ThMYC1 and ThMYC2 were generally up-regulated by ABA treatment, the expression of ThMYC3 and ThMYC4 was significantly down-regulated or did not differ significantly from the controls (Figure 4B). In leaves, all of the ThMYCs were induced by ABA treatment and transcript levels peaked at 6 h. At the other time points, except for ThMYC1, the expression levels of all of the other genes were similar to the controls or were significantly down-regulated. Indeed, ThMYC1 was significantly up-regulated by ABA treatment at 3, 6, 9 and 24 h (Figure 4C).

3. Discussion

MYCs are involved in stress responses and these transcription factors have been found to regulate the expression of ABA-responsive genes [22]. In the present study, we cloned nine MYC genes from T. hispida. To investigate the roles of these ThMYCs in stress responses, their expression patterns were analyzed in response to salt, osmotic and ABA stresses using real-time RT-PCR. Our data showed that all nine ThMYCs were expressed in leaves, stems and roots, but that they exhibited tissue-specific expression patterns in response to salt, osmotic and ABA stresses. These findings highlight the need to investigate the expression of ThMYCs in different plant organs in order to reveal their detailed roles in stress responses.
The ThMYCs showed notable differences in abundances between leaf and stem tissues under normal growth conditions (Table 3). Except for ThMYC3, all of the ThMYCs were highly expressed in roots compared with the stems and leaves, especially ThMYC4 and ThMYC8, whose expression was mainly found in the roots (Table 3). In addition, ThMYCs were more highly induced in roots than in the stems and leaves in response to salt and osmotic stresses and ABA treatment. These results suggest that the ThMYCs play their roles in stress responses mainly in the roots rather than in stems and leaves. The abundance of ThMYC3 was lower than the other ThMYC genes, but its transcript was most abundant in stem tissues than in the roots and leaves. Moreover, in response to the various stresses, ThMYC3 transcripts were highly increased in the roots and leaves compared with the stems. These results indicate that ThMYC3 mainly functions in the roots and leaves under conditions of stress.
In roots, all of the ThMYCs (except for ThMYC4) were highly induced by NaCl, PEG and ABA treatments. Interestingly, our results showed that in general the ThMYCs displayed similar expression patterns under salt, osmotic and ABA stress conditions, specifically that these genes were highly induced at 3 and 24 h compared with the other time points. Thus, the ThMYCs were highly activated at 3 and 24 h, and these could be the times at which the ThMYCs may regulate their target genes to mediate stress tolerance. Furthermore, all of the ThMYCs (except for ThMYC4) displayed similar expression patterns under salt and osmotic stresses, which suggests that these ThMYCs may play similar roles in salt and osmotic stress responses. The expression of ThMYC4 differed notably from the other ThMYCs in the roots and this gene was not highly regulated by salt, osmotic and ABA stresses, which suggests that it may not play an important role in stress responses in root tissue.
In stems, most of the ThMYCs were up-regulated by salt and osmotic stresses and ABA treatment after 6 h, and their expression peaked at this time point. Similarly, In the leaves, all of the ThMYCs were highly up-regulated by ABA exposure and salt and osmotic stresses after 6 h. These results suggest that the ThMYCs may regulate their target genes in stems and leaves for adaptation to stressful conditions 6 h after stress treatment.
Interestingly, our results showed that all of the ThMYCs were highly induced by ABA exposure and salt and osmotic stresses in the roots at 3 h; however, in the stems and leaves, they were highly induced only after stress for 6 h. This is probably because the root is the first plant organ to perceive the stress signal, and it presumably takes time to transduce stress signals to the stems and leaves to trigger the expression of the ThMYCs in those tissues. Our results showed that the ThMYCs were highly induced at early stress period (stress for 3 or 6 h) and then were inhibited. Consistent with our results, some reports also showed that the transcriptional factors were highly induced at early stress period and then decreased [2325]. This phenomenon may be due to the reason that plants perceive the stress environment and produced the stress signal to trig the expression of MYCs, and the induction of MYCs will regulate the expression of their targets genes related stress response to adapt stress environment; when the regulation of MYC target genes was completed, the expression of MYCs will be decreased.
MYC proteins are synthesized only after endogenous levels of ABA accumulate, suggesting that these proteins play roles in the latter stages of stress responses [26]. The ThMYCs function as transcriptional activators in the ABA signal transduction pathway under stress conditions in plants [27]. Our results showed that all of the ThMYCs were up-regulated by ABA in the roots and leaves. Moreover, ThMYCs were highly up-regulated by salt and osmotic stresses. These results confirm that ThMYCs are stress responsive genes and that they belong to an ABA-dependent signaling pathway. Our results also showed that the ThMYCs were more highly induced in roots and leaves than in the stems, suggesting that they may play roles in stress responses mainly in roots and leaves rather than in the stems. Further, these findings may also imply that stress responses occur mainly in roots and leaves. That ThMYC3 and ThMYC4 were not up-regulated in response to ABA in the stems but were up-regulated in leaves and roots indicates that there is tissue specificity with respect to ABA induction of ThMYC gene transcription.
In general, our results showed that ThMYC5, ThMYC6, ThMYC7, ThMYC8 and ThMYC9 displayed similar expression in response to certain stress treatments, suggesting that these genes may be involved in the same gene expression regulatory networks in response to stress. Conversely, ThMYC1, ThMYC2, ThMYC3 and ThMYC4 displayed different expression patterns in response to stress, suggesting that these genes may be involved in distinct gene regulation pathways.

4. Experimental Section

4.1. Plant Culture Conditions and Treatments

Seeds for propagation of the plant materials were harvested from T. hispida plants. The seeds were planted into pots containing a mixture of turf peat and sand (2:1, v/v) and these were well-watered and kept under controlled greenhouse conditions of 70–75% relative humidity, 14 h light/10 h dark, and an average temperature of 24 °C. Two-month-old seedlings were exposed to one of four different treatments for 3, 6, 9, 12 or 24 h: water (normal growth condition without stress; control), 0.4 M NaCl, 20% polyethylene glycol (PEG)-6000 or 100 μM ABA. After each treatment, root, stem, and leaf tissues from at least five seedlings were harvested. The harvested roots, stems or leaves from each seedling were pooled, frozen immediately in liquid nitrogen for RNA preparation, and then analyzed by real-time reverse-transcriptase (RT)-PCR.

4.2. Cloning and Analysis of MYC Family Genes from T. hispida

Four transcriptomes were created from root tissues of T. hispida treated with NaHCO3 for 0, 12, 24 and 48 h using Solexa technology. Totals of 66,300, 51,204, 51,634 and 56,355 tentative unigenes (TUGs) were generated from the 0, 12, 24 and 48 h libraries, respectively. These TUGs were assembled into 81344 non-redundant unigenes using TGI Clustering tools [28]. These non-redundant unigenes were subjected to BLASTX analysis against protein databases, NR and Swiss-Prot, to search for similarities. Unigenes with BLASTX E-values > 10−5 were discarded during functional annotation. MYC genes were identified during functional annotation of the non-redundant unigenes by BLASTX analysis.

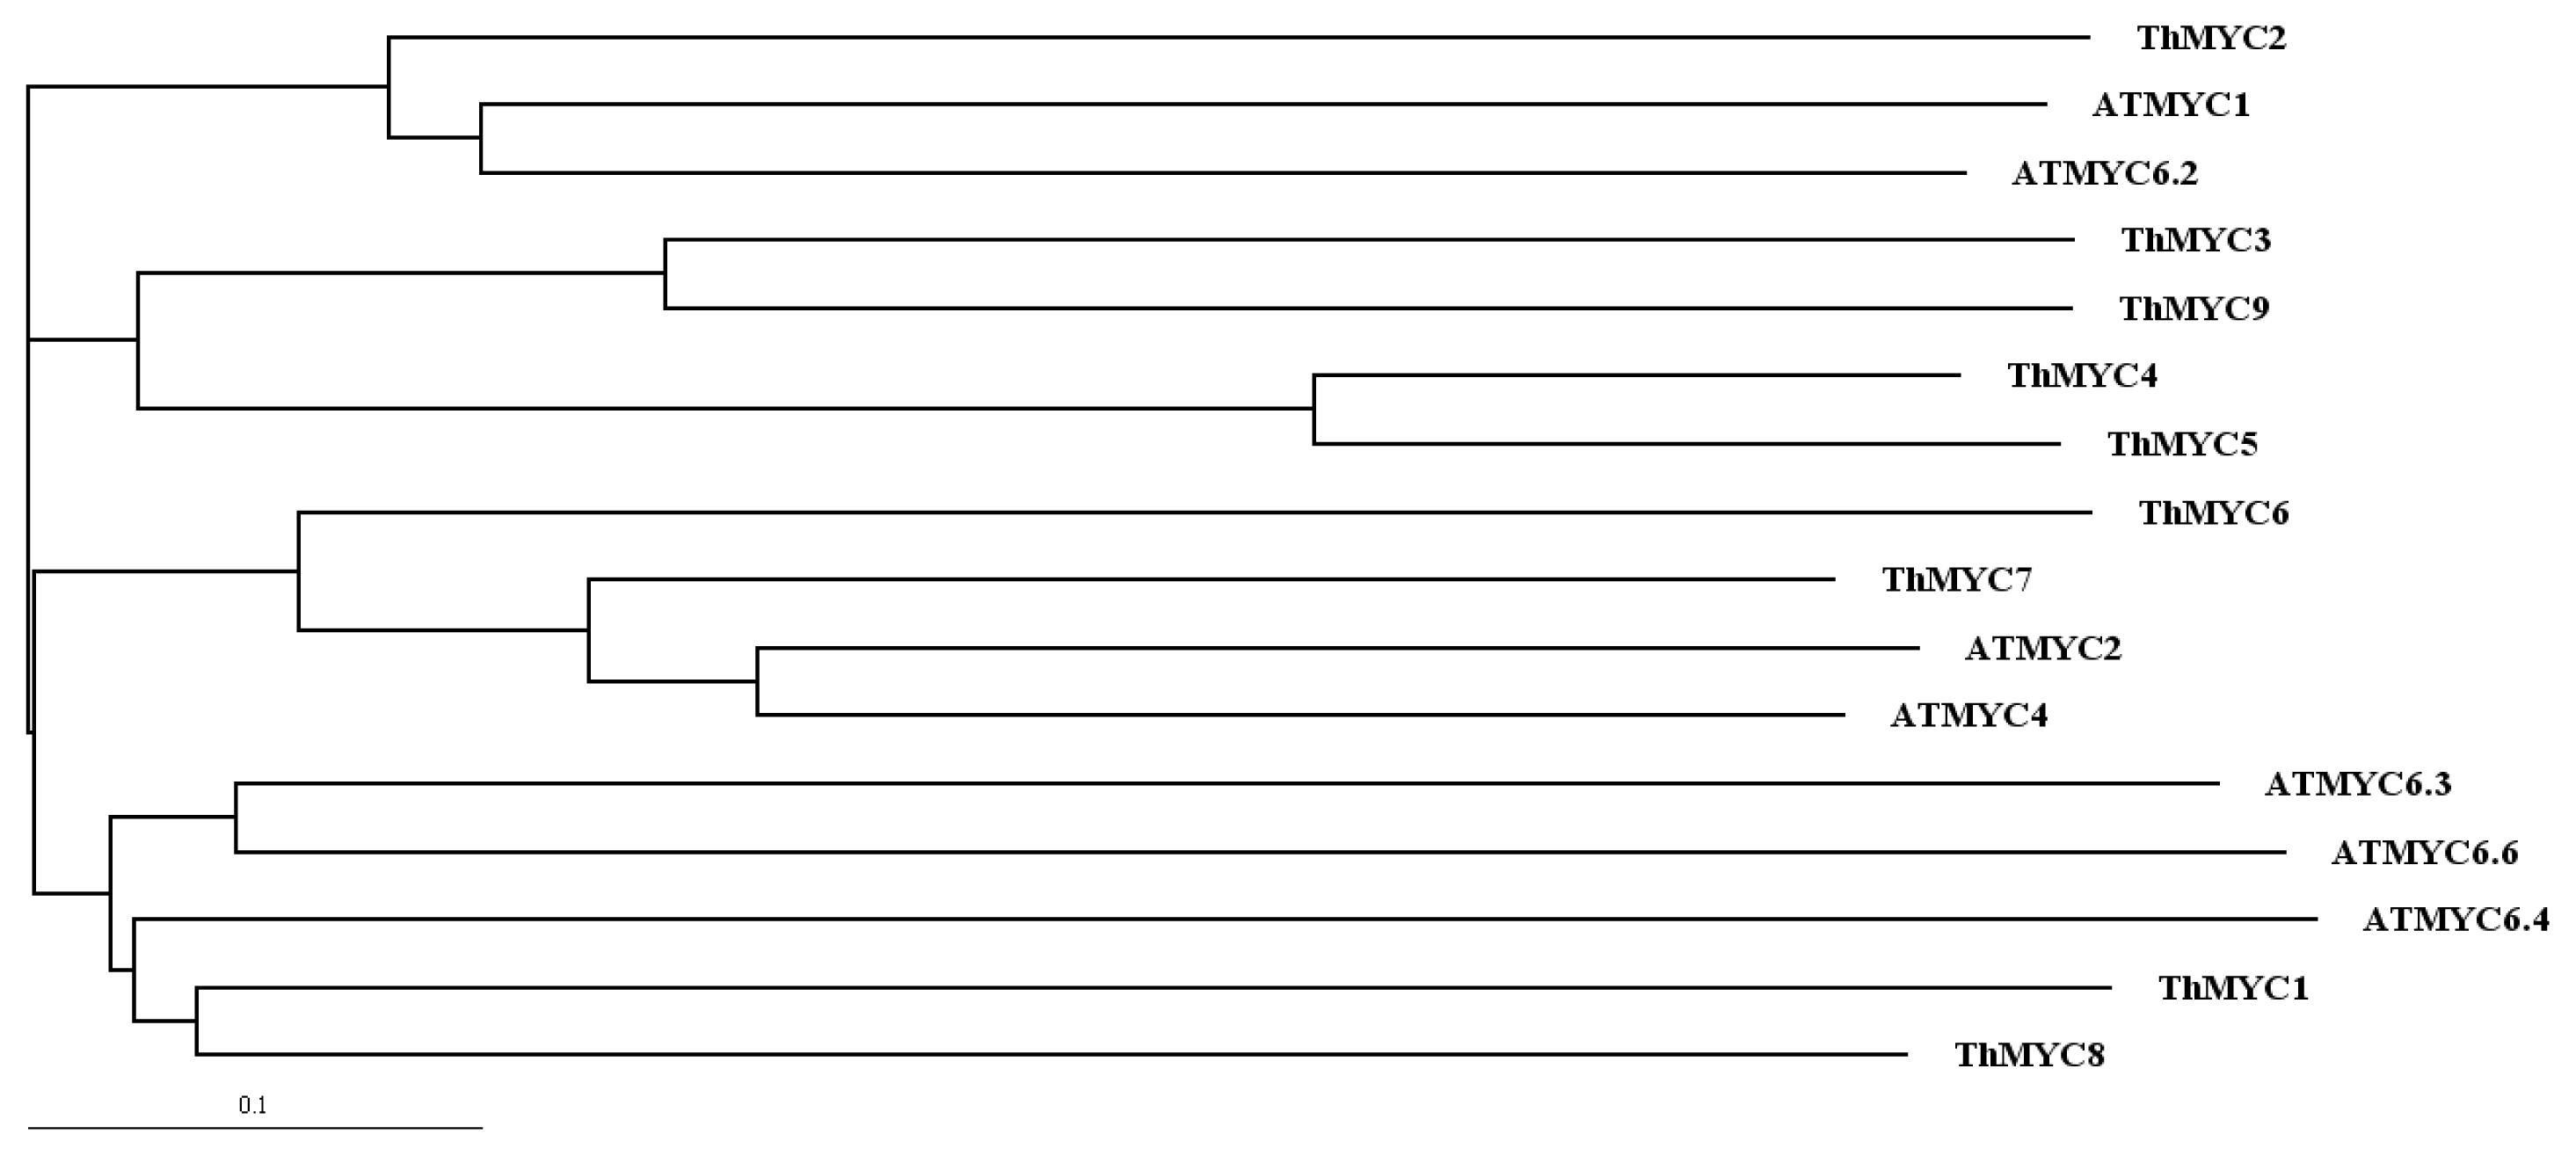
4.3. Phylogenetic Analysis of MYC Sequences

The open reading frame (ORF) of each MYC was resolved using ORF Finder from NCBI [29]. MYCs with complete ORFs were subjected to further analysis. Phylogenetic reconstruction was carried out using ClustalX Version 1.81 and the neighbor-joining method [30]. Sequence identities between the MYCs were calculated using ClustalW2 [31]. Classification of the nine MYCs was performed according to the method of [32]. Molecular weight (MW) and isoelectric point (pI) predictions for each MYC was carried out using the Compute pI/Mw tool [33].

4.4. MYC Gene Expression Profiles in Response to Abiotic Stresses

Total RNA of each sample was extracted using the CTAB method [34], and then was treated with DNaseI (Promega) to remove any residual DNA. RNA concentration was measured using a BioPhotometer plus (Eppendorf, Germany). Approximately 1 μg of total RNA was reverse-transcribed to cDNA in a 10 μL volume using 1 μM of oligodeoxythymidine as primer, and the procedures of cDNA synthesis was following the PrimeScriptTM RT Reagent Kit protocol (TaKaRa Corp., Dalian, China). The synthesized cDNA was diluted to 100 μL with sterile water and used as template for real-time RT-PCR.
Real-time RT-PCR was performed in an MJ OpticonTM2 machine (Bio-Rad, Hercules, CA, USA). The β-actin, α-tubulin and β-tubulin genes were selected as internal controls to normalize the quantity of total RNA present in each reaction. The primers used for real-time RT-PCR are shown in Table 1. The reaction mixture (20 μL) contained 10 μL of SYBR Green Realtime PCR Master Mix (Toyobo), 0.5 μM each of forward and reverse primers, and 2 μL of cDNA template (equivalent to 100 ng of total RNA). For PCR amplification, all the primer pairs were used the same amplification procedure. The amplification was performed using the following cycling parameters: 94 °C for 30 s; 45 cycles of 94 °C for 12 s, 60 °C for 30 s and 72 °C for 40 s; and 1 s at 82 °C for plate reading. A melting curve was generated for each sample at the end of each run to assess the purity of the amplified products. Real-time RT-PCR was carried out in triplicate (technical repeats) to ensure the reproducibility of the results. Three biological repeats were performed on each treatment. Expression levels were calculated from the threshold cycle according to the delta-delta CT method [34]. Relative gene expression level was calculated as the transcription level under stress treatment divided by the transcription level of the control (i.e., samples from plants grown under normal conditions and harvested at the same time). Relative gene expression levels were log2 transformed.

5. Conclusions

In conclusion, we have constructed expression profiles for nine ThMYC genes in different organs of T. hispida in response to salt and osmotic stresses and ABA treatment. It was shown that ThMYCs can be up-regulated by NaCl, PEG and ABA, indicating that ThMYCs are involved in salt and osmotic stress tolerance and are controlled by ABA. Also, these ThMYCs are more highly expressed and more highly induced by salt, PEG and ABA treatments in roots compared with stem and leaf tissues, suggesting that these genes may play roles in stress responses in the roots rather than in leaves and stems.

Acknowledgments

This work was supported by National Natural Science Foundation of China (No. 30972386) and Fundamental Research Funds for the Central Universities (DL09DA01).

References

  1. Pires, N.; Dolan, L. Origin and diversification of basic-helix-loop-helix proteins in plants. Mol. Biol. Evol 2010, 27, 862–874. [Google Scholar]
  2. Berger, S.; Bell, E.; Mullet, J.E. Two methyl jasmonate-insensitive mutants show altered expression of AtVsp in response to methyl jasmonate and wounding. Plant Physiol 1996, 111, 525–531. [Google Scholar]
  3. Anderson, J.P.; Badruzsaufari, E.; Schenk, P.M.; Manners, J.M.; Desmond, O.J.; Ehlert, C.; Maclean, D.J.; Ebert, P.R.; Kazan, K. Antagonistic interaction between abscisic acid and jasmonate-ethylene signaling pathways modulates defense gene expression and disease resistance in Arabidopsis. The Plant Cell 2004, 16, 3460–3479. [Google Scholar]
  4. Boter, M.; Ruiz-Rivero, O.; Abdeen, A.; Pratt, S. Conserved MYC transcription factors play a key role in jasmonate signaling both in tomato and Arabidopsis. Genes Dev 2004, 18, 1577–1591. [Google Scholar]
  5. Lorenzo, O.; Chico, J.M.; Sanchez-Serrano, J.J.; Solano, R. JASMONATE-INSENSITIVE1 encodes a MYC transcription factor essential to discriminate between different jasmonate-regulated defense responses in Arabidopsis. The Plant Cell 2004, 16, 1938–1950. [Google Scholar]
  6. Lorenzo, O.; Solano, R. Molecular players regulating the jasmonate signalling network. Curr. Opin. Plant Biol 2005, 8, 532–540. [Google Scholar]
  7. Zhu, Y.; Cai, X.L.; Wang, Z.Y.; Hong, M.M. An Interaction between a MYC Protein and an EREBP Protein Is Involved in Transcriptional Regulation of the Rice Wx Gene. J. Biol. Chem 2003, 48, 47803–47811. [Google Scholar]
  8. Dang, C.V.; Barrett, J.; Villa-Garcia, M.; Resar, L.M.S.; Kato, G.T.; Fearon, E.R. Intracellular leucine zipper interactions suggest c-Myc hetero-oligomerization. Mol. Cell Biol 1991, 11, 954–962. [Google Scholar]
  9. Shimizu, T.; Toumoto, A.; Ihara, K.; Shimizu, M.; Kyogoku, Y.; Ogawa, N. Crystal structure of PHO4 bHLH domain-DNA complex: flanking base recognition. EMBO J 1997, 16, 4689–4697. [Google Scholar]
  10. Atchley, W.R.; Terhalle, W.; Dress, A. Positional dependence, cliques, and predictive motifs in the bHLH protein domain. J. Mol. Evol 1999, 48, 501–516. [Google Scholar]
  11. Martínez-García, J.F.; Huq, E.; Quail, P.H. Direct targeting of light signals to a promoter element-bound transcription factor. Science 2000, 288, 859–863. [Google Scholar]
  12. Toledo-Ortiz, G.; Huq, E.; Quail, P.H. The Arabidopsis basic/helix-loop-helix transcription factor family. The Plant Cell 2003, 15, 1749–1770. [Google Scholar]
  13. Qian, W.; Tan, G.; Liu, H.; He, S.; Gao, Y.; An, C. Identification of a bHLH-type G-box binding factor and its regulation activity with G-box and BoxI elements of the PsCHS1 promoter. Plant Cell Rep 2007, 26, 85–93. [Google Scholar]
  14. Abe, H.; Yamaguchi-Shinozaki, K.; Urao, T.; Iwasaki, T.; Hosokawa, D.; Shinozaki, K. Role of Arabidopsis MYC and MYB Homologs in Drought and Abscisic Acid-Regulated Gene Expression. The Plant Cell 1997, 9, 1859–1868. [Google Scholar]
  15. van der Fits, L.; Zhang, H.; Menke, F.L.; Deneka, M.; Memelink, J. A Catharanthus roseus BPF-1 homologue interacts with an elicitor-responsive region of the secondary metabolite biosynthetic gene Str and is induced by elicitor via a JA-independent signal transduction Pathway. Plant Mol. Biol 2000, 44, 675–685. [Google Scholar]
  16. Dombrecht, B.; Xue, G.P.; Sprague, S.J.; Kirkegaard, J.A.; Ross, J.J.; Reid, J.B.; Fitt, G.P.; Sewelam, N.; Schenk, P.M.; Manners, J.M.; et al. MYC2 Differentially Modulates Diverse Jasmonate-Dependent Functions in Arabidopsis. The Plant Cell 2007, 19, 2225–2245. [Google Scholar]
  17. Zhao, Y.; Zhou, L.M.; Chen, Y.Y.; Yang, S.G.; Tian, W.M. MYC genes with differential responses to tapping, mechanical wounding, ethrel and methyl jasmonate in laticifers of rubber tree. J. Plant Physiol 2011, 168, 1649–1658. [Google Scholar]
  18. Li, H.; Sun, J.; Xu, Y.; Jiang, H.; Wu, X.; Li, C. The bHLH-type transcription factor AtAIB positively regulates ABA response in Arabidopsis. Plant Mol. Biol 2007, 65, 655–665. [Google Scholar]
  19. Fursova, O.V.; Pogorelko, G.V.; Tarasov, V.A. Identification of ICE2, a gene involved in cold acclimation which determines freezing tolerance in Arabidopsis thaliana. Gene 2009, 429, 98–103. [Google Scholar]
  20. Yin, Y.; Vafeados, D.; Tao, Y.; Yoshida, S.; Asami, T.; Chory, J. A new class of transcription factors mediates brassinosteroid-regulated gene expression in Arabidopsis. Cell 2005, 120, 249–259. [Google Scholar]
  21. Penfield, S.; Josse, E.M.; Kannangara, R.; Gilday, A.D.; Halliday, K.J.; Graham, I.A. Cold and light control seed germination through the bHLH transcription factor SPATULA. Curr. Biol 2005, 15, 1998–2006. [Google Scholar]
  22. Tuteja, N. Abscisic Acid and Abiotic Stress Signaling. Plant Signal. Behav 2007, 2, 135–138. [Google Scholar]
  23. Muniz García, M.N.; Giammaria, V.; Grandellis, C.; Téllez-Inón, M.T.; Ulloa, R.M.; Capiati, D.A. Characterization of StABF1, a stress-responsive bZIP transcription factor from Solanum tuberosum L. that is phosphorylated by StCDPK2in vitro. Planta 2011. [Google Scholar] [CrossRef]
  24. Ying, S.; Zhang, D.F.; Fu, J.; Shi, Y.S.; Song, Y.C.; Wang, T.Y.; Li, Y. Cloning and characterization of a maize bZIP transcription factor, ZmbZIP72, confers drought and salt tolerance in transgenic. Arabidopsis. Planta 2011. [Google Scholar] [CrossRef]
  25. Gao, S.Q.; Chen, M.; Xu, Z.S.; Zhao, C.P.; Li, L.; Xu, H.J.; Tang, Y.M.; Zhao, X.; Ma, Y.Z. The soybean GmbZIP1 transcription factor enhances multiple abiotic stress tolerances in transgenic plants. Plant Mol. Biol 2011, 75, 537–553. [Google Scholar]
  26. Mahajan, S.; Tuteja, N. Cold, salinity and drought stresses: An overview. Arch. Biochem. Biophys 2005, 444, 139–158. [Google Scholar]
  27. Abe, H.; Urao, T.; Urao, T.; Ito, T.; Seki, M.; Shinozaki, K.; Yamaguchi-Shinozaki, K. Arabidopsis AtMYC2 (bHLH) and AtMYB2 (MYB) Function as Transcriptional Activators in Abscisic Acid Signaling. Plant Cell 2003, 15, 63–78. [Google Scholar]
  28. Pertea, G.; Huang, X.; Liang, F.; Antonescu, V.; Sultana, R.; Karamycheva, S.; Lee, Y.; White, J.; Cheung, F.; Parvizi, B.; et al. TIGR Gene Indices clustering tools (TGICL): A software system for fast clustering of large EST datasets. Bioinformatics 2003, 19, 651–652. [Google Scholar]
  29. ORF Finder. http://www.ncbi.nlm.nih.gov/gorf/gorf.html accessed on 12 September 2011.
  30. Saitou, N.; Nei, M. The neighbor-joining method: a new method for reconstructing phylogenetic trees. Mol. Biol. Evol 1987, 4, 406–425. [Google Scholar]
  31. Clustalw 2. http://www.ebi.ac.uk/Tools/clustalw2/ accessed on 12 September 2011.
  32. Boutrot, F.; Chantret, N.; Gautier, M.F. Genome-wide analysis of the rice and Arabidopsis non-specific lipid transfer protein (nsLtp) gene families and identification of wheat nsLtp genes by EST data mining. BMC Genomics 2008, 9, 86. [Google Scholar]
  33. ProtParam. http://www.expasy.org/tools/protparam.html accessed on 12 September 2011.
  34. Pfaffl, M.W.; Horgan, G.W.; Dempfle, L. Relative expression software tool (REST) for group-wise comparison and statistical analysis of relative expression results in real-time PCR. Nucleic Acids Res 2002, 30, 36. [Google Scholar]
Figure 1. Phylogenetic analysis of the nine ThMYCs and seven ATMYCs : ThMYC1 (JN166785), ThMYC2 (JN166786), ThMYC3 (JN166787), ThMYC4 (JN166788), ThMYC5 (JN166789), ThMYC6 (JN166790), ThMYC7 (JN166792), ThMYC8 (JN166793) ThMYC9 (JN166794), ATMYC1 (AT4G00480), ATMYC2(AT1G32640), ATMYC4 (AT4G17880), ATMYC6.2 (AT5G41315), ATMYC6.3 (AT5G41320), ATMYC6.4 (AT5G41330) and ATMYC6.6 (AT5G41350), The GenBank accession number of each ThMYC is shown in parentheses.
Ijms 13 01300f1
Figure 2. Time-course expression and hierarchical cluster analysis of ThMYCs in response to NaCl stress. Relative gene expression level was log2 transformed: >0, up-regulation; =0, no change in regulation; <0, down-regulation. (AC): expression of ThMYCs in roots, stems and leaves, respectively.
Ijms 13 01300f2aIjms 13 01300f2b
Figure 3. Time-course expression and hierarchical cluster analysis of ThMYCs in response to PEG stress. Relative gene expression level was log2 transformed: >0, up-regulation; =0, no change in regulation; <0, down-regulation. (AC): expression of ThMYCs in roots, stems and leaves, respectively.
Ijms 13 01300f3
Figure 4. Time-course expression and hierarchical cluster analysis of ThMYCs in response to ABA treatment. Relative gene expression level was log2 transformed: >0, up-regulation; =0, no change in regulation; <0, down-regulation. (AC): expression of ThMYCs in roots, stems and leaves, respectively.
Ijms 13 01300f4aIjms 13 01300f4b
Table 1. Primers used for real time RT-PCR.
GeneGenBank Accession numberForward Primers (5′-3′)Reverse Primers (5′-3′)
ThMYC1JN166785AGGCTTAATGACAAGTTTGTGGAGCGTATGCGGCTGGCATTGTT
ThMYC2JN166786GTATCCGGATATAGTTGAGCAGGGATGCCATCAAGAGTTGATG
ThMYC3JN166787AATGGTAGTGGTAGAGTCGGTGCTCATCATTAGGTCCTGACGAT
ThMYC4JN166788GAAGCGATTGAGGGAAGATGATCTTCACATACTCCACTGCTTCT
ThMYC5JN166789TTGAGTGGAAGCGTTGATGGGTTATCACTAATTCTTGTCCTTCG
ThMYC6JN166790TGAGTACTTGGTAGCTAGCTCTATCATCATCATCAGAACCACTG
ThMYC7JN166792TAGGAACCGAAGTCTGGATCCTGTATAGGTATACATACCAGAGT
ThMYC8JN166793ATGAAAACTCTTTACTCACAGCTCCGACCCTACGCGTATGTGTC
ThMYC9JN166794TCAAGCTACTGATAGCCACAGTTCGAATGTAGTTGGAGCAAGCT
ActinFJ618517AAACAATGGCTGATGCTGACAATACCGTGCTCAATAGG
α-tubulinFJ618518CACCCACCGTTGTTCCAGACCGTCGTCATCTTCACC
β-tubulinFJ618519GGAAGCCATAGAAAGACCCAACAAATGTGGGATGCT
Table 2. Characteristics of the five ThMYCs with a full-length open reading frame (ORF).
GenecDNA Length (bp)Mature Protein

Amino acid lengthMW (kDa)pI
ThMYC171723826.427.67
ThMYC2147949255.064.77
ThMYC448316017.895.96
ThMYC581026928.006.30
ThMYC990630131.696.19
Table 3. Relative abundances of ThMYCs in different tissues.
Relative abundance

GeneRootsStemLeaves
ThMYC1511,603.59.25778212.73741
ThMYC25248.4172.2068675.107675
ThMYC3111
ThMYC41629.2590.4666240.877619
ThMYC5321,620.52.70072.800466
ThMYC6396,510.62.0467483.219121
ThMYC785,284.741.3043521.171752
ThMYC831,916.170.6668031.085731
ThMYC914,050.091.6130512.249142

