Composition, Structure and Functional Properties of Protein Concentrates and Isolates Produced from Walnut (Juglans regia L.)

Abstract
: In this study, composition, structure and the functional properties of protein concentrate (WPC) and protein isolate (WPI) produced from defatted walnut flour (DFWF) were investigated. The results showed that the composition and structure of walnut protein concentrate (WPC) and walnut protein isolate (WPI) were significantly different. The molecular weight distribution of WPI was uniform and the protein composition of DFWF and WPC was complex with the protein aggregation. H0 of WPC was significantly higher (p < 0.05) than those of DFWF and WPI, whilst WPI had a higher H0 compared to DFWF. The secondary structure of WPI was similar to WPC. WPI showed big flaky plate like structures; whereas WPC appeared as a small flaky and more compact structure. The most functional properties of WPI were better than WPC. In comparing most functional properties of WPI and WPC with soybean protein concentrate and isolate, WPI and WPC showed higher fat absorption capacity (FAC). Emulsifying properties and foam properties of WPC and WPI in alkaline pH were comparable with that of soybean protein concentrate and isolate. Walnut protein concentrates and isolates can be considered as potential functional food ingredients.1. Introduction
Plant proteins play significant roles in human nutrition, particularly in developing countries where average protein intake is less than that required. Plant protein products are gaining increased interest as ingredients in food systems throughout many parts of the world and the final success of utilizing plant proteins as additives depends greatly upon the flavor characteristics that they impart to foods. Since oilseeds are valuable sources of lipids as well as proteins, numerous studies on protein functionality of major and minor oilseeds such as soybean [1], peanut [2], rapeseed [3], sunflower [4], almond [5], winged bean [6], ground nut [7], have been reported.
Walnuts (Juglans regia L.) are widely distributed all over the world, and they are common in China. On a global basis, walnuts rank second behind almonds in tree nut production. In 2010, global production of walnuts was 1,500,000 t. China leads the world production of walnuts, followed by the US. In 2010, China accounted for 33.33% of global walnut production. Walnuts are receiving increasing interest as a healthy foodstuff because their regular consumption has been reported to decrease the risk of coronary heart disease [8,9]. Therefore, walnuts can be utilized as ingredients of many foodstuffs such as bakery products to enhance the nutrition value and sensory properties of the final product [10]. Walnuts oil is a major product of walnut production and is one of the important special oils used for salad dressing and cooking [11]. Other proposed benefits of walnuts include their high content of protein, magnesium, copper, folic acid, potassium, fiber and vitamin E [12]. Walnuts are a good source of high quality protein and contain 18~24% protein on a dry weight basis (dwb) [13]. As a by-product of oil production, walnut protein products are therefore being considered as an additional source of plant protein for use in human food products. Walnuts nutrient composition has been investigated by several investigators [13–16]. However, functional properties of walnut protein have not been investigated. Therefore, the objective of this study was to determine the composition, structure and the functional properties of defatted walnut flour, walnut protein concentrate and walnut protein isolate. The investigated functional properties included the water solubility, emulsifying activity, emulsifying stability, foaming capacity and foam stability, fat absorption capacity, and water absorption capacity.
2. Results and Discussion
2.1. Chemical Characterization of Defatted Walnut Flour and Walnut Protein Concentrate and Isolate
The proximate composition of defatted walnut flour (DFWF), walnut protein concentrate (WPC) and walnut protein isolate (WPI) is shown in Table 1. DFWF contained 1.80% fat. It was indicated that defatted procedure could reduce the fat content of samples effectively. DFWF was used as starting material for the preparation of WPC and WPI. Protein content of DFWF, WPC and WPI was significantly different (p < 0.05), with value of 52.51%, 75.56%, 90.50%, respectively. The difference in protein content for WPC and WPI may be attributed to the extraction method used. The yield of WPI and WPC was 43.15% and 76.60%. Results indicated that the alkaline extraction-isoelectric precipitation method can improve the protein content of walnut protein products better than isoelectric precipitation process. It was suggested that walnut protein concentrate and walnut protein isolate could be considered as an additional source of plant protein in food products.
2.2. Amino Acid Analysis
Amino acid composition is an important chemical property of proteins, as it determines their nutritional value. Amino acid compositions of DFWF, WPI and WPC are presented in Table 2. When comparing the amino acid composition of DFWF, WPI and WPC with the FAO/WHO [17] recommended pattern, it appeared that the DFWF essential amino acids content was higher than the values recommended for a pre-school child (2~5 years old), except for lysine, phenylalanine and methionine. It also appeared that lysine was the first limiting amino acid in both walnut protein products, with values of 2.01 g/100 g protein (WPC) and 2.13 g/100 g protein (WPI), respectively, which was in accordance with cashew nut, pine nut and hazelnut [17]. DFWF lysine and phenylalanine content was higher than that of WPI, which was also higher than that of WPC. This was the consequences of alkaline treatments and isoelectric precipitation, as these can cause chemical modifications of some amino acid residues [18]. In addition, DFWF, WPC and WPI contained high level of isoleucine, with value of 3.28 g/100 g protein, 3.03 g/100 g protein, 3.99 g/100 g protein, respectively. Compared to the FAO/WHO (1990) recommended pattern for adult, DFWF, WPC and WPI were only deficient in methionine. From these results we conclude that DFWF, WPC and WPI could be a good resource of essential amino acids for adults. Therefore, DFWF, WPC and WPI could be considered as a rich resource of vegetable protein as soy protein in human nutrition.
2.3. SDS-PAGE
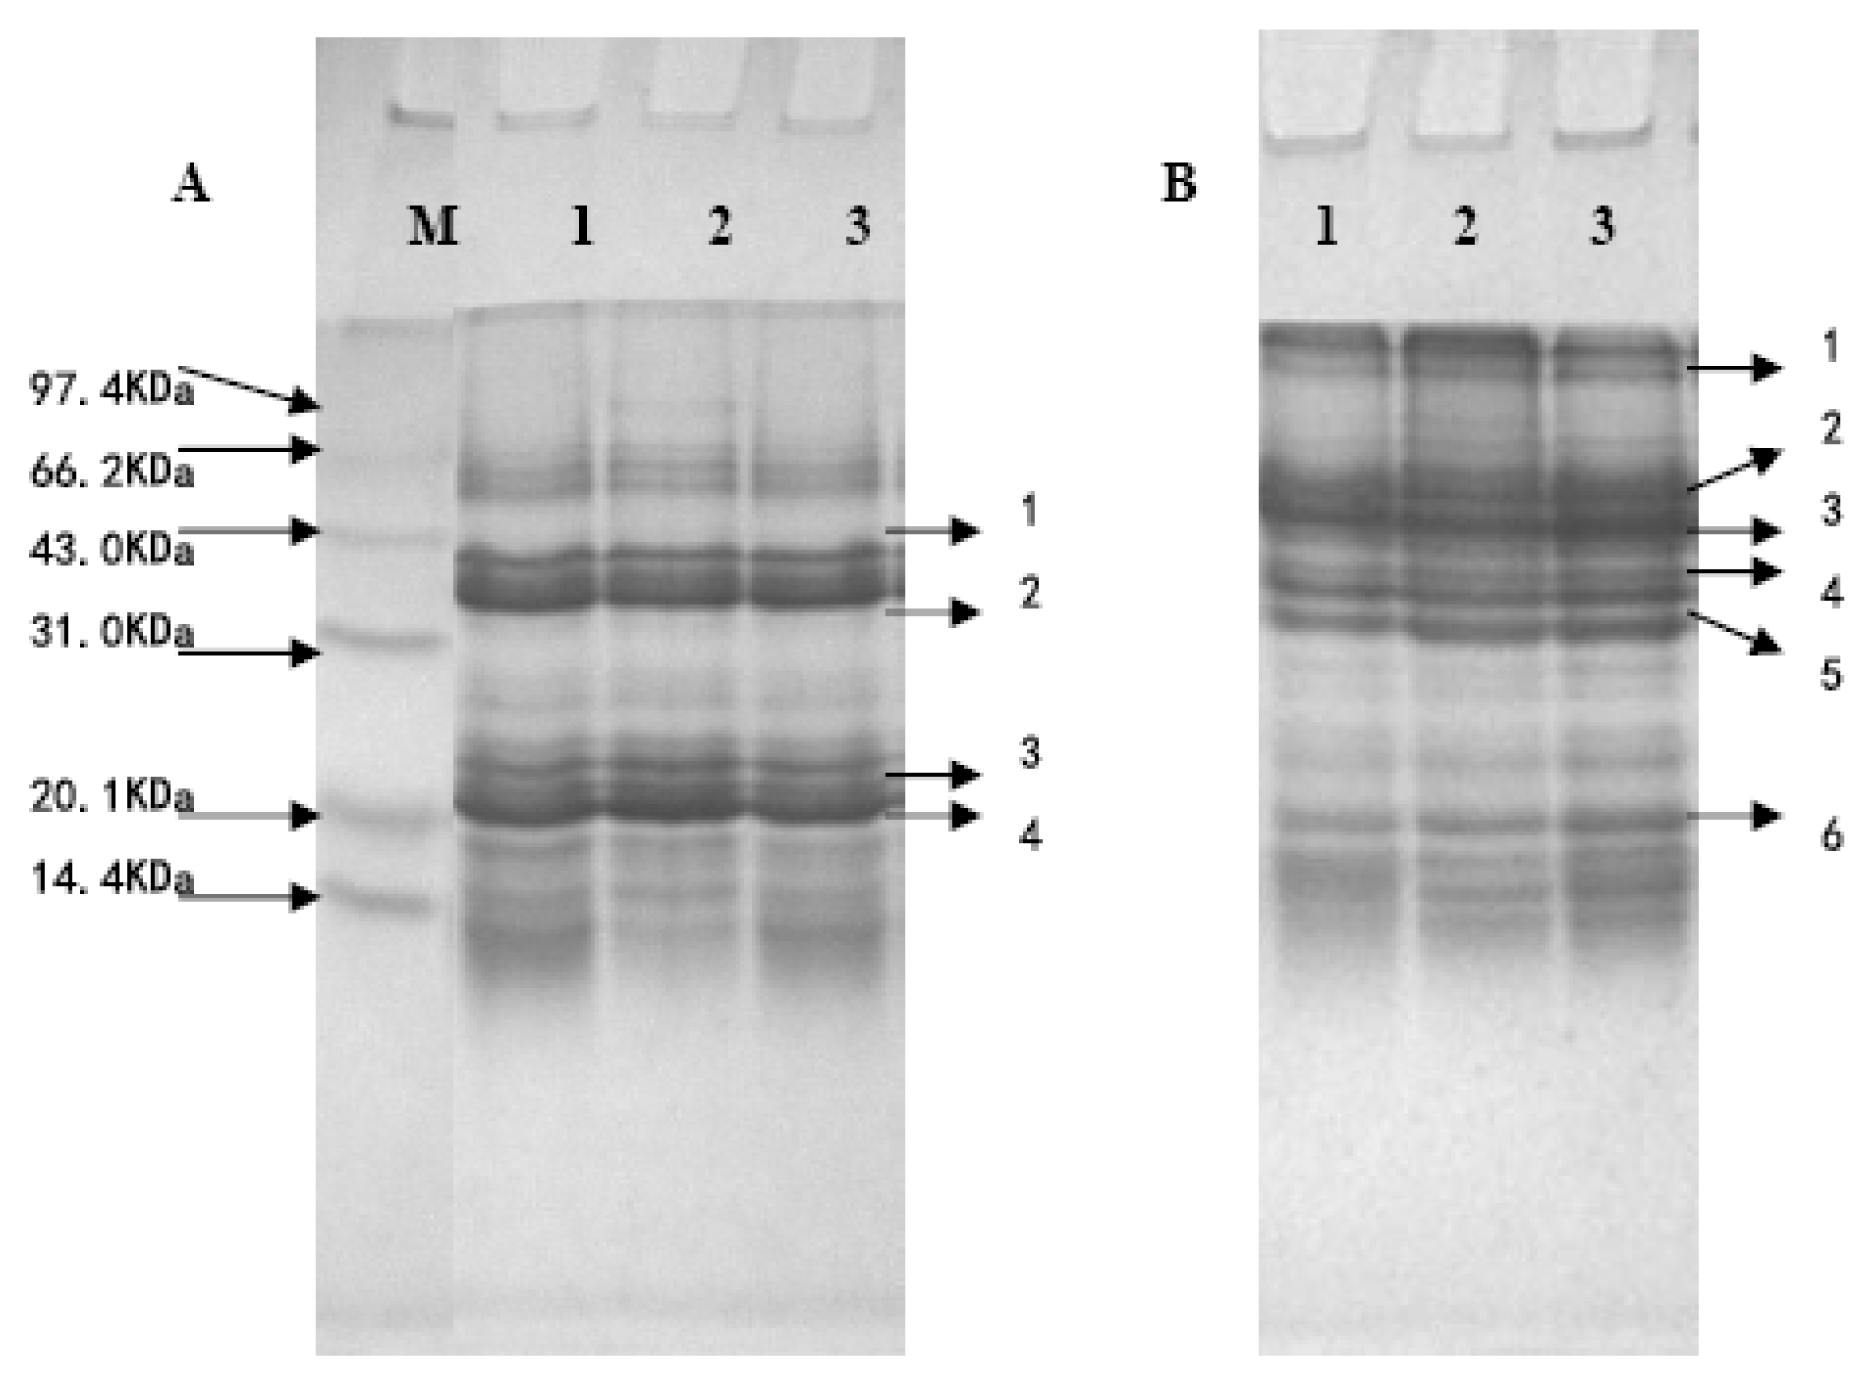
The non-reduced (without β-mercaptoethanol) and reduced (with β-mercaptoethanol) SDS-PAGE patterns for defatted walnut flour (DFWF), walnut protein isolate (WPI) and walnut protein concentrate (WPC) were presented in Figure 1. There was a noticeable difference on SDS-PAGE profiles between the non-reduced and reduced state. Following electrophoresis, DFWF, WPC and WPI showed more than 6 subunits at 110 KDa, 70 KDa, 55 KDa, 40 KDa, 35 KDa, 20 KDa (Figure 1B). Meanwhile, DFWF, WPC and WPI showed 4 polypeptides at 40 KDa, 35 KDa, 23 KDa, 20 KDa (Figure 1A). The results were similar to the reports by Sze-Tao and Sathe [13]. In contrast, the three major bands with molecular weight at 40 KDa, 35 KDa, 20 KDa were not affected by the presence of β-mercaptoethanol. Moreover, SDS-PAGE profiles showed no major qualitative differences among DFWF, WPC and WPI, which indicated that alkaline extraction-isoelectric precipitation technique and isoelectric precipitation technique did not change the protein composition. Also, this result suggested that bonded disulfide was associated with walnut protein and this may be due to the low NSI of DFWF, WPC and WPI.
2.4. High Performance Size Exclusion Chromatography
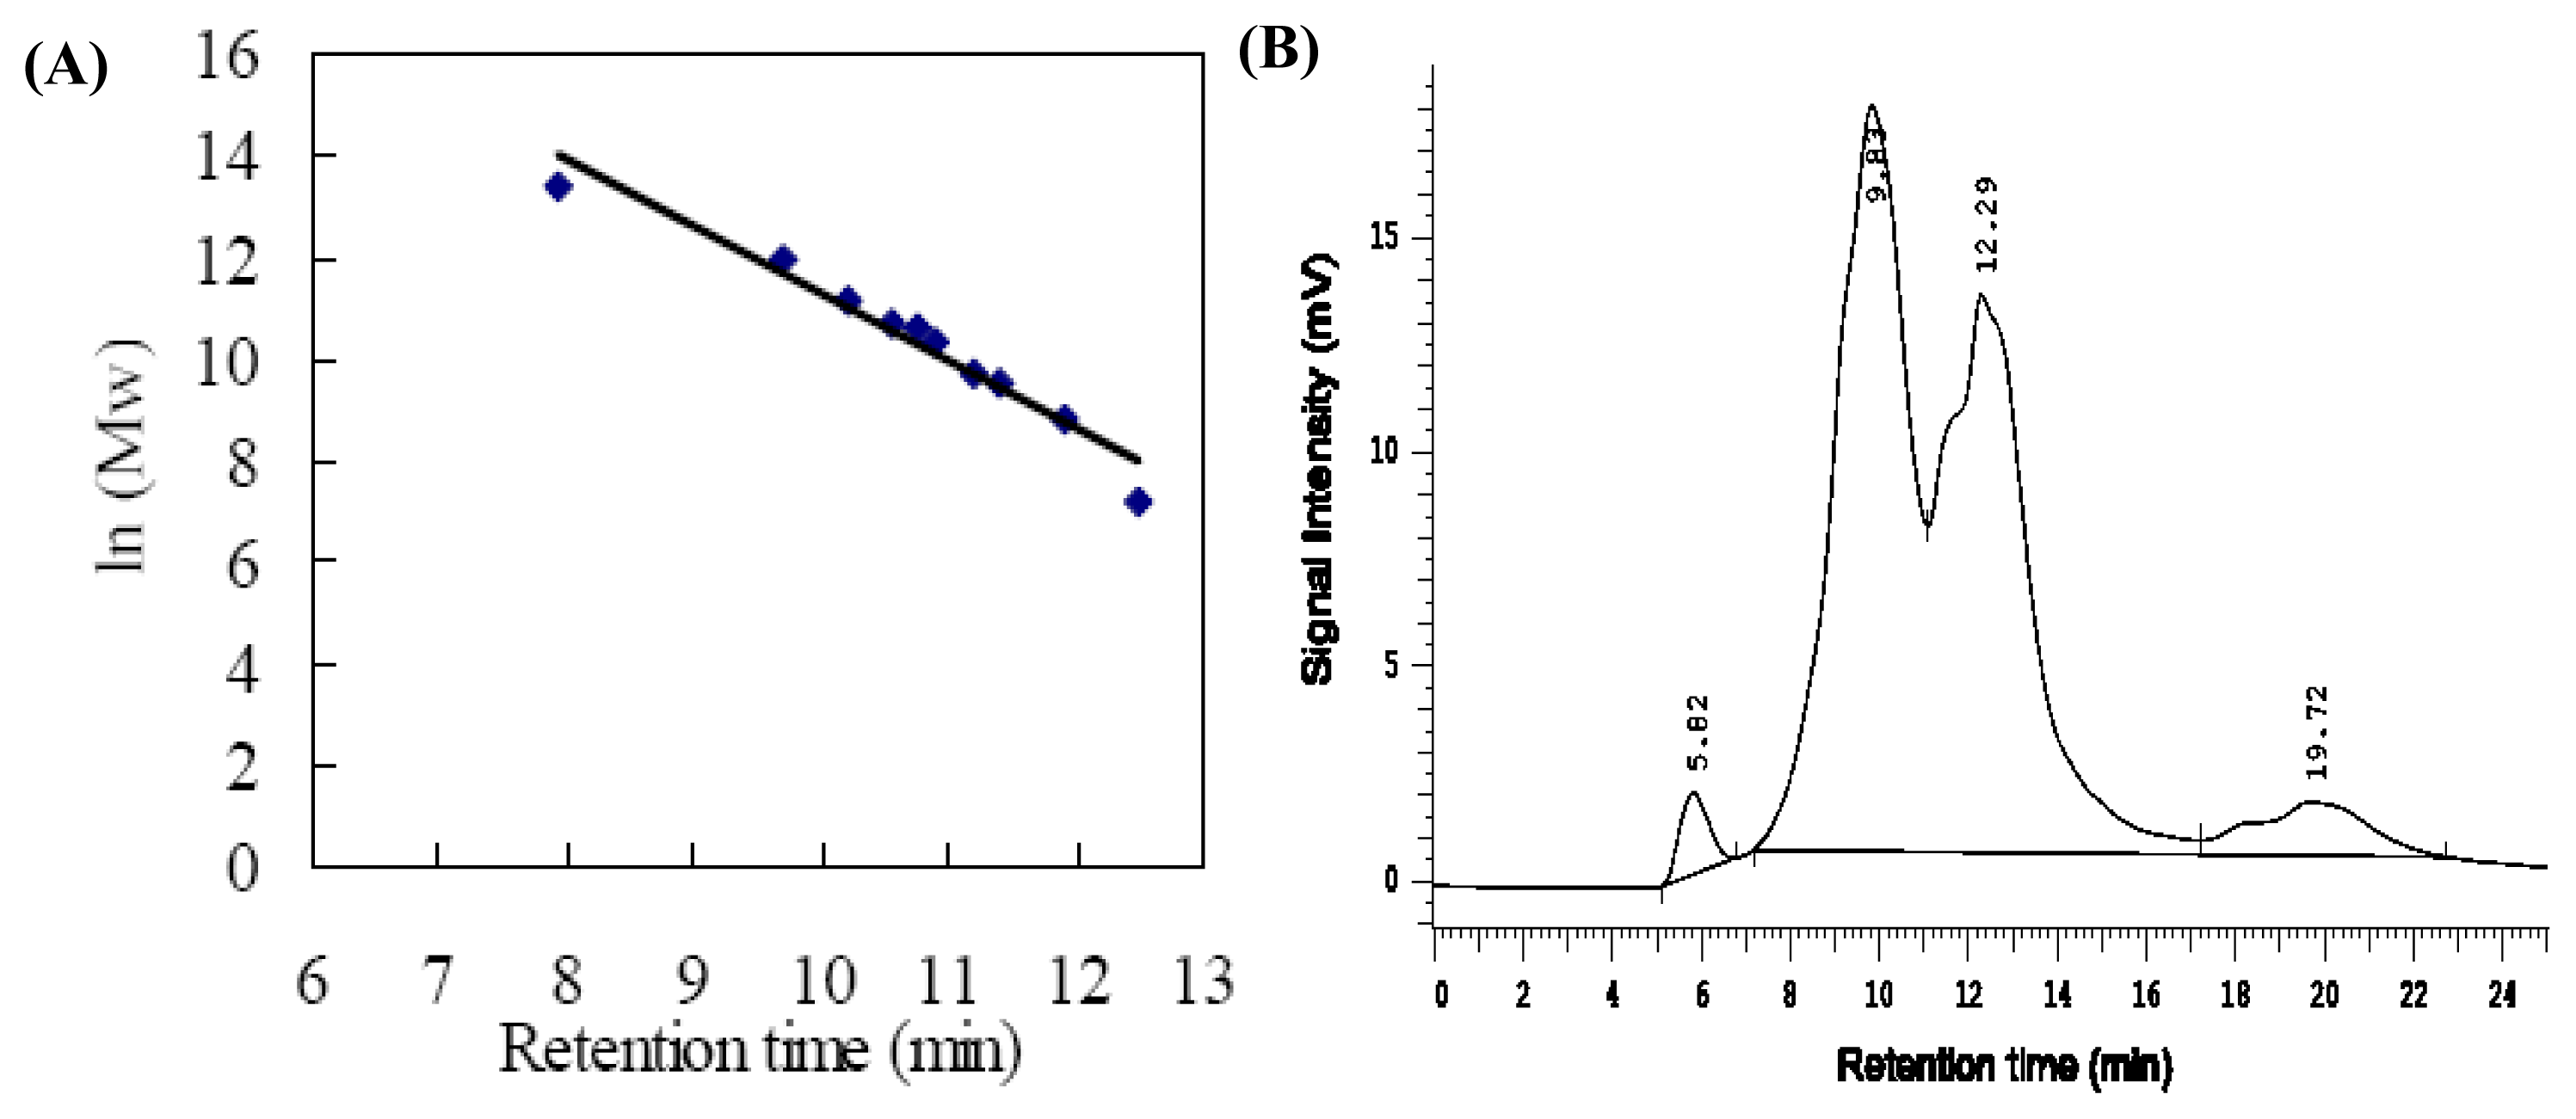
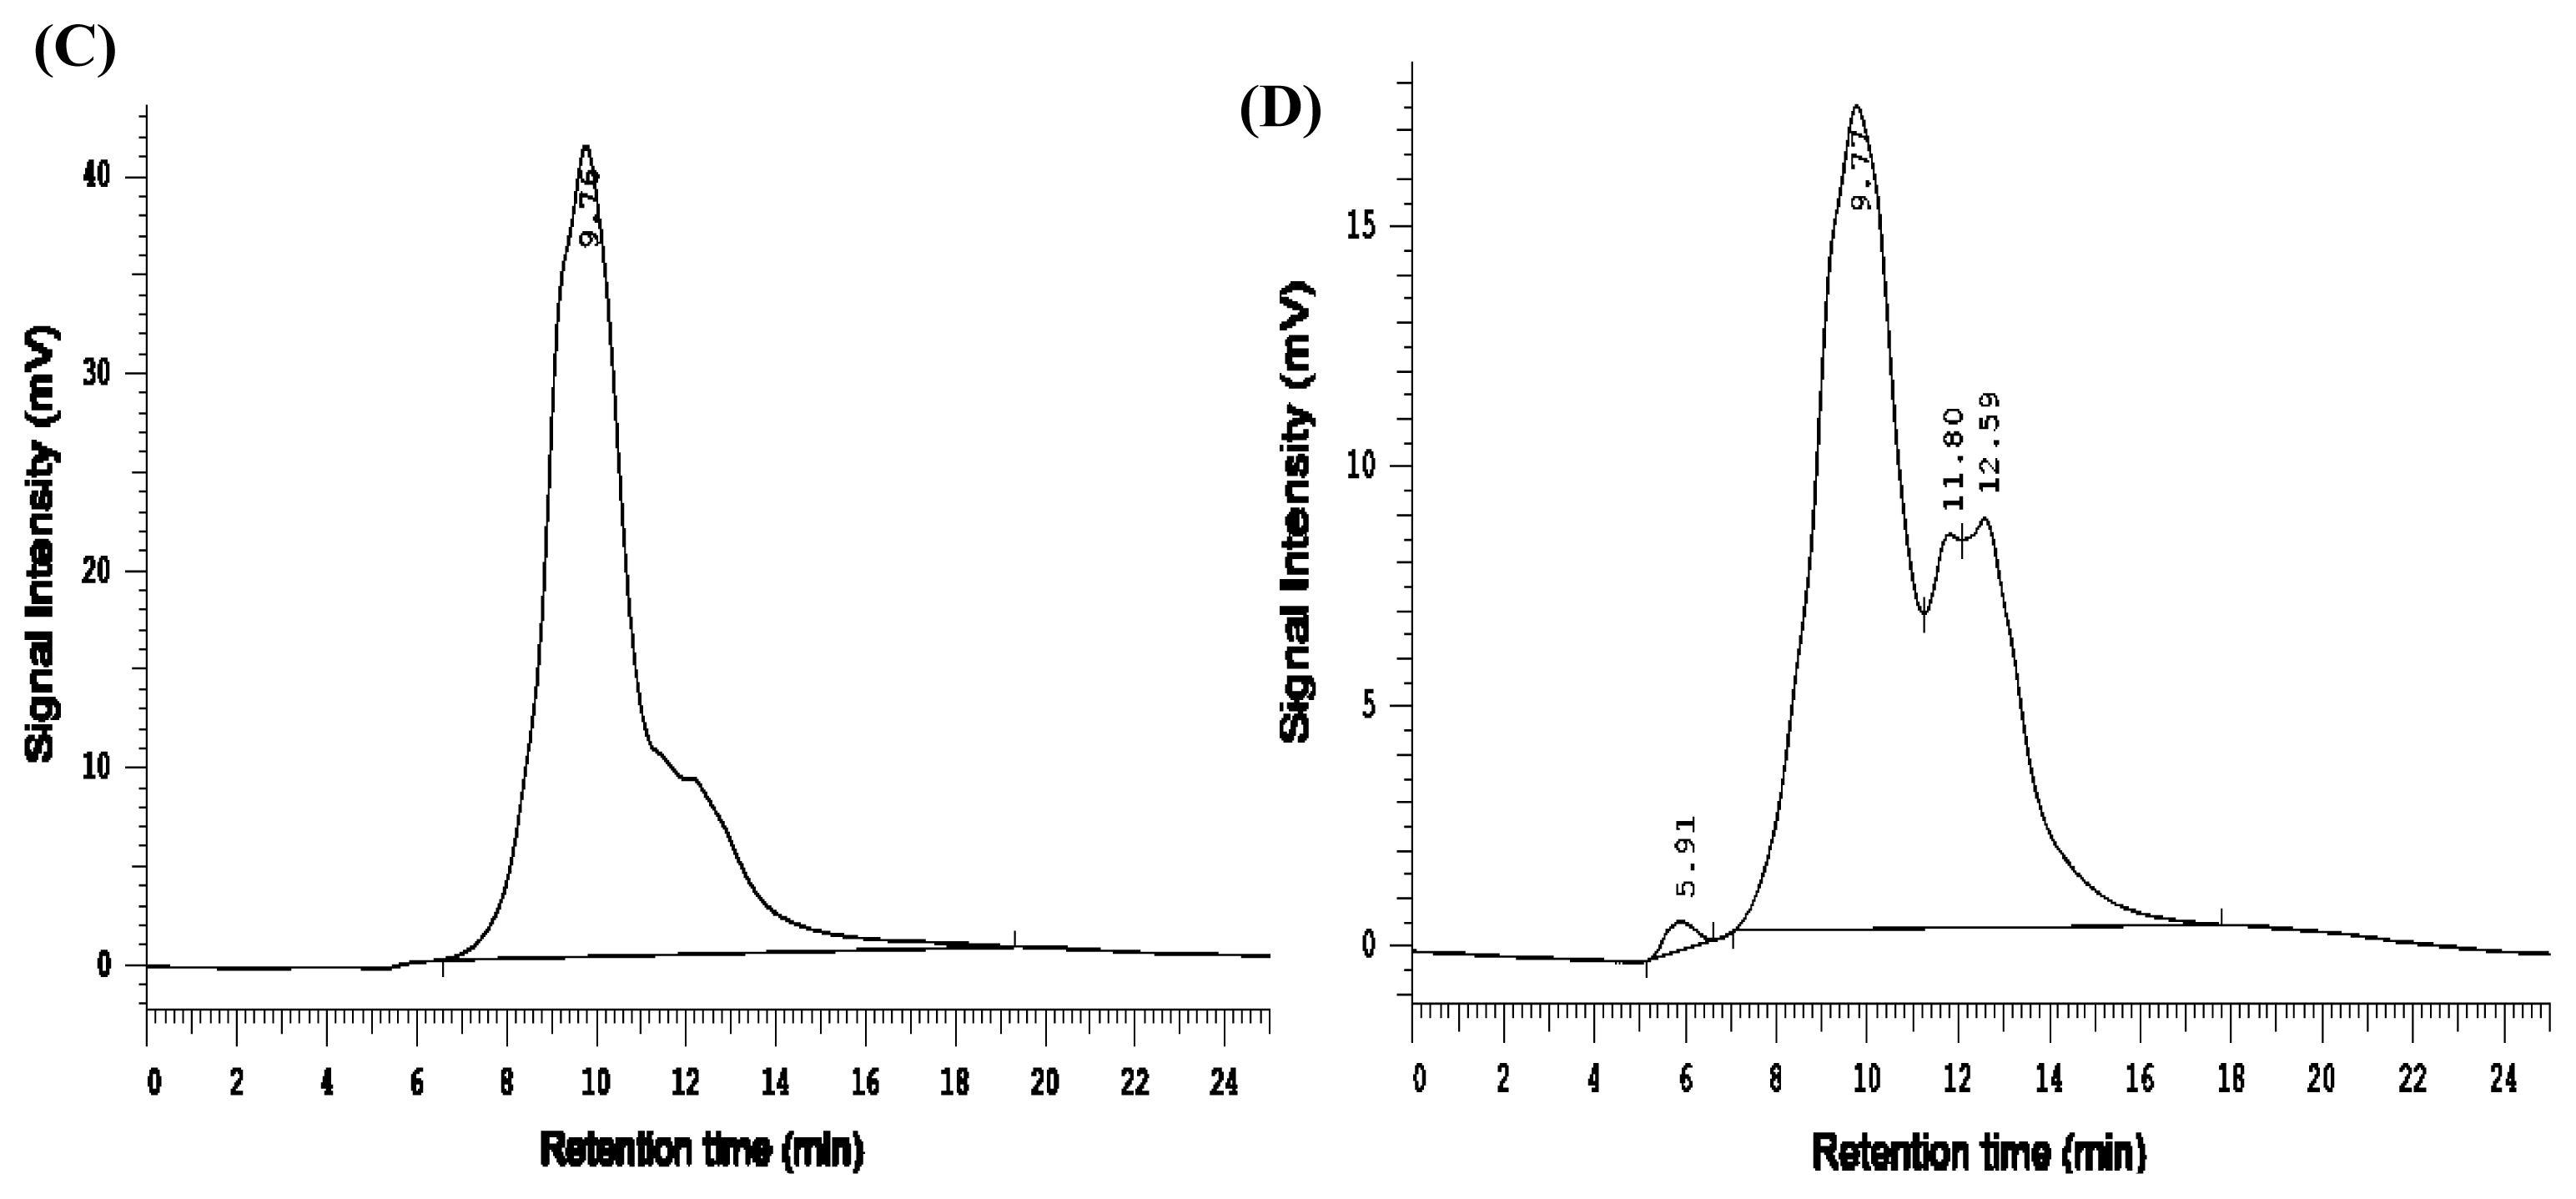
The size exclusion chromatogram using a high-performance liquid chromatogram system was used to study molecular weight distribution of walnut proteins and the results were shown in Figure 2. Molecular weight was estimated from the calibration curve of standard protein for the column (Figure 2A). DFWF showed four peaks with the retention time around 5.82 min, 9.83 min, 12.29 min, 19.72 min, corresponding to the molecular weight of 18,824 KDa, 96.99 KDa, 3.83 KDa (Figure 2B). The peak of 18,824 KDa may mark the protein aggregation of DFWF. WPI showed one peak with molecular weight of 106.33 KDa (Figure 2C). WPC showed four peaks with molecular weight of 16,725 KDa, 104.943 KDa, 7.3 KDa, 2.6 KDa, respectively (Figure 2D). There were minor differences in protein composition between DFWF, WPC and WPI. It was suggested that the protein composition of WPI was uniform and the protein composition of DFWF and WPC was complex with the protein aggregation. The results indicated that alkaline extraction-isoelectric precipitation technique could obtain uniform protein products without protein aggregation better than the isoelectric precipitation technique. However, the two peaks with the retention time around 9 min and 12 min were the main protein composition of DFWF, WPC and WPI. This result can explain why SDS-PAGE profiles showed no major qualitative differences among DFWF, WPC and WPI.
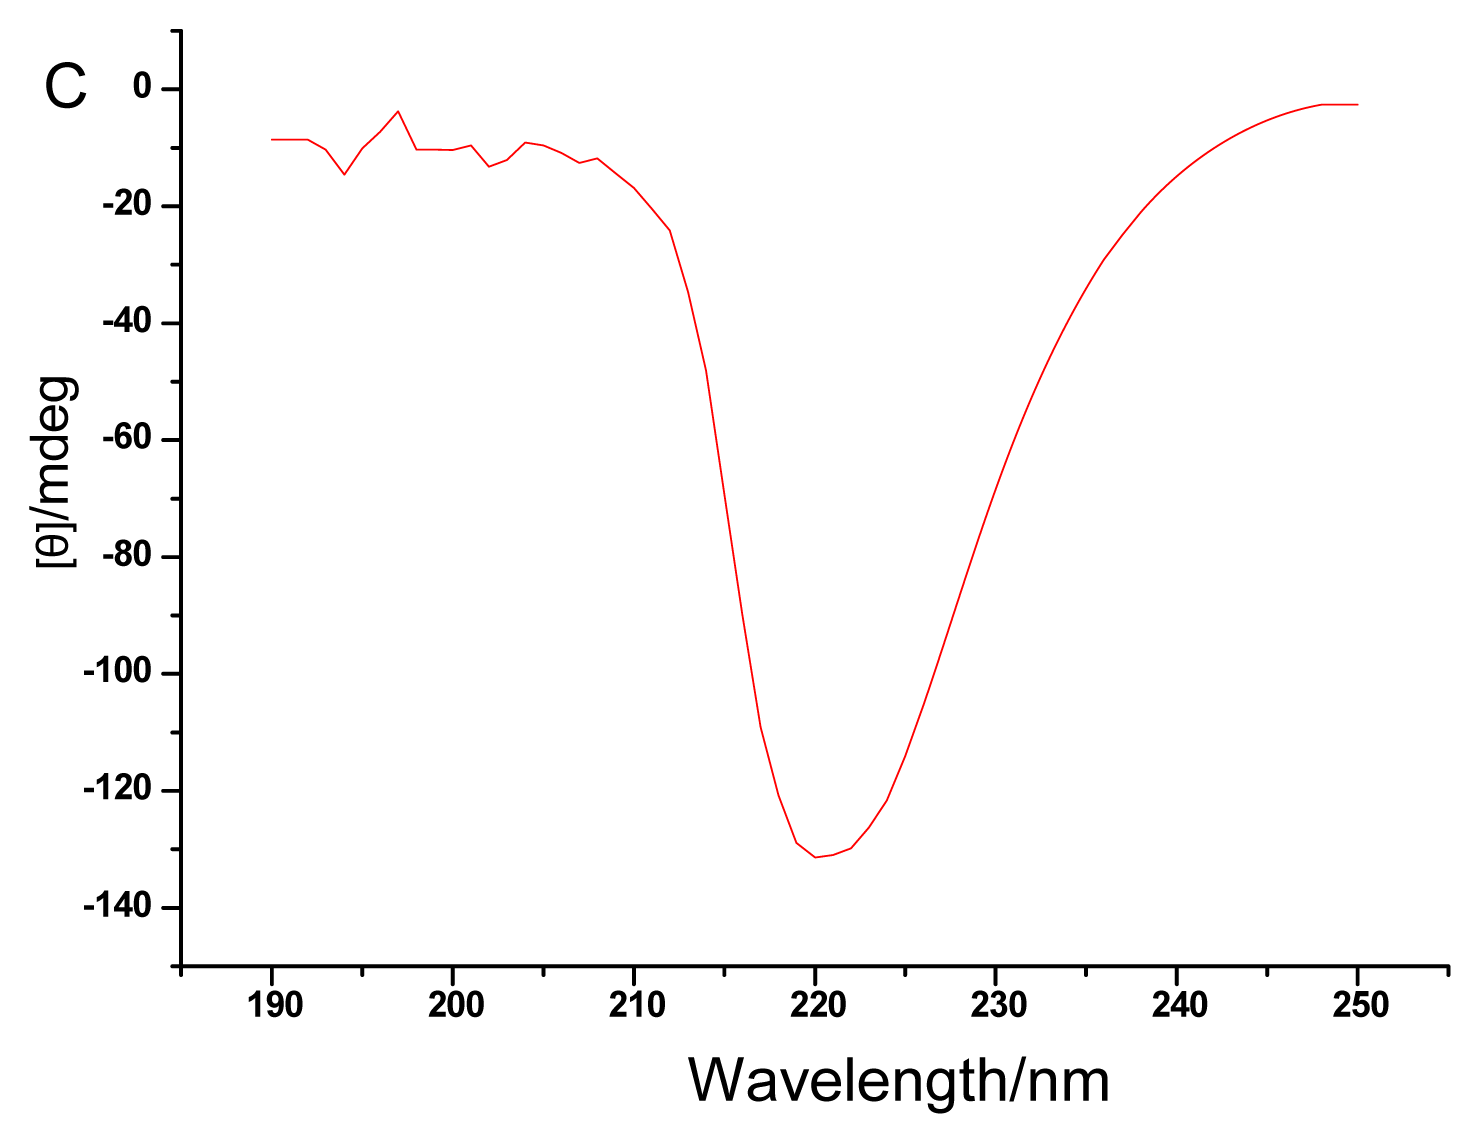
2.5. Circular Dichroism Spectra
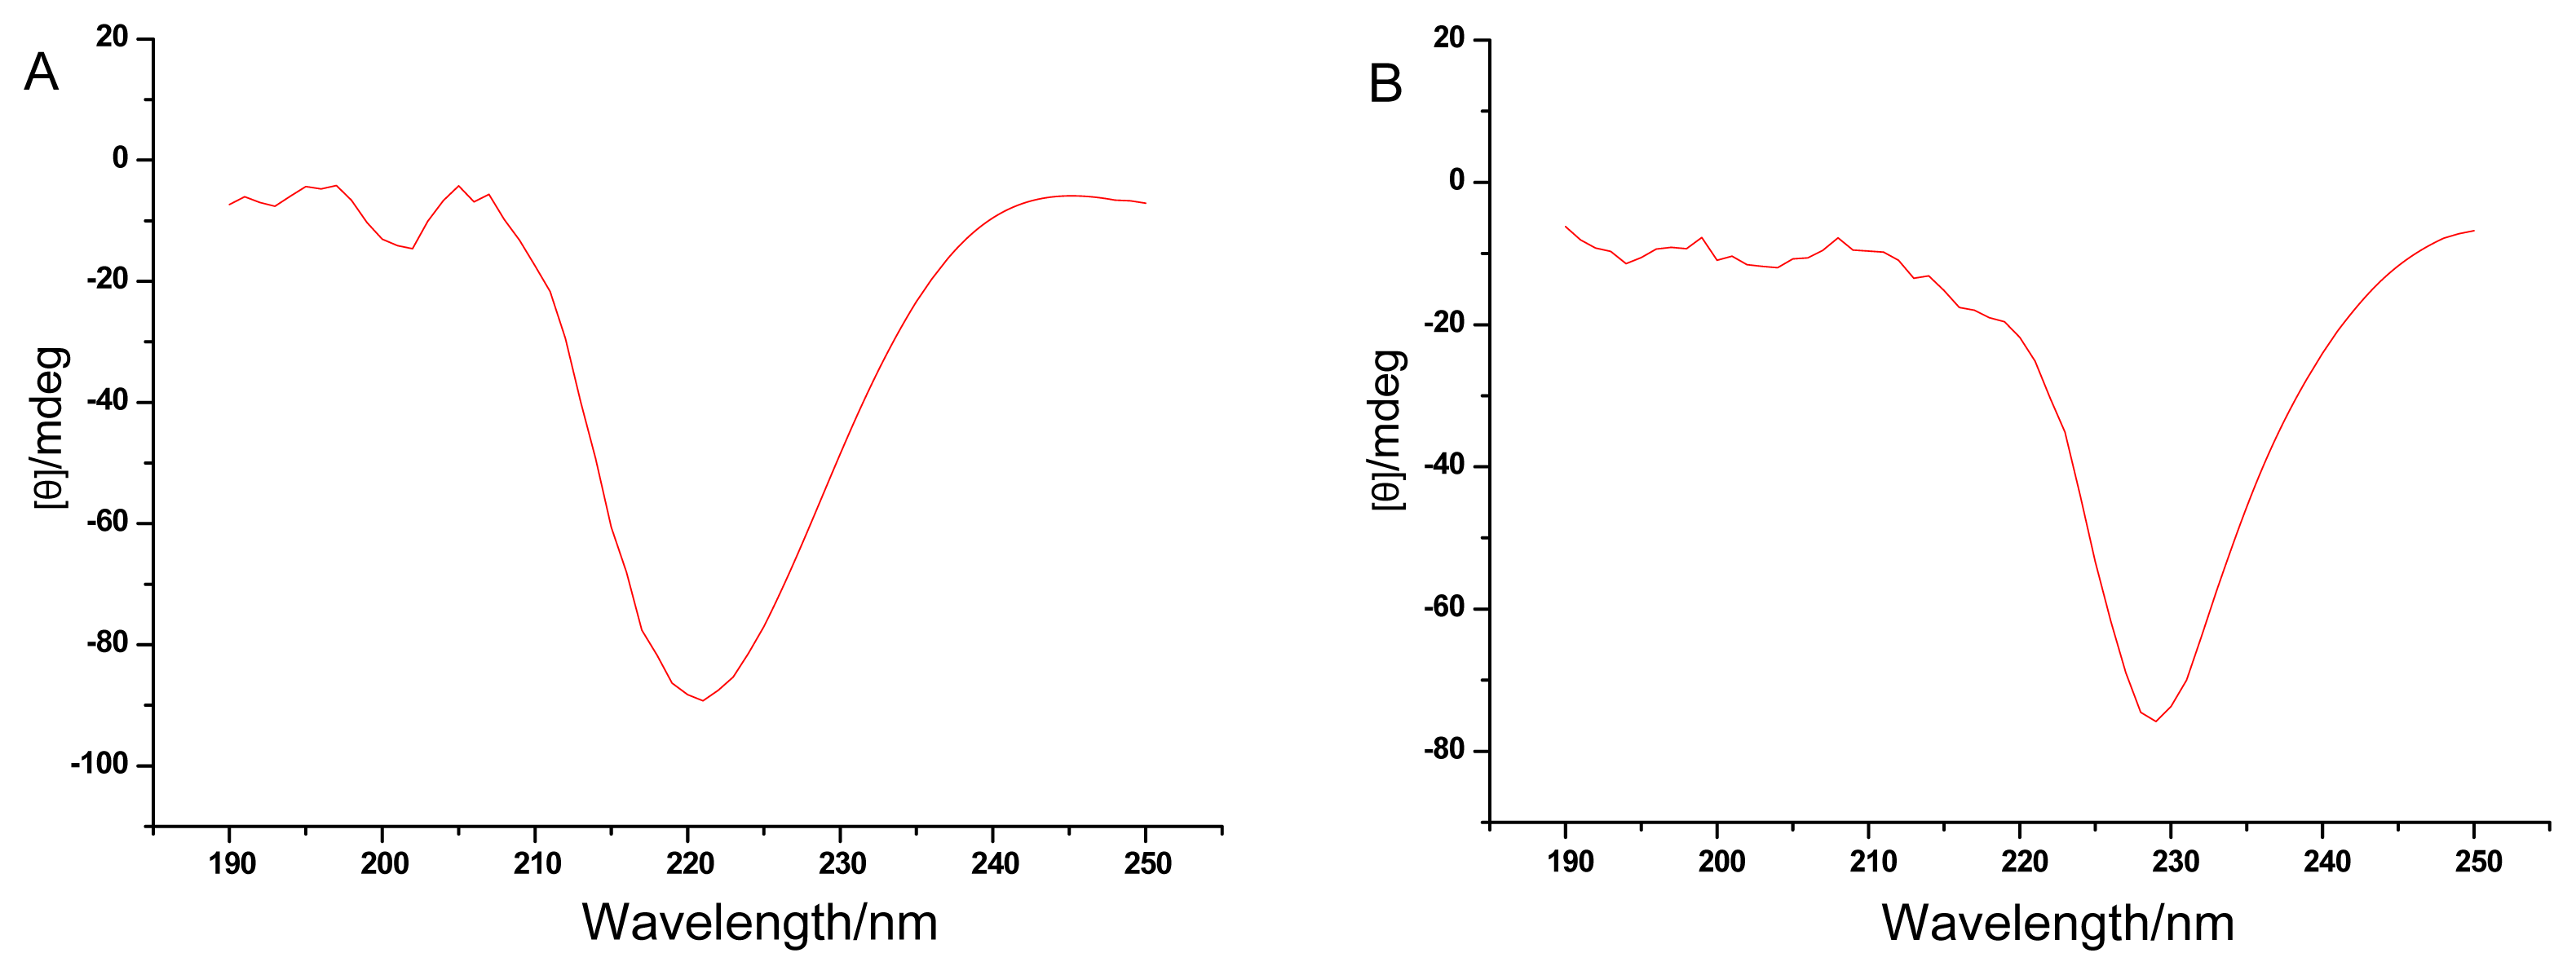
The CD spectra are remarkably sensitive to the secondary structures of proteins. Far-UV CD spectra of the DFWF, WPC and WPI were shown in Figure 3. Far-UV CD spectra of DFWF differed for WPI and WPC. DFWF was calculated composed of 80.4% α-helix, 4% β-sheet, 5.7% β-turn and 15.3% random coil by the computer program. The secondary structure estimation of WPI revealed 34.9% α-helix, 11% β-sheet, 23.3% β-turn and 32% random coil, which was similar to that of WPC. WPC and WPI contained more β-turn, random coil and less α-helix than DFWF, which suggested that WPC and WPI had lost its ordered secondary structure. The results indicated that alkaline extraction-isoelectric precipitation technique and isoelectric precipitation technique changed the secondary structure of walnut protein. This may be due to the higher NSI of WPI and WPC than in DFWF.
2.6. Surface Hydrophobicity
The elevated surface hydrophobicity (H0) value is indicative of high solubility, negligible aggregation, and prospect for exposure of hydrophobic components that are otherwise buried inside the globular structure of the protein due to denaturation. The surface hydrophobicity (H0) of protein concentrate, isolate and defatted flour of walnut were presented in Table 3. The results showed that H0 of WPC (315.39) in the present study was significantly higher (p < 0.05) than those of DFWF and WPI, whilst WPI had a higher H0 (276.51) compared to DFWF (223.83). Significant changes occurred on the H0 of walnut protein isolate and concentrate due to the isolation procedures. Meanwhile, isoelectric precipitation technique can increase the surface hydrophobicity of WPC better than that of WPI produced by alkaline extraction-isoelectric precipitation technique. The H0 of DFWF, WPC and WPI were higher than that of soy protein isolate (SPI) (206.76), reported by Ke-Xue Zhu et al. [19]. Generally, high H0 is considered a contributing factor to higher protein foaming capacity where this property is needed for a specific food product application [20].
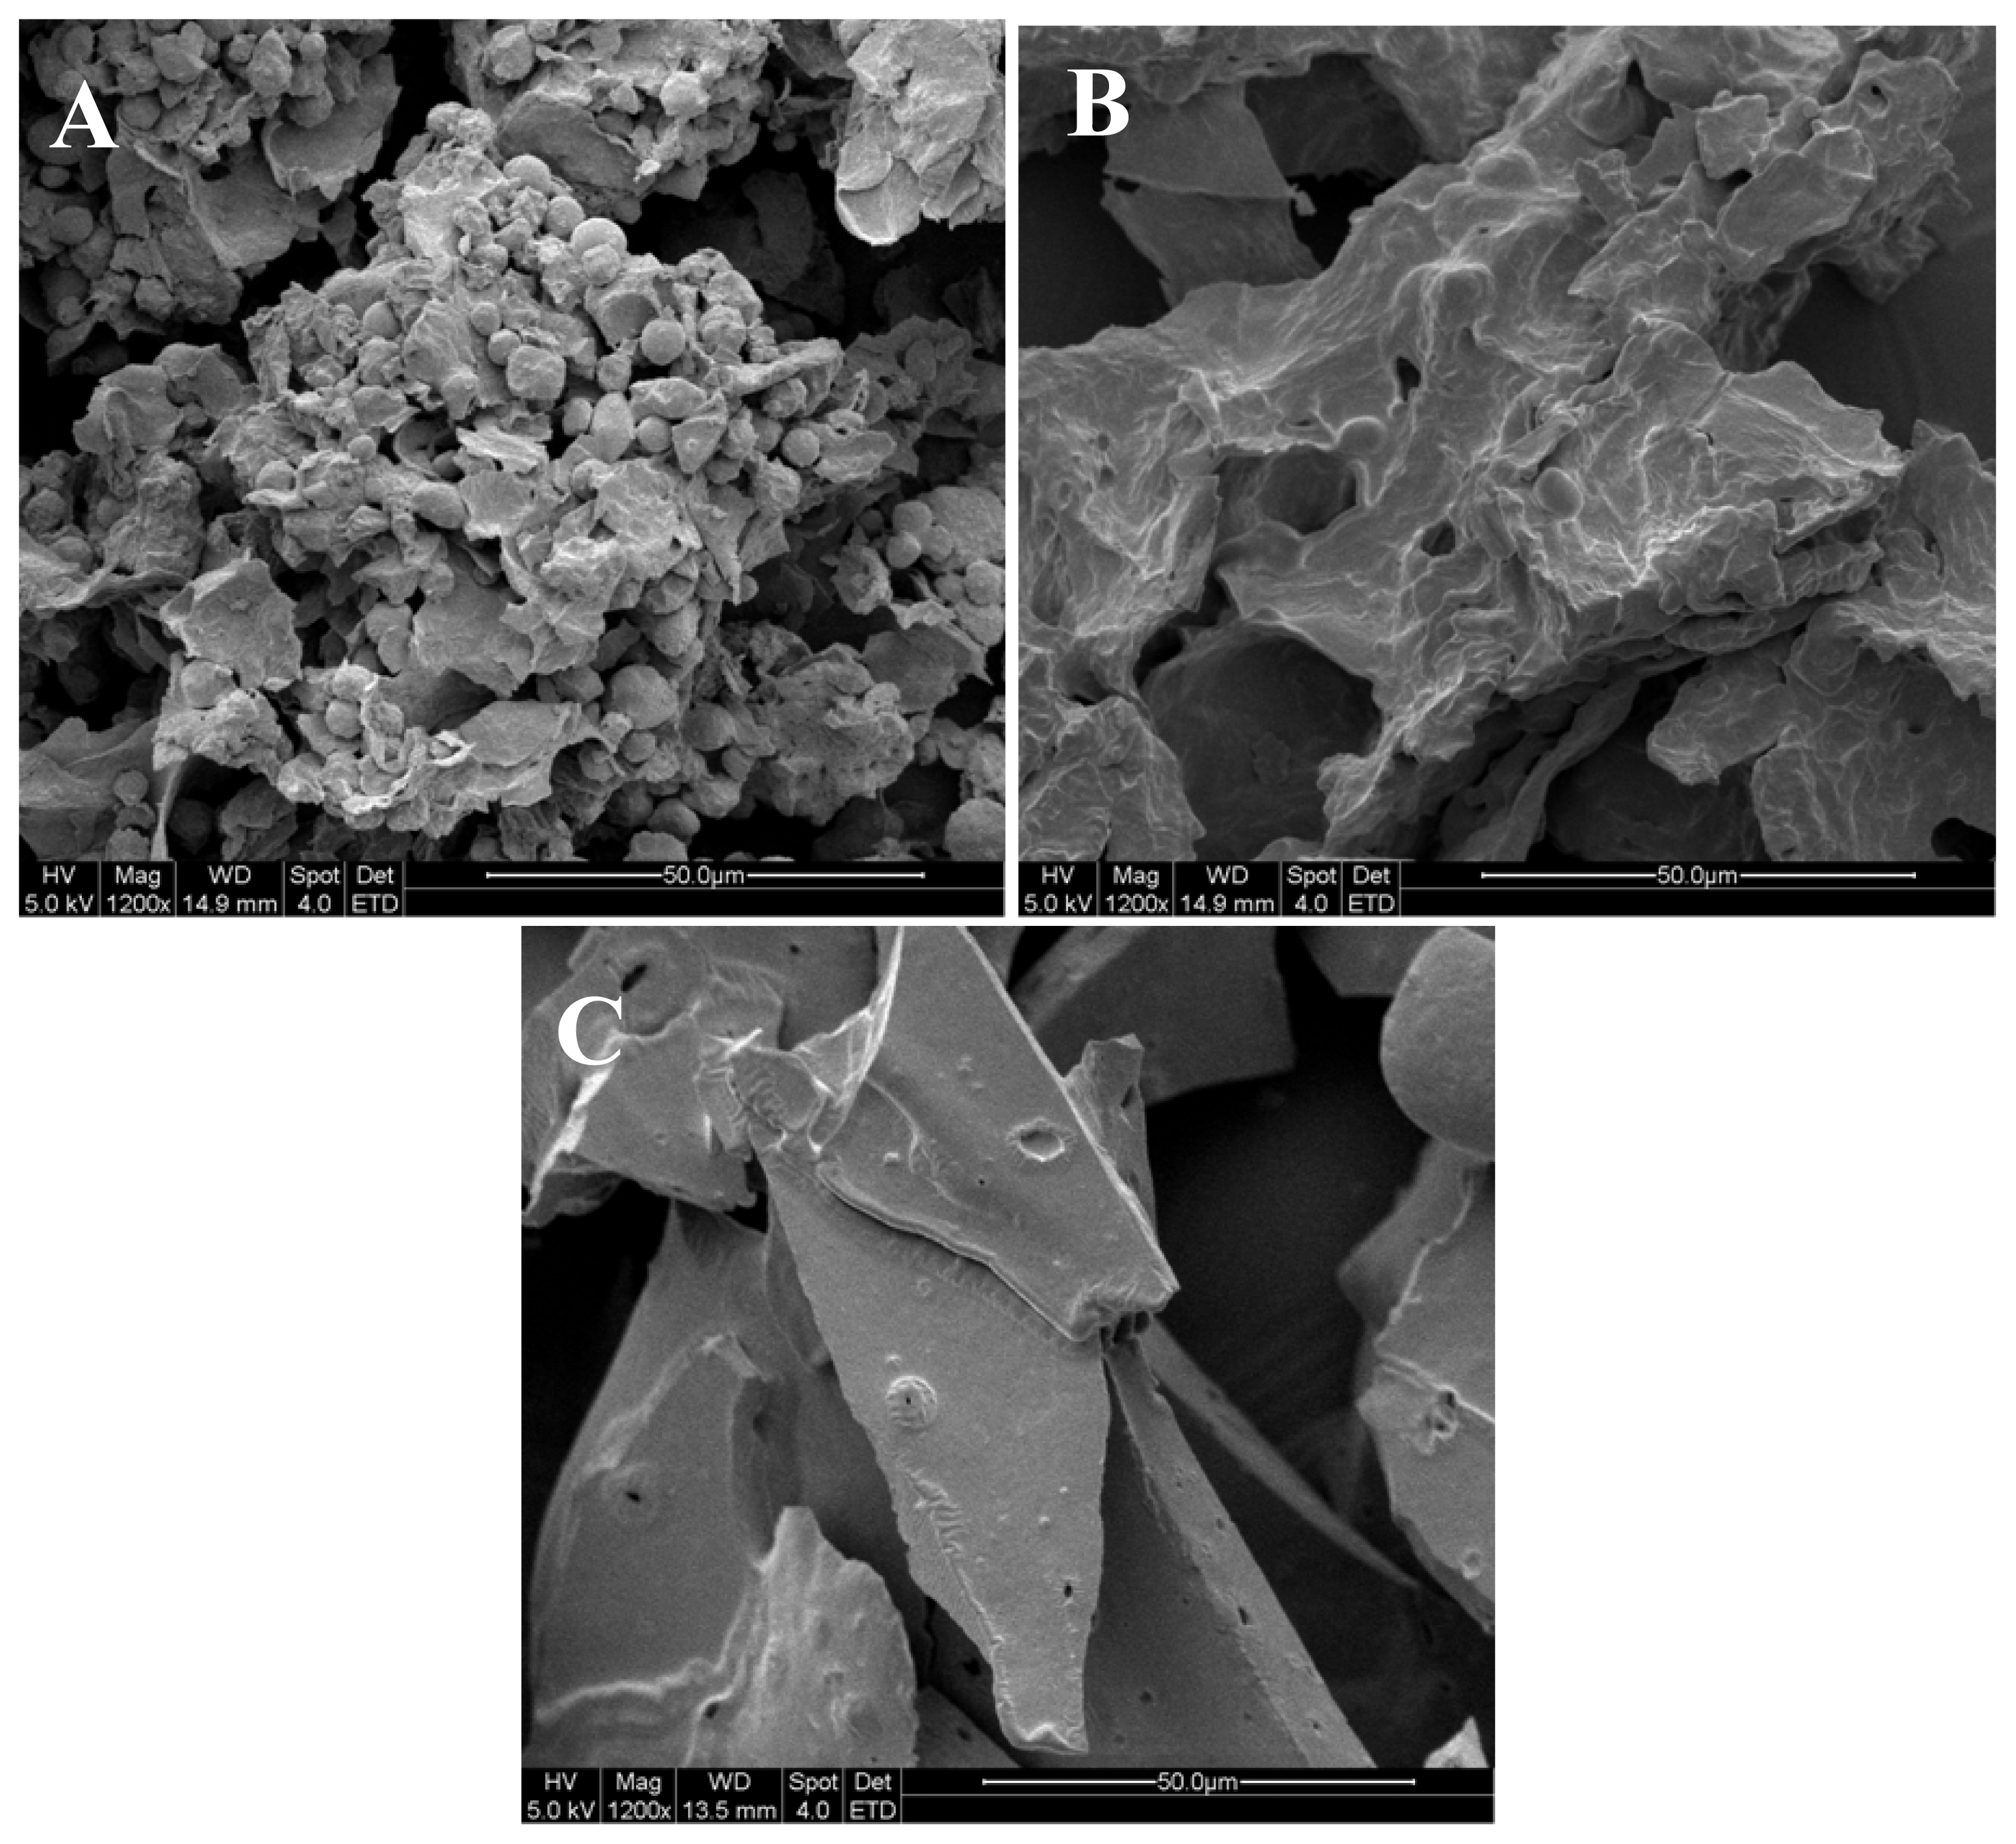
2.7. Microstructure
Structural morphology of the proteins was studied with the aid of scanning electron microscope (SEM). SEM pictures of defatted walnut flour (DFWF), walnut protein isolate (WPI) and walnut protein concentrate (WPC) (Figure 4) showed distinct surface structures. The WPI showed big flaky plate like structures; whereas WPC appeared as a small flaky and more compact structure. As DFWF consists of entire protein components, their morphological structure showed the mixture of fat particles and small flaky plate shapes. The results indicated that alkaline extraction-isoelectric precipitation technique and isoelectric precipitation technique changed the microstructure of walnut protein. It was suggested that the big flaky plate like structures of WPI further contributes to improve the solubility (Figure 5). The different microstructure of DFWF, WPC and WPI may contribute to the overall physiochemical and functional properties of walnut protein.
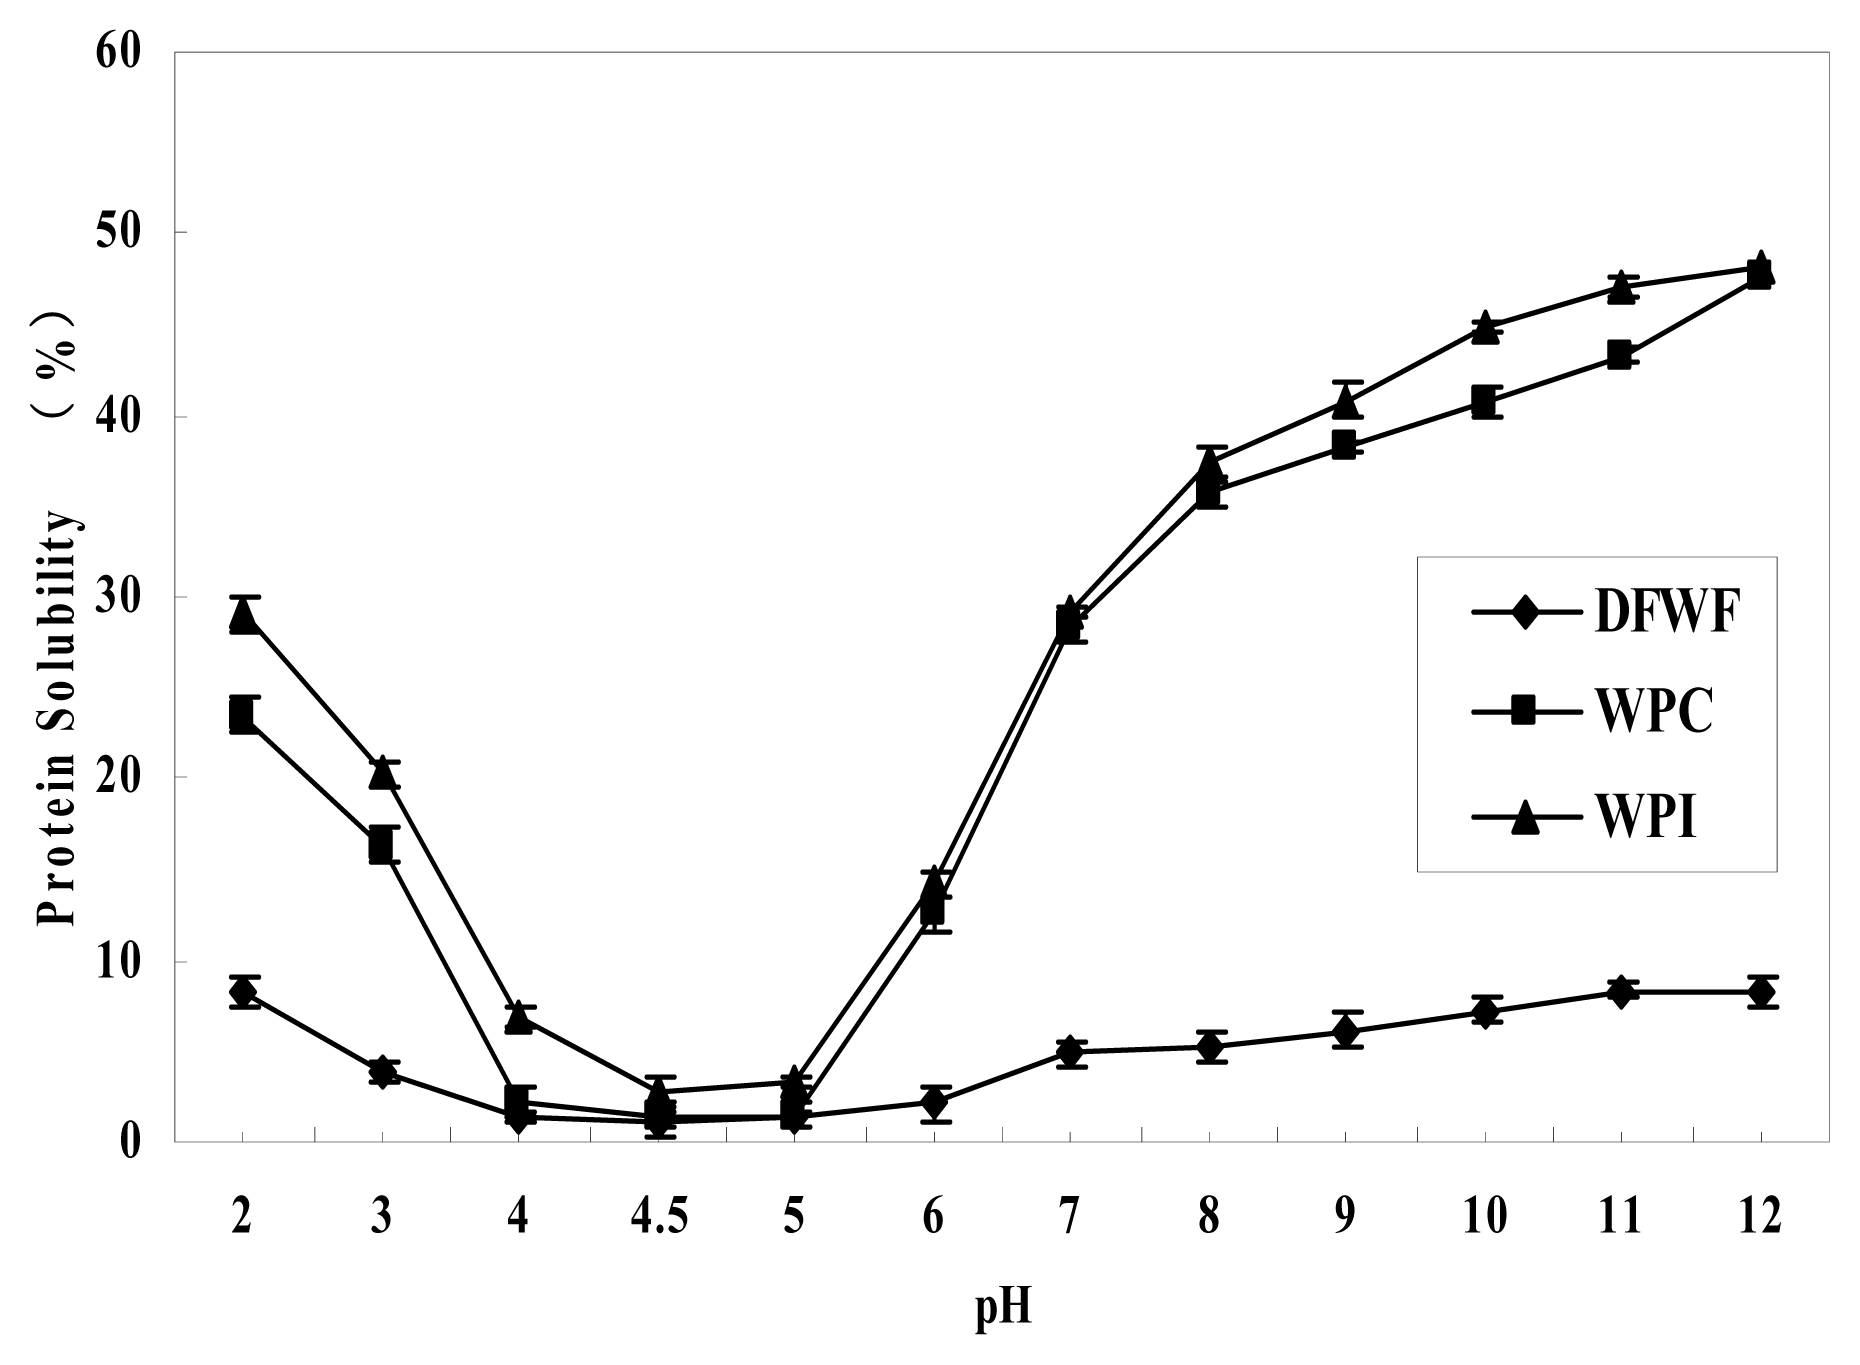
2.8. Protein Solubility
The protein pH-solubility profiles of DFWF, WPC and WPI were shown in Figure 5. The protein solubility of DFWF, WPC and WPI in water at different pH (2.0–12.0) showed the same U-shaped curves (Figure 5), similar to the protein solubility profiles reported for peanut proteins [2] and for cashew nuts [21]. Protein solubility of WPI, WPC and DFWF were significantly different (p < 0.05) and it was minimal for both samples in the range of 2.0–4.5 and then increased as the sample pH increased. Similar results were also observed in walnut protein as reported by Sze-Tao and Sathe [13]. DFWF, WPC and WPI presented minimum proteins solubility at pH 4.5 with values of 1.02%, 1.31% and 2.88%, respectively, and maximum protein solubility at pH 12 with values of 8.34%%, 47.54% and 48.23%, respectively. This helped to indicate the protein isoelectric point as, generally, solubility decreases as the pH increases until it reaches the isoelectric point and then increases. The loss of electrostatic repulsive forces provides beneficial conditions for the formation of protein aggregates; high bulk density and large diameter of the aggregates results in precipitation of protein [22]; then the protein solubility increases with further increase of pH. Electrostatic repulsive forces between the positively charged proteins help to keep them apart and increase protein-solvent interactions. Moreover, the protein solubility of WPC and WPI were significantly higher (p < 0.05) than that of DFWF at all pH; these results were similar to the behavior observed in the protein solubility of defatted cashew nut powder, cashew nut protein concentrate and isolate reported by Semiu Olalekan Ogunwolu et al. [21]. However, the protein solubility of DFWF, WPC and WPI were lower than that of peanut protein isolate (60.5%), soy protein isolate (71.7%) as reported by Yu et al. [2], and Molina et al. [23], respectively. Walnut proteins were less soluble in water because they are mainly composed of glutelin [13]. In addition, the surface hydrophobicity contributed to the difference in walnut protein solubility. Solubility profile over a range of pH values is being used increasingly as a guide to protein functionality, since this relates directly to many important properties, e.g., use in beverages, emulsification, foaming capacity and gelation [24].
2.9. Emulsifying Properties
Emulsifying properties results of all the samples are presented in Table 3. At pH 7, the emulsifying activity (EA) of DFWF, WPC and WPI was significantly different (p < 0.05), with values of 53.28%, 52.98%, 50.01%, respectively. However, the emulsion stability (ES) of WPI was the highest (30.30%) and that of WPC was higher (27.45%) than that of DFWF (25.26%), being significantly different (p < 0.05). The results were in agreement with Chove et al. [25], who stated that the emulsifying capacity of proteins tends to decrease as protein concentration is increased and this was also consistent with the results reported on winged bean protein concentrate [26], sunflower protein isolate [27] and cashew nut protein concentrate and isolate [21].
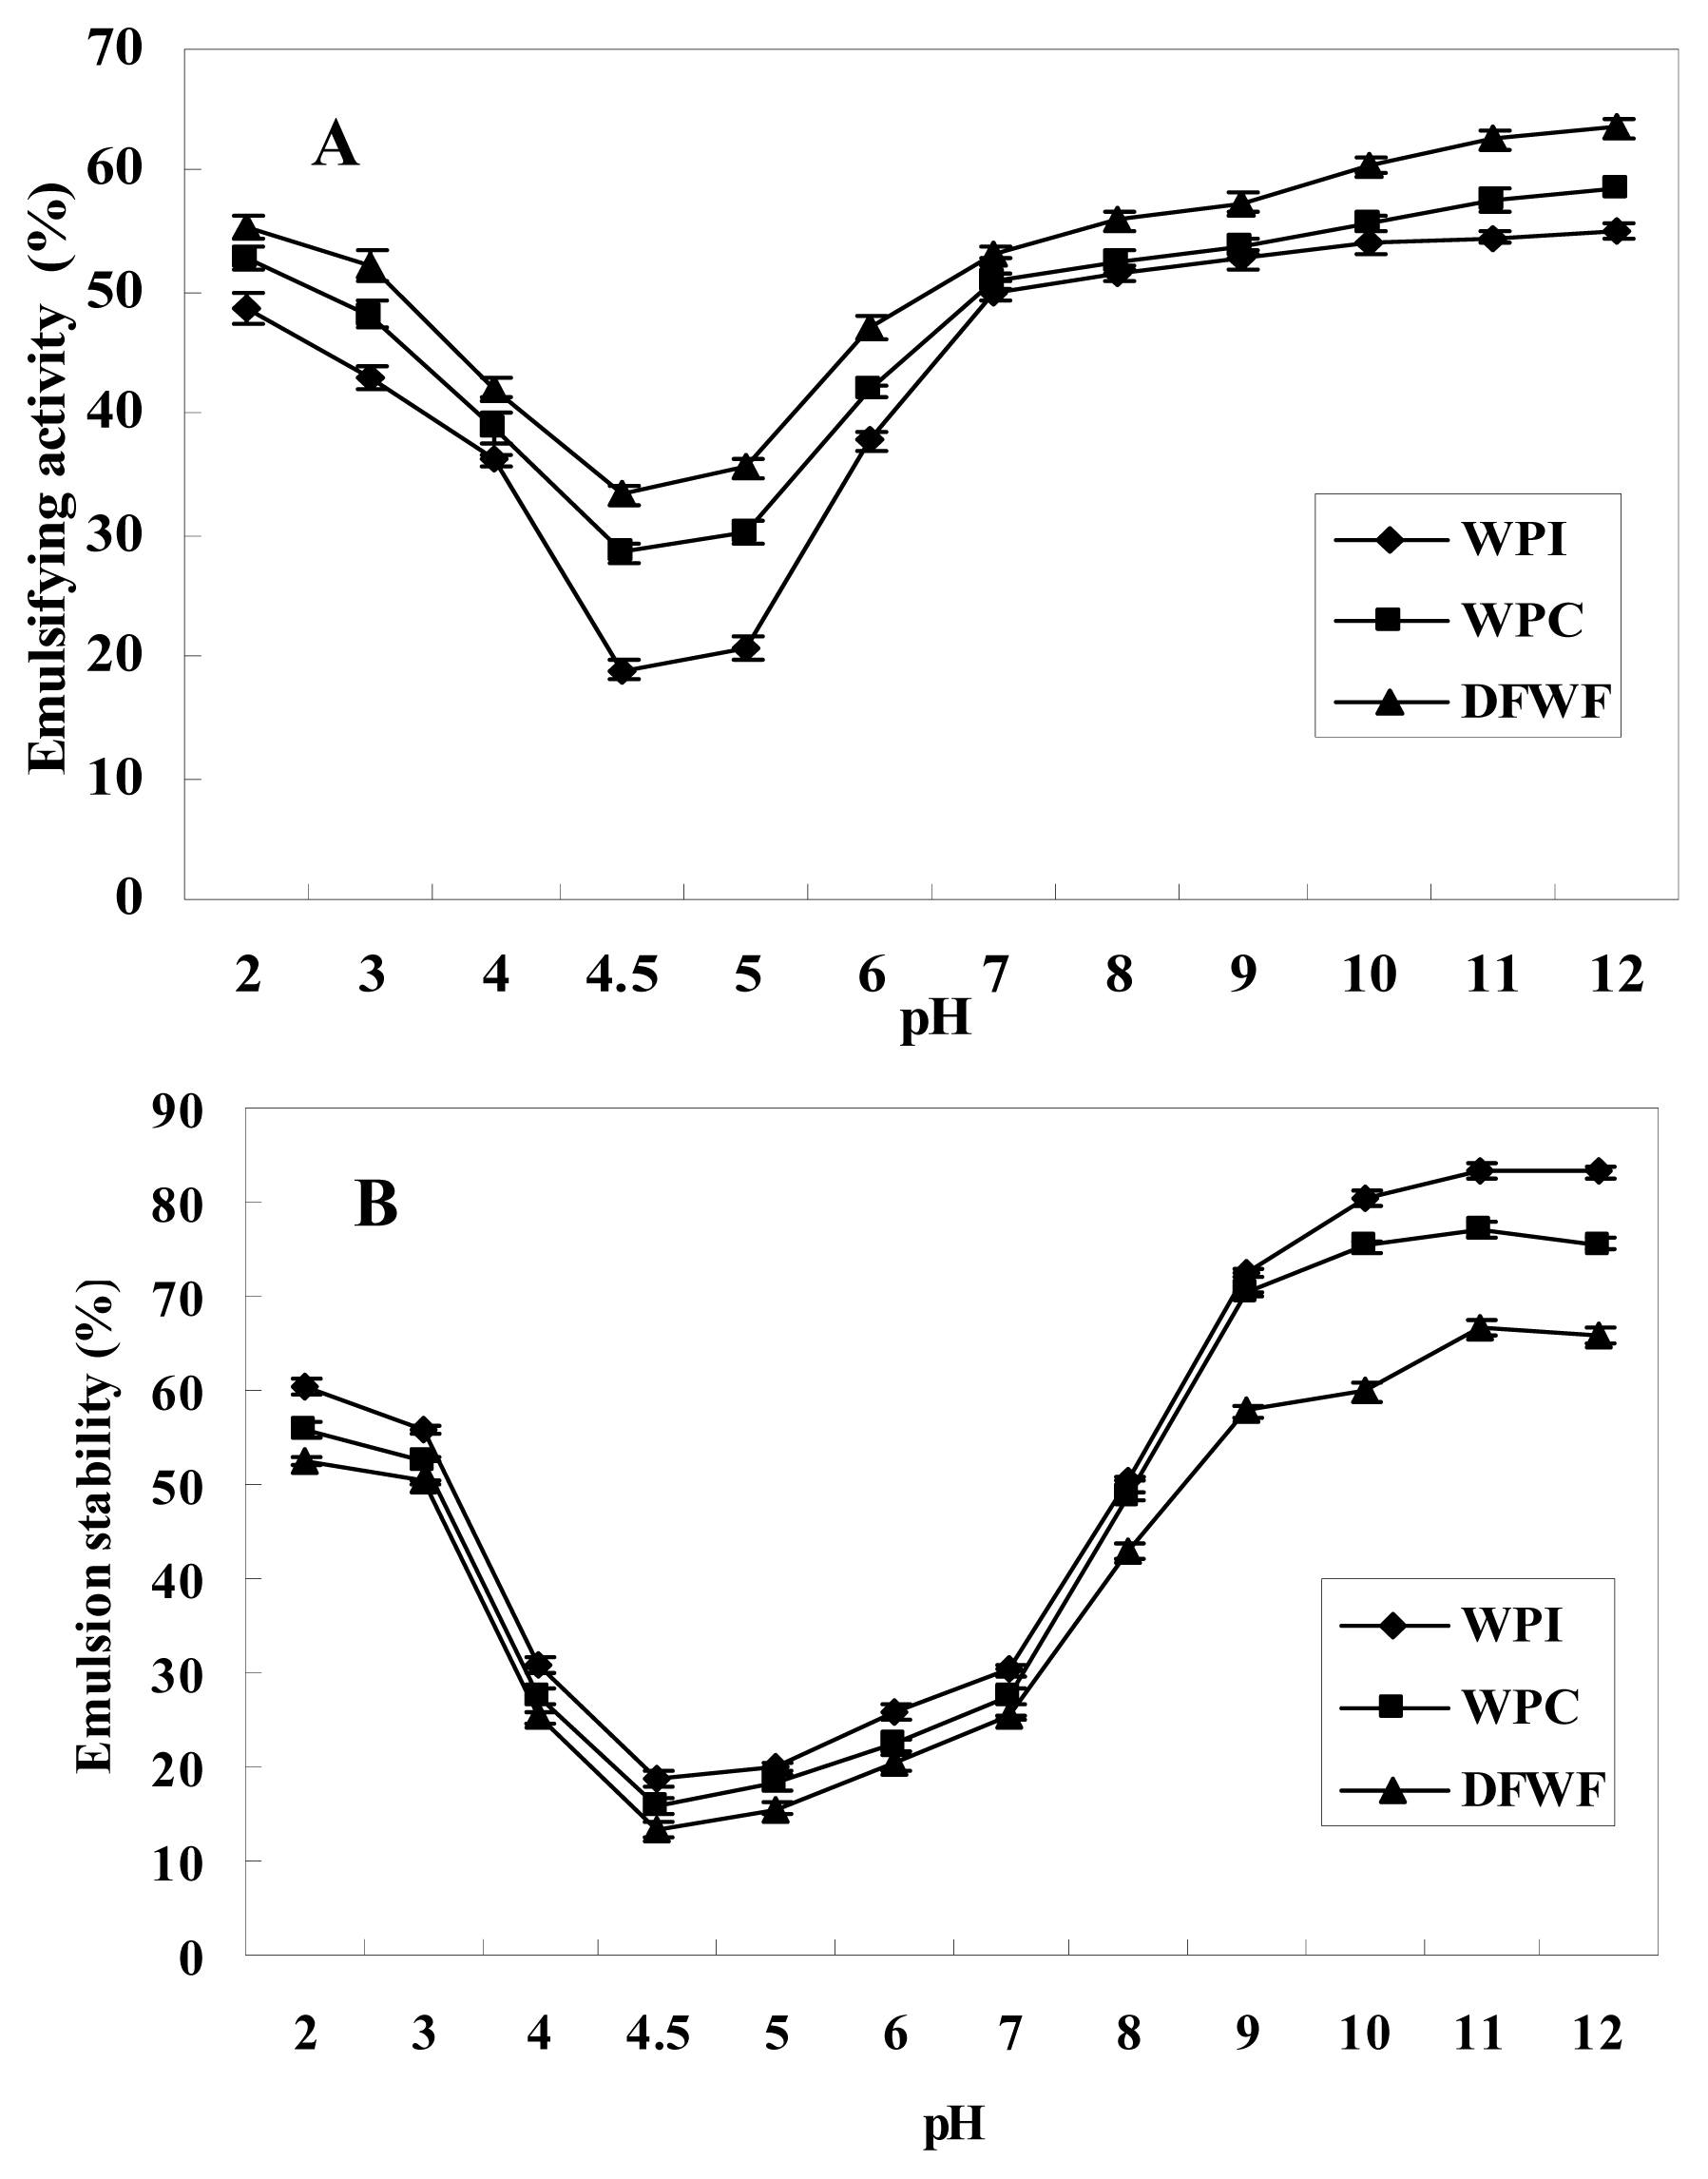
The effects of pH on the emulsifying activity (EA) of DFWF, WPC and WPI are shown in Figure 6A. The minimum emulsion activity of DFWF, WPC and WPI at pH 4.5 (isoelectric point) were 33.28%, 28.56% and 18.91%, respectively. A higher emulsifying activity was observed on both sides of the isoelectric point among DFWF, WPC and WPI. At pH 2, values of 55.45%, 52.78% and 48.61%, for DFWF, WPC and WPI, respectively, were found, and the highest emulsion activity was observed at pH 12; 63.62%, 58.45% and 55.12% for DFWF, WPC and WPI, respectively. The results indicated that emulsion capacity was pH-dependent and alkaline pH was found to improve the emulsion capacity more than acidic pH. The pH had pronounced effects on the emulsifying activity because soluble proteins emulsifying activity depend upon the hydrophilic-lipophilic balance [28], which in turn is affected by pH. At the oil–water interface, the protein oriented lipophilic residues to the oil phase and hydrophilic residue to the aqueous phase, thus reducing surface tension at the interface. At a pH of 4.5, protein solubility was low, protein adsorption at the oil–water interface would be diffusion controlled. However, at a pH range of 5.0–12.0 with protein solubility increased, the activation energy barrier did not allow protein migration to take place in a diffusion dependent manner. Increase in protein solubility facilitated enhanced interaction between the oil phase and the aqueous phase. The emulsifying activity of DFWF was higher than WPC and WPI in the tested pH range significantly (p < 0.05), probably due to the difference in protein concentration. At low protein concentration, protein adsorption at the oil–water interface is diffusion controlled, since it will spread over the surface before it can be adsorbed. At high protein concentration, the activation energy barrier does not allow protein migration to take place in a diffusion-dependent manner [5]. Therefore, emulsifying activity decreased with increased protein concentration.
The effects of pH on emulsion stability (ES) of DFWF, WPC and WPI are shown in Figure 6B. The relationship between ES and pH for DFWF, WPC and WPI was similar to that of protein solubility and pH. The ES of all samples was low in the pH range 2.0–4.5, and then increased up to pH 11. In the pH range 7–9, the ES increased rapidly and afterwards it increased slowly up to pH 11. The highest emulsion stability (ES) among DFWF, WPC and WPI, was observed at pH 11 with values of 66.78%, 76.92% and 83.33%, respectively. This was in agreement with the correlation found between ES and nitrogen solubility in previous studies [29]. Another study has shown that the pH-emulsifying property profile of various proteins, including soy protein, resembles the pH-solubility profile [21]. The low ES at low pH might be attributed to increased interaction between the emulsified droplets, since net charge on the proteins was decreased by the presence of the chloride ions [30]. As the pH increased, the coulombic repulsion increased between neighboring droplets, coupled with increased hydration of the charged protein molecules. These factors resulted in reduction of interface energy and combination of emulsion droplet, which might account for the higher ES obtained [30]. The ES of WPI was significantly higher than that of WPC at all pH values (2–11), which in turn was significantly higher than that of DFWF. The differences in ES of DFWF, WPC and WPI might be due to their differences in protein content and the surface hydrophobicity of samples. An extensive protein–protein interaction, caused by hydrophobic interaction on the surface of the protein, would form a strong oil–water interface, resulting in a stable emulsion [31]. Comparisons between of EA and ES of walnut protein concentrate and isolate showed that the effects of pH on walnut proteins were greatly different, reflecting differences in their composition, solubility, structure, and interaction with other compounds and their surface hydrophobicity. High content of hydrophobic amino acids in protein improved its surface hydrophobicity and the exposed hydrophobic groups enhanced the interactions between proteins and lipids. The results indicated that emulsifying properties of walnut protein concentrate and isolate can be improved significantly in alkaline environment.
2.10. Foaming Properties
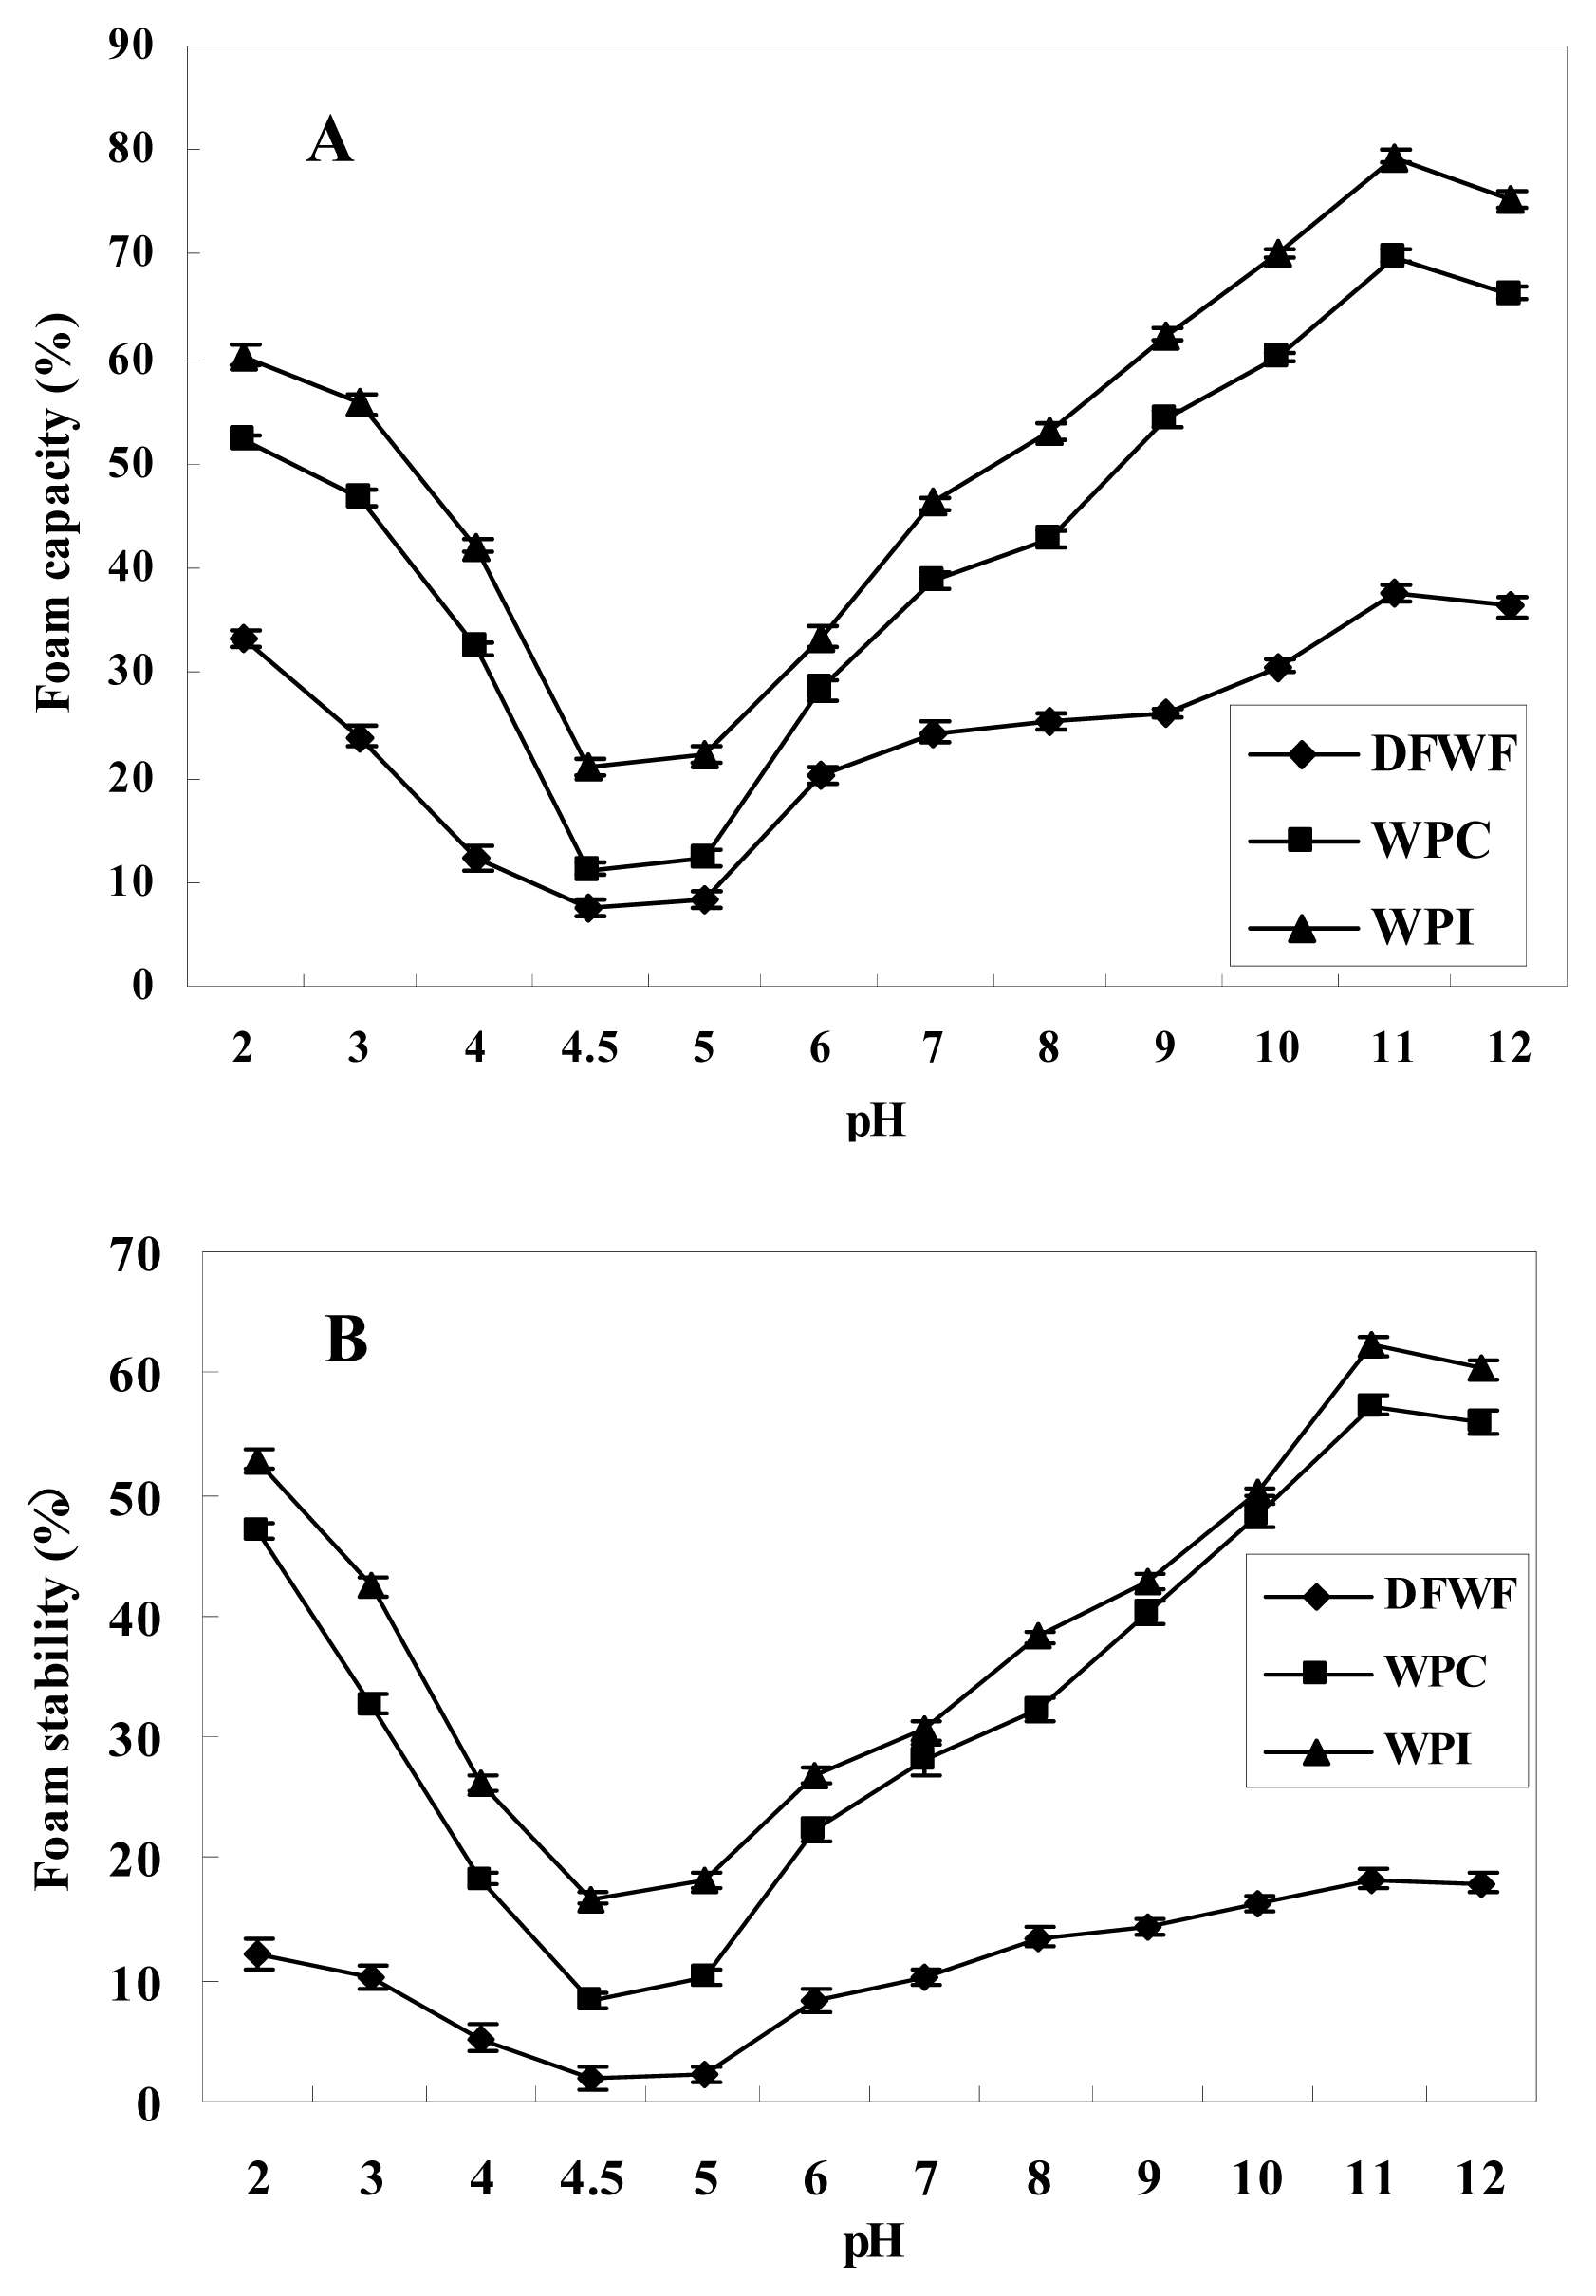
At pH 7, the foam capacity (FC) of WPI was significantly higher than that of WPC, which was significantly higher than that of DFWF, with the values of 46.34%, 38.78% and 24.35%, respectively. The foam stability (FS) of WPI was significantly higher than that of WPC, which was significantly higher than that of DFWF, with values of 30.56%, 28.18% and 10.23%, respectively (Table 3). The results suggested that the WPI had a more flexible protein structure in aqueous solutions and interacted strongly at the air–water interface to form more stable foams when compared to the WPC.
The effects of pH on the foam capacity (FC) and foam stability (FS) of DFWF, WPC and WPI are shown in Figure 7A,B. The lowest foam capacity and foam stability were observed at pH 4.5 (isoelectric point) among DFWF (7.39% and 1.98%), WPC (11.23% and 8.27%) and WPI (20.97% and 16.76%), respectively, which was also coincident with their lowest solubility (Figure 5) and lowest emulsifying properties (Figure 6). Beyond pH 4.5, FC and FS significantly increased for both samples, especially at pH 11. The results obtained were likely due to an increase in the net charge of the protein which weakens hydrophobic interaction and increases protein solubility and flexibility, allowing the protein to spread to the air–water interface more quickly, encapsulating air particles and thus increasing foam formation, as reported by Lawal et al. [32]. The profile of foaming properties against pH for the walnut protein isolate and concentrate was similar to that of its solubility against pH (Figure 5). Results revealed that the foaming properties of walnut protein isolate and concentrate were pH-dependent. Foaming properties improvement of walnut protein concentrate and isolate at alkaline pH may be due to increased solubility and surface activity of the soluble protein. Foaming properties of WPI was significantly higher (p < 0.05) than that of WPC at all pH values (2–11), which were in turn significantly higher (p < 0.05) than that of DFWF. The differences in foaming properties of both samples were likely due to their differences in protein concentration. The foam capacity and stability were enhanced by high protein concentration, as high protein concentration increases the viscosity and facilitates the formation of a multilayer, cohesive protein film at the interface [33].
2.11. Fat Absorption Capacity (FAC)
Fat absorption capacity (FAC) results of DFWF, WPC and WPI are presented in Table 3. Fat absorption capacity of both samples were significantly different (p < 0.05), with WPI having the highest FAC (2.81 g/g), followed by WPC (2.50 g/g) and DFWF (1.87 g/g) at pH 7. The differences in fat absorption capacity between the samples might be due to the presence of more non-polar amino acids in WPI and WPC than in DFWF, and also due to the partial denaturation of proteins with exposition of hydrophobic amino acids groups during the process of protein isolate production. The presence of several non-polar side chains may bind the hydrocarbon chains of fats, thereby resulting in higher absorption of oil [34]. El Nasri [35] reported that surface area and hydrophobicity improve fat absorption capacity and also high protein content shows high fat absorption capacity (FAC). Campell, Shih and Marshall [36] reported that FAC increased as protein content increased in sunflower and soy protein products. FAC values of WPI and WPC were higher than 2.434 g/g of commercial soy protein isolate (SPI) reported by Zhu et al. [19]. The ability of protein to bind fat is very important for applications as meat replacement and extenders, principally because it enhances flavor retention, and reputedly improves mouth feel [21]. Results obtained indicated that WPC and WPI had good oil absorption capacity. High FAC of WPI and WPC make them good ingredients in cold meat industry, particularly for sausages, where the protein usually bridge the fat and water in order to obtain good products.
2.12. Water Absorption Capacity (WAC)
Water absorption capacity (WAC) results of DFWF, WPC and WPI are presented in Table 3. Water absorption capacity of both samples were significantly different (p < 0.05), with DFWF having the highest WAC (3.57 g/g), followed by WPI (3.11 g/g) and WPC (2.94 g/g) at pH 7. However, the solubility of WPI was significantly higher than that of WPC and DFWF in Figure 5. It was suggested that there was no direct correlation between solubility and WAC of walnut proteins as high protein solubility did not necessarily mean high WAC. This was consistent with other studies findings [37]. Protein water absorption capacity of proteins is a function of several parameters, including size, shape, steric factors, conformational characteristics, hydrophilic-hydrophobic balance of amino acids in the protein molecules as well as lipids, carbohydrates and tannins associated with proteins. Carbohydrates contain hydrophilic parts, such as polar or charged side chains, which can enhance WAC [38]. DFWF water absorption capacity was enhanced, as the DFWF carbohydrate content (db, 43.94%) was significantly higher (p < 0.05) than that of WPI (db, 11.81%). WAC value of DFWF was higher than 3.551 g/g of commercial soy protein isolate (SPI) reported by Zhu et al. [19]. High WAC of DFWF makes it a potential ingredient for the meat, bread, and cakes industries.
3. Experimental Section
3.1. Materials and Methods
Walnuts (Juglans regia L.) were purchased from Xinjiang in China. The defatted walnut flour (DFWF) was produced according to the method suggested by Sze-Tao and Sathe [13] for the extraction of walnut protein. Walnut was ground in a Waring Blender. The flour was defatted with hexane (flour/hexane ratio of 1:10 w/v) under constant magnetic stirring for 3 h. The slurry was vacuum filtered through filter paper and the residue was used for subsequent extraction. Hexane extractions were repeated until the filtrate was clear. Residue from the last extraction and filtration step was air dried in a fume hood. DFWF was ground to 150 meshes with Waring Blender and stored at −20 °C for further use.
3.2. Preparation of Protein Concentrate
The walnut protein concentrate was prepared according to the process described by Wolf [39] with minor modifications. Defatted walnut flour with 95% aqueous alcohol (1:20, w/v) and stirred for 1h at ambient temperature (about 25 °C). The suspension was vacuum filtered through filter paper and the residues were air dried in a fume hood. Residues were dispersed in de-ionized water (1:20, w/v) at room temperature and the pH of the dispersion was adjusted to 4.5 by addition of 1NHCl, stirred using a magnetic stirrer for 2 h. The slurry was then centrifuged (10,000 g, 30 min, 4 °C) in a CR22G centrifuge (Hitachi Koki Co., Hitachinake, Japan). The precipitate was washed with de-ionized water, re-dissolved in water, neutralized to pH 7.0 with 1 N NaOH at room temperature, and then freeze-dried.
3.3. Preparation of Protein Isolate
The walnut protein isolate (WPI) was prepared according to the process described by Wolf [39] with minor modifications. DFWF was extracted by stirred for 2 h at room temperature (about 25 °C) with de-ionized water adjusted to pH 11.0 with 1 N NaOH (water: flour ratio, 1:20 (w/v)). The slurry was centrifuged at 10,000 g for 30 min at 4 °C. The insoluble walnut protein cake was re-dissolved with pH-adjusted de-ionized water as above, and cold-centrifuged again. The supernatants were mixed together, and were adjusted to pH 4.5 with 1 N HCl, and then kept for 2 h at room temperature (about 25 °C) and subsequently centrifuged at 10,000 g for 30 min at 4 °C. The precipitate was washed with water, re-dissolved in water, neutralized to pH 7 with 1 N NaOH at room temperature, and then freeze-dried.
3.4. Proximate Analysis
Moisture, fat and ash contents were determined according to the methods of AOAC [40], numbers 950.46, 960.39 and 920.153, respectively. The protein content of sample was determined by the micro-Kjeldhal method [41] through the use of the protein-nitrogen coefficient of 5.30 [13]. Carbohydrates were determined according to the method of Zhu et al. [42]. The contents were expressed on a dry weight basis. Each analysis was done in triplicate, and data were reported as means ± standard deviation.
3.5. Surface Hydrophobicity
Surface hydrophobicity (H0) was determined using 1-anilino-8-naphthalene sulphonate (ANS) as a fluorescence probe, as reported by Kato and Nakai [43]. Protein dispersions (4 mg/mL) were prepared in 0.01 M phosphate buffer (pH 7.0), stirred for 2 h at room temperature (about 25 °C). The protein concentration in the supernatant was determined by the Folin-phenol method [44]. Each supernatant was serially diluted with the same buffer to obtain protein concentrations ranging from 0.5 to 0.005 mg/mL. Then, a volume of 4 mL of each diluted sample was added with 50 μL of ANS (8.0 mM in 0.01 M, pH 7.0 phosphate buffer solution). Fluorescence intensity (FI) was measured with a Perkin-Elmer 2000 fluorescence spectrophotometer, at wavelengths of 365 nm (excitation) and 484 nm (emission). The net FI at each protein concentration was determined by subtracting FI of each solution without the probe from that with the probe. The initial slope of the FI versus protein concentration plot was used as an index of protein surface hydrophobicity (H0). Each analysis was done in triplicate, and data were reported as means ± standard deviation
3.6. Gel Electrophoresis
Protein subunits compositions were analyzed by sodium dodecyl sulphate polyacrylamide gel electrophoresis (SDS-PAGE). SDS-PAGE was performed according to the method of Laemmli [45] by the discontinuous buffer system at 4% stacking gel concentration and 12.5% separating gel concentration, using gel electrophoresis apparatus DYCZ-30 (Beijing Liuyi Instrument Factory, China). Electrophoresis was carried out in the presence and absence of β-mercaptoethanol (2% v/v) [46]. Samples were extracted with SDS-PAGE buffer for 4 h at room temperature (RT) using a vortex mixing. After heating in boiling water bath for 10 min, Samples were cooled to RT and then centrifuged (10,000 g, 10 min, RT). Supernatants were used for electrophoresis. The electrophoresis was run at 15 mA in the stacking gel and 25 mA in the separating gel until the tracking dye reached the bottom of the gel and gels were stained with Coomassie Brilliant Blue G 250. Subunit molecular weight was estimated by using a LMW calibration kit (Shanghai Institute of Biochemistry, China) consisting of hen egg white lysozyme (14.4 kDa), trypsin inhibitor (20.1 kDa), bovine carbonic anhydrase (31.0 kDa), rabbit actin (43.0 kDa), bovine serum albumin (66.2 kDa), and rabbit phosphorylase b (97.4 kDa).
3.7. Molecular Weight Distribution by SEC-HPLC
The molecular weight distribution was determined by High performance size exclusion chromatography (SEC-HPLC). Walnut protein concentrate, protein isolate and defatted walnut flour (5 mg ml−1) were extracted by sodium phosphate buffer (0.05 M, pH 8.0) containing sodium chloride (0.3 M) for 4 h at 25 °C under constant magnetic stirring and then were centrifuged at 10,000 g for 10 min (25 °C). The supernatant was filtered through a cellulose acetate membrane with a pore size of 0.45 μm (Sartorius Co, Ltd, Gottingen, Germany). A Waters 2690 liquid chromatogram system (Waters Chromatography Division, Milford, MA, USA) equipped with a Shodex protein KW-804 column (Shodex Separation and HPLC Group, Tokyo, Japan) and a Waters 996 photodiode array detector was used to determine the molecular weight distribution. The flow rate was 1 mL min−1 using phosphate buffer (0.05mol l−1, 0.3mol l−1 NaCl, pH 7.0) as the mobile phase. About 10 μL protein solutions were injected into the column and the eluent was monitored at 280 nm. All samples were measured in triplicate and the representative examples were selected for discussion. A calibration curve of 10 standard proteins was used for interpreting the results.
3.8. Amino Acid Analysis
Amino acids analysis was determined according to the method of Zhu, Zhou and Qian [42]. Samples of protein isolate and concentrate (100 mg) were subjected to acid hydrolysis with 5 mL of 6 M HCl under nitrogen atmosphere for 24 h at 110 °C. Each hydrolysate was washed into a 50 mL volumetric flask and made up to the mark with distilled water. The amino acids were subjected to RP-HPLC analysis (Agilent 1100) after precolumn derivatisation with O-phthaldialdehyde (OPA) or with 9-fluorenylmethyl chloroformate (FMOC). Methionine and cysteine were determined separately by oxidation products before hydrolysis in 6 M HCl. Amino acid composition was reported as g of amino acid/100 g of protein.
3.9. Circular Dichroism (CD) Spectra Measurement
CD spectra were scanned at the far-UV range (200–250 nm) with a CD spectropolarimeter (Jasco J-715, Jasco Corp., Tokyo, Japan) in a 0.1 cm quartz CD cuvette (Hellma, Muellheim, Baden, Germany) at 25 °C. The protein concentration for CD analysis was 50 mg/mL. Distilled water used to dissolve walnut protein samples was used as blank solution for all of the samples. The values of scan rate, response, bandwidth, and step resolution were 100 nm/min, 0.25 s, 1.0 nm, and 0.2 nm, respectively. Five scans were averaged to obtain one spectrum. The CD data were expressed in terms of mean molar ellipticity [θ] (deg cm2 dmol−1).
3.10. Scanning Electron Microscopy (SEM) Analysis
In order to investigate the influence of extracted techniques on the structure of the materials and to understand the extraction mechanism, the walnut protein samples were dried in air for the SEM analysis. Sample particles were fixed on the silicon wafer and sputtered with gold to a thickness of about 100 nm. The shape and the surface characters of the samples were observed and recorded on the scanning electron microscope (Quanta-200, FEI Ltd., Holand).
3.11. Water Protein Solubility
This was determined according to the modified methods of Rodriguez-Ambriz et al. [47]. 200 mg of sample were dispersed in 20 mL of de-ionized water and pH of the mixture was adjusted to 2, 3, 4, 4.5, 5, 6,7, 8, 9, 10, 11, 12 with 1 N HCl and 1 N NaOH. The mixture was stirred at room temperature for 30 min and centrifuged at 8000 g for 20 min. Protein contents in the supernatant were determined using the Bradford method [48]. All analysis was performed in triplicate. Protein solubility was then calculated by:
3.12. Emulsifying Properties
Emulsifying activity (EA) was determined according to the method of described by Pedroche et al. [49] with some modifications. Samples (1.0 g) were homogenized at a speed of 10,000 rpm for 1 min at room temperature (about 25 °C) in 25 mL de-ionized water. Then the pH of the solution was adjusted to 2, 3, 4, 4.5, 5, 6, 7, 8, 9, 10, 11, 12 with either 0.1 M HCl or 0.1 M NaOH. The protein solution was mixed with 25 mL of soybean oil followed by homogenization at a speed of 10,000 rpm for 1 min. Finally, the emulsion was centrifuged at 1300 g for 5 min. All analysis was performed in triplicate.
Emulsifying activity was determined by:
Emulsion stability (ES) was measured by re-centrifugation followed by heating at 80 °C for 30 min and then expressed as follows:
3.13. Foaming Capacity (FC) and Foam Stability (FS)
Foaming capacity (FC) and stability (FS) were based on the method described by Sze-Tao and Sathe [5] with minor modifications. 500 mg samples were dispersed in 50 mL of de-ionized water. The pH of the protein solution was adjusted to 2, 3, 4, 4.5, 5, 6, 7, 8, 9, 10, 11, 12 with either 0.1 M HCl or 0.1 M NaOH. The solutions were stirred at a speed of 10,000 rpm for 2 min. The blend was immediately transferred into a 100 mL graduated cylinder. The volume was recorded before and after stirring. FC was expressed as the volume (%) increased due to stirring. For the determination of FS, foam volume changes in the graduated cylinder were recorded at 30 min of storage. All analysis was performed in triplicate. Foam capacity and foam stability were then calculated according to the following formulae:
3.14. Fat Absorption Capacity (FAC)
Fat absorption capacity was determined using the method described by Lin and Zayas [50] with minor modifications. 1 g of sample was weighed into 15 mL pre-weighed centrifuge tube and thoroughly mixed with 5 mL soybean oil. The emulsion was incubated at room temperature (about 25 °C) for 30 min and then centrifuged at 5000 g for 20 min at 25 °C. Then the supernatant was carefully removed, and the tube was reweighed. All analysis was performed in triplicate. FAC (gram of oil per gram of protein) was determined by:
where F0 is the weight of the dry sample (in gr), F1 is the weight of the tube plus the dry sample (in gr), and F2 is the weight of the tube plus the sediment (in gr).
3.15. Water Absorption Capacity (WAC)
Water absorption capacity was determined using the method described by Rodriguez-Ambriz et al. [47] with minor modifications. 1 g of sample was weighed into 15 mL pre-weighed centrifuge tube. Then 10 mL of distilled water was added in small increments to the tube under continuous stirring with a glass rod. After being held at room temperature (about 25 °C) for 30 min, the tube was centrifuged at 2000 g for 20 min. In the end, the amount of added distilled water resulting in the supernatant liquid in the test tube was recorded. All analysis was performed in triplicate. WAC expressed as grams of water per gram of sample, was calculated by:
where W0 is the weight of the dry sample (in gr), W1 is the weight of the tube plus the dry sample (in gr), and W2 is the weight of the tube plus the sediment (in gr).
3.16. Statistical Analysis
All analyses were done in triplicate, and data were reported as means ± standard deviation. Where appropriate, data were analyzed for significance using analysis of variance and Fisher’s least significant difference (LSD at a 5% significance level) by General Linear Model of SPSS (Software version 11.0, SPSS, Chicago, Illinois).
4. Conclusions
Results from this study indicate that the composition and structure of walnut protein concentrates and isolates were different when compared with defatted walnut flour. Also, functional properties of protein products were improved when walnut protein isolates and concentrates were produced from defatted walnut flour by isolation techniques. Furthermore, walnut protein isolates and concentrates could be good resources of essential amino acids for adults except methionine, and could be considered as a rich resource of vegetable proteins similar to other oilseed proteins in human nutrition. Finally, walnut protein isolate and walnut protein concentrate exhibit satisfactory functional properties as required in meat, cake and ice cream products processing, and as a good source of a protein ingredient in food systems. The production of walnut protein concentrate and isolate could also add value to defatted walnut flour, a low value by-product of walnut oil production.
References
- Molina Ortiz, S.E.; Puppo, M.C.; Wagner, J.R. Relationship between structural changes and functional properties of soy protein isolates—carrageenan systems. Food Hydrocoll 2004, 18, 1045–1053. [Google Scholar]
- Yu, J.; Ahmedna, M.; Goktepe, I. Peanut protein concentrate: Production and functional properties as affected by processing. Food Chem 2007, 103, 121–129. [Google Scholar]
- Yoshie-Stark, Y.; Wada, Y.; Wäsche, A. Chemical composition, functional properties, and bioactivities of rapeseed protein isolates. Food Chem 2008, 107, 32–39. [Google Scholar]
- González-Pérez, S.; Vereijken, J.M. Sunflower proteins: overview of their physicochemical, structural and functional properties. J. Sci. Food Agr 2007, 87, 2173–2191. [Google Scholar]
- Sze-Tao, K.; Sathe, S. Functional properties and in vitro digestibility of almond (Prunus dulcis L.) protein isolate. Food Chem 2000, 69, 153–160. [Google Scholar]
- Igene, F.; Oboh, S.; Aletor, V. Effects of some processing techniques on the functional properties of winged bean seed flours. J. Food Agr. Environ 2005, 3, 28–31. [Google Scholar]
- Lawal, O.; Adebowale, K.; Adebowale, Y. Functional properties of native and chemically modified protein concentrates from bambarra groundnut. Food Res. Int 2007, 40, 1003–1011. [Google Scholar]
- Davis, L.; Stonehouse, W.; Loots du, T.; Mukuddem-Petersen, J.; van der Westhuizen, F.H.; Hanekom, S.M.; Jerling, J.C. The effects of high walnut and cashew nut diets on the antioxidant status of subjects with metabolic syndrome. Eur. J. Nutr 2007, 46, 155–164. [Google Scholar]
- Qualified Health Claims: Letter of Enforcement Discretion—Walnuts and Coronary Heart Disease, United State Food and Drug Administration 2004. Available online: http://www.fda.gov/Food/LabelingNutrition/LabelClaims/QualifiedHealthClaims/ucm072910.htm Accessed on 13 November 2011.
- Mexis, S.F.; Badeka, A.V.; Riganakos, K.A.; Karakostas, K.X.; Kontominas, M.G. Effect of packaging and storage conditions on quality of shelled walnuts. Food Control 2009, 20, 743–751. [Google Scholar]
- Oliveira, R.; Fátima Rodrigues, M.; Gabriela Bernardo-Gil, M. Characterization and supercritical carbon dioxide extraction of walnut oil. J. Am. Oil Chem. Soc 2002, 79, 225–230. [Google Scholar]
- Anderson, K.J.; Teuber, S.S.; Gobeille, A.; Cremin, P.; Waterhouse, A.L.; Steinberg, F.M. Walnut polyphenolics inhibit in vitro human plasma and LDL oxidation. J. Nutr 2001, 131, 2837–2842. [Google Scholar]
- Sze-Tao, K.W.C.; Sathe, S.K. Walnuts (Juglans regia L): proximate composition, protein solubility, protein amino acid composition and protein in vitro digestibility. J. Sci. Food Agr 2000, 80, 1393–1401. [Google Scholar]
- Amaral, J.S.; Casal, S.; Pereira, J.A.; Seabra, R.M.; Oliveira, B.P.P. Determination of sterol and fatty acid compositions, oxidative stability, and nutritional value of six walnut (Juglans regia L.) cultivars grown in Portugal. J. Agr. Food Chem 2003, 51, 7698–7702. [Google Scholar]
- Savage, G. Chemical composition of walnuts (Juglans regia L.) grown in New Zealand. Plant Foods Hum. Nutr 2001, 56, 75–82. [Google Scholar]
- Pereira, J.A.; Oliveira, I.; Sousa, A.; Ferreira, I.C.; Bento, A.; Estevinho, L. Bioactive properties and chemical composition of six walnut (Juglans regia L.) cultivars. Food Chem. Toxicol 2008, 46, 2103–2111. [Google Scholar]
- Health and Nutritional Properties of Probiotics in Food including Powder Milk with Live Lactic Acid Bacteria—Report of a Joint Food and Agriculture Organization/World Health Organization Expert Consultation on Evaluation of Health and Nutritional Properties of Probiotics in Food Including Powder Milk with Live Lactic Acid Bacteria. In Protein Quality Evaluation, Food and Agriculture Organization (FAO) of the United Nations; FAO: Rome, Italy, 1990.
- Moure, A.; Sineiro, J.; Domínguez, H.; Parajó, J.C. Functionality of oilseed protein products: A review. Food Res. Int 2006, 39, 945–963. [Google Scholar]
- Zhu, K.X.; Sun, X.H.; Chen, Z.C.; Peng, W.; Qian, H.F.; Zhou, H.M. Comparison of functional properties and secondary structures of defatted wheat germ proteins separated by reverse micelles and alkaline extraction and isoelectric precipitation. Food Chem 2010, 123, 1163–1169. [Google Scholar]
- Mohamed, A.; Peterson, S.C.; Hojilla-Evangelista, M.P.; Sessa, D.J.; Rayas-Duarte, P.; Biresaw, G. Effect of heat treatment and pH on the physicochemical properties of lupin protein. J. Am. Oil Chem. Soc 2004, 81, 1153–1157. [Google Scholar]
- Ogunwolu, S.O.; Henshaw, F.O.; Mock, H.P.; Santros, A.; Awonorin, S.O. Functional properties of protein concentrates and isolates produced from cashew (Anacardium occidentale L.) nut. Food Chem 2009, 115, 852–858. [Google Scholar]
- Singh, N.; Kaur, M.; Kawaljit, S.S. Physicochemical and functional properties of freeze-dried and oven dried corn gluten meals. Dry. Technol 2005, 23, 975–988. [Google Scholar]
- Molina, E.; Papadopoulou, A.; Ledward, D. Emulsifying properties of high pressure treated soy protein isolate and 7S and 11S globulins. Food Hydrocoll 2001, 15, 263–269. [Google Scholar]
- Molina Ortiz, S.E.; Wagner, J.R. Hydrolysates of native and modified soy protein isolates: structural characteristics, solubility and foaming properties. Food Res. Int 2002, 35, 511–518. [Google Scholar]
- Chove, B.E.; Grandison, A.S.; Lewis, M.J. Emulsifying properties of soy protein isolate fractions obtained by isoelectric precipitation. J. Sci. Food Agr 2001, 81, 759–763. [Google Scholar]
- Sathe, S.; Deshpande, S.; Salunkhe, D. Functional properties of winged bean [Psophocarpus tetragonolobus (L.) DC] proteins. J. Food Sci 1982, 47, 503–509. [Google Scholar]
- Lin, M.; Humbert, E.; Sosulski, F. Certain functional properties of sunflower meal products. J. Food Sci 1974, 39, 368–370. [Google Scholar]
- Wu, H.; Wang, Q.; Ma, T.; Ren, J. Comparative studies on the functional properties of various protein concentrate preparations of peanut protein. Food Res. Int 2009, 42, 343–348. [Google Scholar]
- Ragab, D.M.; Babiker, E.E.; Eltinay, A.H. Fractionation, solubility and functional properties of cowpea (Vigna unguiculata) proteins as affected by pH and/or salt concentration. Food Chem 2004, 84, 207–212. [Google Scholar]
- Chavan, U.; Mckenzie, D.; Shahidi, F. Functional properties of protein isolates from beach pea (Lathyrus maritimus L.). Food Chem 2001, 74, 177–187. [Google Scholar]
- Wasswa, J.; Tang, J.; Gu, X. Functional properties of Grass carp (Ctenopharyngodon idella), Nile perch (Lates niloticus) and Nile tilapia (Oreochromis niloticus) skin hydrolysates. Int. J. Food Prop 2008, 11, 339–350. [Google Scholar]
- Lawal, O.; Adebowale, K.; Ogunsanwo, B.; Sosanwo, O.; Bankole, S. On the functional properties of globulin and albumin protein fractions and flours of African locust bean (Parkia biglobossa). Food Chem 2005, 92, 681–691. [Google Scholar]
- Damodaran, S. Food Proteins and Their Applications, 1st ed; Dekker, M., Paraf, A., Eds.; CRC Press: New York, USA, 1997; pp. 1–21. [Google Scholar]
- Sathe, S.; Deshpande, S.; Salunkhe, D. Functional properties of lupin seed (Lupinus mutabilis) proteins and protein concentrates. J. Food Sci 1982, 47, 491–497. [Google Scholar]
- El Nasri, N.A.; El Tinay, A.H. Functional properties of fenugreek (Trigonella foenum-graecum) protein concentrate. Food Chem 2007, 103, 582–589. [Google Scholar]
- Campbell, N.F.; Shih, F.F.; Marshall, W.E. Enzymic phosphorylation of soy protein isolate for improved functional properties. J. Agr. Food Chem 1992, 40, 403–406. [Google Scholar]
- Prinyawiwatkul, W.; Beuchat, L.R.; McWatters, K.H.; Phillips, R.D. Functional properties of cowpea (Vigna unguiculata) flour as affected by soaking, boiling, and fungal fermentation. J. Agr. Food Chem 1997, 45, 480–486. [Google Scholar]
- Jitngarmkusol, S.; Hongsuwankul, J.; Tananuwong, K. Chemical compositions, functional properties, and microstructure of defatted macadamia flours. Food Chem 2008, 110, 23–30. [Google Scholar]
- Wolf, W.J. Soybean proteins. Their functional, chemical, and physical properties. J. Agr. Food Chem 1970, 18, 969–976. [Google Scholar]
- Association of Analytical Communities International. Official Methods of Analysis of AOAC, 17th ed; AOAC international: Gaithersburg, MD, USA, 2000.
- American Association for Clinical Chemistry. Approved Methods of the American Association of Cereal Chemists, 8th ed; American Association of Cereal Chemists: St. Paul, MN, USA, 2000; Volume 54, p. 21.
- Zhu, K.X.; Zhou, H.M.; Qian, H.F. Proteins extracted from defatted wheat germ: nutritional and structural properties. Cereal Chem 2006, 83, 69–75. [Google Scholar]
- Kato, A.; Nakai, S. Hydrophobicity determined by a fluorescence probe method and its correlation with surface properties of proteins. Biochim. Biophys. Acta Protein Struct 1980, 624, 13–20. [Google Scholar]
- Lowry, O.H.; Rosebrough, N.J.; Farr, A.L.; Randall, R.J. Protein measurement with the Folin phenol reagent. J. biol. Chem 1951, 193, 265–275. [Google Scholar]
- Laemmli, U.K. Cleavage of structural proteins during the assembly of the head of bacteriophage T4. Nature 1970, 227, 680–685. [Google Scholar]
- Petruccelli, S.; Anon, M. Relationship between the method of obtention and the structural and functional properties of soy proteins isolates. 1. Structural and hydration properties. J. Agr. Food Chem 1994, 42, 2161–2169. [Google Scholar]
- Rodriguez-Ambriz, S.; Martinez-Ayala, A.; Millan, F.; Davila-Ortiz, G. Composition and functional properties of Lupinus campestris protein isolates. Plant Foods Hum. Nutr 2005, 60, 99–107. [Google Scholar]
- Bradford, M.M. A rapid and sensitive method for the quantitation of microgram quantities of protein utilizing the principle of protein-dye binding. Anal. Biochem 1976, 72, 248–254. [Google Scholar]
- Pedroche, J.; Yust, M.; Lqari, H.; Giron-Calle, J.; Alaiz, M.; Vioque, J.; Millan, F. Brassica carinata protein isolates: chemical composition, protein characterization and improvement of functional properties by protein hydrolysis. Food Chem 2004, 88, 337–346. [Google Scholar]
- Lin, C.; Zayas, J. Functionality of defatted corn germ proteins in a model system: fat binding capacity and water retention. J. Food Sci 1987, 52, 1308–1311. [Google Scholar]


|
Table 1. Chemical composition of defatted walnut flour (DFWF), walnut protein concentrate (WPC) and walnut protein isolate (WPI) a. |
| Materials | Protein (%) | Fat (%) | Ash (%) | Moisture (%) | Carbohydrate (%) | NSI b (%) | Yield (%) |
|---|---|---|---|---|---|---|---|
| DFWF | 52.51 ± 0.33c | 1.80 ± 0.12a | 1.94 ± 0.02 | 9.20 ± 0.02a | 34.55 ± 0.16a | 4.85 ± 0.12c | |
| WPI | 90.5 ± 0.45a | 0.23 ± 0.04b | 2.27 ± 0.03 | 4.50 ± 0.03b | 2.50 ± 0.03c | 29.06 ± 0.23a | 43.15 |
| WPC | 75.56 ± 0.35b | 0.27 ± 0.06b | 2.04 ± 0.02 | 4.48 ± 0.04b | 17.65 ± 0.07b | 28.24 ± 0.18b | 76.60 |
aResults represent the average of three determinations ± SD, values in the same column with different letters are significantly different (p < 0.05);bNSI, Nitrogen solubility index.
| Amino acids | DFWF | WPC | WPI | P-values | FAO/WHO c (1990) |
|---|---|---|---|---|---|
| Asp | 10.04 ± 0.21a | 6.95 ± 0.19c | 9.38 ± 0.11b | 0.00572 | |
| Glu | 22.16 ± 0.12a | 15.78 ± 0.20c | 19.49 ± 0.11b | <0.0001 | |
| Ser | 5.84 ± 0.19a | 3.96 ± 0.22c | 5.15 ± 0.07b | 0.01093 | |
| His | 2.38 ± 0.13a | 1.89 ± 0.09b | 2.30 ± 0.10a | 0.03921 | 1.9 (1.6) |
| Gly | 5.43 ± 0.15a | 3.54 ± 0.11c | 4.18 ± 0.08b | 0.02960 | |
| Thr | 3.58 ± 0.21a | 2.55 ± 0.09b | 3.30 ± 0.12a | 0.02003 | 3.4 (0.9) |
| Arg | 14.73 ± 0.09a | 11.24 ± 0.18b | 14.81 ± 0.11a | <0.0001 | |
| Ala | 4.74 ± 0.05a | 3.31 ± 0.15b | 4.29 ± 0.11a | 0.01524 | |
| Tyr | 2.76 ± 0.22b | 2.30 ± 0.13b | 3.21 ± 0.09a | 0.01387 | |
| Cys | 0.84 ± 0.06a | 0.70 ± 0.12b | 0.81 ± 0.15a | 0.01376 | |
| Val | 4.18 ± 0.21b | 3.50 ± 0.18c | 4.62 ± 0.10a | 0.02046 | 3.5 (1.3) |
| Met | 1.16 ± 0.02b | 0.99 ± 0.08b | 1.44 ± 0.10a | 0.02123 | 2.5 (1.7) |
| Phe | 4.94 ± 0.05a | 3.49 ± 0.07b | 4.61 ± 0.12a | 0.02312 | 6.3 (1.9) |
| Ile | 3.28 ± 0.10b | 3.03 ± 0.09b | 3.99 ± 0.06a | 0.04521 | 2.8 (1.3) |
| Leu | 7.13 ± 0.07a | 5.64 ± 0.12b | 7.29 ± 0.08a | 0.00311 | 6.6 (1.9) |
| Lys | 2.58 ± 0.05a | 2.01 ± 0.07b | 2.13 ± 0.11b | 0.03279 | 5.8 (1.6) |
| Pro | 4.22 ± 0.07a | 2.33 ± 0.04c | 3.18 ± 0.01b | 0.00323 |
aAll amino acid (AA) values are expressed as grams per 100 g of protein;bValues are means ± SD of three determination, Mean values with different letters in the same row are significantly different (P-value <0.05);cNumbers in parentheses of FAO/WHO recommended pattern (1990) represent essential amino acid for adults and numbers outside the parentheses represent essential amino acid for pre-school child (2~5 years).
|
|
Table 3. Some functional properties of DWF, WPC and WPI at their natural pH a. |
| Functional properties b | DFWF | WPC | WPI |
|---|---|---|---|
| EA (%) | 53.28 ± 0.15 a | 52.98 ± 0.43 b | 50.01 ± 0.22 c |
| ES (%) | 25.26 ± 0.27 c | 27.45 ± 0.34 b | 30.30 ± 0.25 a |
| FC (%) | 24.35 ± 1.03 c | 38.78 ± 2.23 b | 46.34 ± 2.06 a |
| FS (%) | 10.23 ± 2.15 c | 28.18 ± 1.04 b | 30.56 ± 2.35 a |
| FAC (g/g) | 1.87 ± 0.20 c | 2.50 ± 0.17 b | 2.81 ± 0.09 a |
| WAC (g/g) | 3.57 ± 0.36 a | 2.94 ± 0.20 c | 3.11 ± 0.28 b |
| Surface hydrophobicity (Ho) | 223.83 ± 5.87c | 315.39 ± 6.54 a | 276.51 ± 8.31 b |
aResults represent the average of three determinations ± SD, values in the same row with different letters are significantly different (p < 0.05);bWAC: water absorption capacity; FAC: fat absorption capacity; EA: emulsifying activity; ES: emulsion stability; FC: foam capacity; FS: foam stability.
© 2012 by the authors; licensee Molecular Diversity Preservation International, Basel, Switzerland. This article is an open-access article distributed under the terms and conditions of the Creative Commons Attribution license (http://creativecommons.org/licenses/by/3.0/).
Share and Cite
Mao, X.; Hua, Y. Composition, Structure and Functional Properties of Protein Concentrates and Isolates Produced from Walnut (Juglans regia L.). Int. J. Mol. Sci. 2012, 13, 1561-1581. https://doi.org/10.3390/ijms13021561
Mao X, Hua Y. Composition, Structure and Functional Properties of Protein Concentrates and Isolates Produced from Walnut (Juglans regia L.). International Journal of Molecular Sciences. 2012; 13(2):1561-1581. https://doi.org/10.3390/ijms13021561
Chicago/Turabian StyleMao, Xiaoying, and Yufei Hua. 2012. "Composition, Structure and Functional Properties of Protein Concentrates and Isolates Produced from Walnut (Juglans regia L.)" International Journal of Molecular Sciences 13, no. 2: 1561-1581. https://doi.org/10.3390/ijms13021561