Comparative Evolution of S7 Intron 1 and Ribosomal Internal Transcribed Spacer in Coilia nasus (Clupeiformes: Engraulidae)


Abstract
:1. Introduction
2. Results and Discussion
2.1. Results
2.1.1. Composition and Variation of rpS7 Intron 1
2.1.2. Compositional Information of ITS1
2.1.3. Phylogenetic Analysis of rpS7 Gene
2.1.4. Mitochondrial COI Molecular Variety
2.2. Discussion
3. Experimental Section
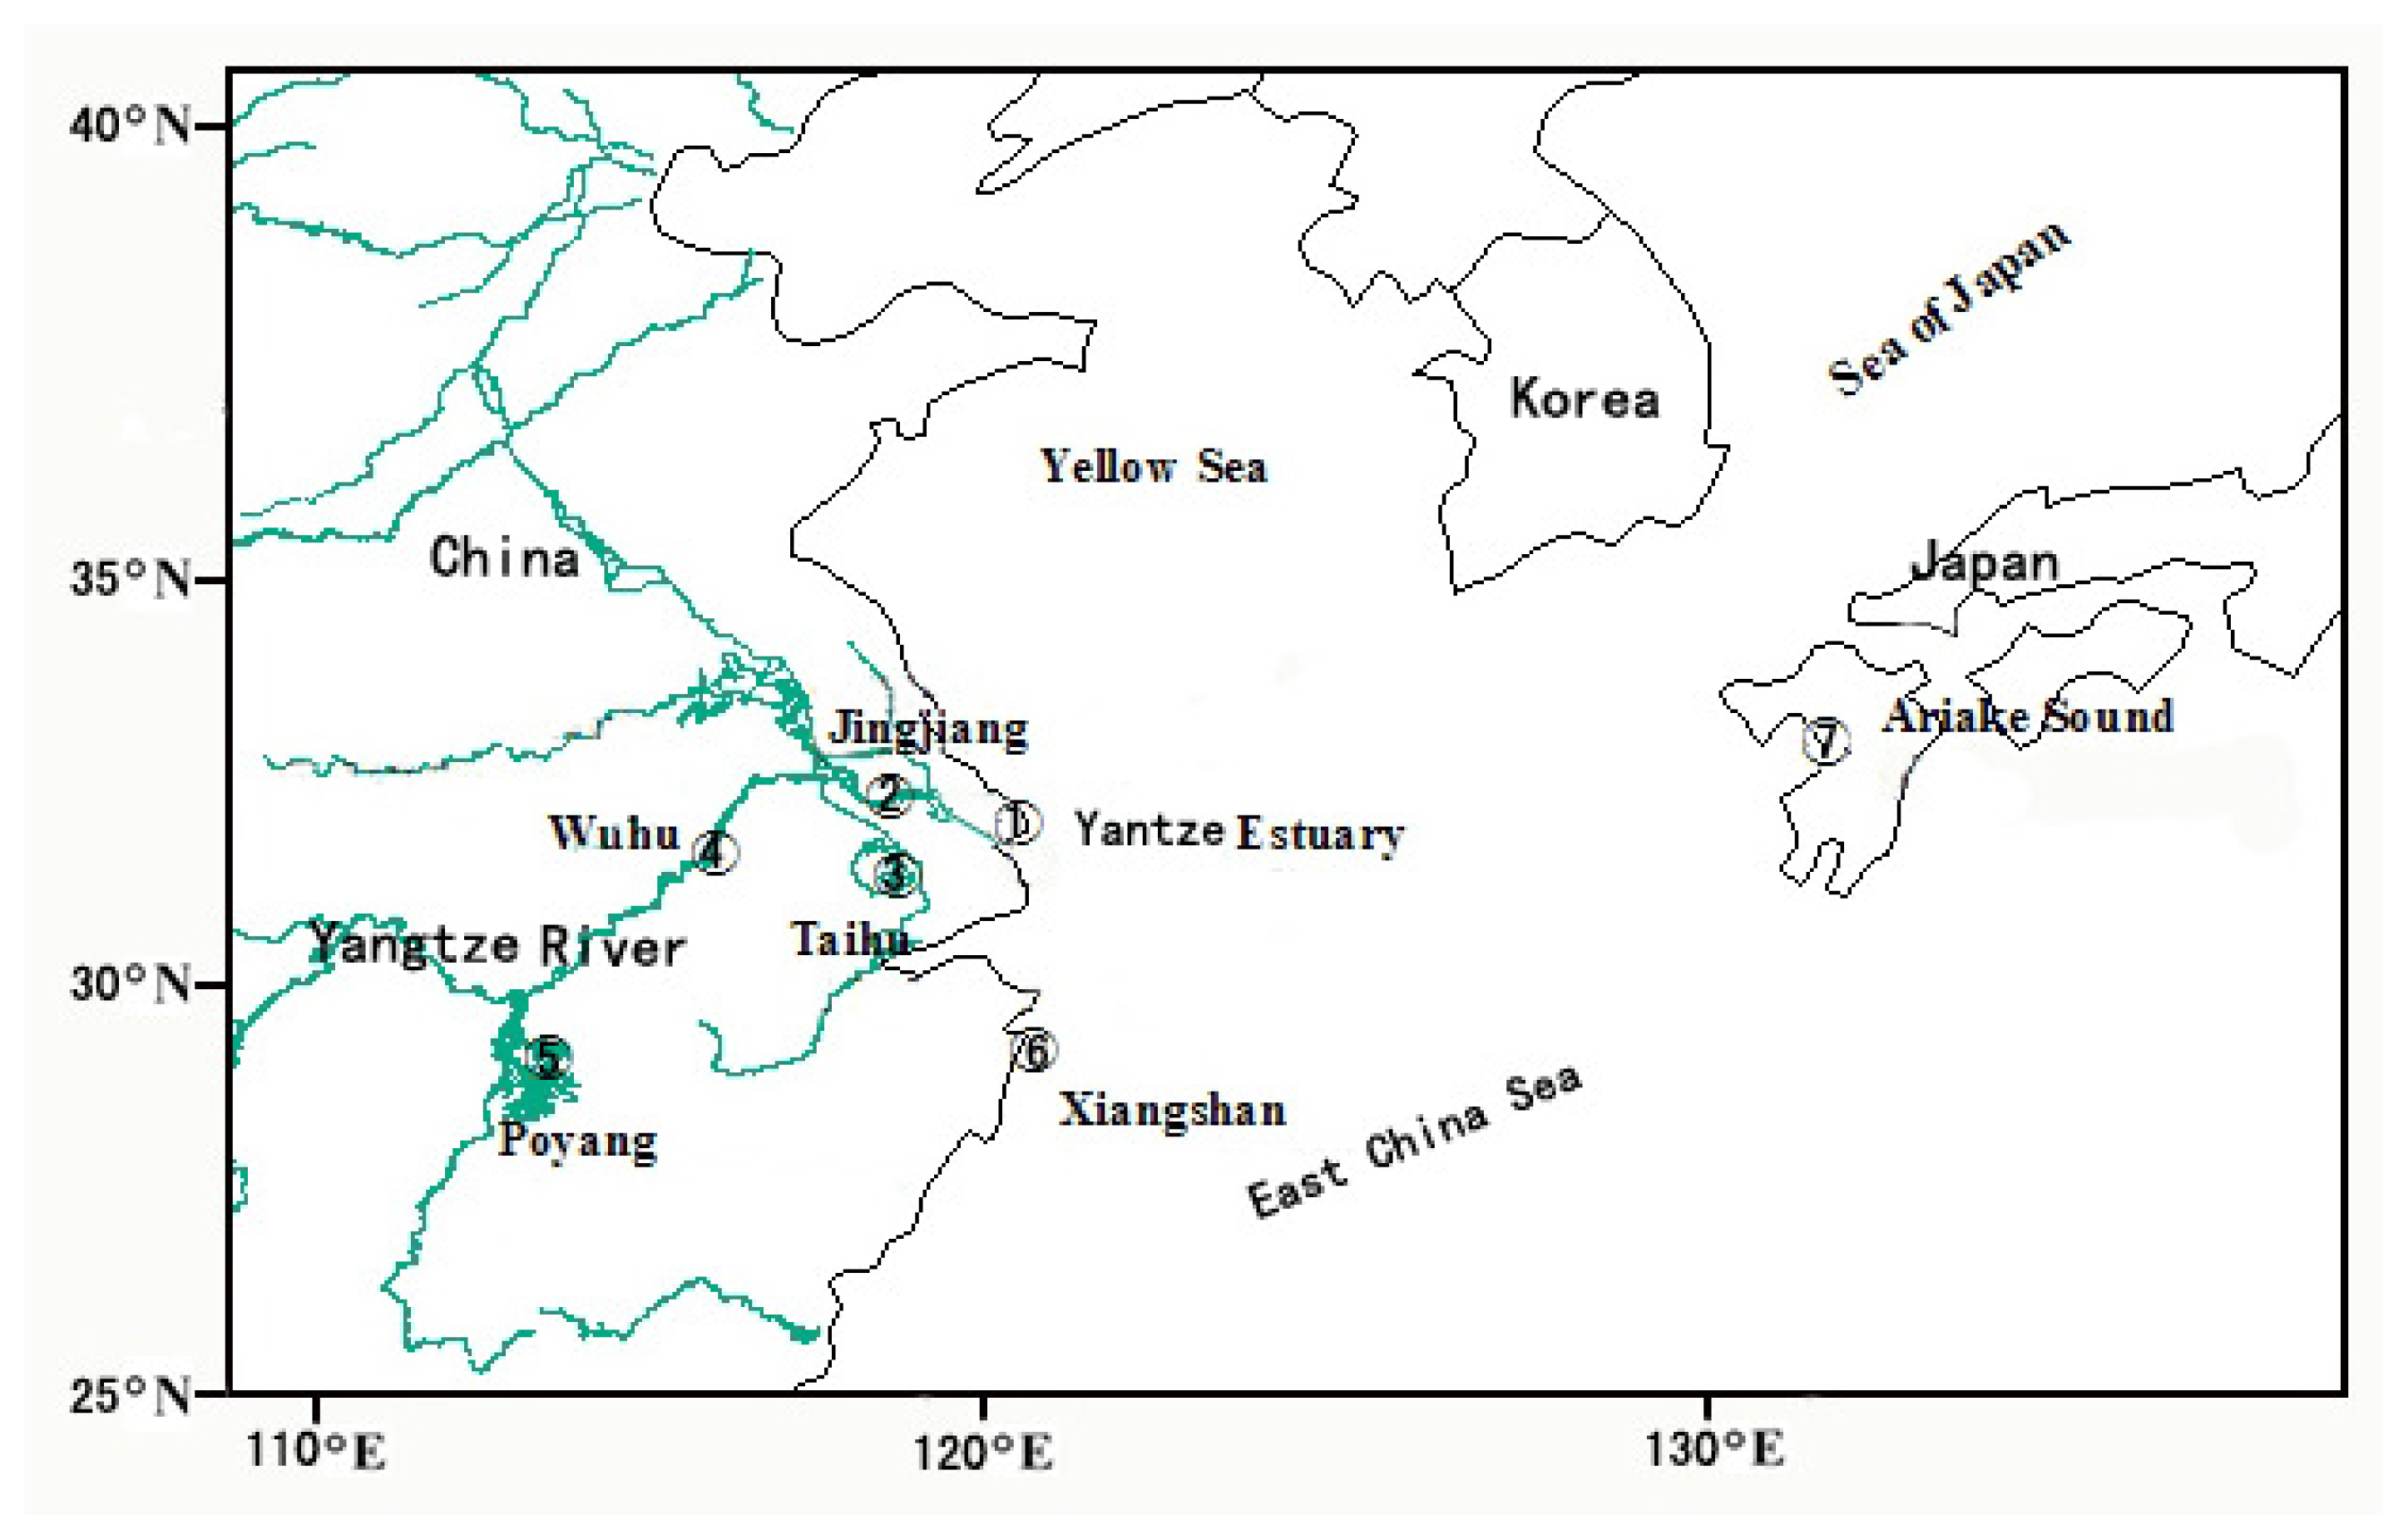
3.1. Sample Collection
3.2. DNA Extraction, PCR Amplification, Cloning, and Sequencing
3.3. Molecular Data Analysis
4. Conclusions
Acknowledgments
References
- Annilo, T.; Laan, M.; Stahl, J.; Metspalu, A. The human ribosomal protein S7-encoding gene: Isolation, structure and localization in 2p25. Gene 1995, 165, 297–302. [Google Scholar]
- Lavoue, S.; Sullivan, J.P.; Hopkins, C.D. Phylogenetic utility of the first two introns of the S7 ribosomal protein gene in African electric fishes (Mormyroidea: Teleostei) and congruence with other molecular markers. Biol. J. Linn. Soc 2003, 78, 273–292. [Google Scholar]
- He, S.P.; Mayden, R.L.; Wang, X.Z.; Wang, W.; Tang, K.L.; Chen, W.J.; Chen, Y.Y. Molecular phylogenetics of the family Cyprinidae (Actinopterygii: Cypriniformes) as evidenced by sequence variation in the first intron of S7 ribosomal protein-coding gene: Further evidence from a nuclear gene of the systematic chaos in the family. Mol. Phylogenet. Evol 2008, 46, 818–829. [Google Scholar]
- Musilová, Z.; Rícan, O.; Janko, K.; Novák, J. Molecular phylogeny and biogeography of the neotropical cichlid fish tribe Cichlasomatini (Teleostei: Cichlidae: Cichlasomatinae). Mol. Phylogenet. Evol 2008, 46, 659–672. [Google Scholar]
- Lang, N.J.; Mayden, R.L. Systematics of the subgenus Oligocephalus (Teleostei: Percidae: Etheostoma) with complete subgeneric sampling of the genus Etheostoma. Mol. Phylogenet. Evol 2007, 43, 605–615. [Google Scholar]
- Chow, S.; Hazama, K. Universal PCR primers for S7 ribosomal protein gene introns in fish. Mol. Ecol 1998, 7, 1255–1256. [Google Scholar]
- Keck, B.P.; Near, T.J. Assessing phylogenetic resolution among mitochondrial, nuclear, and morphological datasets in Nothonotus darters (Teleostei: Percidae). Mol. Phylogenet. Evol 2008, 46, 708–720. [Google Scholar]
- Costedoat, C.; Pech, N.; Chappaz, R.; Gilles, A. Novelties in hybrid zones: Crossroads between population genomic and ecological approaches. PLoS One 2007, 2, e357. [Google Scholar]
- Yaakub, S.; Bellwood, D.; van Herwerden, L. A rare hybridization event in two common Caribbean wrasses (genus Halichoeres; family Labridae). Coral Reefs 2007, 26, 597–602. [Google Scholar]
- Guo, X.; Chen, D. Comparative evolution of the mitochondrial cytochrome b gene and nuclear S7 ribosomal protein gene intron 1 in sinipercid fishes and their relatives. Hydrobiologia 2010, 649, 139–156. [Google Scholar]
- Baffi, M.A.; Ceron, C.R. Molecular analysis of the rDNA ITS-1 intergenic spacer in Drosophila mulleri, D. arizonae, and their hybrids. Biochem. Genet 2002, 40, 411–421. [Google Scholar]
- Coleman, A.W.; Vacquier, V.D. Exploring the phylogenetic utility of ITS sequences for animals: A test case for abalone (Haliotis). J. Mol. Evol 2002, 54, 246–257. [Google Scholar]
- Bower, J.E.; Dowton, M.; Cooper, R.D.; Beebe, N.W. Intraspecific concerted evolution of the rDNA ITS1 in Anopheles farauti sensu stricto (Diptera: Culicidae) reveals recent patterns of population structure. J. Mol. Evol 2008, 67, 397–411. [Google Scholar]
- Vogler, A.P.; DeSalle, R. Evolution and phylogenetic information content of the ITS-1 region in the tiger beetle Cicindela dorsalis. Mol. Biol. Evol 1994, 11, 393–405. [Google Scholar]
- Harris, D.J.; Crandall, K.A. Intragenomic variation within ITS1 and ITS2 of freshwater crayfishes (Decapoda: Cambaridae): Implications for phylogenetic and microsatellite studies. Mol. Biol. Evol 2000, 17, 284–291. [Google Scholar]
- Presa, P.; Pardo, B.; Martinez, P.; Bernatchez, L. Phylogeographic congruence between mtDNA and rDNA ITS markers in brown trout. Mol. Biol. Evol 2002, 19, 2161–2175. [Google Scholar]
- Booton, G.C.; Kaufman, L.; Chandler, M.; Oguto-Ohwayo, R.; Duan, W.; Fuerst, P.A. Evolution of the ribosomal RNA internal transcribed spacer one (ITS-1) in cichlid fishes of the lake victoria region. Mol. Phylogenet. Evol 1999, 11, 273–282. [Google Scholar]
- Liu, Z.; Chen, Z.; Pan, J.; Li, X.; Su, M.; Wang, L.; Li, H.; Liu, G. Phylogenetic relationships in Leymus (Poaceae: Triticeae) revealed by the nuclear ribosomal internal transcribed spacer and chloroplast trnL-F sequences. Mol. Phylogenet. Evol 2008, 46, 278–289. [Google Scholar]
- Yoon, H.S.; Lee, J.Y.; Boo, S.M.; Bhattacharya, D. Phylogeny of Alariaceae, Laminariaceae, and Lessoniaceae (Phaeophyceae) based on plastid-encoded RuBisCo spacer and nuclear-encoded ITS sequence comparisons. Mol. Phylogenet. Evol 2001, 21, 231–243. [Google Scholar]
- Whitehead, P.; Nelson, G.; Wongratana, T. FAO species catalogue. Clupeoid fishes of the world (Suborder Clupeoidei). Part 2. Engraulididae. FAO Fish. Synop 1988, 125, 460–475. [Google Scholar]
- Yuan, C.M.; Qing, A.L.; Liu, R.H.; Lin, J.B. Discussion on subspecific taxanomy of the genus Coillia in middle and lower reaches of Changjiang and southest coastal China Sea. J. Nanjing Univ 1980, 3, 67–82. [Google Scholar]
- Tang, W.Q.; Hu, X.L.; Yang, G.Q. Species validities of Coilia brachygnathus and C. nasus taihuensis based on sequence variations of complete mtDNA control region. Biodivers. Sci 2007, 15, 224–231. [Google Scholar]
- Guo, H.Y.; Wei, K.; Tang, W.Q.; Wu, J.M.; Chen, W.Y. Sibling species discrimination for Chinese genus of Coilia fishes based on sagittal otolith morphology. Acta Zootaxon. Sin 2010, 35, 127–134. [Google Scholar]
- Cheng, Q.Q.; Han, J.D. Morphological variations and discriminant analysis of two populations of Coilia ectenes. J. Lake Sci 2004, 16, 356–364. [Google Scholar]
- Yang, J.Q.; Hu, X.L.; Tang, W.Q. Genetic structure and population history of Coilia nasus in Yangtze River and its south adjacent waters. J. Shanghai Fish. Univ 2008, 5, 513–519. [Google Scholar]
- Ward, R.; Hanner, R.; Hebert, P. The campaign to DNA barcode all fishes, FISH-BOL. J. Fish Biol 2009, 74, 329–356. [Google Scholar]
- Bandelt, H.J.; Lahermo, P.; Richards, M.; Macaulay, V. Detecting errors in mtDNA data by phylogenetic analysis. Int. J. Legal Med 2001, 115, 64–69. [Google Scholar]
- Hebert, P.D.; Ratnasingham, S.; deWaard, J.R. Barcoding animal life: Cytochrome c oxidase subunit 1 divergences among closely related species. Proc. Biol. Sci 2003, 270, S96–S99. [Google Scholar]
- Cheng, W.X.; Tang, W.Q. Some phenotypic varieties between different ecotypes of Coilia nasus in Yangtze River. Chin. J. Zool 2011, 46, 33–40. [Google Scholar]
- Janko, K.; Lecointre, G.; DeVries, A.; Couloux, A.; Cruaud, C.; Marshall, C. Did glacial advances during the Pleistocene influence differently the demographic histories of benthic and pelagic Antarctic shelf fishes? CInferences from intraspecific mitochondrial and nuclear DNA sequence diversity. BMC Evol. Biol 2007, 7, 220. [Google Scholar]
- Pleyte, K.A.; Duncan, S.D.; Phillips, R.B. Evolutionary relationships of the salmonid fish genus Salvelinus inferred from DNA sequences of the first internal transcribed spacer (ITS 1) of ribosomal DNA. Mol. Phylogenet. Evol 1992, 1, 223–230. [Google Scholar]
- Hudson, R.R.; Kaplan, N.L. Statistical properties of the number of recombination events in the history of a sample of DNA sequences. Genetics 1985, 111, 147–164. [Google Scholar]
- van Oppen, M.J.H; Wŏrheide, G.; Takabayashi, M. Nuclear Markers in Evolutionary and Population Genetic Studies of Scleractiniancorals and Sponges. Proceedings 9th International Coral Reef Symposium, Bali, Indonesia, 23–27 October 2000, Indonesian Institute of Sciences: Jakarta, Indonesia, 2000; Volume 1, pp. 131–138. [Google Scholar]
- Kovacs, G.; Rudnoy, S.; Vagvolgyi, C.; Lasztity, D.; Racz, I.; Bratek, Z. Intraspecific invariability of the internal transcribed spacer region of rDNA of the truffle Terfezia terfezioides in Europe. Folia Microbiol 2001, 46, 423–426. [Google Scholar]
- Levinson, G.; Gutman, G.A. Slipped-strand mispairing: A major mechanism for DNA sequence evolution. Mol. Biol. Evol 1987, 4, 203–221. [Google Scholar]
- Lalitha, S. Primer premier 5. Biotechnol. Softw. Internet Rep 2000, 1, 270–272. [Google Scholar]
- Chenna, R.; Sugawara, H.; Koike, T.; Lopez, R.; Gibson, T.J.; Higgins, D.G.; Thompson, J.D. Multiple sequence alignment with the Clustal series of programs. Nucl. Acids Res 2003, 31, 3497–3500. [Google Scholar]
- Itskovich, V.; Gontcharov, A.; Masuda, Y.; Nohno, T.; Belikov, S.; Efremova, S.; Meixner, M.; Janussen, D. Ribosomal ITS sequences allow resolution of freshwater sponge phylogeny with alignments guided by secondary structure prediction. J. Mol. Evol 2008, 67, 608–620. [Google Scholar]
- Zuker, M. Mfold web server for nucleic acid folding and hybridization prediction. Nucl. Acids Res 2003, 31, 3406–3415. [Google Scholar]
- Rozas, J.; Sánchez-DelBarrio, J.C.; Messeguer, X.; Rozas, R. DnaSP, DNA polymorphism analyses by the coalescent and other methods. Bioinformatics 2003, 19, 2496–2497. [Google Scholar]
- Tamura, K.; Peterson, D.; Peterson, N.; Stecher, G.; Nei, M.; Kumar, S. MEGA5: Molecular Evolutionary Genetics Analysis using Maximum Likelihood, Evolutionary Distance, and Maximum Parsimony Methods. Mol. Biol. Evol 2011, 28, 2731–2739. [Google Scholar]
- Excoffier, L.; Smouse, P.E.; Quattro, J.M. Analysis of molecular variance inferred from metric distances among DNA haplotypes: Application to human mitochondrial DNA restriction data. Genetics 1992, 131, 479–486. [Google Scholar]
- Excoffier, L.; Lischer, H.E.L. Arlequin suite ver 3.5: A new series of programs to perform population genetics analyses under Linux and Windows. Mol. Ecol. Res 2010, 10, 564–567. [Google Scholar]
- Xia, X.; Xie, Z. DAMBE: software package for data analysis in molecular biology and evolution. J. Hered 2001, 92, 371–373. [Google Scholar]


| Sequence | Frequency | Haplotype | |
|---|---|---|---|
| Code | 0000000001111111112222222233333344444444444555555555555566666666677777 | ||
| 5555577880015568990113459934566912233668899000011233456900113344812234 | |||
| 2567856171930927561485444627616220556057938346907548233347461801121943 | |||
| JJ1a | tgtggattttacttcgacttgttaatttacccaagatatacattaggattgctctatactaaacacttga | 2 | H1 |
| JJ1b | a a . . . . c . . . . a . . t . . . . . . . . . . c . . . g . . . . . c . g . . . . . g . a . . . . . . a . c . . . . . . . . . g . . . c . | 3 | H2 |
| JJ2a | . . . . . c . . . . . . . . . . . . . . . c . . g . . . . . . . . . . . . . . . . . . . . . . . c . . . . . . . . . . . . . . . g . . c c . | 1 | H3 |
| JJ2b | . . . . . . . . . . . . . . . . . . . . . . . . . . . . . . . . . . . . . . . . . . . . g . . . . . . . . . . . . c . . . g . . g t . . c . | 2 | H4 |
| JJ3 | . . . . . . . . . . . . . c . . . . . . . . a . . . . . . . t . . . . c c . . . . . . . . . . . . . . . . . . . . c t . . . . . g . . . c . | 3 | H5 |
| JJ4 | a a . . . . c . . . . a . . t . . . . . . . . . . c . . . . . . . . . c . g . . . . . g . a - - . . . . . t . . . . . . . . . t g . . . c . | 2 | H6 |
| JJ5a | a . . . t . . . . . . a . . . . . . . . . . . . . c . . . . . - . . . c . g . . . g . g . a . . . . . . . . . . . . . . . . . . g . . . c g | 2 | H7 |
| JJ5b | a a . . . . c . . . . a . . t . . . . . . . . . . c . . . . . . . . . c . g . . . . . g . a - - . c . . . t . . . . . . . . . t g . . . c . | 2 | H8 |
| PY1 | a . . . t . . . . . . a . . . . . . . . . . . . . c . . . . . - . . . c . g . . . . . g . a . . . . . . . . . . a . . . . . . . g . . . c . | 3 | H9 |
| PY2 | a a . . . . c . . a . a a . t . . . c c . . . . . c . c . g . . . . . c . g . . . . . g . a . . . . . . . . c g . . . . . . . . g . . . c . | 2 | H10 |
| PY3a | a . . . t . . c . . . a . . . . . . . . . . . . . c . . . . . - . . . c . g . . . . c g . a . . . . . . . . . . . . . . . . - . g . . . c . | 2 | H11 |
| PY3b | a . . . t . . . . . . a . . . . . . . . . . . . . c . . . . . - . . . c . g . . . . . g . a . . . . . . . . . . . . . . . . . . g . . . c . | 5 | H12 |
| PY4 | a . . . t . . . . . . a . . . . . . . . . . c . . c . . . . . - . . . c . g . . . . . g . a . . . . . . . . . . a . . c . . . . g . . . c . | 6 | H13 |
| TH1a | . . - - . . . . . . . . . . . . . . . . a . . . . . . . . . . . . . . . . . . . . . . . . . . . . . . . . . . . . c . . . . . . g . . . c . | 2 | H14 |
| TH1b | . . . . . . . . . . g . . . . . . . . . . . . . . . . . . . . . . . . . . . . . . . . . . . . . . . . t . . . . . c . . g . . . g . . . c . | 1 | H15 |
| TH2 | . . . . . . . . . . . . . . . . . . . . . . . . . . . . . . . . . . . . . . . . . . . . . . . . . . . . . . . . . c . . . . . . g . c . c . | 3 | H16 |
| TH3 | . . . . . . . . . . . . . . . . . . . . . . . . . . . . g . . . . . . . . . . . . . . . . . . g . . . . . . . . . c . . . . . . g . . . c . | 3 | H17 |
| TH4 | . . - - . . . . . . . . . . . . . . . . . . . . . . c . . . . . . . . . . . . . . . . . . . . . . . . . . . . . . c . . . . . . g . . . c . | 5 | H18 |
| TH5b | . . . . . . . . c . g . . . . . . . . . . . . t . . . . . . . . . . . . . . . g t . . . . . . . . . . . . . . . . c . . . . . . g . . . c . | 2 | H19 |
| TH6a | . . . . . . . . . . . . . . . . . . . . . . . . . . . . . . . . . . . c . . . . . . . . . . . . . . . . . . . . . c t . . . . . g . . . c . | 3 | H20 |
| TH6b | . . . . . . . . . . . . . . . - . . . . . . . . . c . . . . . . . . . c . . c . . . . . . . . . . . a . . . . . . c t . . . . . g . . . c . | 2 | H21 |
| YE1 | a a . . . . c . . . . a . . t . . . . . . . . . . c . . . g . . . . . c . g . . . . . g . a . . . . . . . . c . . . . . . . . . g . . . c . | 3 | H22 |
| YE2 | a a . . . . c . . . . a a . t . . . . . . . . . . c . . . g . . . . . c . g . . . . . g . a . . . . . . . . c . . . . . . . . . g . . . c . | 3 | H23 |
| XS1b | a . . . . . . . . . . a . . . . - - . . . . . . . c . . . . . . g . . c . . . . . . . . . . . . . . . . . . . . . c . . . . . . . . . . c . | 2 | H24 |
| XS2b | a a . . . . c . . . . a . . t . . . . . . . . . . c . . . . . . . . . c . g . . . . . g . a - - . . . . . t . . . . . . . . . t g . c . c . | 2 | H25 |
| WH1 | a a . . . . c . . . . a . . t . . . . . . . . . . a . . . . . . . g . c . g . . . . . g . a . . . . . . . . . . . . . . . . . . g . . . c . | 3 | H26 |
| WH2 | a a . . . . c . . . . a . . t . . . . . . . . . . c . . . g . . . . t c . g . . . . . g . a . . . . . . . . . . . . . . . . . . g . . . c . | 3 | H27 |
| WH4 | a . . . . . . . . . . a . . . . - - . . . . . . . c . . . . . . g . . c . . . . . . . . . . . . . . . . . . . . . c . . . . . . g . . . . . | 6 | H28 |
| AS | . . . . . . . . . . . . . . . . . . . . . . . . . . . . . . . . . . . . . . . . . . . . . . . . . . . . . . . . . c . . . . . . g . . . c . | 15 | H29 |
| Position | 52 | 113 | 296 | 435 | ||
|---|---|---|---|---|---|---|
| Parent | AS(5) * | T | C | T | A | |
| TH(5) * | T | C | T | A | ||
| Hybrid | JJ1 | a | T | C | T | A |
| b | A | A | C | C | ||
| JJ6 | a | T | C | T | A | |
| b | A | A | C | C | ||
| Hybrid | XS1 | a | T | C | T | A |
| b | A | A | C | C | ||
| XS2 | a | T | C | T | A | |
| b | A | A | C | C | ||
| Parent | PY(6) * | A | A | C | C | |
| Nucleotide Composition (%) | Variable Sites | Haplotypes | AMOVA (%) | ||||||
|---|---|---|---|---|---|---|---|---|---|
| A + T | G + C | single | parsi | indel | H | Hd | among | within | |
| rpS7 | 56.5 | 43.5 | 35 | 26 | 9 | 29 | 0.76 | 29.9 | 70.1 |
| ITS1 | 31.8 | 68.2 | 21 | 2 | 18 | 29 | 0.69 | 10.3 | 89.7 |
| COI | 55.5 | 45.5 | 4 | 6 | 0 | 9 | 0.68 | 1.9 | 98.1 |
| Nucleotide Diversity | Trans/Transv | Neutrality Tests | |||||||
| among | within | s | v | s/v | Taj D | P * | Fu | P * | |
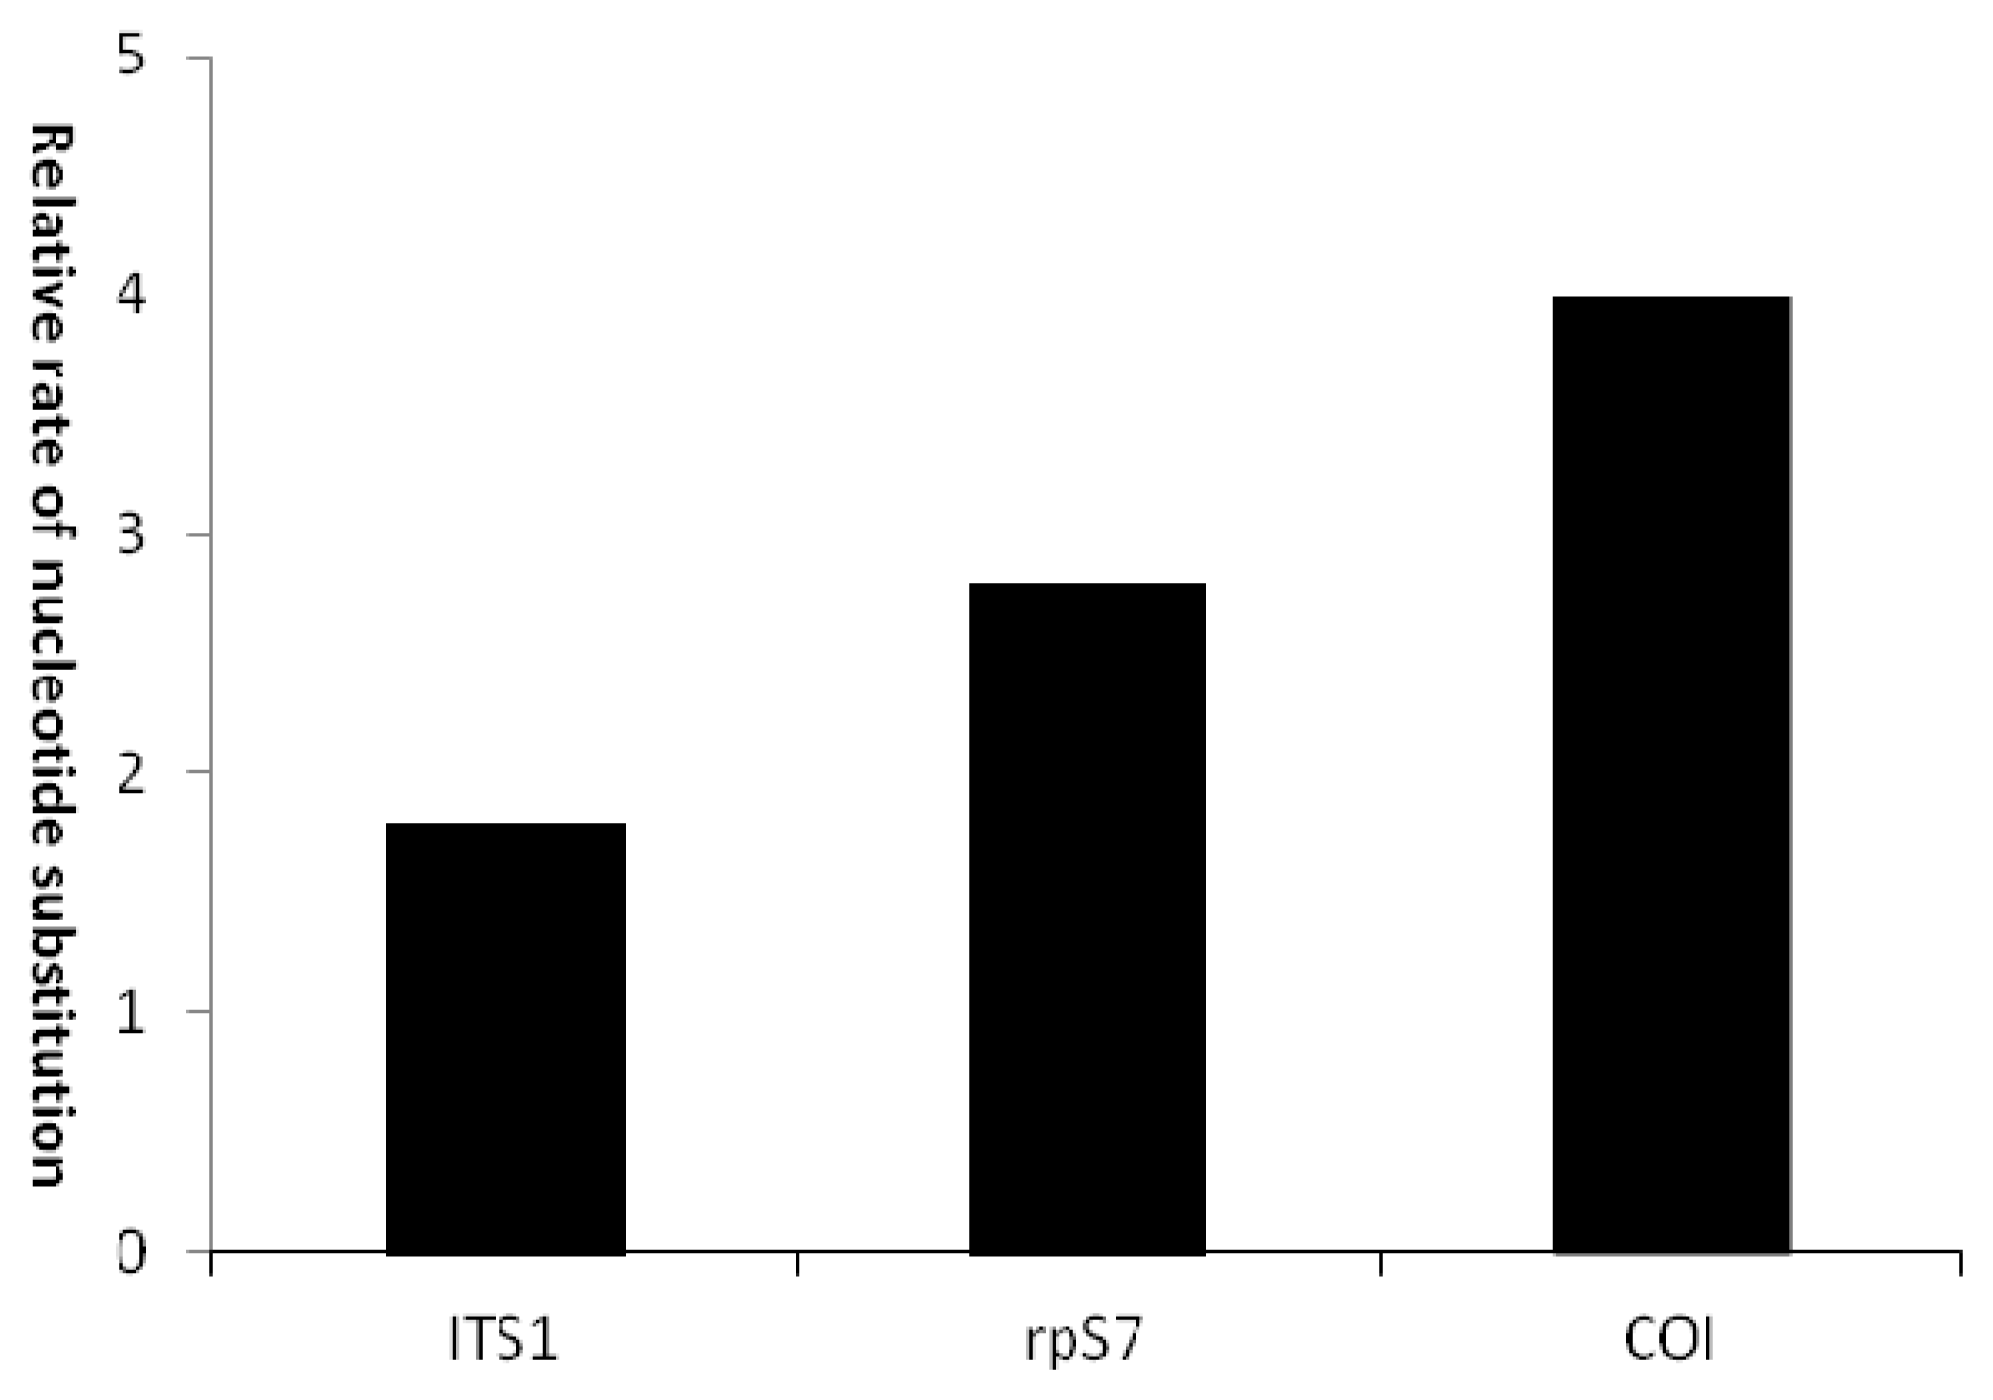
| rpS7 | 0.013–0.017 | 0.013 | 45 | 16 | 2.8 | −1.328 | N | −2.377 | N |
| ITS1 | 0.003–0.009 | 0.006 | 16 | 9 | 1.8 | −2.263 | Y | −2.377 | N |
| COI | 0.001–0.005 | 0.003 | 8 | 2 | 4.0 | −1.070 | N | −1.018 | N |
| Repeats | Sequence Position | Region of Secondary Structure |
|---|---|---|
| (CT)5–8CC(CT)3 | 96–121 | 4th internal loop |
| (CT)8 | 96–111 | 4th internal loop |
| (CCAAA)1–2 | 281–297 | 2th internal loop |
| Primer | Gene | Sequence (5′-3′) | Source |
|---|---|---|---|
| S7RPEX2R | rpS7-1 | TGGCCTCTTCCTTGGCCGTC | Reference [6] |
| S7RPEX2R | rpS7-1 | AACTCGTCTGGCTTTTCGCC | Reference [6] |
| ITS1F | ITS1 | AGGTGAACCTGCGGAAGG | Present study |
| ITS2R | ITS1 | TGATCCACCGCTAAGAGTTGTA | Present study |
| COIBF | COI | TGGCAATYACACGTTGATTYT | Present study |
| COIBR | COI | TTHCCBGCRTRRTARGCTACRA | Present study |
© 2012 by the authors; licensee Molecular Diversity Preservation International, Basel, Switzerland. This article is an open-access article distributed under the terms and conditions of the Creative Commons Attribution license (http://creativecommons.org/licenses/by/3.0/).
Share and Cite
Liu, D.; Guo, H.-Y.; Tang, W.-Q.; Yang, J.-Q. Comparative Evolution of S7 Intron 1 and Ribosomal Internal Transcribed Spacer in Coilia nasus (Clupeiformes: Engraulidae). Int. J. Mol. Sci. 2012, 13, 3085-3100. https://doi.org/10.3390/ijms13033085
Liu D, Guo H-Y, Tang W-Q, Yang J-Q. Comparative Evolution of S7 Intron 1 and Ribosomal Internal Transcribed Spacer in Coilia nasus (Clupeiformes: Engraulidae). International Journal of Molecular Sciences. 2012; 13(3):3085-3100. https://doi.org/10.3390/ijms13033085
Chicago/Turabian StyleLiu, Dong, Hong-Yi Guo, Wen-Qiao Tang, and Jin-Quan Yang. 2012. "Comparative Evolution of S7 Intron 1 and Ribosomal Internal Transcribed Spacer in Coilia nasus (Clupeiformes: Engraulidae)" International Journal of Molecular Sciences 13, no. 3: 3085-3100. https://doi.org/10.3390/ijms13033085