Quantitative Structure-Activity Relationship Studies on Indenoisoquinoline Topoisomerase I Inhibitors as Anticancer Agents in Human Renal Cell Carcinoma Cell Line SN12C

Abstract
:1. Introduction
2. Results and Discussion
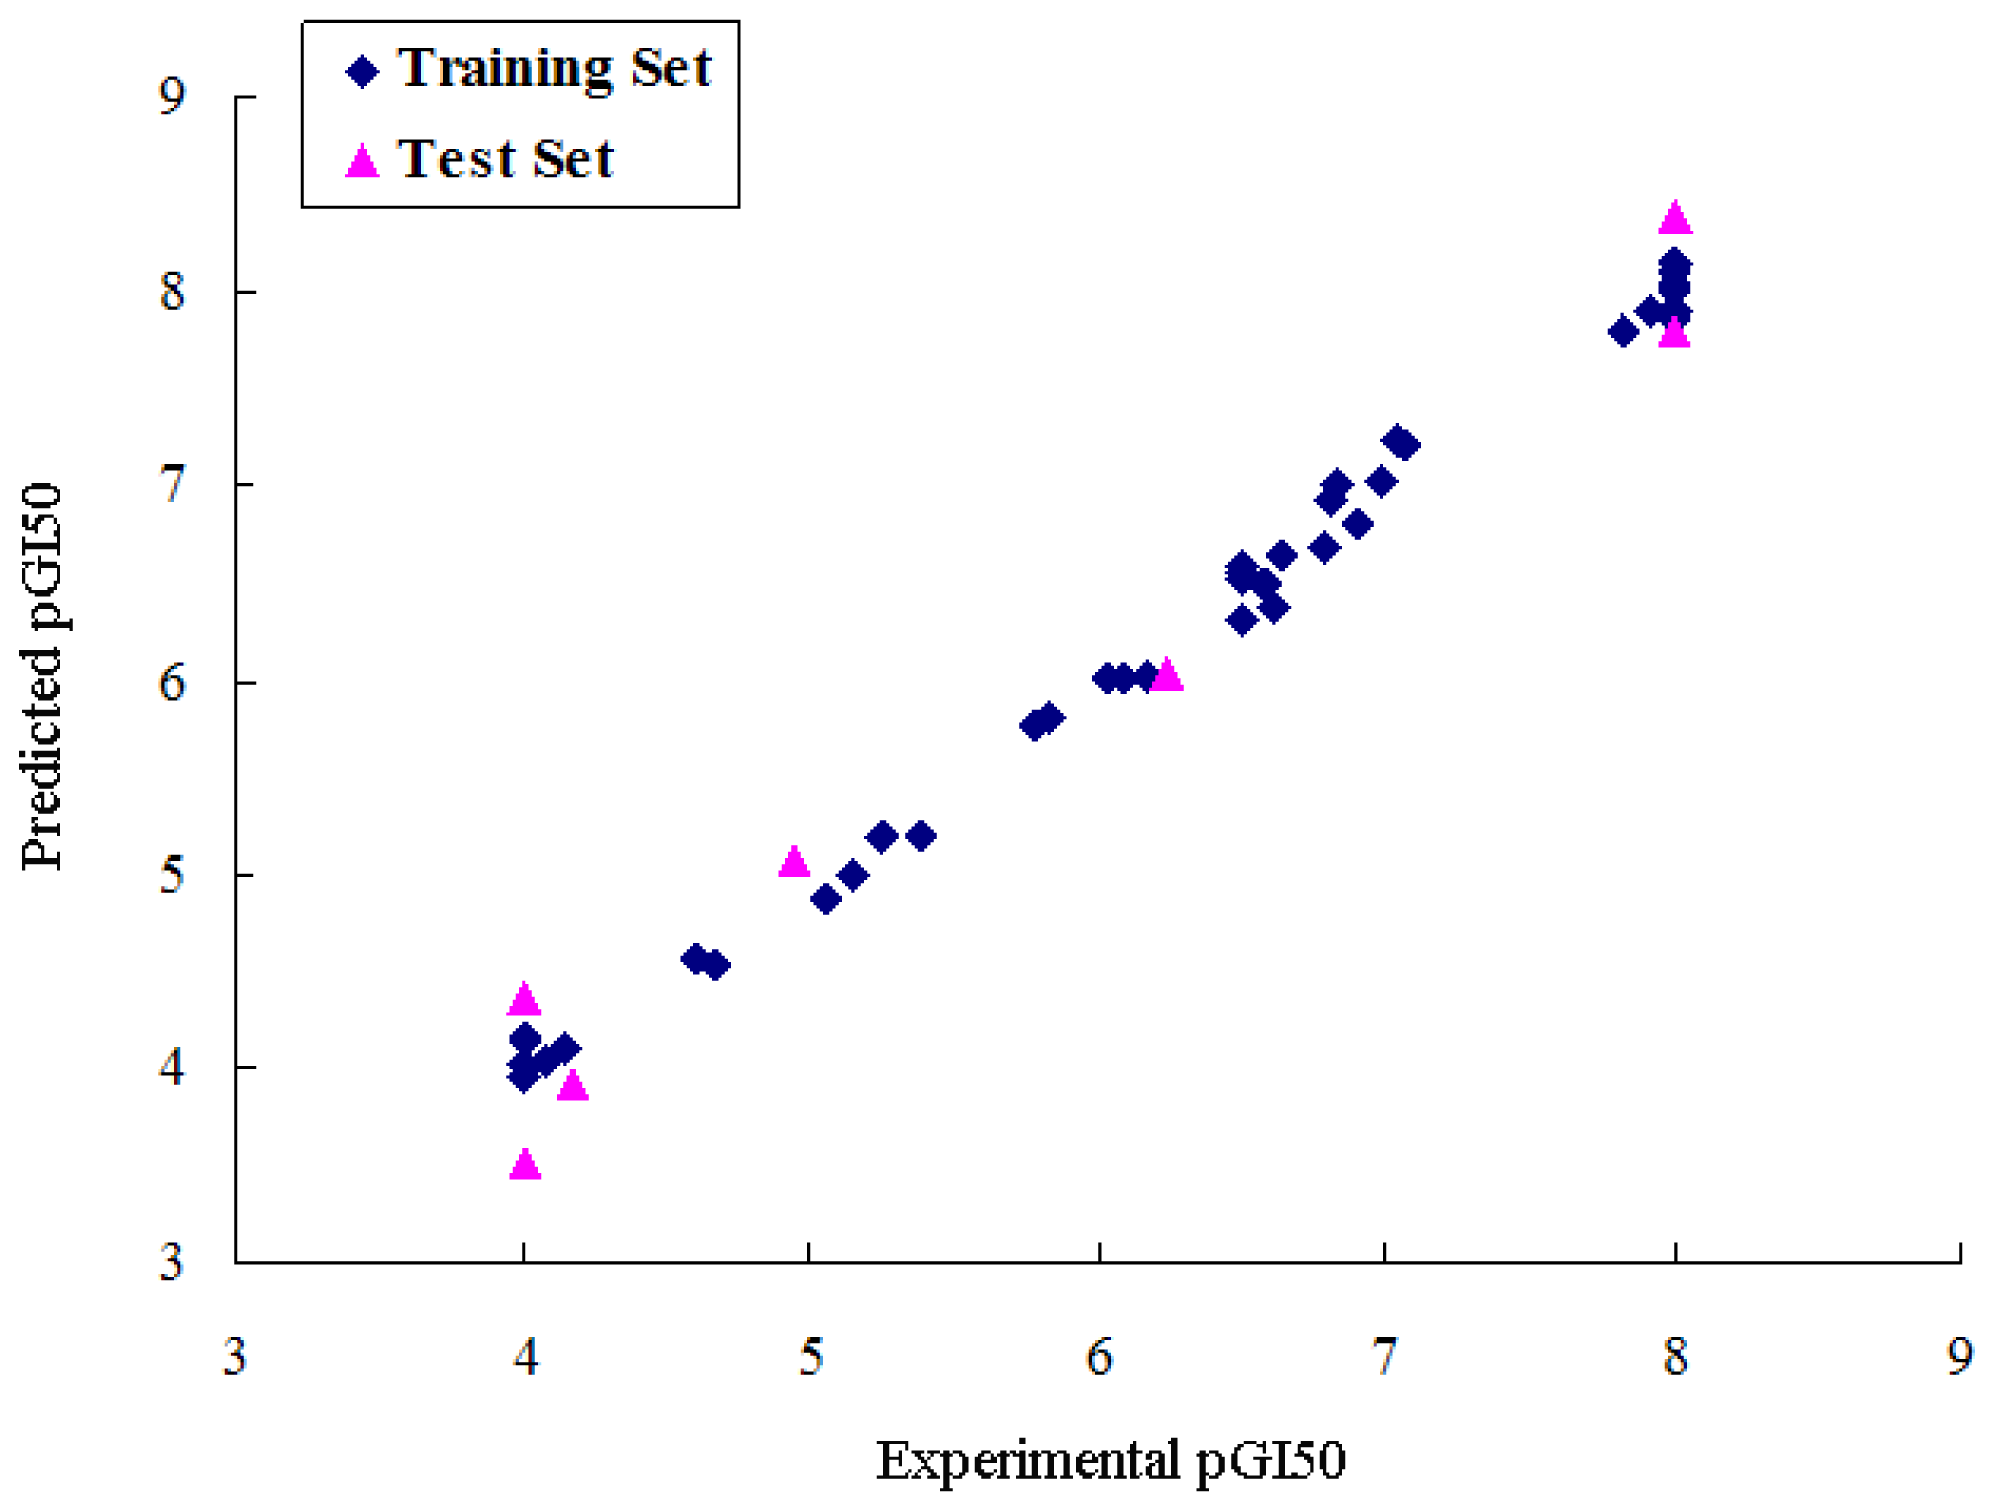
2.1. CoMFA Analysis
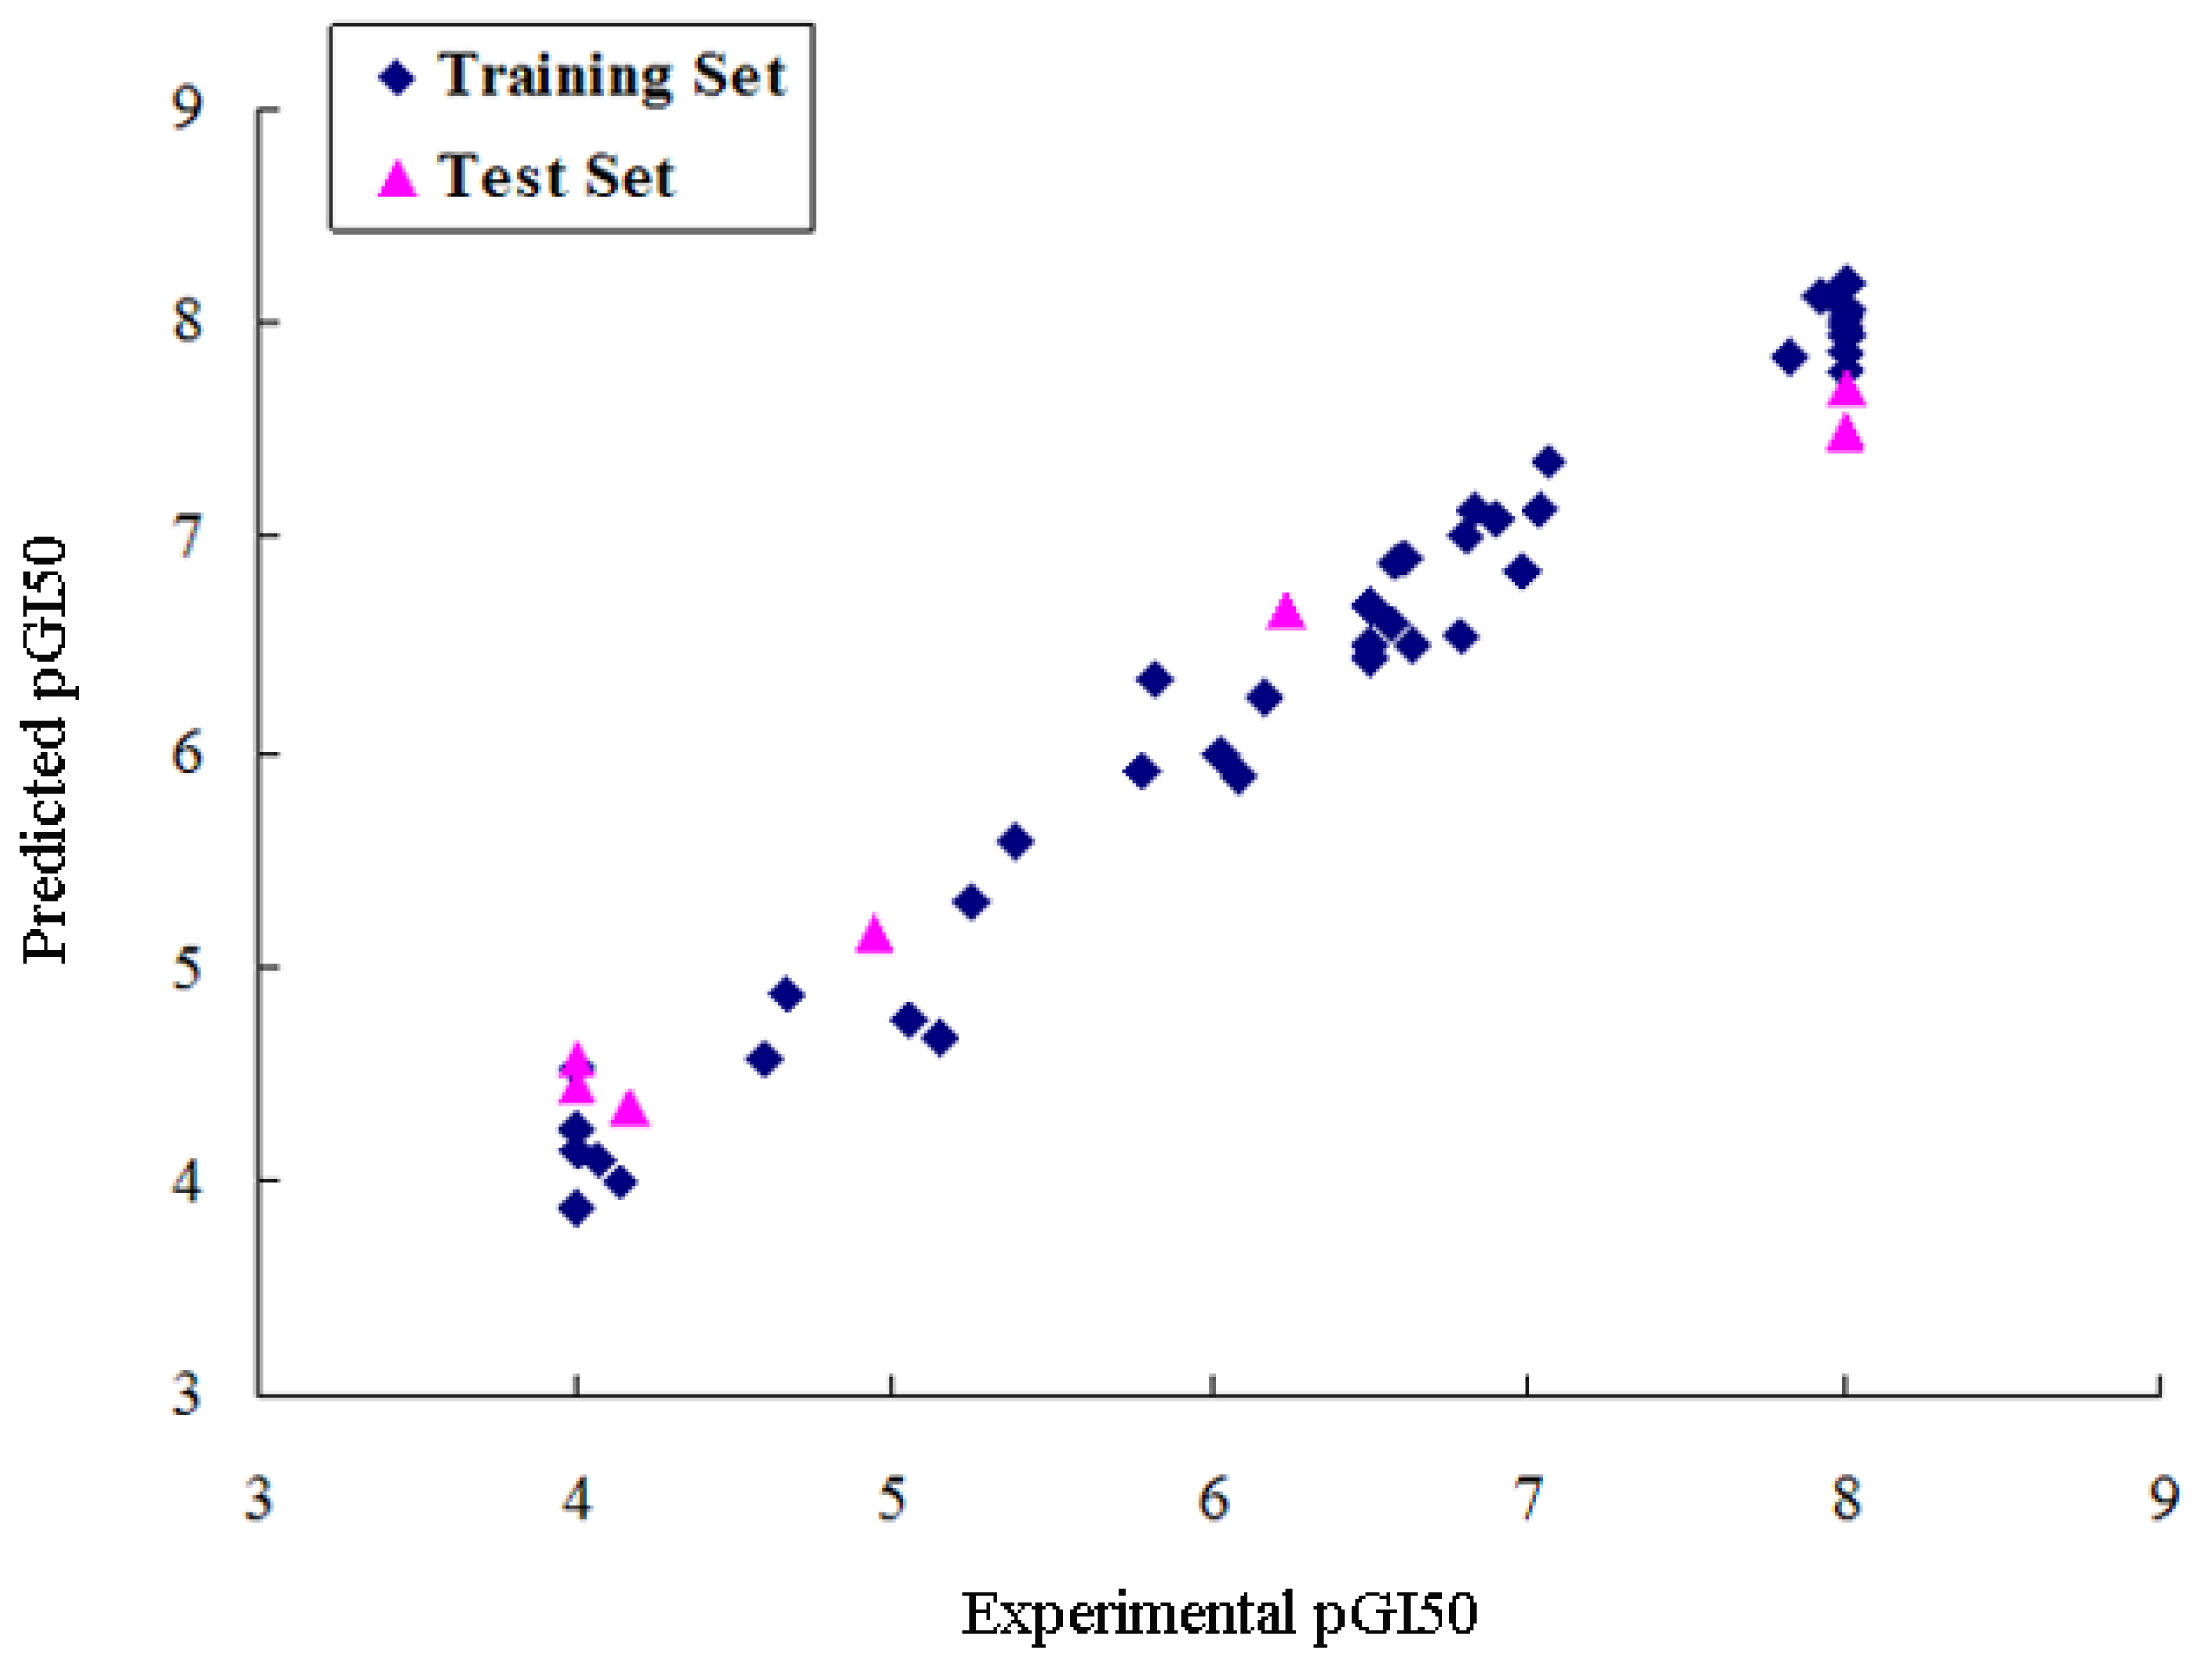
2.2. CoMSIA Analysis
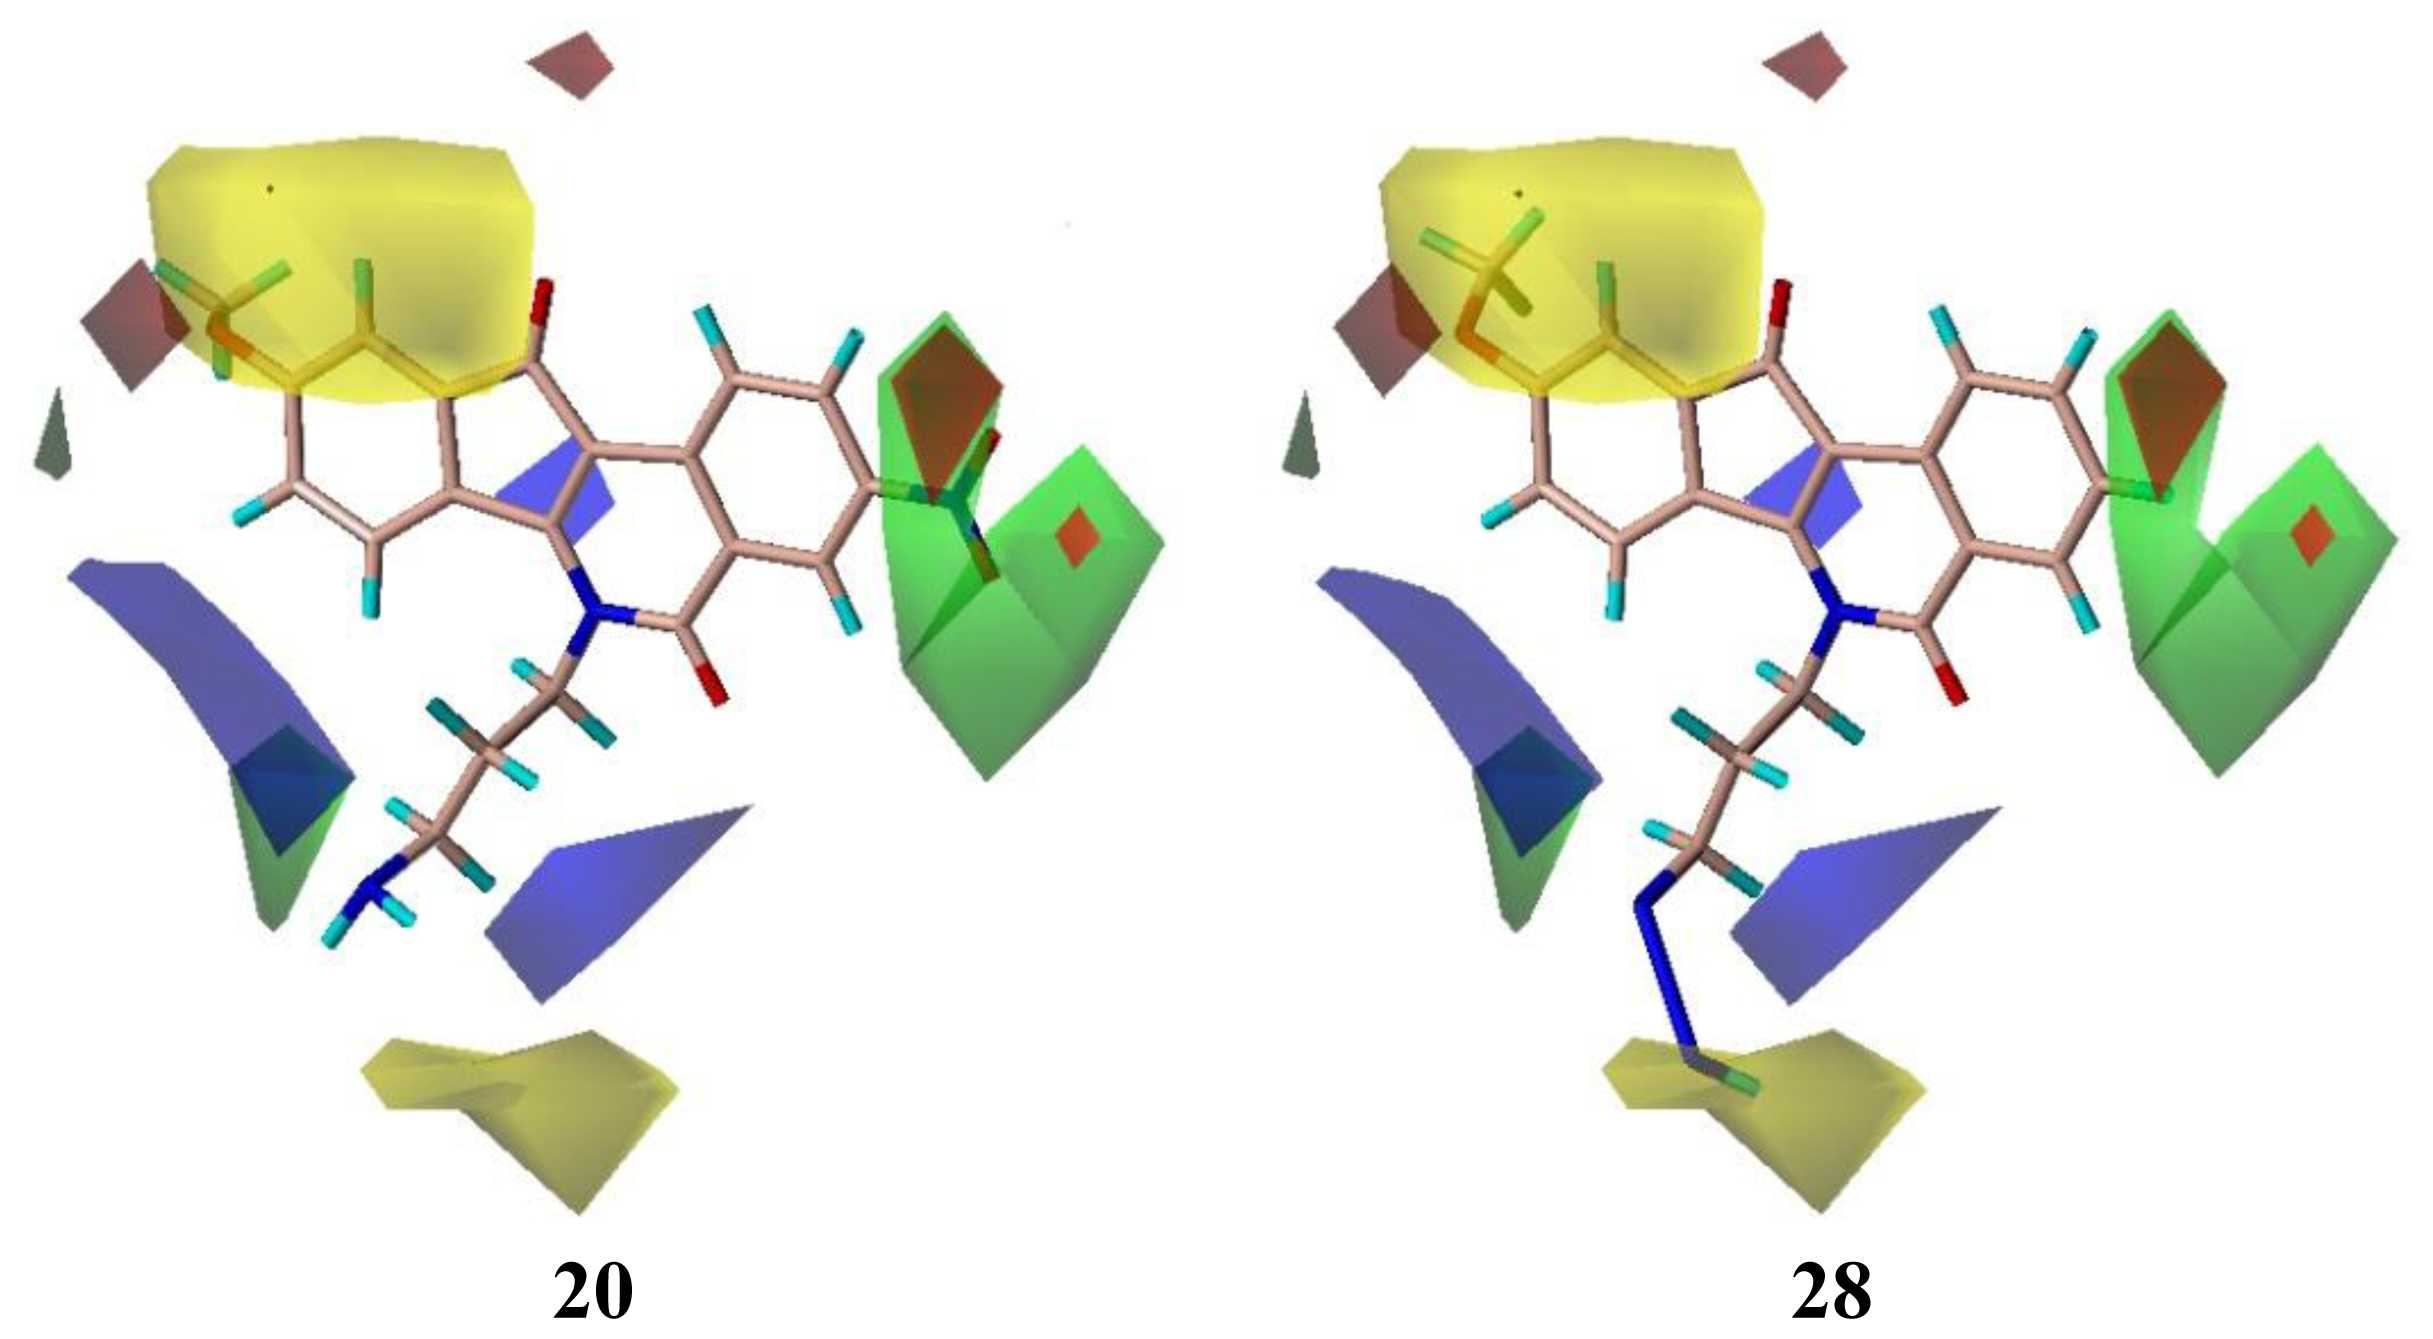
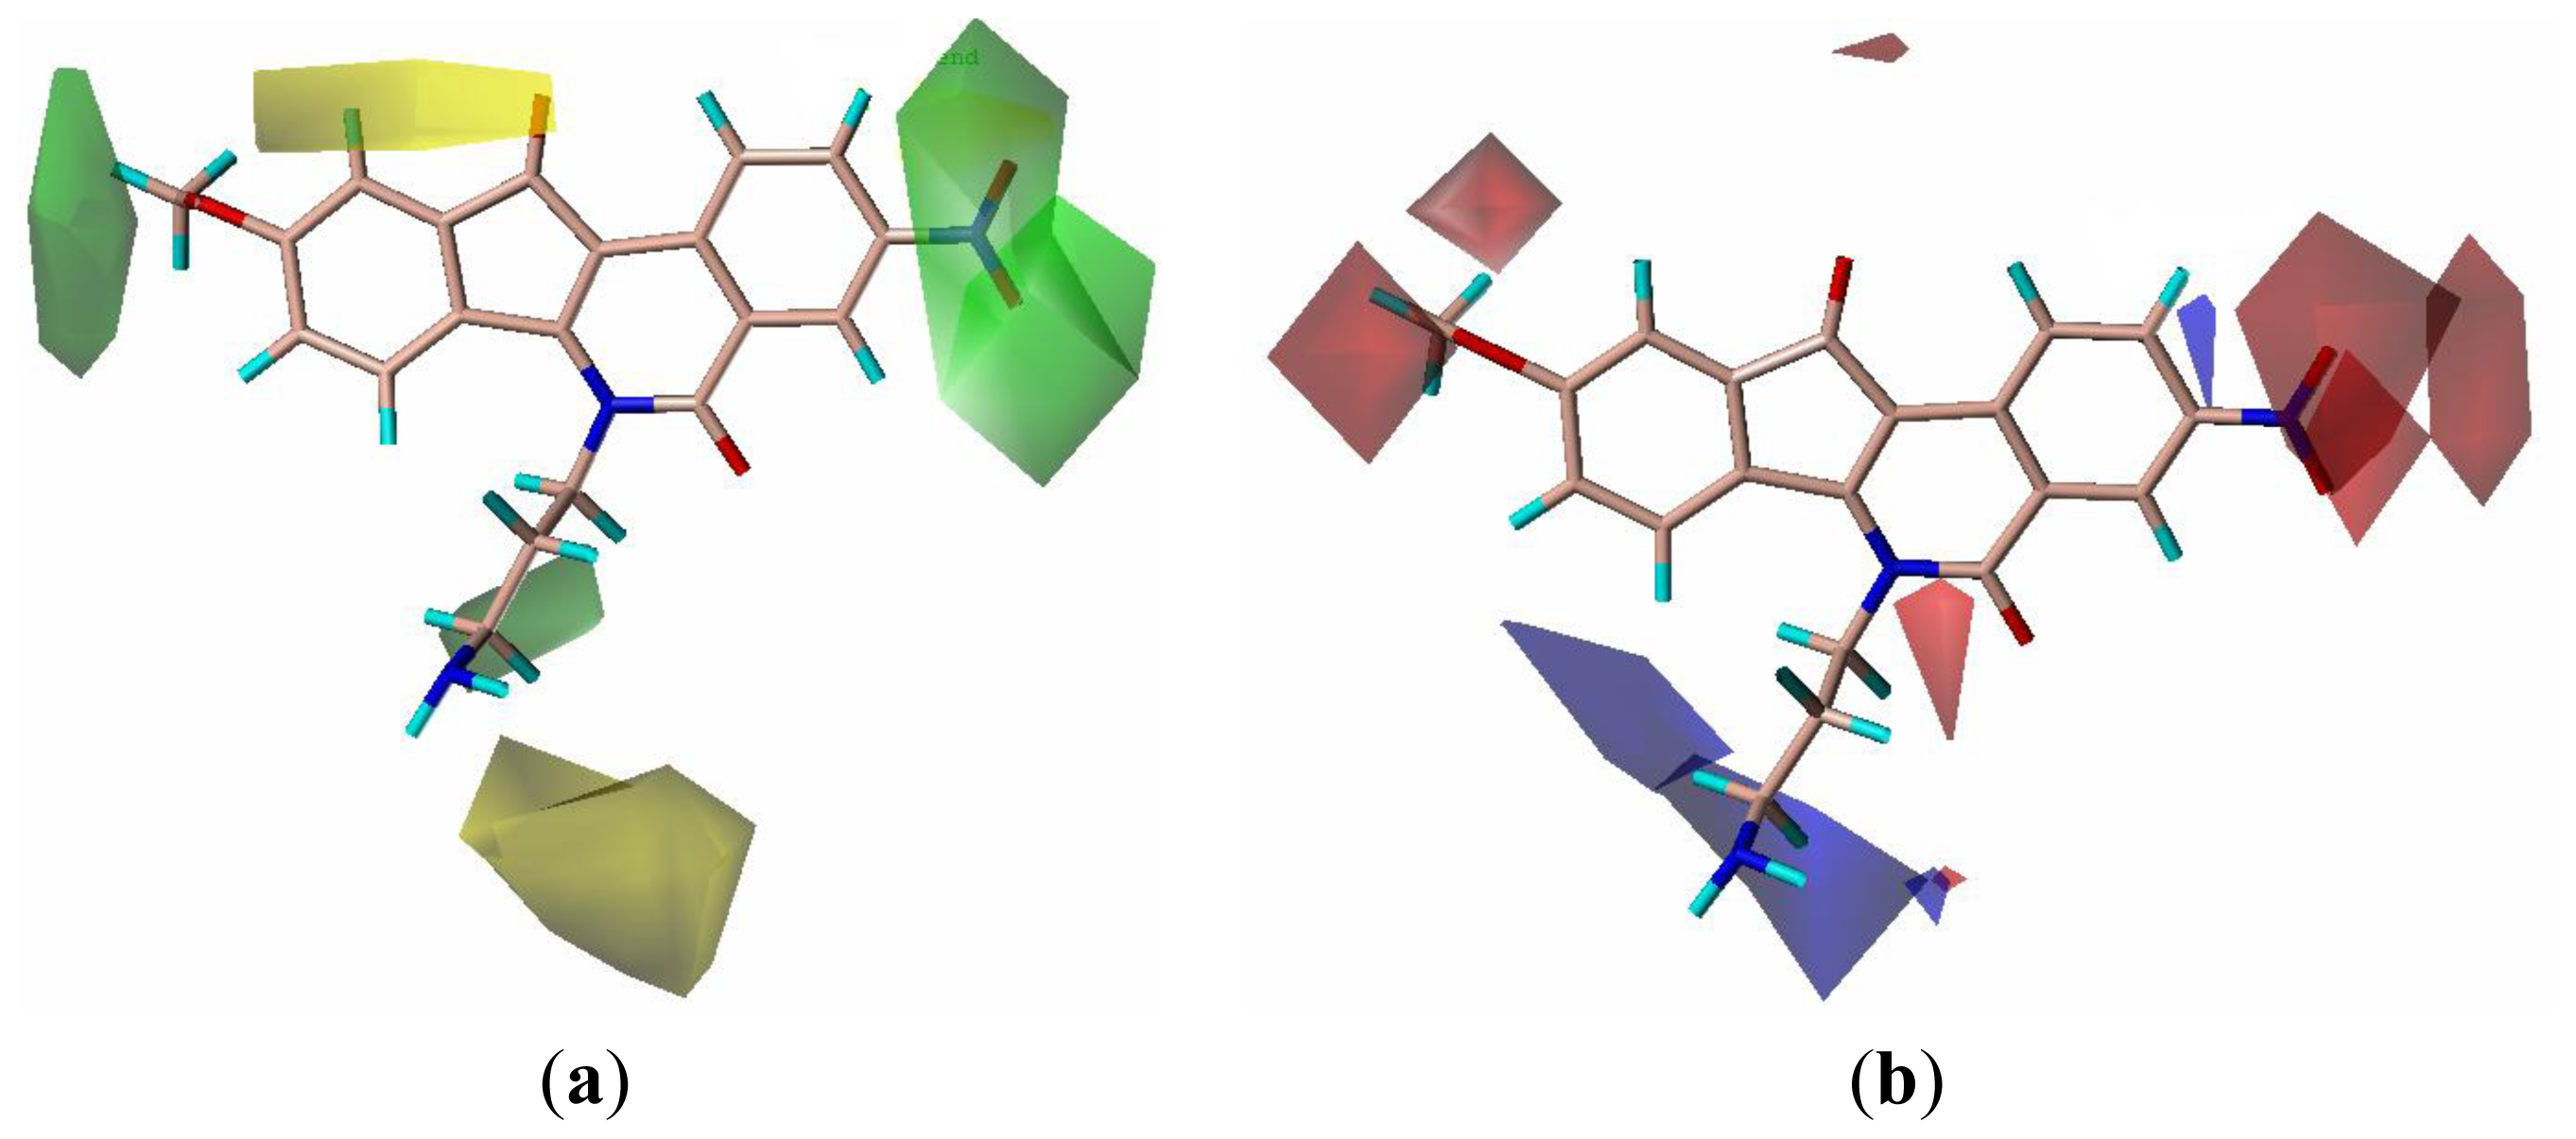
2.3. CoMFA Contour Maps
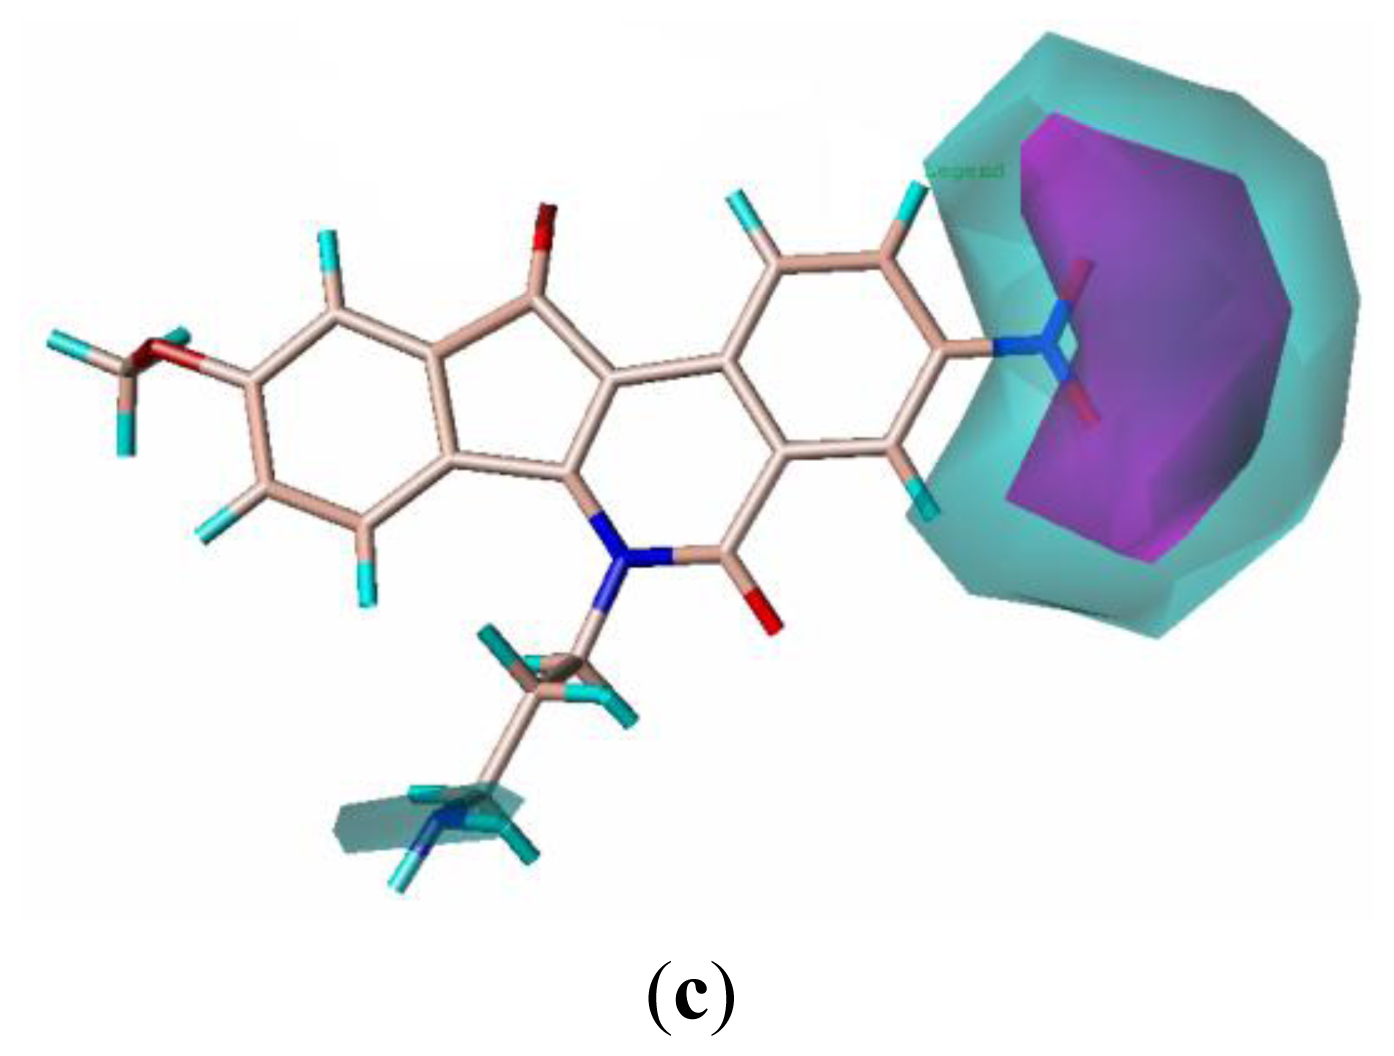
2.4. CoMSIA Contour Maps
2.5. Design of New Inhibitors
3. Experimental Section
3.1. Data Set
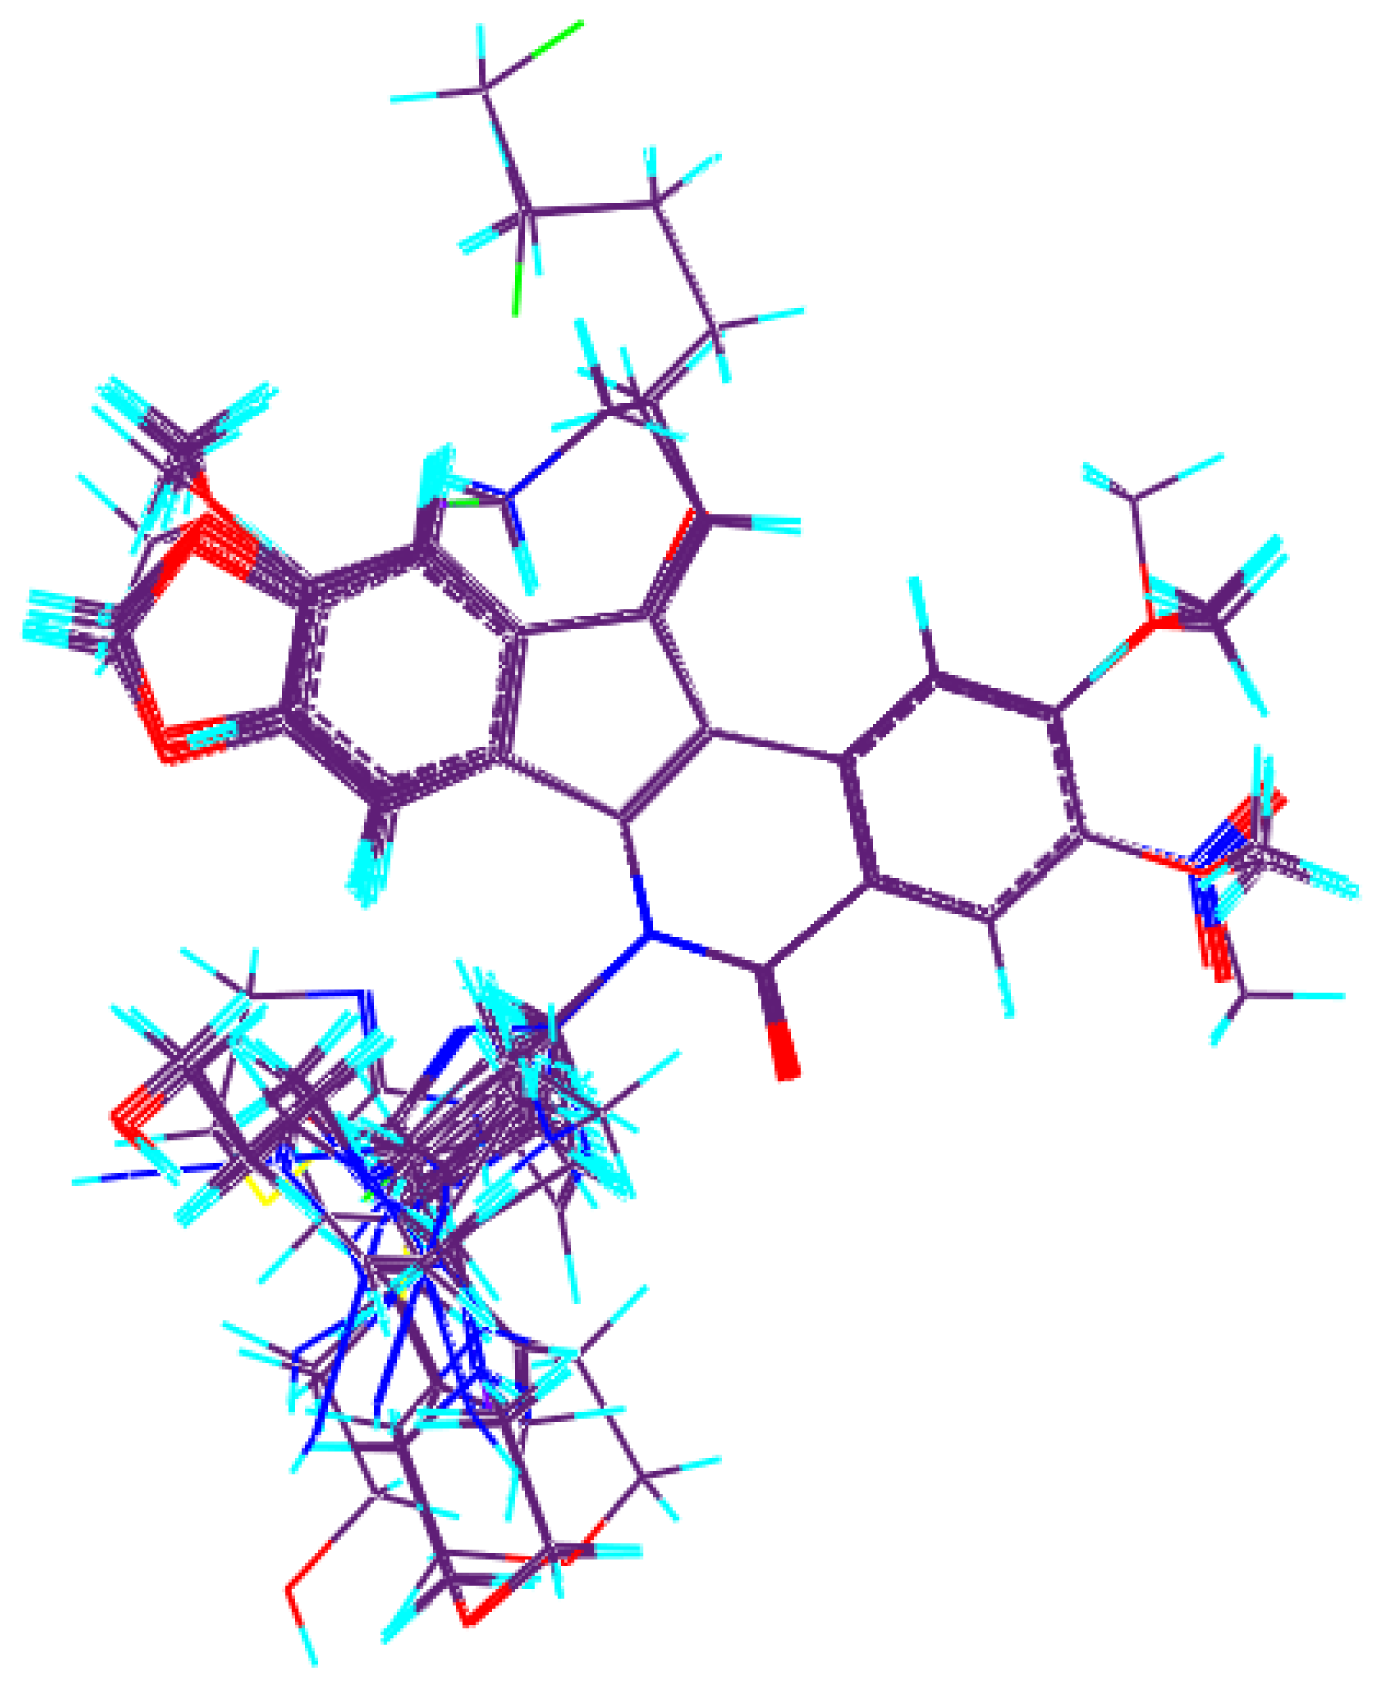
3.2. Molecular Alignment
3.3. Partial Least Squares (PLS) Analysis
3.4. Predictive Correlation Coefficient
3.5. CoMFA Studies
3.6. CoMSIA Studies
4. Conclusions
Acknowledgments
References
- Jemal, A.; Siegel, R.; Xu, J.; Ward, E. Cancer statistics, 2010. CA Cancer J. Clin 2010, 60, 277–300. [Google Scholar]
- Ljungberg, B.; Campbell, S.C.; Choi, H.Y.; Jacqmin, D.; Lee, J.E.; Weikert, S.; Kiemeney, L.A. The epidemiology of renal cell carcinoma. Eur. Urol 2011, 60, 615–621. [Google Scholar]
- Motzer, R.J.; Mazumdar, M.; Bacik, J.; Berg, W.; Amsterdam, A.; Ferrara, J. Survival and prognostic stratification of 670 patients with advanced renal cell carcinoma. J. Clin. Oncol 1999, 17, 2530–2540. [Google Scholar]
- Pommier, Y. Topoisomerase I inhibitors: Camptothecins and beyond. Nat. Rev. Cancer 2006, 6, 789–802. [Google Scholar]
- Pommier, Y.; Pourquier, P.; Fan, Y.; Strumberg, D. Mechanism of action of eukaryotic DNA topoisomerase I and drugs targeted to the enzyme. Biochim. Biophys. Acta 1998, 1400, 83–105. [Google Scholar]
- Wang, J.C. Cellular roles of DNA topoisomerases: A molecular perspective. Nat. Rev. Mol. Cell Biol 2002, 3, 430–440. [Google Scholar]
- Koster, D.A.; Croquette, V.; Dekker, C.; Shuman, S.; Dekker, N.H. Friction and torque govern the relaxation of DNA supercoils by eukaryotic topoisomerase IB. Nature 2005, 434, 671–674. [Google Scholar]
- Pommier, Y. DNA topoisomerase I inhibitors: Chemistry, biology, and interfacial inhibition. Chem. Rev 2009, 109, 2894–2902. [Google Scholar]
- Wall, M.E.; Wani, M.C.; Cook, C.E.; Palmer, K.H.; Mcphail, A.T.; Sim, G.A. Plant antitumor agents. I. The isolation and structure of camptothecin, a novel alkaloidal leukemia and tumor inhibitor from camptotheca acuminata1,2. J. Am. Chem. Soc 1966, 88, 3888–3890. [Google Scholar]
- Takimoto, C.H.; Wright, J.; Arbuck, S.G. Clinical applications of the camptothecins. Biochim. Biophys. Acta 1998, 1400, 107–119. [Google Scholar]
- Ramp, U.; Mahotka, C.; Kalinski, T.; Ebel, E.; Gabbert, H.E.; Gerharz, C.D. Topotecan (Hycamtin) responsiveness in human renal carcinoma cell lines of the clear cell and papillary types. Anticancer Res 2001, 21, 3509–3517. [Google Scholar]
- Sato, A.; Ito, K.; Asano, T.; Sumitomo, M.; Hayakawa, M. Synergistic effect of survivin-specific small interfering RNA and topotecan in renal cancer cells: Topotecan enhances liposome-mediated transfection by increasing cellular uptake. Int. J. Oncol 2007, 30, 695–700. [Google Scholar]
- Sato, A.; Ito, K.; Asano, T.; Sumitomo, M.; Hayakawa, M. Topotecan and small interfering RNA suppress survivin expression synergistically in Caki-1 renal cancer cells: Direct suppression of survivin and enhancement of transfection efficiency by topotecan. Int. J. Oncol 2008, 32, 171–176. [Google Scholar]
- Shamash, J.; Steele, J.P.; Wilson, P.; Nystrom, M.; Ansell, W.; Oliver, R.T. IPM chemotherapy in cytokine refractory renal cell cancer. Br. J. Cancer 2003, 88, 1516–1521. [Google Scholar]
- Kiselev, E.; DeGuire, S.; Morrell, A.; Agama, K.; Dexheimer, T.S.; Pommier, Y.; Cushman, M. 7-azaindenoisoquinolines as topoisomerase I inhibitors and potential anticancer agents. J. Med. Chem 2011, 54, 6106–6116. [Google Scholar]
- Kiselev, E.; Dexheimer, T.S.; Pommier, Y.; Cushman, M. Design, synthesis, and evaluation of dibenzo [c, h][1, 6] naphthyridines as topoisomerase I inhibitors and potential anticancer agents. J. Med. Chem 2010, 53, 8716–8726. [Google Scholar]
- Fox, B.M.; Xiao, X.; Antony, S.; Kohlhagen, G.; Pommier, Y.; Staker, B.L.; Stewart, L.; Cushman, M. Design, synthesis, and biological evaluation of cytotoxic 11-alkenylindenoisoquinoline topoisomerase I inhibitors and indenoisoquinoline-camptothecin hybrids. J. Med. Chem 2003, 46, 3275–3282. [Google Scholar]
- Nagarajan, M.; Morrell, A.; Ioanoviciu, A.; Antony, S.; Kohlhagen, G.; Agama, K.; Hollingshead, M.; Pommier, Y.; Cushman, M. Synthesis and evaluation of indenoisoquinoline topoisomerase I inhibitors substituted with nitrogen heterocycles. J. Med. Chem 2006, 49, 6283–6289. [Google Scholar]
- Morrell, A.; Placzek, M.; Parmley, S.; Antony, S.; Dexheimer, T.S.; Pommier, Y.; Cushman, M. Nitrated indenoisoquinolines as topoisomerase I inhibitors: A systematic study and optimization. J. Med. Chem 2007, 50, 4419–4430. [Google Scholar]
- Antony, S.; Agama, K.K.; Miao, Z.H.; Takagi, K.; Wright, M.H.; Robles, A.I.; Varticovski, L.; Nagarajan, M.; Morrell, A.; Cushman, M.; Pommier, Y. Novel indenoisoquinolines NSC 725776 and NSC 724998 produce persistent topoisomerase I cleavage complexes and overcome multidrug resistance. Cancer Res 2007, 67, 10397–10405. [Google Scholar]
- Cramer, R.D.; Patterson, D.E.; Bunce, J.D. Comparative molecular field analysis (CoMFA). 1. Effect of shape on binding of steroids to carrier proteins. J. Am. Chem. Soc 1988, 110, 5959–5967. [Google Scholar]
- Klebe, G.; Abraham, U.; Mietzner, T. Molecular similarity indices in a comparative analysis (CoMSIA) of drug molecules to correlate and predict their biological activity. J. Med. Chem 1994, 37, 4130–4146. [Google Scholar]
- Hansch, C.; Smith, N.; Engle, R.; Wood, H. Quantitative structure-activity relationships of antineoplastic drugs: Nitrosoureas and triazenoimidazoles. Cancer Chemother. Rep 1972, 56, 443–456. [Google Scholar]
- Qian, C.; Zheng, J.; Xiao, G.; Guo, J.; Yang, Z.; Huang, L.; Chao, W.; Rao, L.; Sun, P. 3D-QSAR Studies on Thiazolidin-4-one S1P(1) Receptor Agonists by CoMFA and CoMSIA. Int. J. Mol. Sci 2011, 12, 6502–6516. [Google Scholar]
- Cramer, R.D., III; Patterson, D.E.; Bunce, J.D. Recent advances in comparative molecular field analysis (CoMFA). Prog. Clin. Biol. Res 1989, 291, 161–165. [Google Scholar]
- Cho, S.J.; Tropsha, A. Cross-validated R2-guided region selection for comparative molecular field analysis: A simple method to achieve consistent results. J. Med. Chem 1995, 38, 1060–1066. [Google Scholar]
- Cramer, R.D., III; Clark, M.; Simeroth, P.; Patterson, D.E. Recent developments in comparative molecular field analysis (CoMFA). Pharmacochem. Libr 1991, 16, 239–242. [Google Scholar]
- Clark, M.C.; Cramer, R.D., III; van Opdenbosch, N. Validation of the general purpose tripos 5.2 force field. Comput. Chem 1989, 10, 982–1012. [Google Scholar]
- Bush, B.L.; Nachbar, R.B., Jr. Sample-distance partial least squares: PLS optimized for many variables, with application to CoMFA. J. Comput. Aided Mol. Des 1993, 7, 587–619. [Google Scholar]
- Clark, M.; Cramer, R.D., III. The probability of chance correlation using partial least squares (PLS). Quant. Struct. Act. Relat 1993, 12, 137–145. [Google Scholar]
- Clark, M.; Cramer, R.D., III; Jones, D.M.; Patterson, D.E.; Simeroth, P.E. Comparative molecular field analysis (CoMFA). 2. Toward its use with 3D-structural databases. Tetrahedron Comput. Methodol 1990, 3, 47–59. [Google Scholar]
- Golbraikh, A.; Tropsha, A. Beware of q2! J. Mol. Graph. Model 2002, 20, 269–276. [Google Scholar]
- Srivastava, V.; Gupta, S.P.; Siddiqi, M.I.; Mishra, B.N. 3D-QSAR studies on quinazoline antifolate thymidylate synthase inhibitors by CoMFA and CoMSIA models. Eur. J. Med. Chem 2010, 45, 1560–1571. [Google Scholar]
- Lindgren, F.; Geladi, P.; Rännar, S.; Wold, S. Interactive variable selection (IVS) for PLS. Part 1: Theory and algorithms. J. Chemometrics 1994, 8, 349–363. [Google Scholar]
- Klebe, G.; Abraham, U. Comparative molecular similarity index analysis (CoMSIA) to study hydrogen-bonding properties and to score combinatorial libraries. J. Comput. Aided Mol. Des 1999, 13, 1–10. [Google Scholar]
- Zheng, J.; Xiao, G.; Guo, J.; Zheng, Y.; Gao, H.; Zhao, S.; Zhang, K.; Sun, P. Exploring QSARs for 5-lipoxygenase (5-LO) inhibitory activity of 2-substituted 5-hydroxyindole-3-carboxylates by CoMFA and CoMSIA. Chem. Biol. Drug Des 2011, 78, 314–321. [Google Scholar]
- Bohm, M.; St Rzebecher, J.; Klebe, G. Three-dimensional quantitative structure-activity relationship analyses using comparative molecular field analysis and comparative molecular similarity indices analysis to elucidate selectivity differences of inhibitors binding to trypsin, thrombin, and factor Xa. J. Med. Chem 1999, 42, 458–477. [Google Scholar]


| Statistical results | CoMFA(before region focusing) | CoMFA (after region focusing) | CoMSIA (Model 5) |
|---|---|---|---|
| PLS statistics * | |||
| LOO cross q2/SEP # | 0.602/0.855 | 0.659/0.781 | 0.523/0.923 |
| Group cross q2/SEP | 0.632/0.822 | 0.680/0.757 | 0.524/0.922 |
| Non-validated r2/SEE ¤ | 0.925/0.367 | 0.949/0.334 | 0.902/0.436 |
| F | 66.709 | 84.997 | 64.275 |
| r2bootstrap | 0.918 ± 0.019 | 0.973 ± 0.020 | 0.906 ± 0.023 |
| Sbootstrap | 0.387 ± 0.193 | 0.367 ± 0.135 | 0.373 ± 0.163 |
| Optimal components | 5 | 5 | 5 |
| Field distribution% | |||
| Steric | 56.5 | 58.7 | 13.4 |
| Electrostatic | 43.5 | 41.3 | 47.9 |
| H-bond acceptor | 38.7 | ||
| r2pred | 0.790 | 0.826 | 0.704 |
| Model | Descriptors | LOO cross q2/SEP | Group cross q2/SEP | Bootstrap r2 | Bootstrapped SEE | Non-validated r2/SEE |
|---|---|---|---|---|---|---|
| 1 | S and E | 0.474/0.970 | 0.490/0.955 | 0.865 ± 0.043 | 0.479 ± 0.262 | 0.857/0.507 |
| 2 | D and A | 0.410/1.056 | 0.360/1.100 | 0.797 ± 0.066 | 0.599 ± 0.339 | 0.750/0.687 |
| 3 | S, E and H | 0.520/0.929 | 0.523/0.923 | 0.788 ± 0.044 | 0.593 ± 0.198 | 0.767/0.637 |
| 4 | S, E and D | 0.482/0.976 | 0.477/0.983 | 0.862 ± 0.034 | 0.496 ± 0.234 | 0.826/0.565 |
| 5 | S, E and A | 0.523/0.923 | 0.524/0.922 | 0.906 ± 0.023 | 0.373 ± 0.163 | 0.902/0.436 |
| 6 | E, D and H | 0.500/0.945 | 0.468/0.975 | 0.834 ± 0.055 | 0.528 ± 0.301 | 0.833/0.574 |
| 7 | E, A and | H 0.511/0.923 | 0.500/0.933 | 0.757 ± 0.048 | 0.622 ± 0.296 | 0.765/0.639 |
| 8 | S, E, D and A | 0.519/0.927 | 0.535/0.938 | 0.922 ± 0.019 | 0.379 ± 0.169 | 0.827/0.556 |
| 9 | S, E, D and H | 0.503/0.942 | 0.560/0.886 | 0.834 ± 0.047 | 0.530 ± 0.274 | 0.816/0.574 |
| 10 | S, E, A and H | 0.521/0.925 | 0.533/0.892 | 0.785 ± 0.062 | 0.596 ± 0.321 | 0.808/0.585 |
| 11 | S, D, A and H | 0.453/0.996 | 0.484/0.987 | 0.870 ± 0.021 | 0.476 ± 0.174 | 0.833/0.562 |
| 12 | S, E, D, A and H | 0.502/0.956 | 0.519/0.940 | 0.879 ± 0.051 | 0.437 ± 0.251 | 0.899/0.445 |
 | ||||||
|---|---|---|---|---|---|---|
| No. | Substituents | Predicted pGI50 | ||||
| R1 | R2 | R3 | R4 | CoMFA | CoMSIA | |
| 20 | NO2 | NH2 | H | OCH3 | 8.145 | 8.195 |
| 20-1 | CN | NH2 | H | OCH3 | 8.505 | 8.479 |
| 20-2 | CN | NH2 | OCH3 | OCH3 | 8.134 | 8.065 |
| 20-3 | CN | NH2 | methylenedioxy | 8.470 | 8.467 | |
| 20-4 | NO2 |  | OCH3 | OCH3 | 8.599 | 8.557 |
| 20-5 | NO2 |  | methylenedioxy | 8.657 | 8.701 | |
| 20-6 | CN |  | OCH3 | OCH3 | 8.878 | 8.770 |
| 20-7 | CN |  | methylenedioxy | 9.029 | 8.914 | |
| 20-8 | CN |  | OCH3 | OCH3 | 8.348 | 8.430 |
| 20-9 | NO2 |  | OCH3 | OCH3 | 8.679 | 8.664 |
| 20-10 | CN |  | OCH3 | OCH3 | 8.889 | 8.791 |
| 20-11 | CN |  | OCH3 | OCH3 | 8.320 | 8.341 |
| 20-12 | CN |  | OCH3 | OCH3 | 8.903 | 8.911 |
| 20-13 | CN |  | methylenedioxy | 8.303 | 8.295 | |
| 20-14 | NO2 |  | methylenedioxy | 8.420 | 8.342 | |
| 20-15 | CN |  | OCH3 | OCH3 | 8.776 | 8.808 |
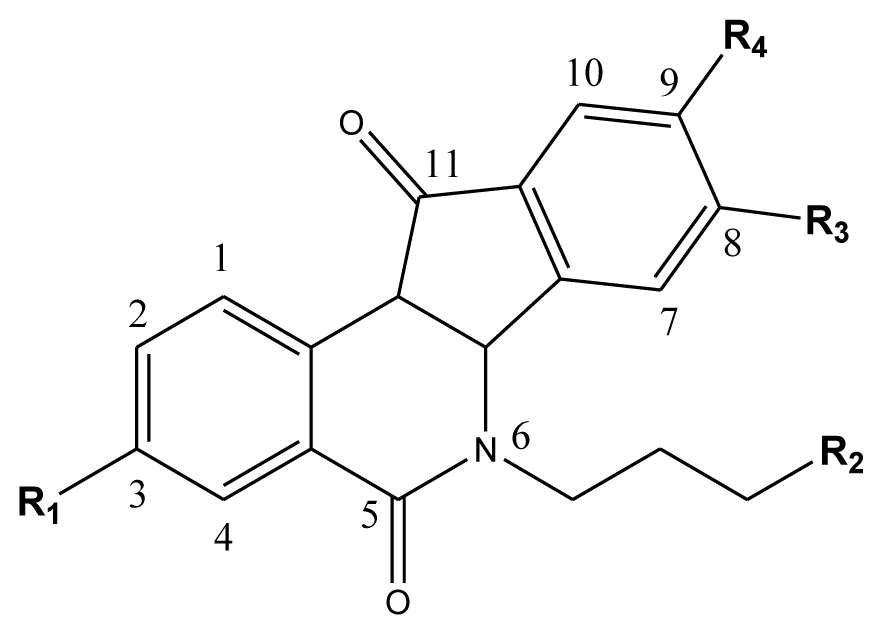
| Compd. |  | ||||
|---|---|---|---|---|---|
| 1–42 | 43–48 | ||||
| R1 | R2 | R3 | R4 | R5 | |
| 1 * | OCH3 | OCH3 | CH3 | methylenedioxy | |
| 2 | OCH3 | OCH3 | (CH2)3NH2 | methylenedioxy | |
| 3 | OCH3 | OCH3 |  | Methylenedioxy | |
| 4 | OCH3 | OCH3 |  | methylenedioxy | |
| 5 | OCH3 | OCH3 |  | methylenedioxy | |
| 6 | OCH3 | OCH3 |  | methylenedioxy | |
| 7 | OCH3 | OCH3 |  | methylenedioxy | |
| 8 | OCH3 | OCH3 |  | methylenedioxy | |
| 9 | OCH3 | NO2 |  | methylenedioxy | |
| 10 | OCH3 | OCH3 |  | methylenedioxy | |
| 11 * | OCH3 | OCH3 |  | methylenedioxy | |
| 12 | OCH3 | OCH3 |  | methylenedioxy | |
| 13 | OCH3 | OCH3 |  | methylenedioxy | |
| 14 * | OCH3 | OCH3 |  | methylenedioxy | |
| 15 | OCH3 | OCH3 |  | methylenedioxy | |
| 16 | H | H |  | H | H |
| 17 * | OCH3 | OCH3 |  | H | H |
| 18 | H | NO2 |  | H | H |
| 19 | H | NO2 | (CH2)3Cl | H | OCH3 |
| 20 | H | NO2 | (CH2)3NH2 | H | OCH3 |
| 21 | H | H | (CH2)3Br | H | H |
| 22 | H | H | (CH2)3NH2 | H | H |
| 23 | H | H | (CH2)3N(CH2)2 | H | H |
| 24 | H | NO2 | (CH2)3N3 | H | H |
| 25 | H | NO2 | (CH2)3NH2 | H | H |
| 26 | H | NO2 | (CH2)3N(CH2)2 | H | H |
| 27 * | H | NO2 | (CH2)3Br | H | H |
| 28 | H | H | (CH2)3N3 | H | OCH3 |
| 29 * | H | H | (CH2)3NH2 | H | OCH3 |
| 30 | H | NO2 | (CH2)3I | H | OCH3 |
| 31 | H | H |  | H | H |
| 32 | H | H | (CH2)3N3 | H | H |
| 33 | H | NO2 |  | H | H |
| 34 | H | H |  | H | OCH3 |
| 35 | H | NO2 | (CH2)3NH(CH2)3OH | H | H |
| 36 | H | NO2 | (CH2)3NH(CH2)3OH | H | OCH3 |
| 37 | H | H | (CH2)3NH(CH2)3OH | H | OCH3 |
| 38 | H | H | (CH2)3NH(CH2)3OH | H | H |
| 39 | H | NO2 | (CH2)3N(CH2)2 | H | OCH3 |
| 40 | H | H | (CH2)3N(CH2)2 | H | OCH3 |
| 41 | H | NO2 |  | H | OCH3 |
| 42 | H | H |  | H | OCH3 |
| Compd. | n | X | Compd. | n | X |
| 43 | 3 | Cl | 46 | 5 | Br |
| 44 | 3 | Br | 47 | 3 | I |
| 45 | 4 | Br | 48 * | 2 | NH2 |
| Comp. no. | Experiment (pGI50) | CoMFA | CoMSIA | ||
|---|---|---|---|---|---|
| Pred. | Res. | Pred. | Res. | ||
| 1 * | 4.168 | 4.003 | 0.165 | 4.335 | −0.167 |
| 2 | 6.509 | 6.571 | −0.062 | 6.679 | −0.170 |
| 3 | 8.000 | 7.866 | 0.134 | 7.993 | 0.007 |
| 4 | 6.500 | 6.324 | 0.176 | 6.691 | −0.191 |
| 5 | 7.071 | 7.206 | −0.135 | 7.345 | −0.274 |
| 6 | 8.000 | 8.113 | −0.113 | 7.776 | 0.224 |
| 7 | 7.041 | 7.231 | −0.190 | 7.135 | −0.094 |
| 8 | 6.090 | 6.004 | 0.086 | 5.890 | 0.200 |
| 9 | 8.000 | 7.899 | 0.101 | 7.860 | 0.140 |
| 10 | 6.900 | 6.798 | 0.102 | 7.079 | −0.179 |
| 11 * | 4.939 | 5.067 | −0.128 | 5.163 | −0.224 |
| 12 | 6.590 | 6.497 | 0.093 | 6.889 | −0.299 |
| 13 | 6.839 | 7.000 | −0.161 | 7.132 | −0.293 |
| 14 * | 4.000 | 3.761 | 0.239 | 4.476 | −0.476 |
| 15 | 5.830 | 5.812 | 0.018 | 6.337 | −0.507 |
| 16 | 5.780 | 5.770 | 0.010 | 5.910 | −0.130 |
| 17 * | 8.000 | 8.198 | −0.198 | 8.403 | −0.403 |
| 18 | 7.824 | 7.793 | 0.031 | 7.850 | −0.026 |
| 19 | 8.000 | 7.885 | 0.115 | 8.063 | −0.063 |
| 20 | 8.000 | 8.145 | −0.145 | 8.195 | −0.195 |
| 21 | 5.155 | 4.996 | 0.159 | 4.666 | 0.489 |
| 22 | 6.796 | 6.689 | 0.107 | 6.535 | 0.261 |
| 23 | 6.041 | 6.003 | 0.038 | 5.990 | 0.051 |
| 24 | 4.140 | 4.095 | 0.045 | 4.003 | 0.137 |
| 25 | 6.991 | 7.023 | −0.032 | 6.840 | 0.151 |
| 26 | 5.380 | 5.187 | 0.193 | 5.580 | −0.200 |
| 27 * | 4.000 | 3.695 | 0.305 | 4.443 | −0.443 |
| 28 | 4.000 | 4.010 | −0.010 | 4.147 | −0.147 |
| 29 * | 8.000 | 7.797 | 0.203 | 7.694 | 0.306 |
| 30 | 6.510 | 6.550 | −0.040 | 6.443 | 0.067 |
| 31 | 4.670 | 4.535 | 0.135 | 4.871 | −0.201 |
| 32 | 4.600 | 4.569 | 0.031 | 4.575 | 0.025 |
| 33 | 6.510 | 6.511 | −0.001 | 6.505 | 0.005 |
| 34 | 4.070 | 4.034 | 0.036 | 4.104 | −0.034 |
| 35 | 6.640 | 6.650 | −0.010 | 6.497 | 0.143 |
| 36 | 7.921 | 7.905 | 0.016 | 8.133 | −0.212 |
| 37 | 6.801 | 6.932 | −0.131 | 7.004 | −0.203 |
| 38 | 6.570 | 6.494 | 0.076 | 6.610 | −0.040 |
| 39 | 8.000 | 8.049 | −0.049 | 7.949 | 0.051 |
| 40 | 6.611 | 6.376 | 0.235 | 6.911 | −0.300 |
| 41 | 8.000 | 8.001 | −0.001 | 8.021 | −0.021 |
| 42 | 6.170 | 6.003 | 0.167 | 6.250 | −0.080 |
| 43 | 4.000 | 4.138 | −0.138 | 4.517 | −0.517 |
| 44 | 4.000 | 4.158 | −0.158 | 4.231 | −0.231 |
| 45 | 4.000 | 3.946 | 0.054 | 3.879 | 0.121 |
| 46 | 5.244 | 5.201 | 0.043 | 5.290 | −0.046 |
| 47 | 5.056 | 4.875 | 0.181 | 4.756 | 0.300 |
| 48 * | 6.237 | 6.040 | 0.197 | 6.660 | −0.423 |
© 2012 by the authors; licensee Molecular Diversity Preservation International, Basel, Switzerland. This article is an open-access article distributed under the terms and conditions of the Creative Commons Attribution license (http://creativecommons.org/licenses/by/3.0/).
Share and Cite
Zhi, Y.; Yang, J.; Tian, S.; Yuan, F.; Liu, Y.; Zhang, Y.; Sun, P.; Song, B.; Chen, Z. Quantitative Structure-Activity Relationship Studies on Indenoisoquinoline Topoisomerase I Inhibitors as Anticancer Agents in Human Renal Cell Carcinoma Cell Line SN12C. Int. J. Mol. Sci. 2012, 13, 6009-6025. https://doi.org/10.3390/ijms13056009
Zhi Y, Yang J, Tian S, Yuan F, Liu Y, Zhang Y, Sun P, Song B, Chen Z. Quantitative Structure-Activity Relationship Studies on Indenoisoquinoline Topoisomerase I Inhibitors as Anticancer Agents in Human Renal Cell Carcinoma Cell Line SN12C. International Journal of Molecular Sciences. 2012; 13(5):6009-6025. https://doi.org/10.3390/ijms13056009
Chicago/Turabian StyleZhi, Yi, Jin Yang, Shengchao Tian, Fang Yuan, Yang Liu, Yi Zhang, Pinghua Sun, Bo Song, and Zhiwen Chen. 2012. "Quantitative Structure-Activity Relationship Studies on Indenoisoquinoline Topoisomerase I Inhibitors as Anticancer Agents in Human Renal Cell Carcinoma Cell Line SN12C" International Journal of Molecular Sciences 13, no. 5: 6009-6025. https://doi.org/10.3390/ijms13056009