Pharmacophore and Molecular Docking Guided 3D-QSAR Study of Bacterial Enoyl-ACP Reductase (FabI) Inhibitors

Abstract
:1. Introduction
2. Material and Methods
2.1. Data Sets
2.2. Pharmacophore Model Generation
2.3. Molecular Docking
2.4. Alignment Rule
2.5. CoMFA and CoMSIA Model
2.6. Partial Least Square Analysis
3. Results and Discussion
3.1. Pharmacophore-based CoMFA and CoMSIA
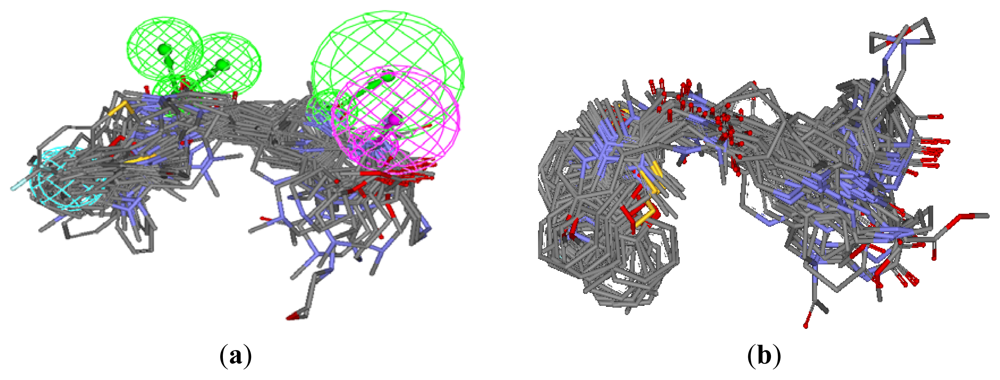
3.1.1. Pharmacophore Elucidation
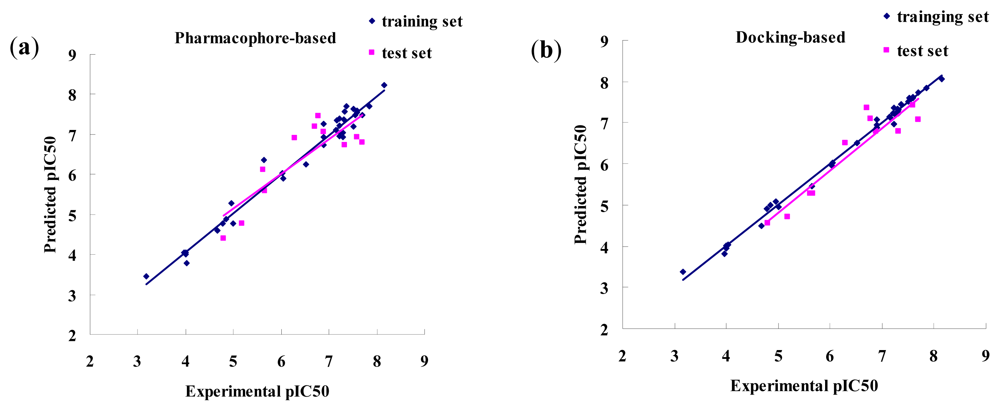
3.1.2. CoMFA and CoMSIA Results
3.2. Molecular Docking-Based CoMFA and CoMSIA
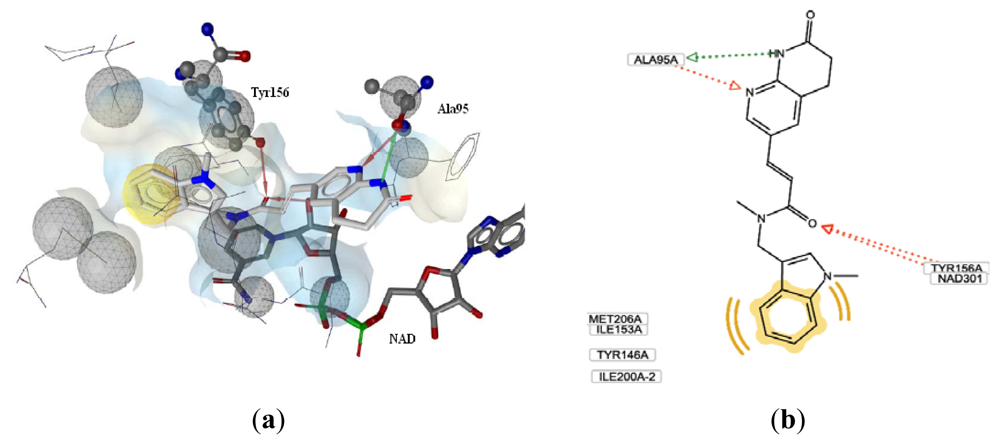
3.2.1. Docking Analysis
3.2.2. CoMFA and CoMSIA Results
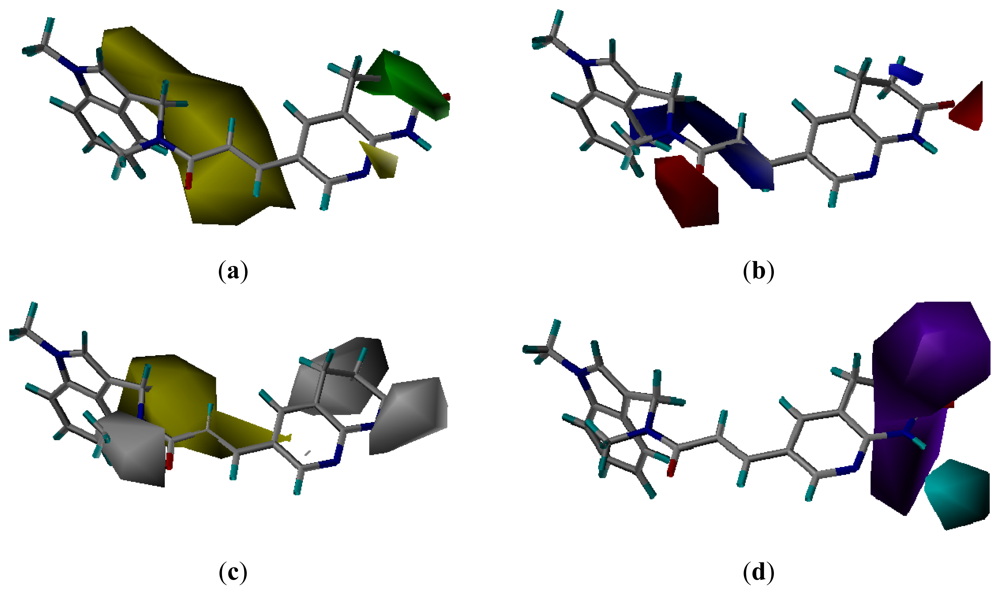
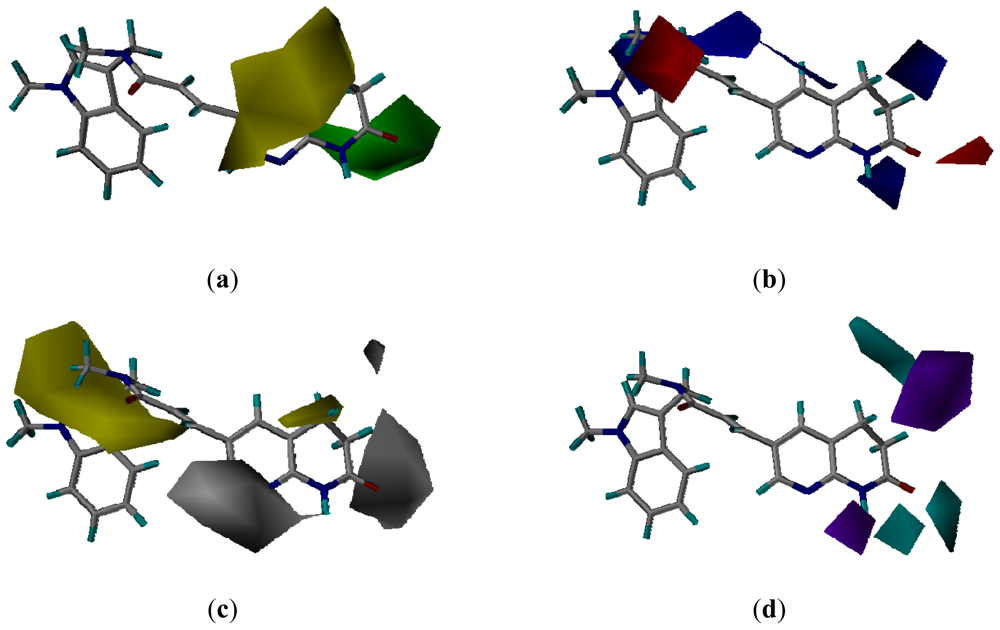
3.3. CoMSIA Models Interpretation
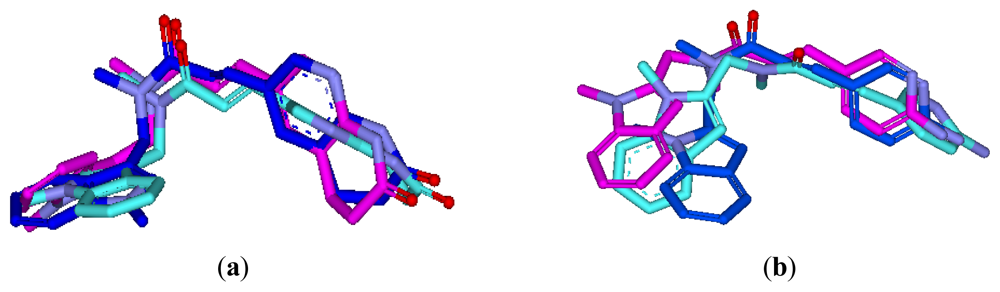
3.3.1. Pharmacophore-Based Alignment
3.3.2. Molecular Docking-Based Alignment
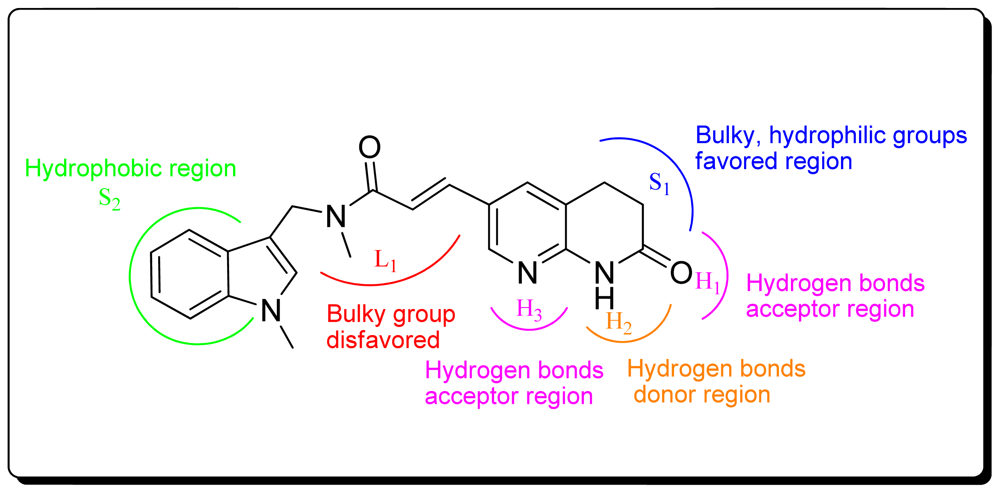
3.4. Summary of Structure-Activity Relationships
4. Conclusions
Acknowledgments
References
- Cohen, M.L. Epidemiology of drug resistance: Implications for a post-antimicrobial era. Science 1992, 257, 1050–1055. [Google Scholar]
- Bax, R.; Mullan, N.; Verhoef, J. The millennium bugs—The need for and development of new antibacterials. Int. J. Antimicrob. Agents 2000, 16, 51–59. [Google Scholar]
- Voss, A.; Doebbeling, B.N. The worldwide prevalence of methicillin-resistant Staphylococcus aureus. Int. J. Antimicrob. Agents 1995, 5, 101–106. [Google Scholar]
- Yoshida, R.; Kaku, M.; Kohno, S. Trends in antimicrobial resistance of Streptococcus pneumoniae in Japan. Antimicrob. Agents Chemother 1995, 39, 1196–1198. [Google Scholar]
- Campbell, J.W.; Cronan, J.E., Jr. Bacterial fatty acid biosynthesis: Targets for antibacterial drug discovery. Annu. Rev. Microbiol. 2001, 55, 305–332. [Google Scholar]
- Heath, R.J.; White, S.W.; Rock, C.O. Lipid biosynthesis as a target for antibacterial agents. Prog. Lipid Res 2001, 40, 467–497. [Google Scholar]
- White, S.W.; Zheng, J.; Zhang, Y.-M.; Rock, C.O. The structural biology of type II fatty acid biosynthesis. Annu. Rev. Biochem 2005, 74, 791–831. [Google Scholar]
- Heath, R.J.; Rock, C.O. Enoyl-acyl carrier protein reductase (fabI) plays a determinant role in completing cycles of fatty acid elongation in Escherichia coli. J. Biol. Chem 1995, 270, 26538–26542. [Google Scholar]
- Bergler, H.; Fuchsbichler, S.; Hogenauer, G.; Turnowsky, F. The enoyl-[acyl-carrier-protein] reductase (FabI) of Escherichia coli, which catalyzes a key regulatory step in fatty acid biosynthesis, accepts NADH and NADPH as cofactors and is inhibited by palmitoyl-CoA. Eur. J. Biochem 1996, 242, 689–694. [Google Scholar]
- Heath, R.J.; Li, J.; Roland, G.E.; Rock, C.O. Inhibition of the Staphylococcus aureus NADPH-dependent enoyl-acyl carrier protein reductase by triclosan and hexachlorophene. J. Biol. Chem 2000, 275, 4654–4659. [Google Scholar]
- Moir, D.T. Identification of inhibitors of bacterial enoyl-acyl carrier protein reductase. Drug Targets Infect. Disord 2005, 5, 297–305. [Google Scholar]
- Lu, H.; Tonge, P.J. Inhibitors of FabI, an enzyme drug target in the bacterial fatty acid biosynthesis pathway. Acc. Chem. Res 2008, 41, 11–20. [Google Scholar]
- McMurry, L.M.; Oethinger, M.; Levy, S.B. Triclosan targets lipid synthesis. Nature 1998, 394, 531–532. [Google Scholar]
- Heath, R.J.; Yu, Y.T.; Shapiro, M.A.; Olson, E.; Rock, C.O. Broad spectrum antimicrobial biocides target the FabI component of fatty acid synthesis. J. Biol. Chem 1998, 273, 30316–30320. [Google Scholar]
- Levy, C.W.; Roujeinikova, A.; Sedelnikova, S.; Baker, P.J.; Stuitje, A.R.; Slabas, A.R.; Rice, D.W.; Rafferty, J.-B. Molecular basis of triclosan activity. Nature 1999, 398, 383–384. [Google Scholar]
- Stewart, M.J.; Parikh, S.; Xiao, G.; Tonge, P.J.; Kisker, C. Structural basis and mechanism of enoyl reductase inhibition by triclosan. J. Mol. Biol 1999, 290, 859–865. [Google Scholar]
- Baldock, C.; Rafferty, J.B.; Sedelnikova, S.E.; Baker, P.J.; Stuitje, A.R.; Slabas, A.R.; Hawkes, T.R.; Rice, D.W. A mechanism of drug action revealed by structural studies of enoyl reductase. Science 1996, 274, 2107–2110. [Google Scholar]
- Levy, C.W.; Baldock, C.; Wallace, A.J.; Sedelnikova, S.; Viner, R.C.; Clough, J.M.; Stuitje, A.R.; Slabas, A.R.; Rice, D.W.; Rafferty, J.B. A study of the structure-activity relationship for diazaborine inhibition of Escherichia coli enoyl-ACP reductase. J. Mol. Biol 2001, 309, 171–180. [Google Scholar]
- Heerding, D.A.; Chan, G.; DeWolf, W.E.; Fosberry, A.P.; Janson, C.A.; Jaworski, D.D.; McManus, E.; Miller, W.H.; Moore, T.D.; Payne, D.J.; et al. 1,4-Disubstituted imidazoles are potential antibacterial agents functioning as inhibitors of enoyl acyl carrier protein reductase (FabI). Bioorg. Med. Chem. Lett 2001, 11, 2061–2065. [Google Scholar]
- Seefeld, M.A.; Miller, W.H.; Newlander, K.A.; Burgess, W.J.; Payne, D.J.; Rittenhouse, S.F.; Moore, T.D.; DeWolf, W.E., Jr; Keller, P.M.; Qiu, X.; et al. Inhibitors of bacterial enoyl acyl carrier protein reductase (FabI): 2,9-Disubstituted 1,2,3,4-tetrahydropyrido[3,4-b]indoles as potential antibacterial agents. Bioorg. Med. Chem. Lett. 2001, 11, 2241–2244. [Google Scholar]
- Miller, W.H.; Seefeld, M.A.; Newlander, K.A.; Uzinskas, I.N.; Burgess, W.J.; Heerding, D.A.; Yuan, C.C.; Head, M.S.; Payne, D.J.; Rittenhouse, S.F.; et al. Discovery of aminopyridine-based inhibitors of bacterial enoyl-ACP reductase (FabI). J. Med. Chem 2002, 45, 3246–3256. [Google Scholar]
- Seefeld, M.A.; Miller, W.H.; Newlander, K.A.; Burgess, W.J.; DeWolf, W.E., Jr; Elkins, P.A.; Head, M.S.; Jakas, D.R.; Janson, C.A.; Keller, P.M.; et al. Indole naphthyridinones as inhibitors of bacterial enoyl-ACP reductases FabI and FabK. J. Med. Chem. 2003, 46, 1627–1635. [Google Scholar]
- Ling, L.L.; Xian, J.; Ali, S.; Geng, B.; Fan, J.; Mills, D.M.; Arvanites, A.C.; Orgueira, H.; Ashwell, M.A.; Carmel, G.; Xiang, Y.; Moir, D.T. Identification and characterization of inhibitors of bacterial enoyl-acyl carrier protein reductase. Antimicrob. Agents Chemother 2004, 48, 1541–1547. [Google Scholar]
- Kitagawa, H.; Kumura, K.; Takahata, S.; Iida, M.; Atsumi, K. 4-Pyridone derivatives as new inhibitors of bacterial enoyl-ACP reductase FabI. Bioorg. Med. Chem 2007, 15, 1106–1116. [Google Scholar]
- Sampson, P.B.; Picard, C.; Handerson, S.; McGrath, T.E.; Domagala, M.; Leeson, A.; Romanov, V.; Awrey, D.E.; Thambipillai, D.; Bardouniotis, E.; et al. Spiro-naphthyridinone piperidines as inhibitors of S. aureus and E. coli enoyl-ACP reductase (FabI). Bioorg. Med. Chem. Lett 2009, 19, 5355–5358. [Google Scholar]
- Ramnauth, J.; Surman, M.-D.; Sampson, P.B.; Forrest, B.; Wilson, J.; Freeman, E.; Manning, D.D.; Martin, F.; Toro, A.; Domagala, M.; et al. 2,3,4,5-Tetrahydro-1H-pyrido[2,3-b and e][1,4]diazepines as inhibitors of the bacterial enoyl ACP reductase, FabI. Bioorg. Med. Chem. Lett 2009, 19, 5359–5362. [Google Scholar]
- Cramer, R.D.; Patterson, D.E.; Bunce, J.D. Comparative molecular field analysis (CoMFA). 1. Effect of shape on binding of steroids to carrier proteins. J. Am. Chem. Soc 1988, 110, 5959–5967. [Google Scholar]
- Klebe, G.; Abraham, U.; Mietzner, T. Molecular similarity indices in a comparative analysis (CoMSIA) of drug molecules to correlate and predict their biological activity. J. Med. Chem 1994, 37, 4130–4146. [Google Scholar]
- Wolber, G.; Langer, T. LigandScout: 3-D pharmacophores derived from protein-bound ligands and their use as virtual screening filters. J. Chem. Inf. Model 2005, 45, 160–169. [Google Scholar]
- Wolber, G.; Dornhofer, A.-A.; Langer, T. Efficient overlay of small organic molecules using 3D pharmacophores. J. Comput. Aided. Mol. Des 2006, 20, 773–788. [Google Scholar]
- Discovery Studio 2.1; Accelrys Inc.: San Diego, CA, USA, 2008.
- Jones, G.; Willett, P.; Glen, R.C.; Leach, A.R.; Taylor, R. Development and validation of a genetic algorithm for flexible docking. J. Mol. Biol 1997, 267, 727–748. [Google Scholar]
- Kontoyianni, M.; McClellan, L.M.; Sokol, G.S. Evaluation of docking performance: Comparative data on docking algorithms. J. Med. Chem 2004, 47, 558–565. [Google Scholar]
- SYBYL Molecular Modeling Software Packages, Ver. 6.9; TRIPOS: St Louis, MO, USA, 2001.
- Stahle, L.; Wold, S. Partial least squares analysis with cross-validation for the two-class problem: A Monte Carlo study. J. Chemom 1987, 1, 185–196. [Google Scholar]
- Cramer, R.D.; Bunce, J.D.; Patterson, D.E. Crossvalidation, bootstrapping, and partial least squares compared with multiple regression in conventional QSAR studies. Quant. Struct. Activ. Relat 1988, 7, 18–25. [Google Scholar]
- Podlogar, B.L.; Ferguson, D.M. QSAR and CoMFA: A perspective on the practical application to drug discovery. Drug Des. Discov 2000, 17, 4–12. [Google Scholar]


 | ||||
|---|---|---|---|---|
| Compounds | R1 | IC50(μM) | pIC50 | |
| 1 |  | 16.5 | 4.78 | |
| 2 |  | 9.9 | 5.00 | |
| 3 |  | 676 | 3.17 | |
| 4 |  | 21.2 | 4.67 | |
| 5 * |  | 6.7 | 5.17 | |
| 6 |  | 107 | 3.97 | |
| 7 * |  | 16.3 | 4.79 | |
| 8 |  | 100 | 4.00 | |
| 9 |  | 93.7 | 4.03 | |
| 10 |  | 100 | 4.00 | |
 | ||||
| Compounds | R1 | IC50(μM) | pIC50 | Compounds |
| 11 * |  |  | 2.4 | 5.62 |
| 12 * |  |  | 2.2 | 5.66 |
| 13 |  |  | 11.2 | 4.95 |
| 14 |  |  | 14.2 | 4.85 |
| 15 |  |  | 0.91 | 6.04 |
| 16 |  |  | 2.3 | 5.64 |
| 17 |  |  | 0.3 | 6.52 |
| 18 |  |  | 0.94 | 6.03 |
| 19 |  |  | 0.05 | 7.30 |
| 20 |  |  | 0.13 | 6.89 |
| 21 | 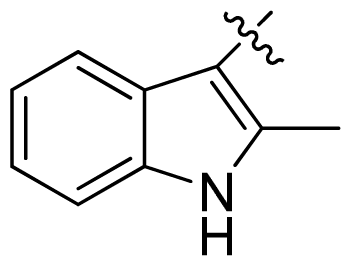 |  | 0.05 | 7.30 |
| 22 |  |  | 0.06 | 7.22 |
| 23 * | 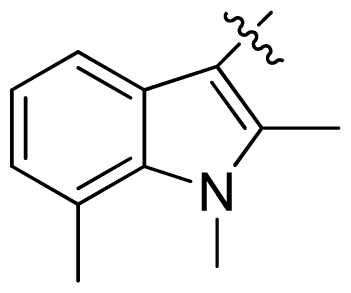 |  | 0.02 | 7.70 |
| 24 |  |  | 0.03 | 7.52 |
| 25 |  |  | 0.026 | 7.59 |
| 26 |  |  | 0.049 | 7.31 |
| 27 * |  |  | 0.132 | 6.88 |
| 28 |  |  | 0.048 | 7.32 |
| 29 |  |  | 0.071 | 7.15 |
| 30 |  |  | 0.02 | 7.70 |
| 31 |  |  | 0.014 | 7.85 |
| 32 |  |  | 0.028 | 7.55 |
| 33 |  |  | 0.026 | 7.59 |
| 34 |  |  | 0.031 | 7.51 |
| 35 |  |  | 0.13 | 6.89 |
| 36 * |  |  | 0.2 | 6.70 |
| 37 |  |  | 0.007 | 8.15 |
| 38 * |  | 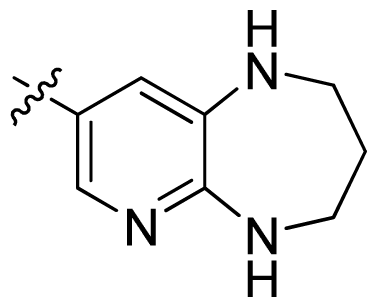 | 0.026 | 7.59 |
| 39 |  |  | 0.067 | 7.17 |
| 40 * |  |  | 0.51 | 6.29 |
| 41 |  |  | 0.13 | 6.89 |
| 42 |  |  | 0.043 | 7.37 |
| 43 |  |  | 0.057 | 7.24 |
| 44 * |  |  | 0.048 | 7.32 |
| 45 |  |  | 0.06 | 7.22 |
| 46 |  | 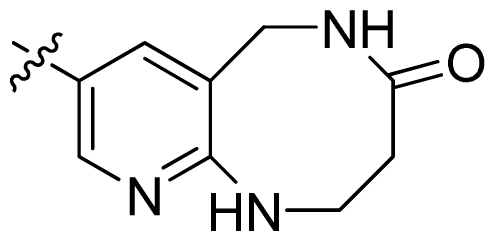 | 0.061 | 7.21 |
| 47 * |  |  | 0.17 | 6.77 |
| Parameter | CoMFA | CoMSIA | ||||||||
|---|---|---|---|---|---|---|---|---|---|---|
| S,E | S | E | H | D | A | S,E | H,D,A | S,E,H,D | ALL | |
| rcv2 | 0.668 | 0.478 | 0.580 | 0.554 | 0.382 | 0.565 | 0.700 | 0.665 | 0.742 | 0.721 |
| N | 4 | 4 | 2 | 3 | 2 | 5 | 4 | 6 | 3 | 4 |
| r2 | 0.980 | 0.895 | 0.856 | 0.944 | 0.727 | 0.910 | 0.973 | 0.996 | 0.973 | 0.988 |
| SEE | 0.213 | 0.481 | 0.547 | 0.345 | 0.754 | 0.454 | 0.243 | 0.093 | 0.240 | 0.162 |
| F-value | 371.89 | 66.39 | 98.12 | 181.23 | 43.92 | 60.62 | 282.57 | 1313.59 | 386.54 | 649.64 |
| Contributions | ||||||||||
| Steric | 0.490 | 0.374 | 0.152 | 0.122 | ||||||
| Electrostatic | 0.510 | 0.636 | 0.277 | 0.217 | ||||||
| Hydrophobic | 0.341 | 0.253 | 0.208 | |||||||
| Donor | 0.358 | 0.318 | 0.267 | |||||||
| Acceptor | 0.301 | 0.187 | ||||||||
| rpred2 | 0.574 | 0.702 | 0.693 | |||||||
| Compounds | Experimental Activity | Pharmacophore-Based Alignment | Docking-Based Alignment | ||||||
|---|---|---|---|---|---|---|---|---|---|
| (pIC50) | CoMFA (SE) | CoMSIA (SEHD) | CoMFA (SE) | CoMSIA (SEHD) | |||||
| PA a | Δ b | PA a | Δ b | PA a | Δ b | PA a | Δ b | ||
| 1 | 4.78 | 4.73 | 0.05 | 4.77 | 0.01 | 4.72 | 0.06 | 4.91 | −0.13 |
| 2 | 5.00 | 5.17 | −0.17 | 4.77 | 0.23 | 4.91 | 0.09 | 4.95 | 0.05 |
| 3 | 3.17 | 3.15 | 0.02 | 3.46 | −0.29 | 3.26 | −0.09 | 3.37 | −0.20 |
| 4 | 4.67 | 4.45 | 0.22 | 4.59 | 0.08 | 4.79 | −0.12 | 4.50 | 0.17 |
| 5 * | 5.17 | 5.95 | −0.78 | 4.78 | 0.39 | 4.32 | 0.85 | 4.71 | 0.46 |
| 6 | 3.97 | 3.94 | 0.03 | 4.04 | −0.07 | 4.01 | −0.04 | 3.81 | 0.16 |
| 7 * | 4.79 | 4.76 | 0.03 | 4.41 | 0.38 | 4.91 | −0.12 | 4.56 | 0.20 |
| 8 | 4.00 | 4.18 | −0.18 | 4.00 | 0.00 | 3.99 | 0.01 | 3.95 | 0.05 |
| 9 | 4.03 | 4.13 | −0.10 | 3.79 | 0.24 | 4.09 | −0.06 | 4.04 | −0.01 |
| 10 | 4.00 | 3.94 | 0.06 | 4.04 | −0.04 | 3.87 | 0.13 | 4.02 | −0.02 |
| 11 * | 5.62 | 5.48 | 0.14 | 6.12 | −0.50 | 5.01 | 0.61 | 5.28 | 0.34 |
| 12 * | 5.66 | 5.70 | −0.04 | 5.58 | 0.08 | 5.39 | 0.31 | 5.28 | 0.38 |
| 13 | 4.95 | 5.00 | −0.05 | 5.28 | −0.33 | 4.87 | 0.08 | 5.09 | −0.14 |
| 14 | 4.85 | 4.68 | 0.17 | 4.88 | −0.03 | 4.89 | −0.04 | 4.99 | −0.14 |
| 15 | 6.04 | 6.01 | 0.03 | 5.90 | 0.14 | 5.83 | 0.21 | 6.02 | 0.02 |
| 16 | 5.64 | 6.24 | −0.60 | 6.35 | −0.71 | 5.84 | −0.20 | 5.45 | 0.19 |
| 17 | 6.52 | 6.48 | 0.04 | 6.24 | 0.28 | 6.44 | 0.08 | 6.50 | 0.02 |
| 18 | 6.03 | 6.03 | 0.00 | 6.02 | 0.01 | 6.04 | −0.01 | 5.95 | 0.08 |
| 19 | 7.30 | 7.04 | 0.26 | 6.92 | 0.38 | 7.18 | 0.12 | 7.34 | −0.04 |
| 20 | 6.89 | 6.94 | −0.05 | 6.73 | 0.16 | 6.97 | −0.08 | 6.94 | −0.05 |
| 21 | 7.30 | 7.22 | 0.08 | 7.04 | 0.26 | 7.30 | 0.00 | 7.27 | 0.03 |
| 22 | 7.22 | 7.27 | −0.05 | 7.22 | 0.00 | 7.22 | 0.00 | 6.96 | 0.26 |
| 23 * | 7.70 | 7.10 | 0.60 | 6.80 | 0.90 | 6.77 | 0.93 | 7.07 | 0.63 |
| 24 | 7.52 | 7.23 | 0.29 | 7.20 | 0.32 | 7.54 | −0.02 | 7.59 | −0.07 |
| 25 | 7.59 | 7.60 | −0.01 | 7.60 | −0.01 | 7.54 | 0.05 | 7.62 | −0.03 |
| 26 | 7.31 | 7.30 | 0.01 | 7.37 | −0.06 | 7.21 | 0.10 | 7.23 | 0.08 |
| 27 * | 6.88 | 6.90 | −0.02 | 7.07 | −0.17 | 7.14 | −0.26 | 6.80 | 0.08 |
| 28 | 7.32 | 7.42 | −0.10 | 7.56 | −0.24 | 7.52 | −0.20 | 7.31 | 0.01 |
| 29 | 7.15 | 7.01 | 0.14 | 7.11 | 0.04 | 7.16 | −0.01 | 7.15 | 0.00 |
| 30 | 7.70 | 7.91 | −0.21 | 7.48 | 0.22 | 7.82 | −0.12 | 7.74 | −0.04 |
| 31 | 7.85 | 7.75 | 0.10 | 7.70 | 0.15 | 7.74 | 0.11 | 7.83 | 0.02 |
| 32 | 7.55 | 7.61 | −0.06 | 7.49 | 0.06 | 7.57 | −0.02 | 7.58 | −0.03 |
| 33 | 7.59 | 7.57 | 0.02 | 7.54 | 0.05 | 7.55 | 0.04 | 7.59 | 0.00 |
| 34 | 7.51 | 7.64 | −0.13 | 7.64 | −0.13 | 7.48 | 0.03 | 7.52 | −0.01 |
| 35 | 6.89 | 7.03 | −0.14 | 7.26 | −0.37 | 7.05 | −0.16 | 7.08 | −0.19 |
| 36 * | 6.70 | 6.78 | −0.08 | 7.20 | −0.50 | 7.49 | −0.79 | 7.37 | −0.59 |
| 37 | 8.15 | 7.63 | 0.52 | 8.23 | −0.08 | 7.93 | 0.22 | 8.07 | 0.08 |
| 38 * | 7.59 | 6.57 | 1.02 | 6.94 | 0.65 | 6.63 | 0.96 | 7.42 | 0.17 |
| 39 | 7.17 | 7.30 | −0.13 | 7.36 | −0.19 | 6.96 | 0.21 | 7.09 | 0.08 |
| 40 * | 6.29 | 7.50 | −1.21 | 6.90 | −0.61 | 6.84 | −0.55 | 6.50 | −0.21 |
| 41 | 6.89 | 7.14 | −0.25 | 6.93 | −0.04 | 6.96 | −0.07 | 6.88 | 0.01 |
| 42 | 7.37 | 7.58 | −0.21 | 7.71 | −0.34 | 7.46 | −0.09 | 7.44 | −0.07 |
| 43 | 7.24 | 6.81 | 0.43 | 7.03 | 0.21 | 7.14 | 0.10 | 7.21 | 0.03 |
| 44 * | 7.32 | 6.53 | 0.79 | 6.73 | 0.59 | 7.16 | 0.16 | 6.79 | 0.53 |
| 45 | 7.22 | 7.32 | −0.10 | 7.39 | −0.17 | 7.42 | −0.20 | 7.36 | −0.14 |
| 46 | 7.21 | 7.15 | 0.06 | 6.95 | 0.26 | 7.31 | −0.10 | 7.23 | −0.02 |
| 47 * | 6.77 | 7.02 | −0.25 | 7.47 | −0.70 | 7.10 | −0.33 | 7.10 | −0.33 |
| Parameter | CoMFA | CoMSIA | ||||||||
|---|---|---|---|---|---|---|---|---|---|---|
| S,E | S | E | H | D | A | S,E | H,D,A | S,E,H,D | ALL | |
| rcv2 | 0.664 | 0.486 | 0.740 | 0.708 | 0.128 | 0.540 | 0.777 | 0.548 | 0.711 | 0.713 |
| N | 6 | 5 | 6 | 5 | 2 | 2 | 6 | 4 | 6 | 6 |
| r2 | 0.993 | 0.877 | 0.975 | 0.974 | 0.595 | 0.798 | 0.987 | 0.957 | 0.995 | 0.995 |
| SEE | 0.125 | 0.531 | 0.244 | 0.246 | 0.919 | 0.649 | 0.172 | 0.309 | 0.112 | 0.109 |
| F-value | 730.83 | 42.77 | 186.96 | 183.83 | 24.20 | 65.07 | 380.31 | 171.60 | 913.60 | 966.44 |
| Contributions | ||||||||||
| Steric | 0.381 | 0.270 | 0.142 | 0.105 | ||||||
| Electrostatic | 0.619 | 0.730 | 0.383 | 0.279 | ||||||
| Hydrophobic | 0.290 | 0.230 | 0.177 | |||||||
| Donor | 0.312 | 0.245 | 0.205 | |||||||
| Acceptor | 0.398 | 0.235 | ||||||||
| rpred2 | 0.695 | 0.864 | 0.797 | |||||||
© 2012 by the authors; licensee Molecular Diversity Preservation International, Basel, Switzerland. This article is an open-access article distributed under the terms and conditions of the Creative Commons Attribution license (http://creativecommons.org/licenses/by/3.0/).
Share and Cite
Lu, X.; Lv, M.; Huang, K.; Ding, K.; You, Q. Pharmacophore and Molecular Docking Guided 3D-QSAR Study of Bacterial Enoyl-ACP Reductase (FabI) Inhibitors. Int. J. Mol. Sci. 2012, 13, 6620-6638. https://doi.org/10.3390/ijms13066620
Lu X, Lv M, Huang K, Ding K, You Q. Pharmacophore and Molecular Docking Guided 3D-QSAR Study of Bacterial Enoyl-ACP Reductase (FabI) Inhibitors. International Journal of Molecular Sciences. 2012; 13(6):6620-6638. https://doi.org/10.3390/ijms13066620
Chicago/Turabian StyleLu, Xiaoyun, Man Lv, Kun Huang, Ke Ding, and Qidong You. 2012. "Pharmacophore and Molecular Docking Guided 3D-QSAR Study of Bacterial Enoyl-ACP Reductase (FabI) Inhibitors" International Journal of Molecular Sciences 13, no. 6: 6620-6638. https://doi.org/10.3390/ijms13066620