Toward the Prediction of FBPase Inhibitory Activity Using Chemoinformatic Methods

Abstract
:1. Introduction
2. Results and Discussion
2.1. Descriptor Calculation and Preprocessing
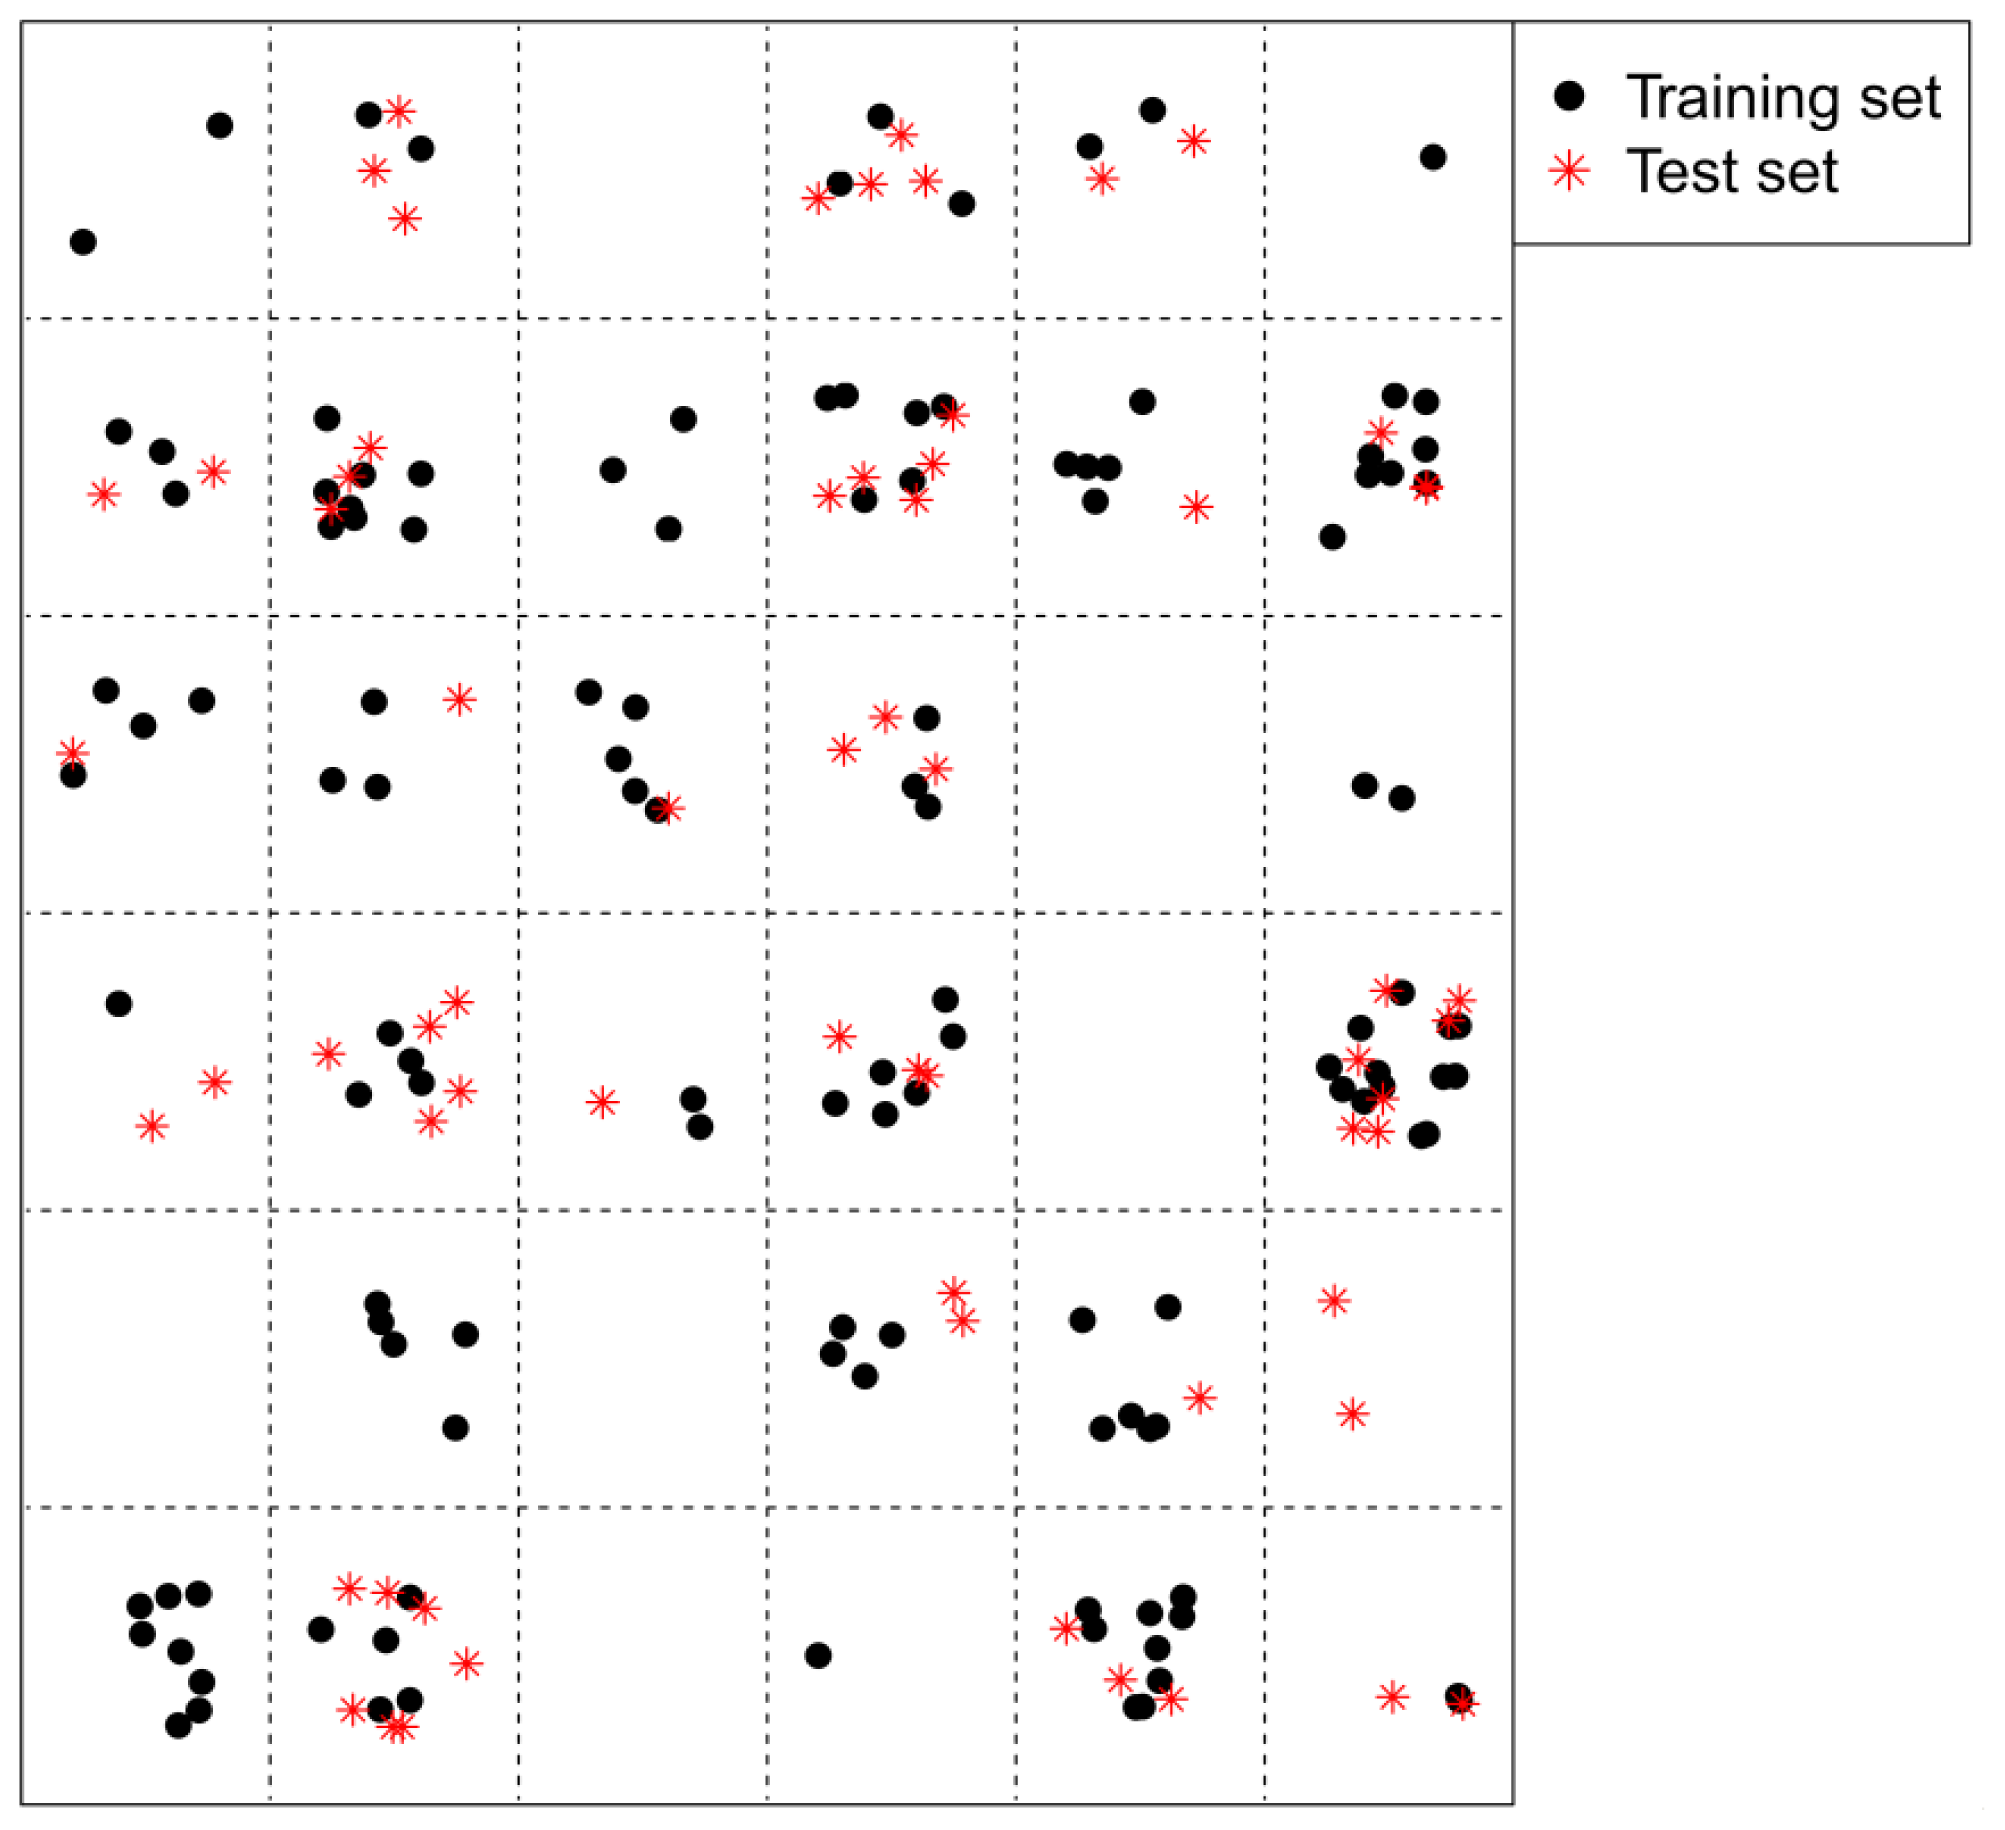
2.2. Split of the Training and Test Sets
2.3. Set Parameters of GA-RF Algorithm
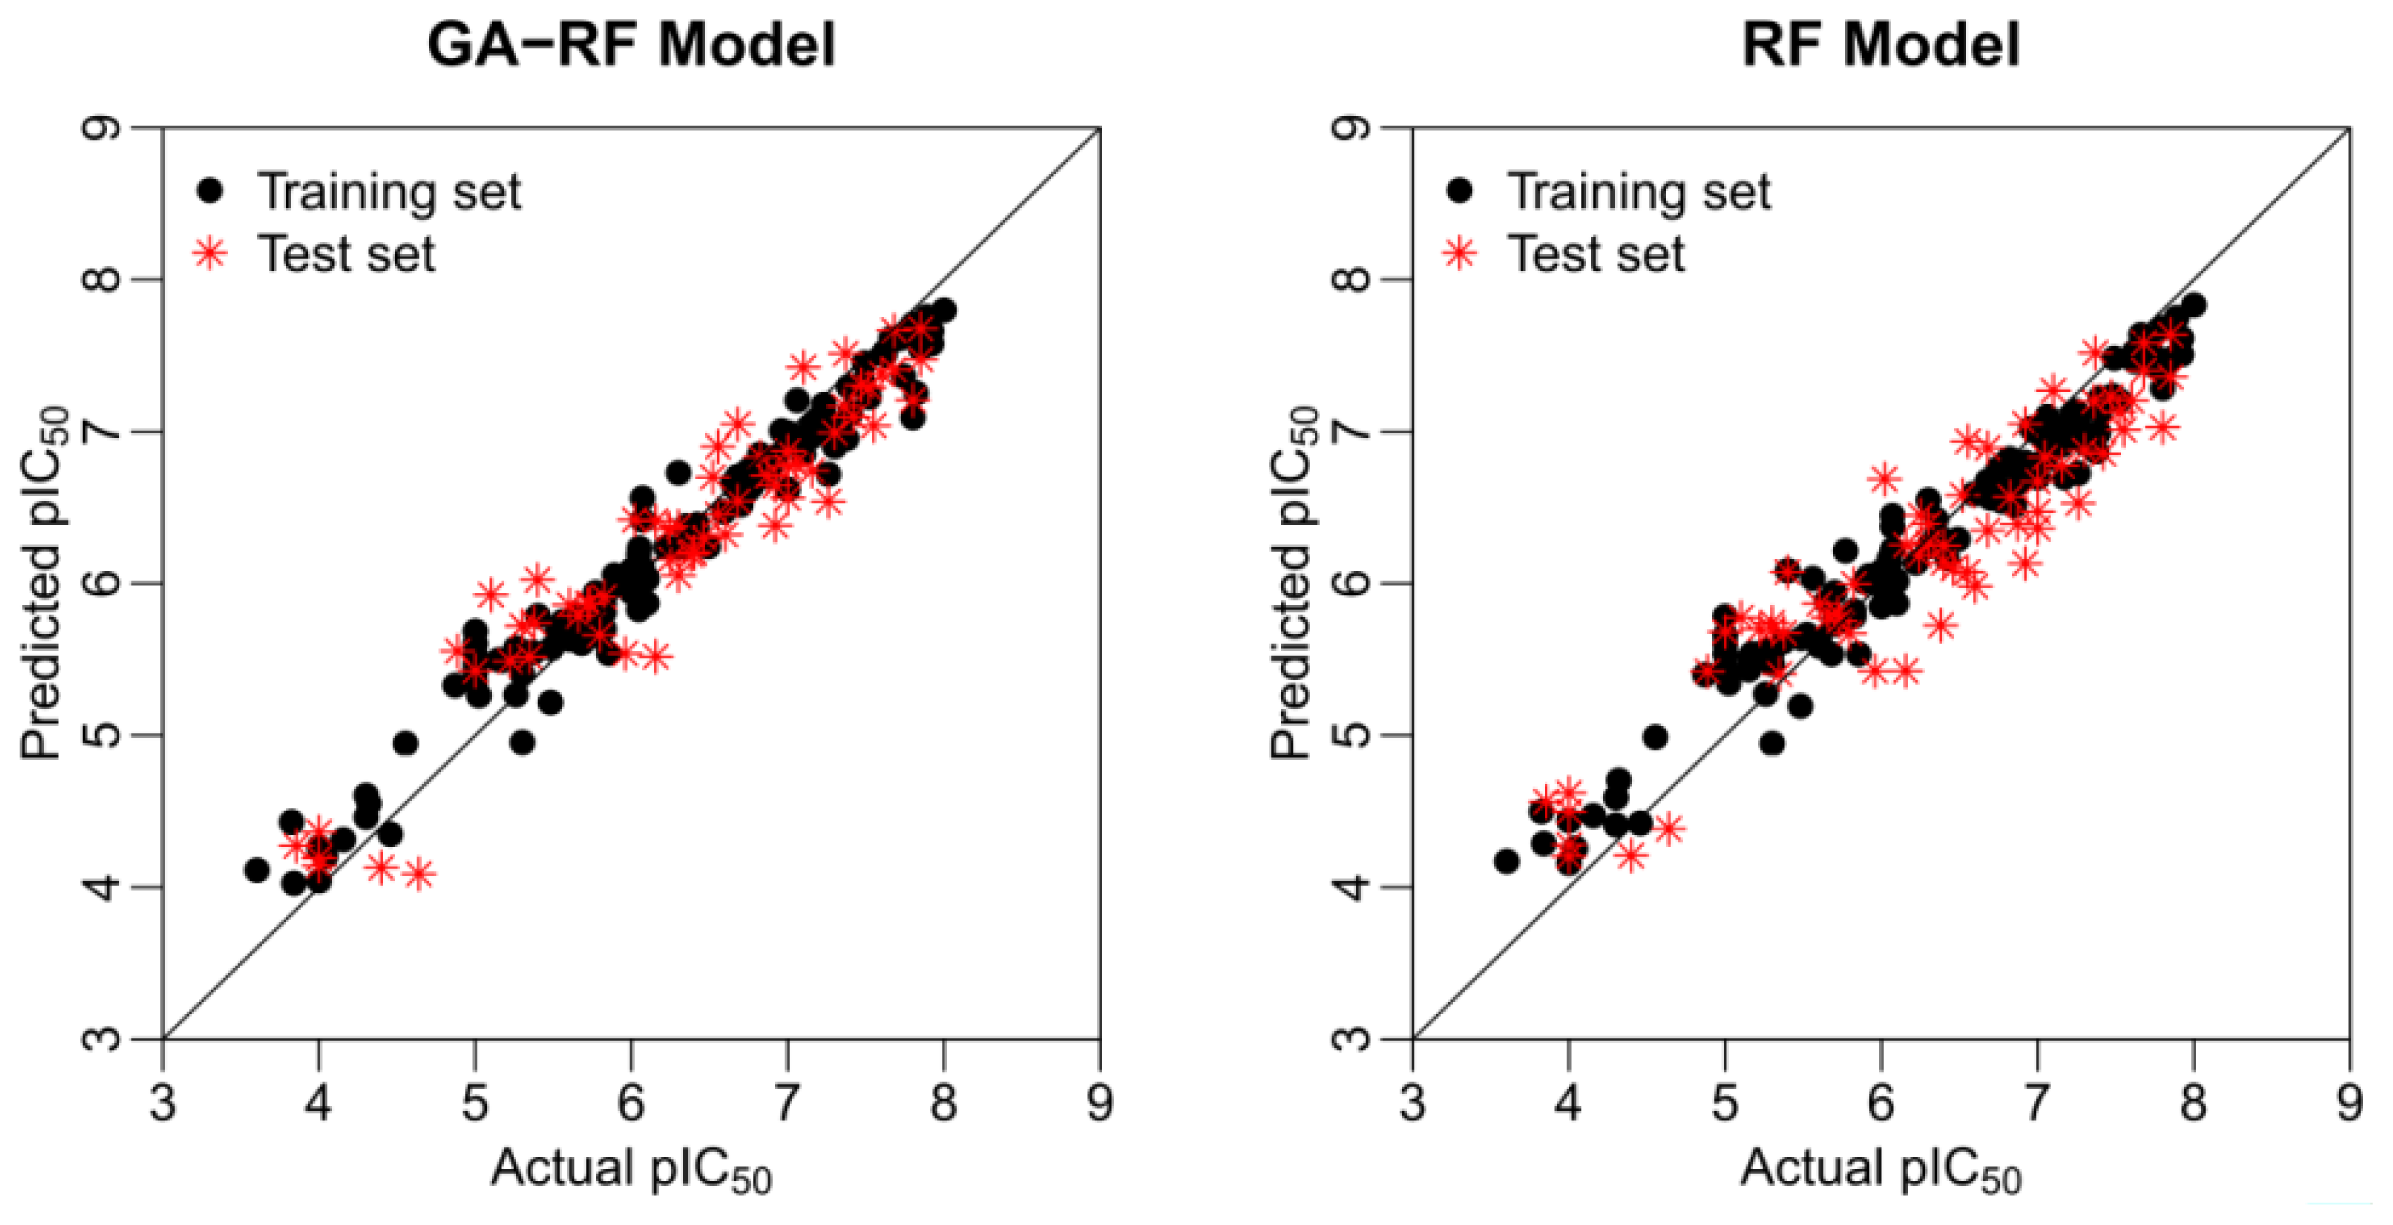
2.4. Statistical Results
2.5. Further Test for the External Prediction Power
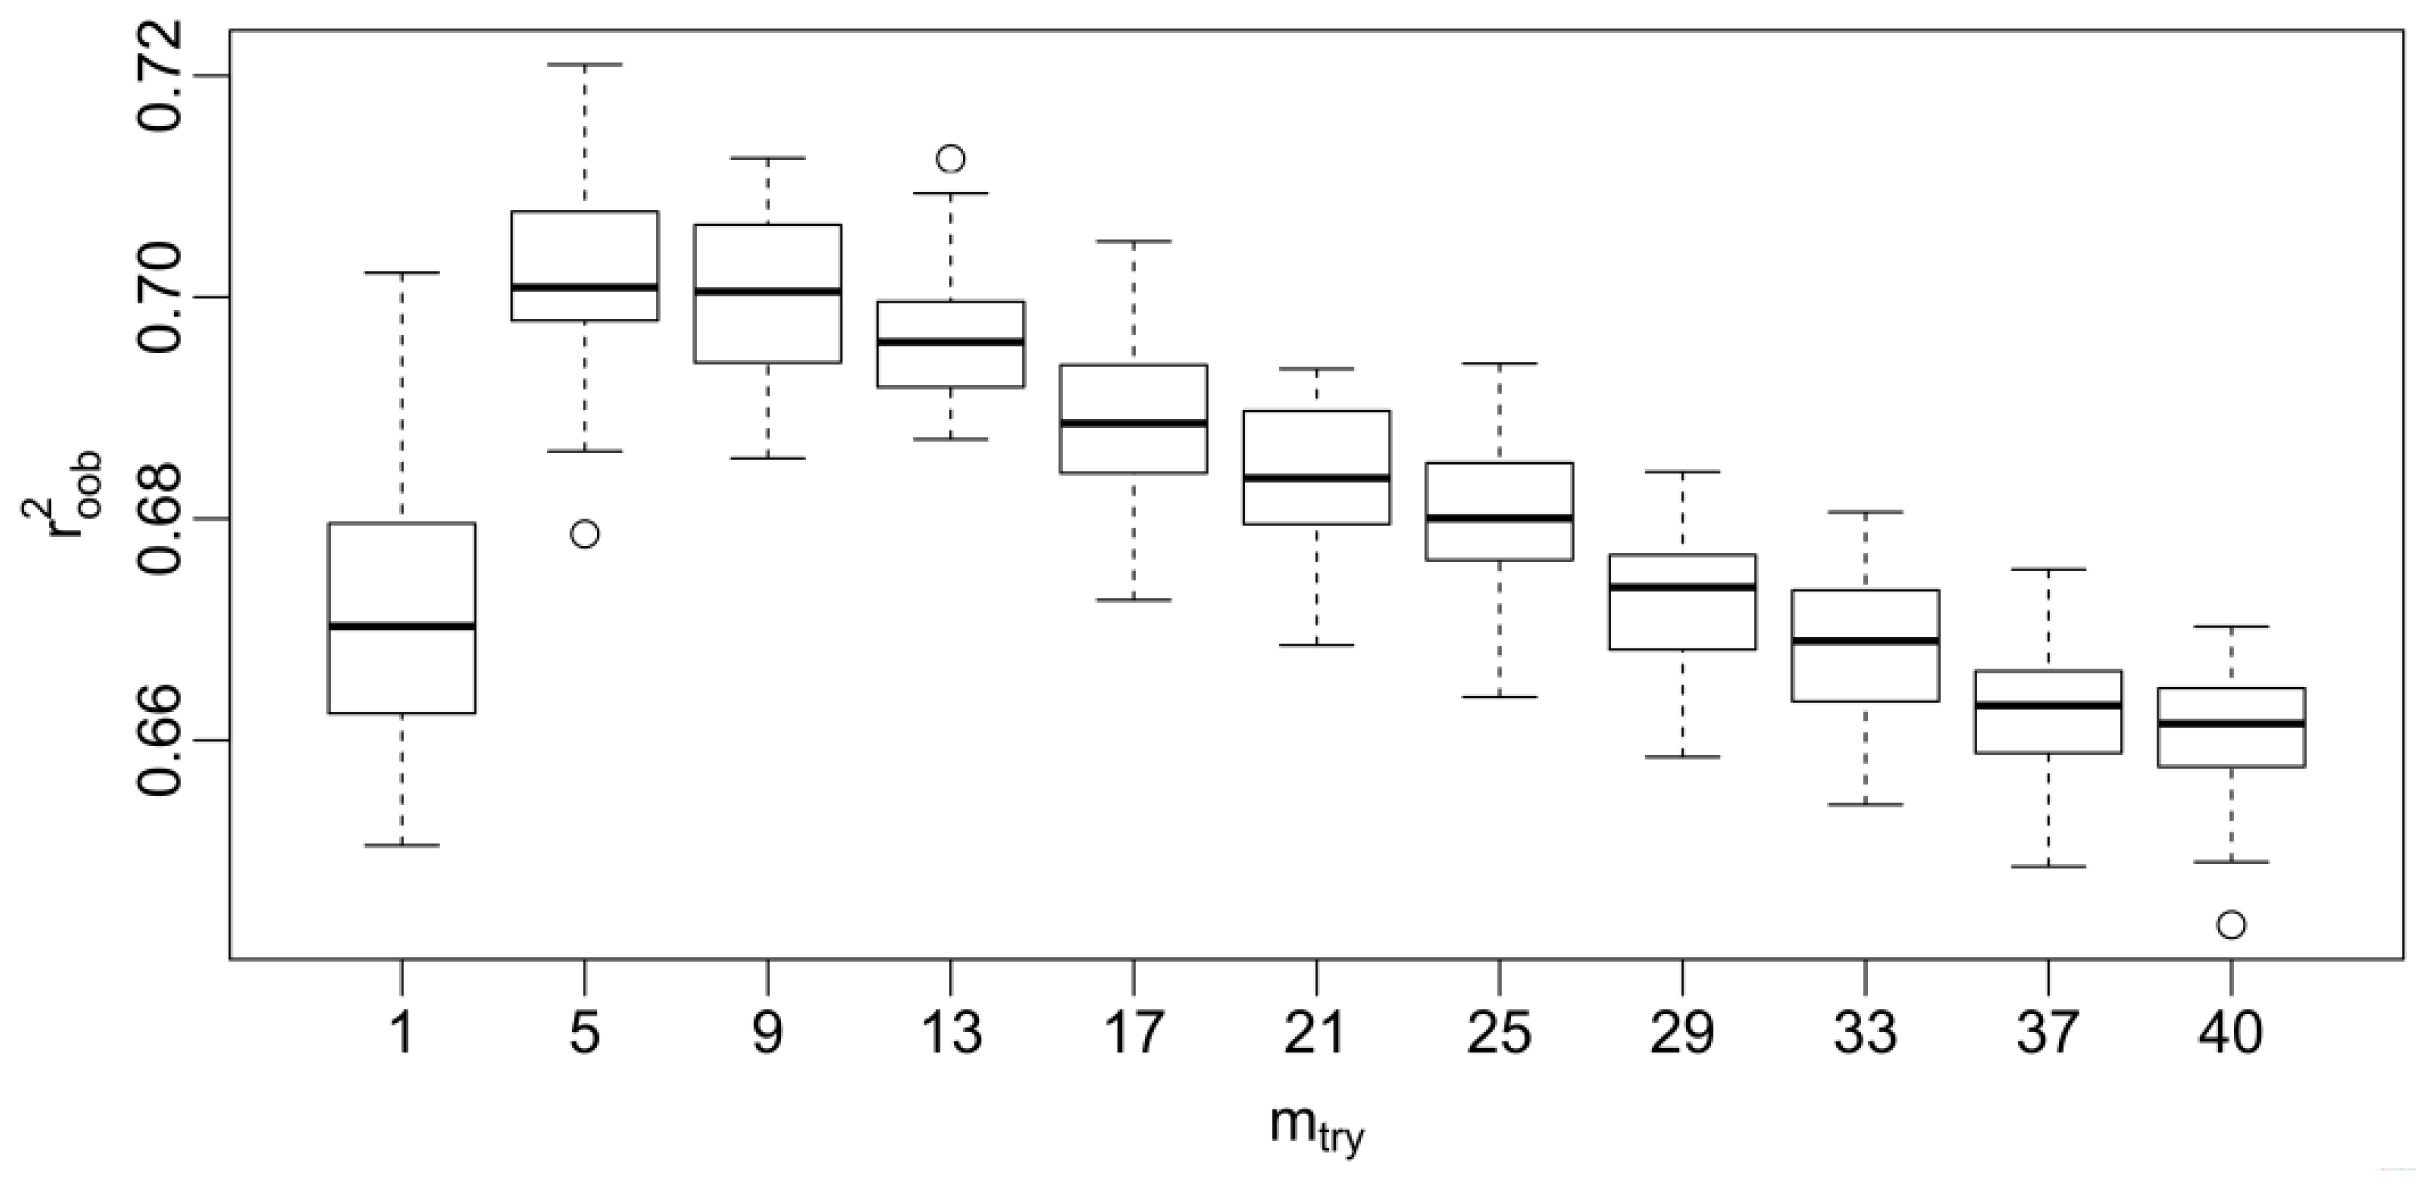
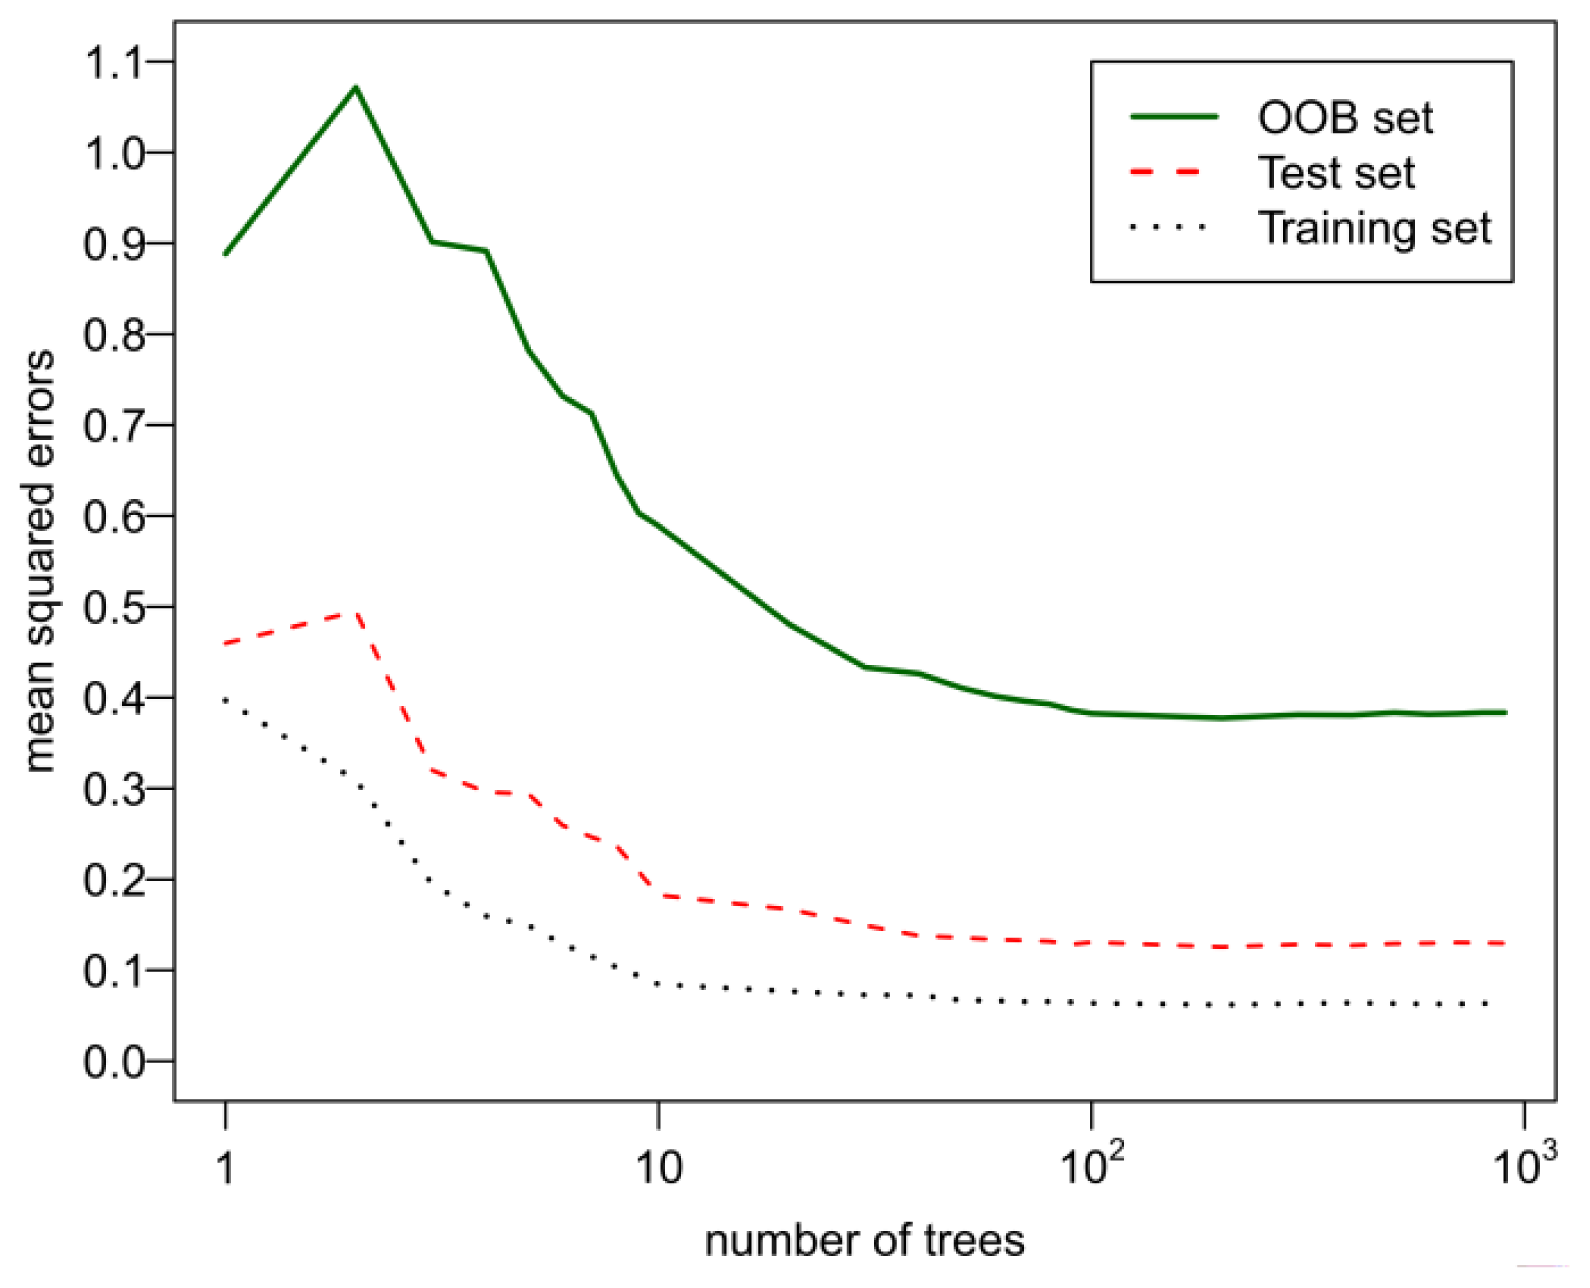
2.6. Investigation of Parameter Turning on the GA-RF Model
2.7. Y-Randomization Check
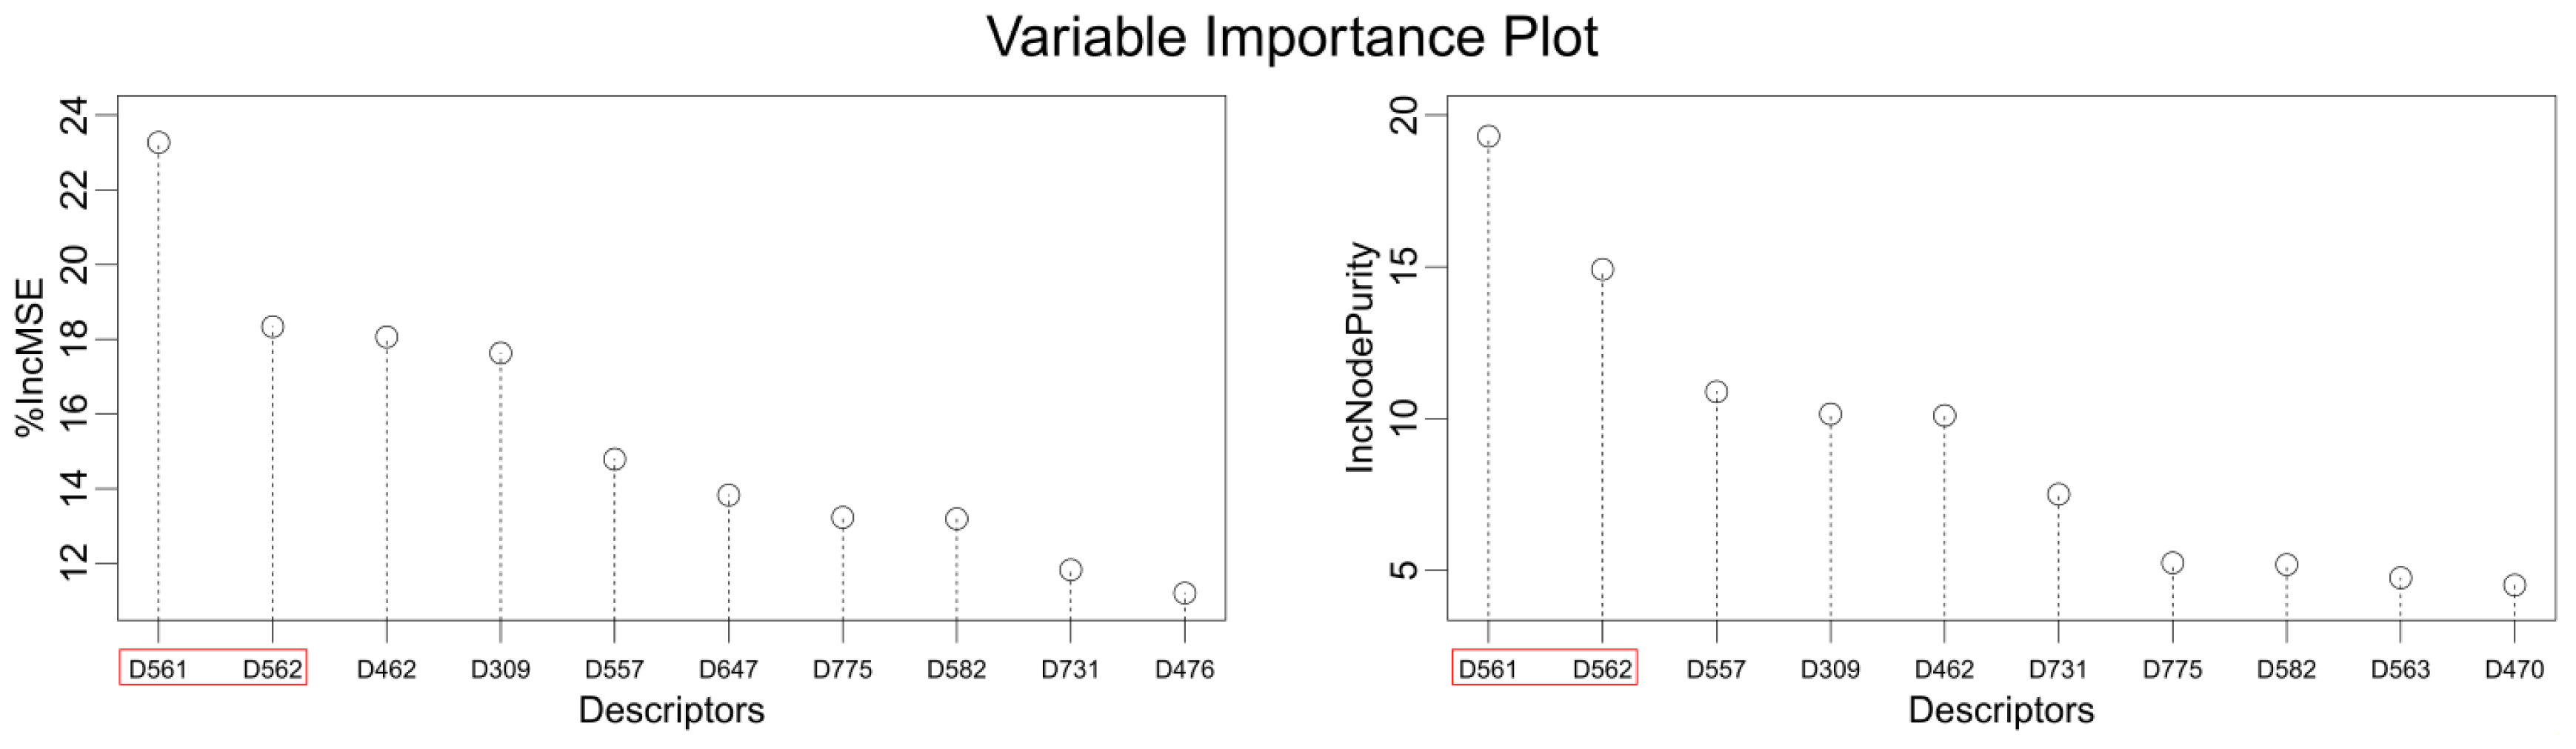
2.8. Explanation of the Selected Descriptors
3. Experimental Section
3.1. Dataset
3.2. Descriptor Calculation
3.3. Computational Methods
3.4. Statistical Validation
4. Conclusions
Acknowledgments
References
- King, H.; Aubert, R.E.; Herman, W.H. Global burden of diabetes, 1995–2025: Prevalence, numerical estimates, and projections. Diabetes Care 1998, 21, 1414–1431. [Google Scholar]
- Zhang, B.B.; Moller, D.E. New approaches in the treatment of type 2 diabetes. Curr. Opin. Chem. Biol 2000, 4, 4614–4667. [Google Scholar]
- Reaven, G.M. Pathophysiology of insulin resistance in human disease. Physiol. Rev 1995, 75, 4734–4786. [Google Scholar]
- Haffner, S.M.; Lehto, S.; Rönnemaa, T.; Pyörälä, K.; Laakso, M. Mortality from coronary heart disease in subjects with type 2 diabetes and in nondiabetic subjects with and without prior myocardial infarction. N. Engl. J. Med 1998, 339, 2292–2234. [Google Scholar]
- Moller, D.E. New drug targets for type 2 diabetes and the metabolic syndrome. Nature 2001, 414, 8218–8227. [Google Scholar]
- Klein, R. Hyperglycemia and microvascular and macrovascular disease in diabetes. Diabetes Care 1995, 18, 2582–2568. [Google Scholar]
- Siconolfi-Baez, L.; Banerji, M.; Lebovitz, H. Characterization and significance of sulfonylurea receptors. Diabetes Care 1990, 13, 2–8. [Google Scholar]
- Bailey, C.J.; Turner, R.C. Metformin. N. Engl. J. Med 1996, 334, 5745–5779. [Google Scholar]
- Kelley, D.E. Effects of weight loss on glucose homeostasis in NIDDM. Diabetes Rev 1995, 3, 366–377. [Google Scholar]
- Howlett, H.C.S.; Bailey, C.J. A risk-benefit assessment of metformin in type 2 diabetes mellitus. Drug Saf 1999, 20, 489–503. [Google Scholar]
- Erion, M.D.; van Poelje, P.D.; Dang, Q.; Kasibhatla, S.R.; Potter, S.C.; Reddy, M.R.; Reddy, K.R.; Jiang, T.; Lipscomb, W.N. MB06322 (CS-917): A potent and selective inhibitor of fructose 1,6-bisphosphatase for controlling gluconeogenesis in type 2 diabetes. Proc. Natl. Acad. Sci. USA 2005, 102, 7970–7975. [Google Scholar]
- Wright, S.W.; Anthony, A.; Carty, M.D.; Danley, D.E.; Hageman, D.L.; Karam, G.A.; Levy, C.B.; Mansour, M.N.; Mathiowetz, A.M.; McClure, L.D. Anilinoquinazoline inhibitors of fructose 1, 6-bisphosphatase bind at a novel allosteric site: Synthesis, in vitro characterization, and X-ray crystallography. J. Med. Chem 2002, 45, 3865–3877. [Google Scholar]
- Lai, C.; Gum, R.J.; Daly, M.; Fry, E.H.; Hutchins, C.; Abad-Zapatero, C.; von Geldern, T.W. Benzoxazole benzenesulfonamides as allosteric inhibitors of fructose-1,6-bisphosphatase. Bioorg. Med. Chem. Lett 2006, 16, 1807–1810. [Google Scholar]
- Wright, S.W.; Carlo, A.A.; Danley, D.E.; Hageman, D.L.; Karam, G.A.; Mansour, M.N.; McClure, L.D.; Pandit, J.; Schulte, G.K.; Treadway, J.L.; et al. 3-(2-Carboxy-ethyl)-4,6-dichloro- 1H-indole-2-carboxylic acid: An allosteric inhibitor of fructose-1,6-bisphosphatase at the AMP site. Bioorg. Med. Chem. Lett 2003, 13, 2055–2058. [Google Scholar]
- Gasteiger, J. The central role of chemoinformatics. Chemom. Intell. Lab. Syst 2006, 82, 200–209. [Google Scholar]
- Lan, P.; Wu, Z.W.; Chen, W.N.; Sun, P.H.; Chen, W.M. Molecular modeling studies on phosphonic acid-containing thiazole derivatives: Design for fructose-1,6-bisphosphatase inhibitors. J. Mol. Model 2011, 18, 973–990. [Google Scholar]
- Svetnik, V.; Liaw, A.; Tong, C.; Culberson, J.C.; Sheridan, R.P.; Feuston, B.P. Random forest: A classification and regression tool for compound classification and QSAR modeling. J. Chem. Inf. Comput. Sci 2003, 43, 1947–1958. [Google Scholar]
- Hong, H.; Xie, Q.; Ge, W.; Qian, F.; Fang, H.; Shi, L.; Su, Z.; Perkins, R.; Tong, W. Mold2, molecular descriptors from 2D structures for chemoinformatics and toxicoinformatics. J. Chem. Inf. Model 2008, 48, 1337–1344. [Google Scholar]
- Golbraikh, A.; Tropsha, A. Beware of q2! J. Mol. Graphics Modell 2002, 20, 269–276. [Google Scholar]
- Roy, P.; Roy, K. On some aspects of variable selection for partial least squares regression models. QSAR Comb. Sci 2008, 27, 302–313. [Google Scholar]
- Cerius2, version 4.6; Accelrys, Inc: San Diego, CA, USA, 2001.
- Mauri, A.; Consonni, V.; Pavan, M.; Todeschini, R. Dragon software: An easy approach to molecular descriptor calculations. Match 2006, 56, 237–248. [Google Scholar]
- Hao, M.; Li, Y.; Wang, Y.; Zhang, S. Prediction of PKCθ inhibitory activity using the random forest algorithm. Int. J. Mol. Sci 2010, 11, 3413–3433. [Google Scholar]
- Hao, M.; Li, Y.; Wang, Y.H.; Zhang, S.W. A classification study of respiratory syncytial virus (RSV) inhibitors by variable selection with random forest. Int. J. Mol. Sci 2011, 12, 1259–1280. [Google Scholar]
- Hao, M.; Li, Y.; Wang, Y.; Zhang, S. Prediction of P2Y12 antagonists using a novel genetic algorithm-support vector machine coupled approach. Anal. Chim. Acta 2011, 690, 53–63. [Google Scholar]
- Li, J.Z.; Li, S.Y.; Lei, B.L.; Liu, H.X.; Yao, X.J.; Liu, M.C.; Gramatica, P. A new strategy to improve the predictive ability of the local lazy regression and its application to the QSAR study of melanin-concentrating hormone receptor 1 antagonists. J. Comput. Chem 2010, 31, 973–985. [Google Scholar]
- Hao, M.; Li, Y.; Wang, Y.; Yan, Y.; Zhang, S. Combined 3D-QSAR, molecular docking, and molecular dynamics study on piperazinyl-glutamate-pyridines/pyrimidines as potent P2Y12 antagonists for inhibition of platelet aggregation. J. Chem. Inf. Model 2011, 51, 2560–2572. [Google Scholar]
- Golbraikh, A.; Shen, M.; Xiao, Z.Y.; Xiao, Y.D.; Lee, K.H.; Tropsha, A. Rational selection of training and test sets for the development of validated QSAR models. J. Comput. Aided Mol. Des 2003, 17, 241–253. [Google Scholar]
- Dang, Q.; Liu, Y.; Cashion, D.K.; Kasibhatla, S.R.; Jiang, T.; Taplin, F.; Jacintho, J.D.; Li, H.; Sun, Z.; Fan, Y.; et al. Discovery of a series of phosphonic acid-containing thiazoles and orally bioavailable diamide prodrugs that lower glucose in diabetic animals through inhibition of fructose-1,6-bisphosphatase. J. Med. Chem 2010, 54, 153–165. [Google Scholar]
- Dang, Q.; Kasibthatla, S.R.; Jiang, T.; Taplin, F.; Gibson, T.; Potter, S.C.; van Poelje, P.D.; Erion, M.D. Oxazole phosphonic acids as fructose 1,6-bisphosphatase inhibitors with potent glucose-lowering activity. Med. Chem. Commun 2011, 2, 287–290. [Google Scholar]
- Dang, Q.; Kasibhatla, S.R.; Reddy, K.R.; Jiang, T.; Reddy, M.R.; Potter, S.C.; Fujitaki, J.M.; van Poelje, P.D.; Huang, J.; Lipscomb, W.N.; Erion, M.D. Discovery of potent and specific fructose-1,6-bisphosphatase inhibitors and a series of orally-bioavailable phosphoramidase-sensitive prodrugs for the treatment of type 2 diabetes. J. Am. Chem. Soc 2007, 129, 15491–15502. [Google Scholar]
- Dang, Q.; Brown, B.S.; Liu, Y.; Rydzewski, R.M.; Robinson, E.D.; van Poelje, P.D.; Reddy, M.R.; Erion, M.D. Fructose-1,6-bisphosphatase inhibitors. 1. Purine phosphonic acids as novel AMP mimics. J. Med. Chem 2009, 52, 2880–2898. [Google Scholar]
- Dang, Q.; Kasibhatla, S.R.; Xiao, W.; Liu, Y.; DaRe, J.; Taplin, F.; Reddy, K.R.; Scarlato, G.R.; Gibson, T.; van Poelje, P.D.; et al. Fructose-1,6-bisphosphatase inhibitors. 2. Design, synthesis, and structure-activity relationship of a series of phosphonic acid containing benzimidazoles that function as 5′-adenosinemonophosphate (AMP) mimics. J. Med. Chem 2010, 53, 441–451. [Google Scholar]
- Tropsha, A.; Gramatica, P.; Gombar, V. The importance of being earnest: Validation is the absolute essential for successful application and interpretation of QSPR models. QSAR Comb. Sci 2003, 22, 69–77. [Google Scholar]
- Roy, K.; Mandal, A. Predictive QSAR modeling of CCR5 antagonist piperidine derivatives using chemometric tools. J. Enzyme Inhib. Med. Chem 2009, 24, 205–223. [Google Scholar]
- Ma, Q.; Wyszynski, D.F.; Farrell, J.J.; Kutlar, A.; Farrer, L.A.; Baldwin, C.T.; Steinberg, M.H. Fetal hemoglobin in sickle cell anemia: Genetic determinants of response to hydroxyurea. Pharmacogenomics J 2007, 7, 386–394. [Google Scholar]
- Kuhn, S.; Egert, B.; Neumann, S.; Steinbeck, C. Building blocks for automated elucidation of metabolites: Machine learning methods for NMR prediction. BMC Bioinforma 2008, 9, 400–418. [Google Scholar]
- Hao, M.; Zhang, X.; Ren, H.; Li, Y.; Zhang, S.; Luo, F.; Ji, M.; Li, G.; Yang, L. In silico identification of structure requirement for novel thiazole and oxazole derivatives as potent fructose 1,6-bisphosphatase inhibitors. Int. J. Mol. Sci 2011, 12, 8161–8180. [Google Scholar]
- Mavromoustakos, T.; Durdagi, S.; Koukoulitsa, C.; Simcic, M.; Papadopoulos, M.G.; Hodoscek, M.; Golic Grdadolnik, S. Strategies in the rational drug design. Curr. Med. Chem 2011, 18, 2517–2530. [Google Scholar]
- O’Boyle, N.; Banck, M.; James, C.; Morley, C.; Vandermeersch, T.; Hutchison, G. Open Babel: An open chemical toolbox. J. Cheminf 2011, 3, 33–46. [Google Scholar]
- Taha, M.; Qandil, A.; Zaki, D.; AlDamen, M. Ligand-based assessment of factor Xa binding site flexibility via elaborate pharmacophore exploration and genetic algorithm-based QSAR modeling. Eur. J. Med. Chem 2005, 40, 701–727. [Google Scholar]
- Mazzatorta, P.; Cronin, M.T.D.; Benfenati, E. A QSAR study of avian oral toxicity using support vector machines and genetic algorithms. QSAR Comb. Sci 2006, 25, 616–628. [Google Scholar]
- Hemmateenejad, B.; Akhond, M.; Miri, R.; Shamsipur, M. Genetic algorithm applied to the selection of factors in principal component-artificial neural networks: Application to QSAR study of calcium channel antagonist activity of 1,4-dihydropyridines (nifedipine analogous). J. Chem. Inf. Comput. Sci 2003, 43, 1328–1334. [Google Scholar]
- Hemmateenejad, B.; Miri, R.; Akhond, M.; Shamsipur, M. QSAR study of the calcium channel antagonist activity of some recently synthesized dihydropyridine derivatives. An application of genetic algorithm for variable selection in MLR and PLS methods. Chemom. Intell. Lab. Syst 2002, 64, 91–99. [Google Scholar]
- Gao, H. Application of BCUT metrics and genetic algorithm in binary QSAR analysis. J. Chem. Inf. Comput. Sci 2001, 41, 402–407. [Google Scholar]
- Fatemi, M.H.; Jalali-Heravi, M.; Konuze, E. Prediction of bioconcentration factor using genetic algorithm and artificial neural network. Anal. Chim. Acta 2003, 486, 101–108. [Google Scholar]
- Huang, C.; Wang, C. A GA-based feature selection and parameters optimizationfor support vector machines. Expert. Syst. Appl 2006, 31, 231–240. [Google Scholar]
- Leardi, R.; Boggia, R.; Terrile, M. Genetic algorithms as a strategy for feature selection. J. Chemom 1992, 6, 267–281. [Google Scholar]
- Leardi, R.; González, A. Genetic algorithms applied to feature selection in PLS regression: How and when to use them. Chemom. Intell. Lab. Syst 1998, 41, 195–207. [Google Scholar]
- Breiman, L. Random forests. Mach. Learn 2001, 45, 5–32. [Google Scholar]
- Durdagi, S.; Mavromoustakos, T.; Chronakis, N.; Papadopoulos, M.G. Computational design of novel fullerene analogues as potential HIV-1 PR inhibitors: Analysis of the binding interactions between fullerene inhibitors and HIV-1 PR residues using 3D QSAR, molecular docking and molecular dynamics simulations. Bioorg. Med. Chem 2008, 16, 9957–9974. [Google Scholar]
- Zaheer-ul-Haq; Lodhi, M.A.; Nawaz, S.A.; Iqbal, S.; Khan, K.M.; Rode, B.M.; Atta-ur-Rahman; Choudhary, M.I. 3D-QSAR CoMFA studies on bis-coumarine analogues as urease inhibitors: A strategic design in anti-urease agents. Bioorg. Med. Chem. 2008, 16, 3456–3461. [Google Scholar]


| Name | Definition | Name | Definition |
|---|---|---|---|
| D004 | Number of 05-membered rings | D543 | Lowest eigenvalue from Burdex matrix weighted by van der Waals order-4 |
| D016 | Number of double bonds | D545 | Lowest eigenvalue from Burdex matrix weighted by van der Waals order-6 |
| D152 | Mean atomic polarizability scaled on carbon-SP3 | D547 | Lowest eigenvalue from Burdex matrix weighted by van der Waals order-8 |
| D164 | Index of terminal vertex matrix | D557 | Lowest eigenvalue from Burden matrix weighted by polarizabilities order-2 |
| D237 | Kier 3-path index | D561 | Lowest eigenvalue from Burden matrix weighted by polarizabilities order-6 |
| D279 | Total information content order-4 index | D562 | Lowest eigenvalue from Burden matrix weighted by polarizabilities order-7 |
| D309 | Sum eigenvalue weighted by mass distance matrix | D563 | Lowest eigenvalue from Burden matrix weighted by polarizabilities order-8 |
| D455 | Geary topological structure autocorrelation length-1 weighted by atomic van der Waals volumes | D571 | Highest eigenvalue from Burden matrix weighted by masses order-8 |
| D458 | Geary topological structure autocorrelation length-4 weighted by atomic van der Waals volumes | D582 | Highest eigenvalue from Burden matrix weighted by electronegativities Sanderson-scale order-3 |
| D462 | Geary topological structure autocorrelation length-8 weighted by atomic van der Waals volumes | D589 | Highest eigenvalue from Burden matrix weighted by polarizabilities order-2 |
| D465 | Geary topological structure autocorrelation length-3 weighted by atomic Sanderson electronegativities | D598 | Number of total tertiary carbon-SP3 |
| D470 | Geary topological structure autocorrelation length-8 weighted by atomic Sanderson electronegativities | D647 | Number of group primary amines (aliphatic) |
| D473 | Geary topological structure autocorrelation length-3 weighted by atomic polarizabilities | D715 | Number of group CH2R2 |
| D476 | Geary topological structure autocorrelation length-6 weighted by atomic polarizabilities | D719 | Number of group CH2RX |
| D491 | Moran topological structure autocorrelation length-5 weighted by atomic van der Waals volumes | D729 | Number of group =CHR |
| D492 | Moran topological structure autocorrelation length-6 weighted by atomic van der Waals volumes | D731 | Number of group =CHX |
| D499 | Moran topological structure autocorrelation length-5 weighted by atomic Sanderson electronegativities | D746 | Number of group H attached to C0(sp3) no X attached to next C |
| D506 | Moran topological structure autocorrelation length-4 weighted by atomic polarizabilities | D754 | Number of group O= |
| D523 | Mean molecular topological order-3 charge index | D756 | Number of group Al-O-Ar or Ar-O-Ar or R-O-C=X |
| D541 | Lowest eigenvalue from Burden matrix weighted by van der Waals order-2 | D775 | Hydrophilic factor index |
| Model | Training Set | Test Set | ||||
|---|---|---|---|---|---|---|
| r2ncv | r2cv | RMSE | r2ts | r2pred | RMSE | |
| GA-RF | 0.96 | 0.67 | 0.25 | 0.91 | 0.90 | 0.34 |
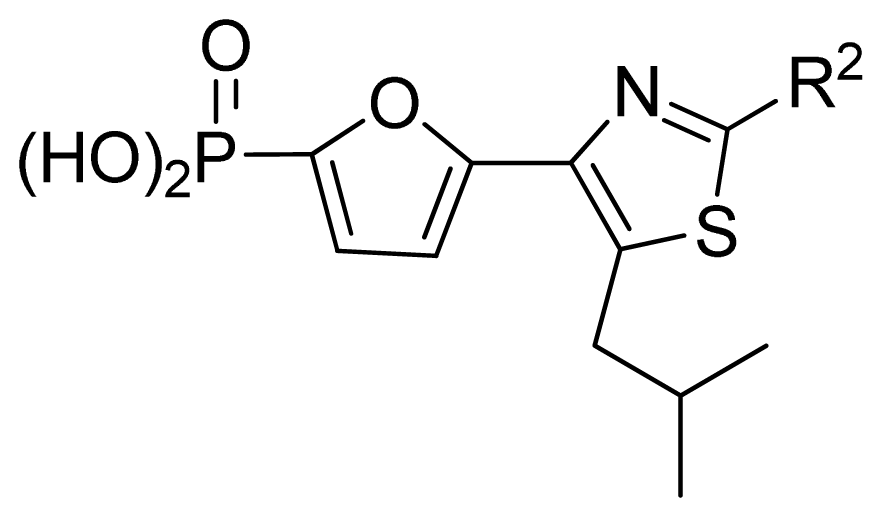
| RF | 0.96 | 0.59 | 0.28 | 0.87 | 0.85 | 0.42 |
 | ||||||||||
|---|---|---|---|---|---|---|---|---|---|---|
| No. | R2 | Obs. pIC50 | GA-RF | RF | Ref. a | |||||
| 1 | Me | 7.00 | 6.62 | 6.70 | [29] | |||||
| 2 * | Et | 6.40 | 6.20 | 6.25 | [29] | |||||
| 3 | vinyl | 5.92 | 5.99 | 6.05 | [29] | |||||
| 4 | CH2OH | 6.66 | 6.63 | 6.61 | [29] | |||||
| 5 * | H | 6.30 | 6.05 | 6.27 | [29] | |||||
| 6 | Cl | 6.74 | 6.61 | 6.64 | [29] | |||||
| 7 | Br | 7.10 | 6.85 | 6.89 | [29] | |||||
| 8 | SMe | 6.05 | 6.23 | 6.16 | [29] | |||||
| 9 | CN | 5.70 | 5.65 | 5.73 | [29] | |||||
| 10 * | NH2 | 7.60 | 7.38 | 7.20 | [29] | |||||
| 11 | NHMe | 6.00 | 5.95 | 6.08 | [29] | |||||
| 12 | NHAc | 5.00 | 5.69 | 5.66 | [29] | |||||
| 13 | CONH2 | 5.56 | 5.75 | 6.03 | [29] | |||||
| 14 * | CSNH2 | 6.30 | 6.38 | 6.39 | [29] | |||||
| 15 | Ph | 4.87 | 5.33 | 5.40 | [29] | |||||
| 16 * | 2-thienyl | 5.10 | 5.93 | 5.78 | [29] | |||||
| 17 | 3-pyridyl | 5.30 | 5.40 | 5.55 | [29] | |||||
 | ||||||||||
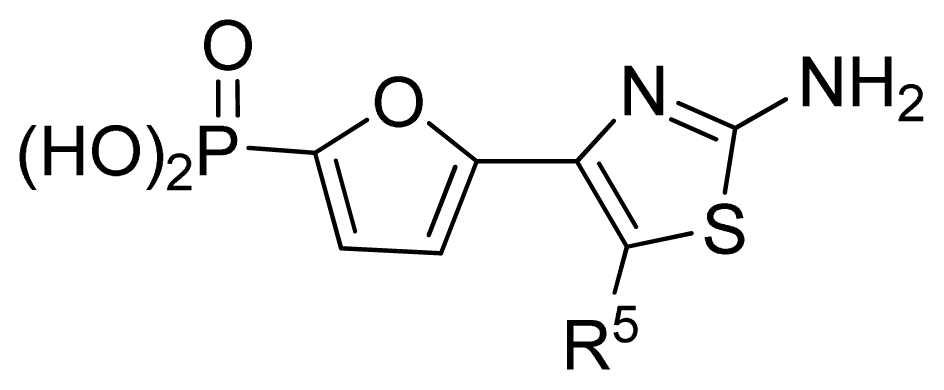
| No. | R5 | Obs. pIC50 | GA-RF | RF | Ref. a | |||||
| 18 | H | 6.35 | 6.38 | 6.42 | [29] | |||||
| 19 | Me | 6.92 | 6.84 | 6.80 | [29] | |||||
| 20 | HOCH2 | 6.30 | 6.73 | 6.55 | [29] | |||||
| 21 * | n-Pr | 7.52 | 7.29 | 7.13 | [29] | |||||
| 22 * | i-Pr | 7.55 | 7.04 | 7.01 | [29] | |||||
| 23 | CF3CH2 | 7.24 | 6.99 | 7.14 | [29] | |||||
| 24 | neopentyl | 7.92 | 7.58 | 7.51 | [29] | |||||
| 25 | cyclobutyl | 7.72 | 7.61 | 7.54 | [29] | |||||
| 26 * | cyclopentyl | 7.68 | 7.67 | 7.58 | [29] | |||||
| 27 | cyclohexyl | 8.00 | 7.80 | 7.83 | [29] | |||||
| 28 | cyclopropyl-CH2 | 7.70 | 7.62 | 7.53 | [29] | |||||
| 29 | cyclopentyl-CH2 | 7.74 | 7.36 | 7.44 | [29] | |||||
| 30 | cyclohexyl-CH2 | 7.23 | 7.18 | 7.08 | [29] | |||||
| 31 | PhCH2 | 6.82 | 6.85 | 6.82 | [29] | |||||
| 32 * | morpholinyl-CH2 | 6.25 | 6.16 | 6.45 | [29] | |||||
 | ||||||||||
| No. | R5 | Obs. pIC50 | GA-RF | RF | Ref.a | |||||
| 33 | Cl | 7.15 | 7.03 | 6.97 | [29] | |||||
| 34 * | Br | 7.30 | 6.99 | 6.88 | [29] | |||||
| 35 * | I | 7.00 | 6.87 | 6.36 | [29] | |||||
| 36 | 1-morpholinyl | 7.80 | 7.09 | 7.29 | [29] | |||||
| 37 | EtS | 7.48 | 7.32 | 7.24 | [29] | |||||
| 38 * | n-PrS | 7.80 | 7.21 | 7.03 | [29] | |||||
| 39 | i-PrS | 7.62 | 7.50 | 7.46 | [29] | |||||
| 40 | t-BuS | 7.62 | 7.52 | 7.53 | [29] | |||||
| 41 * | PhS | 6.52 | 6.70 | 6.58 | [29] | |||||
| 42 | CONMe2 | 5.77 | 5.94 | 6.22 | [29] | |||||
| 43 | CO2Et | 7.85 | 7.55 | 7.48 | [29] | |||||
| 44 | CO2Bn | 7.82 | 7.25 | 7.43 | [29] | |||||
| 45 | n-PrSO | 6.07 | 6.56 | 6.45 | [29] | |||||
| 46 * | Ph | 7.85 | 7.68 | 7.64 | [29] | |||||
| 47 * | 2-MeO-Ph | 7.37 | 7.51 | 7.52 | [29] | |||||
| 48 | 3-MeO-Ph | 7.68 | 7.60 | 7.62 | [29] | |||||
| 49 | 4-MeO-Ph | 7.66 | 7.61 | 7.64 | [29] | |||||
| 50 * | 4-MeS-Ph | 7.68 | 7.41 | 7.40 | [29] | |||||
| 51 | 4-t-Bu-Ph | 7.06 | 7.21 | 7.10 | [29] | |||||
| 52 * | 4-MeO2C-Ph | 7.85 | 7.48 | 7.36 | [29] | |||||
| 53 | 4-F-Ph | 7.80 | 7.71 | 7.68 | [29] | |||||
| 54 | 4-Cl-Ph | 7.89 | 7.76 | 7.75 | [29] | |||||
| 55 | 4-Ac-Ph | 7.49 | 7.45 | 7.48 | [29] | |||||
| 56 | 4-MeSO2-Ph | 7.39 | 7.30 | 7.00 | [29] | |||||
| 57 * | 4-Ph-Ph | 7.47 | 7.31 | 7.23 | [29] | |||||
| 58 | 2-nathphyl | 7.92 | 7.66 | 7.61 | [29] | |||||
| 59 | 2-furanyl | 7.40 | 7.12 | 7.22 | [29] | |||||
| 60 * | 2-thienyl | 7.36 | 7.17 | 7.20 | [29] | |||||
 | ||||||||||
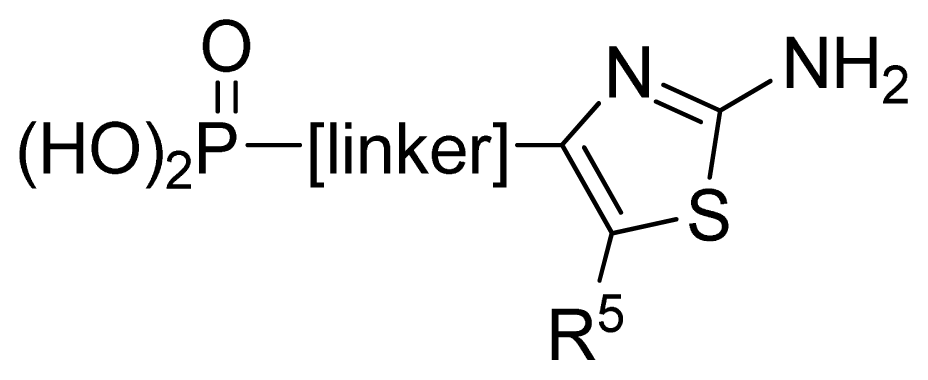
| No. | [linker] | R5 | Obs. pIC50 | GA-RF | RF | Ref. a | ||||
| 61 | 2,5-furanyl | H | 5.00 | 5.41 | 5.78 | [29] | ||||
| 62 | -CH2OCO- | n-Pr | 7.30 | 6.90 | 6.92 | [29] | ||||
| 63* | -CH2NHCO- | 2-thienyl | 6.02 | 6.42 | 6.69 | [29] | ||||
| 64 | 2,6-pyridyl | H | 5.70 | 5.74 | 5.94 | [29] | ||||
| 65 | 1,3-phenyl | H | 5.89 | 6.06 | 6.01 | [29] | ||||
| 66 * | 1,3-phenyl-(6-Me) | n-Pr | 6.87 | 6.71 | 6.39 | [29] | ||||
| 67 * | 1,3-phenyl-(6-OMe) | i-Pr | 6.68 | 7.05 | 6.89 | [29] | ||||
| 68 * | 1,3-phenyl-(6-F) | Ph | 7.10 | 7.42 | 7.27 | [29] | ||||
 | ||||||||||
| No. | R5 | Obs. pIC50 | GA-RF | RF | Ref. a | |||||
| 69 * | i-Bu | 6.92 | 6.38 | 6.13 | [30] | |||||
| 70 | H | 5.00 | 5.60 | 5.43 | [30] | |||||
| 71 | Allyl | 6.85 | 6.70 | 6.51 | [30] | |||||
| 72 | n-Bu | 6.77 | 6.64 | 6.54 | [30] | |||||
| 73* | n-Pentyl | 6.68 | 6.54 | 6.35 | [30] | |||||
| 74 | -CH2-cyclohexyl | 6.49 | 6.24 | 6.29 | [30] | |||||
| 75 | Ph | 6.80 | 6.78 | 6.80 | [30] | |||||
| 76 | Bn | 6.05 | 6.23 | 6.12 | [30] | |||||
| 77 | -CH2-(2-thienyl) | 6.59 | 6.47 | 6.59 | [30] | |||||
| 78 | n-PrS | 7.15 | 6.97 | 6.91 | [30] | |||||
| 79 | i-PrS | 6.96 | 7.01 | 7.02 | [30] | |||||
| 80 * | t-BuS | 6.92 | 6.64 | 7.05 | [30] | |||||
| 81 | PhS | 5.40 | 5.79 | 6.08 | [30] | |||||
| 82 | -CO2Me | 7.17 | 7.06 | 6.70 | [30] | |||||
| 83 * | -CO2Et | 7.42 | 7.10 | 6.85 | [30] | |||||
| 84 | -CO2Pr-i | 7.40 | 7.13 | 7.14 | [30] | |||||
| 85 | -CO2Bn | 7.07 | 6.95 | 6.91 | [30] | |||||
| 86 | -COSEt | 7.52 | 7.23 | 7.20 | [30] | |||||
| 87 | -COBu-t | 6.07 | 6.10 | 6.22 | [30] | |||||
 | ||||||||||
| No. | R2 | Obs. pIC50 | GA-RF | RF | Ref. a | |||||
| 88 | Me | 6.22 | 6.24 | 6.14 | [30] | |||||
| 89 | HO | 5.00 | 5.48 | 5.43 | [30] | |||||
| 90 * | H | 5.72 | 5.87 | 5.80 | [30] | |||||
| 91 | Me2N- | 5.68 | 5.61 | 5.54 | [30] | |||||
| 92* | i-Pr- | 5.66 | 5.79 | 5.78 | [30] | |||||
| 93 | MeHN- | 5.37 | 5.55 | 5.62 | [30] | |||||
| 94 | Et | 6.02 | 6.09 | 5.94 | [30] | |||||
| 95 * | EtHN- | 5.00 | 5.43 | 5.68 | [30] | |||||
| 96 | vinyl | 5.17 | 5.49 | 5.54 | [30] | |||||
 | ||||||||||
| No. | R2 | R5 | Obs. pIC50 | GA-RF | RF | Ref. a | ||||
| 97 | H2N- | H | 5.15 | 5.50 | 5.43 | [30] | ||||
| 98 * | H2N- | Me | 6.38 | 6.19 | 5.72 | [30] | ||||
| 99 | H2N- | Et | 6.42 | 6.39 | 6.17 | [30] | ||||
| 100 * | H2N- | n-Pr | 6.55 | 6.46 | 6.08 | [30] | ||||
| 101 * | H2N- | i-Pr | 6.24 | 6.36 | 6.19 | [30] | ||||
| 102 * | H2N- | n-Bu | 6.60 | 6.32 | 5.98 | [30] | ||||
| 103 * | H2N- | n-Pent | 6.46 | 6.30 | 6.10 | [30] | ||||
| 104 | Me | CF3 | 5.00 | 5.45 | 5.54 | [30] | ||||
| 105 | H | Ph | 5.00 | 5.35 | 5.45 | [30] | ||||
 | ||||||||||
| No. | X | Y | Q | R2 | R5 | Obs. pIC50 | GA-RF | RF | Ref. a | |
| 106 | NH | O | PO3H2 | NH2 | iBu | 5.30 | 5.55 | 5.47 | [31] | |
| 107 | S | O | PO3H2 | H | H | 5.26 | 5.58 | 5.56 | [31] | |
| 108 | CH=CH | O | PO3H2 | NH2 | Ph | 7.38 | 6.95 | 6.87 | [31] | |
 | ||||||||||
| No. | R8 | R′ | Obs. pIC50 | GA-RF | RF | Ref. a | ||||
| 109 * | -NH(CH2)2PO3H2 | OH | 4.00 | 4.36 | 4.62 | [32] | ||||
| 110 * | -NH(CH2)2OPO3H2 | OH | 3.85 | 4.27 | 4.56 | [32] | ||||
| 111 | -NH(CH2)2PO3H2 | H | 4.00 | 4.27 | 4.44 | [32] | ||||
 | ||||||||||
| No. | [linker] | R9 | Obs. pIC50 | GA-RF | RF | Ref. a | ||||
| 112 | -NH(CH2)2- | Bn | 4.04 | 4.20 | 4.26 | [32] | ||||
| 113 * | -NH(CH2)2- | Ph(CH2)2- | 4.00 | 4.14 | 4.20 | [32] | ||||
| 114 | -NH(CH2)2- | 2-naphthyl-CH2- | 4.46 | 4.35 | 4.42 | [32] | ||||
| 115 * | -CONHCH2- | Ph(CH2)2- | 4.00 | 4.19 | 4.50 | [32] | ||||
| 116 | -(CH2)3- | Ph(CH2)2- | 4.00 | 4.04 | 4.16 | [32] | ||||
| 117 * | -CH=CHCH2- | Ph(CH2)2- | 4.00 | 4.19 | 4.28 | [32] | ||||
| 118 | -S(CH2)2- | Ph(CH2)2- | 3.84 | 4.03 | 4.29 | [32] | ||||
| 119 * | -CH2OCH2- | Ph(CH2)2- | 4.64 | 4.09 | 4.38 | [32] | ||||
| 120 | -2,5-furanyl- | Ph(CH2)2- | 5.30 | 4.95 | 4.95 | [32] | ||||
| 121 | -2,5-thienyl- | Ph(CH2)2- | 4.32 | 4.55 | 4.71 | [32] | ||||
 | ||||||||||
| No. | R8 | Obs. pIC50 | GA-RF | RF | Ref. a | |||||
| 122 * | -(CH2)2-OPO(OH)2 | 4.40 | 4.13 | 4.21 | [32] | |||||
| 123 | -2,5-furanyl-SO3H | 3.82 | 4.43 | 4.50 | [32] | |||||
 | ||||||||||
| No. | R2 | R | R9 | Obs. pIC50 | GA-RF | RF | Ref. a | |||
| 124 | H | -N(Me)2 | -(CH2)2Ph | 3.60 | 4.11 | 4.17 | [32] | |||
| 125 | H | -NHMe | -(CH2)2Ph | 4.30 | 4.46 | 4.41 | [32] | |||
| 126 | H | Cl | -(CH2)2Ph | 4.30 | 4.61 | 4.59 | [32] | |||
| 127 | H | -NH2 | -CH2CH(Ph)2 | 4.15 | 4.31 | 4.47 | [32] | |||
| 128 | H | -NH2 | -(CH2)2(cyclohexyl) | 5.85 | 5.54 | 5.54 | [32] | |||
| 129 | H | -NH2 | -(CH2)(2-naphthyl) | 5.48 | 5.22 | 5.19 | [32] | |||
| 130 | H | -NH2 | cyclopropyl | 5.82 | 5.70 | 5.78 | [32] | |||
| 131 | H | -NH2 | cyclopentyl | 5.70 | 5.69 | 5.76 | [32] | |||
| 132 | H | -NH2 | Et | 5.74 | 5.65 | 5.76 | [32] | |||
| 133 | H | -NH2 | isobutyl | 5.82 | 5.81 | 5.82 | [32] | |||
| 134 | H | -NH2 | neopentyl | 6.10 | 5.87 | 5.87 | [32] | |||
| 135 * | -SMe | -NH2 | isobutyl | 6.15 | 5.52 | 5.42 | [32] | |||
| 136 | -SO2Me | -NH2 | isobutyl | 4.55 | 4.95 | 4.99 | [32] | |||
 | ||||||||||
| No. | R2 | R9 | [linker] | Obs. pIC50 | GA-RF | RF | Ref. a | |||
| 137 * | H | -CH2C(Me)2CH2OH | 2,5-furanyl | 5.35 | 5.52 | 5.40 | [32] | |||
| 138 | H | -CH2C(Me)2CH2Cl | 2,5-furanyl | 6.05 | 5.83 | 5.91 | [32] | |||
| 139 * | H | -CH2C(Me)2CMe3 | 2,5-furanyl | 5.80 | 5.66 | 5.67 | [32] | |||
| 140 * | H | -CH(Me)CMe3 | 2,5-furanyl | 5.30 | 5.72 | 5.74 | [32] | |||
| 141 | -NH2 | -CH2CMe3 | 2,5-furanyl | 5.26 | 5.27 | 5.27 | [32] | |||
| 142 * | -SMe | -CH2CMe3 | 2,5-furanyl | 5.96 | 5.54 | 5.42 | [32] | |||
| 143 * | H | -CH2CMe3 | 2,5-(3,4-di-Cl)furanyl | 4.89 | 5.56 | 5.42 | [32] | |||
 | ||||||||||
| No. | R | Obs. pIC50 | GA-RF | RF | Ref. a | |||||
| 144 * | Me | 5.22 | 5.49 | 5.70 | [33] | |||||
| 145 | Et | 5.65 | 5.80 | 5.88 | [33] | |||||
| 146 | nPr | 5.96 | 6.00 | 6.03 | [33] | |||||
| 147 * | iBu | 5.82 | 5.91 | 6.00 | [33] | |||||
| 148 | cycllopropyl-CH2- | 6.10 | 6.03 | 6.02 | [33] | |||||
| 149 | cyclobutyl-CH2- | 6.10 | 6.04 | 6.01 | [33] | |||||
| 150 | cyclopentyl-CH2- | 5.82 | 5.87 | 5.81 | [33] | |||||
| 151 | cyclohexyl-CH2- | 5.60 | 5.64 | 5.63 | [33] | |||||
| 152 | cycloheptyl-CH2- | 5.49 | 5.57 | 5.64 | [33] | |||||
| 153 | norbornyl | 6.00 | 5.94 | 5.85 | [33] | |||||
| 154 * | benzyl | 5.30 | 5.72 | 5.70 | [33] | |||||
| 155 | 4-tBu-benzyl | 5.02 | 5.26 | 5.34 | [33] | |||||
| 156 | 4-CF3-benzyl | 5.15 | 5.50 | 5.51 | [33] | |||||
| 157 | 4-Ph-benzyl | 5.60 | 5.63 | 5.59 | [33] | |||||
| 158 * | 3-furanyl-CH2- | 5.38 | 5.74 | 5.68 | [33] | |||||
| 159 * | 3-HO-benzyl | 5.73 | 5.87 | 5.75 | [33] | |||||
| 160 * | 3-thienyl-CH2- | 5.40 | 6.02 | 6.08 | [33] | |||||
 | ||||||||||
| No. | R1 | R5 | R7 | Obs. pIC50 | GA-RF | RF | Ref. a | |||
| 161 * | iBu | Et | H | 5.60 | 5.86 | 5.87 | [33] | |||
| 162 | iBu | nPr | H | 5.52 | 5.69 | 5.66 | [33] | |||
| 163 * | iBu | MeO | H | 6.15 | 6.41 | 6.25 | [33] | |||
| 164 | iBu | OH | H | 6.30 | 6.23 | 6.24 | [33] | |||
| 165 | iBu | Cl | H | 6.70 | 6.52 | 6.56 | [33] | |||
| 166 | iBu | H | Cl | 6.05 | 6.19 | 6.11 | [33] | |||
| 167 | iBu | Br | H | 6.40 | 6.32 | 6.29 | [33] | |||
| 168 * | iBu | H | Br | 6.40 | 6.21 | 6.14 | [33] | |||
| 169 * | iBu | F | H | 7.00 | 6.56 | 6.47 | [33] | |||
| 170 * | (Et)2CHCH2- | F | H | 6.82 | 6.83 | 6.57 | [33] | |||
| 171 | (Et)2CH- | F | H | 6.07 | 6.42 | 6.38 | [33] | |||
| 172 * | cPr-CH2- | F | H | 7.26 | 6.54 | 6.53 | [33] | |||
 | ||||||||||
| No. | R5 | R6 | R7 | Obs. pIC50 | GA-RF | RF | Ref. a | |||
| 173 | Br | H | Br | 6.00 | 6.09 | 6.03 | [33] | |||
| 174 | Cl | H | Cl | 6.35 | 6.34 | 6.30 | [33] | |||
| 175 * | F | H | Cl | 7.00 | 6.77 | 6.67 | [33] | |||
| 176 | F | H | Br | 6.89 | 6.75 | 6.67 | [33] | |||
| 177 | F | Cl | H | 6.65 | 6.66 | 6.59 | [33] | |||
| 178 | Br | Cl | Cl | 5.00 | 5.53 | 5.60 | [33] | |||
| 179 * | F | H | vinyl | 6.55 | 6.90 | 6.94 | [33] | |||
| 180 | F | H | cPr | 7.22 | 7.08 | 7.10 | [33] | |||
 | ||||||||||
| No. | R7 | Obs. pIC50 | GA-RF | RF | Ref. a | |||||
| 181 * | Ph | 7.05 | 6.79 | 6.83 | [33] | |||||
| 182 | 4-F-Ph | 6.74 | 6.74 | 6.75 | [33] | |||||
| 183 | 4-Cl-Ph | 7.05 | 6.94 | 6.81 | [33] | |||||
| 184 | Et | 7.26 | 7.07 | 7.06 | [33] | |||||
| 185 | nPr | 7.00 | 6.99 | 7.02 | [33] | |||||
| 186 | tBu(CH2)2- | 6.68 | 6.70 | 6.67 | [33] | |||||
| 187 | (Me)2CH(CH2)3- | 7.00 | 6.92 | 6.99 | [33] | |||||
| 188 | HO(CH2)3- | 7.10 | 6.97 | 7.05 | [33] | |||||
| 189 | (Me)2N(CH2)3- | 7.26 | 6.72 | 6.73 | [33] | |||||
| 190 * | Cl(CH2)4- | 7.15 | 6.74 | 6.78 | [33] | |||||
| Model | r2ts | r2pred | r2o | (r2ts − r2o)/r2ts | k | r2m |
|---|---|---|---|---|---|---|
| GA-RF | 0.91 | 0.90 | 0.90 | 0.01 | 1.01 | 0.83 |
| RF | 0.87 | 0.85 | 0.85 | 0.02 | 1.01 | 0.76 |
© 2012 by the authors; licensee Molecular Diversity Preservation International, Basel, Switzerland. This article is an open-access article distributed under the terms and conditions of the Creative Commons Attribution license (http://creativecommons.org/licenses/by/3.0/).
Share and Cite
Hao, M.; Zhang, S.; Qiu, J. Toward the Prediction of FBPase Inhibitory Activity Using Chemoinformatic Methods. Int. J. Mol. Sci. 2012, 13, 7015-7037. https://doi.org/10.3390/ijms13067015
Hao M, Zhang S, Qiu J. Toward the Prediction of FBPase Inhibitory Activity Using Chemoinformatic Methods. International Journal of Molecular Sciences. 2012; 13(6):7015-7037. https://doi.org/10.3390/ijms13067015
Chicago/Turabian StyleHao, Ming, Shuwei Zhang, and Jieshan Qiu. 2012. "Toward the Prediction of FBPase Inhibitory Activity Using Chemoinformatic Methods" International Journal of Molecular Sciences 13, no. 6: 7015-7037. https://doi.org/10.3390/ijms13067015