Micronization of Taxifolin by Supercritical Antisolvent Process and Evaluation of Radical Scavenging Activity


Abstract
:1. Introduction
2. Results and Discussion
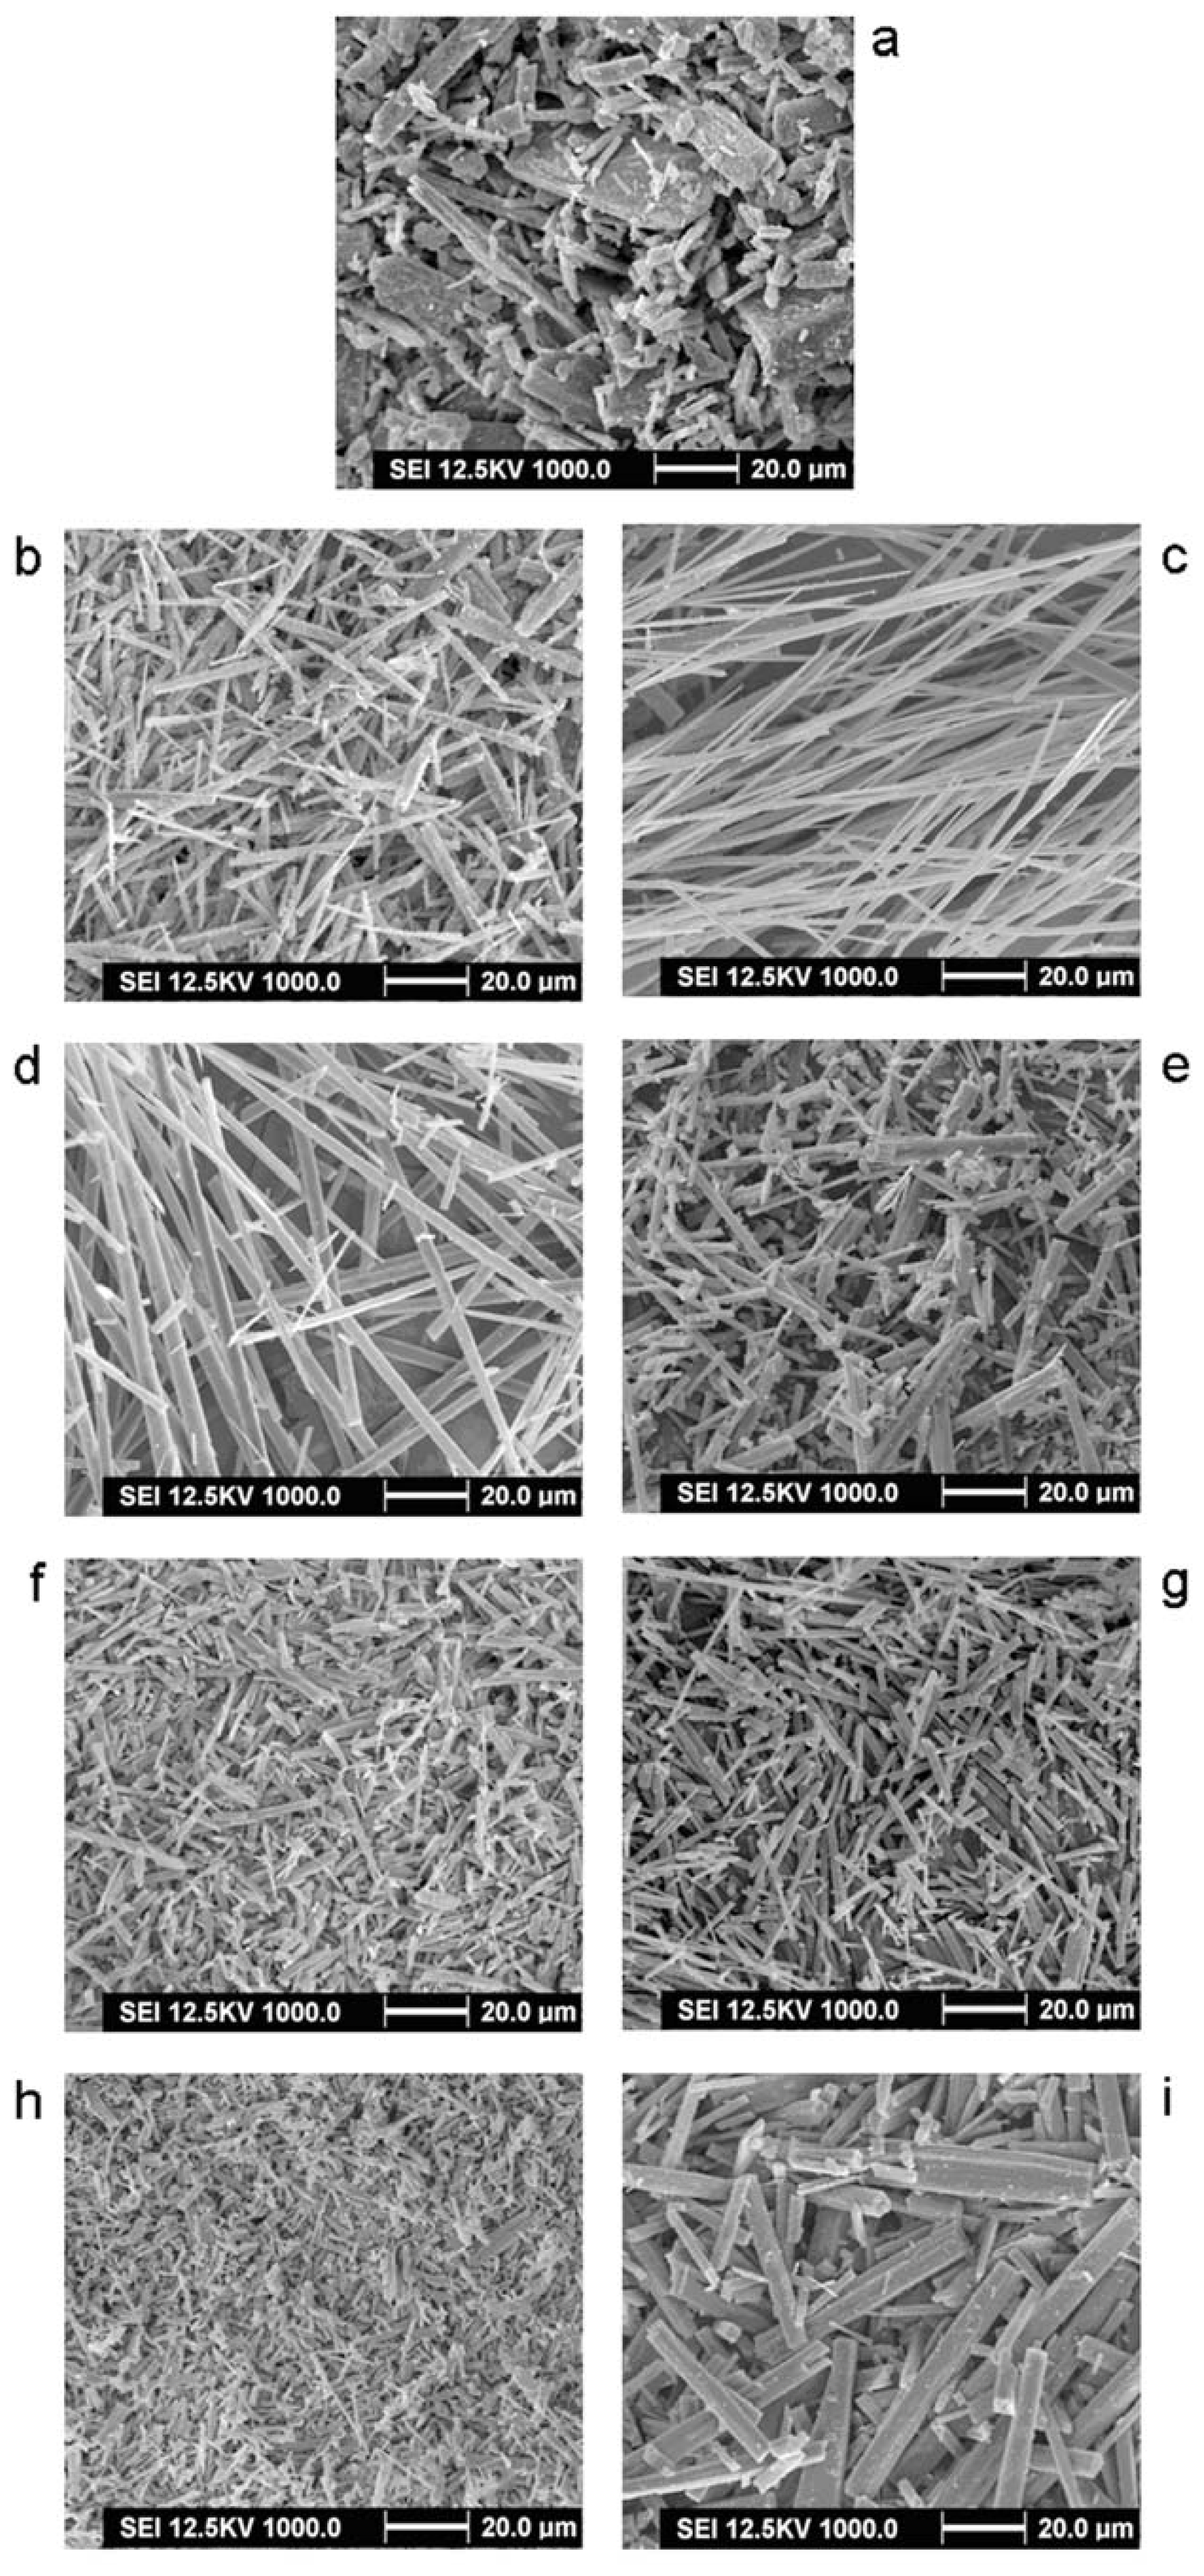
2.1. Morphology
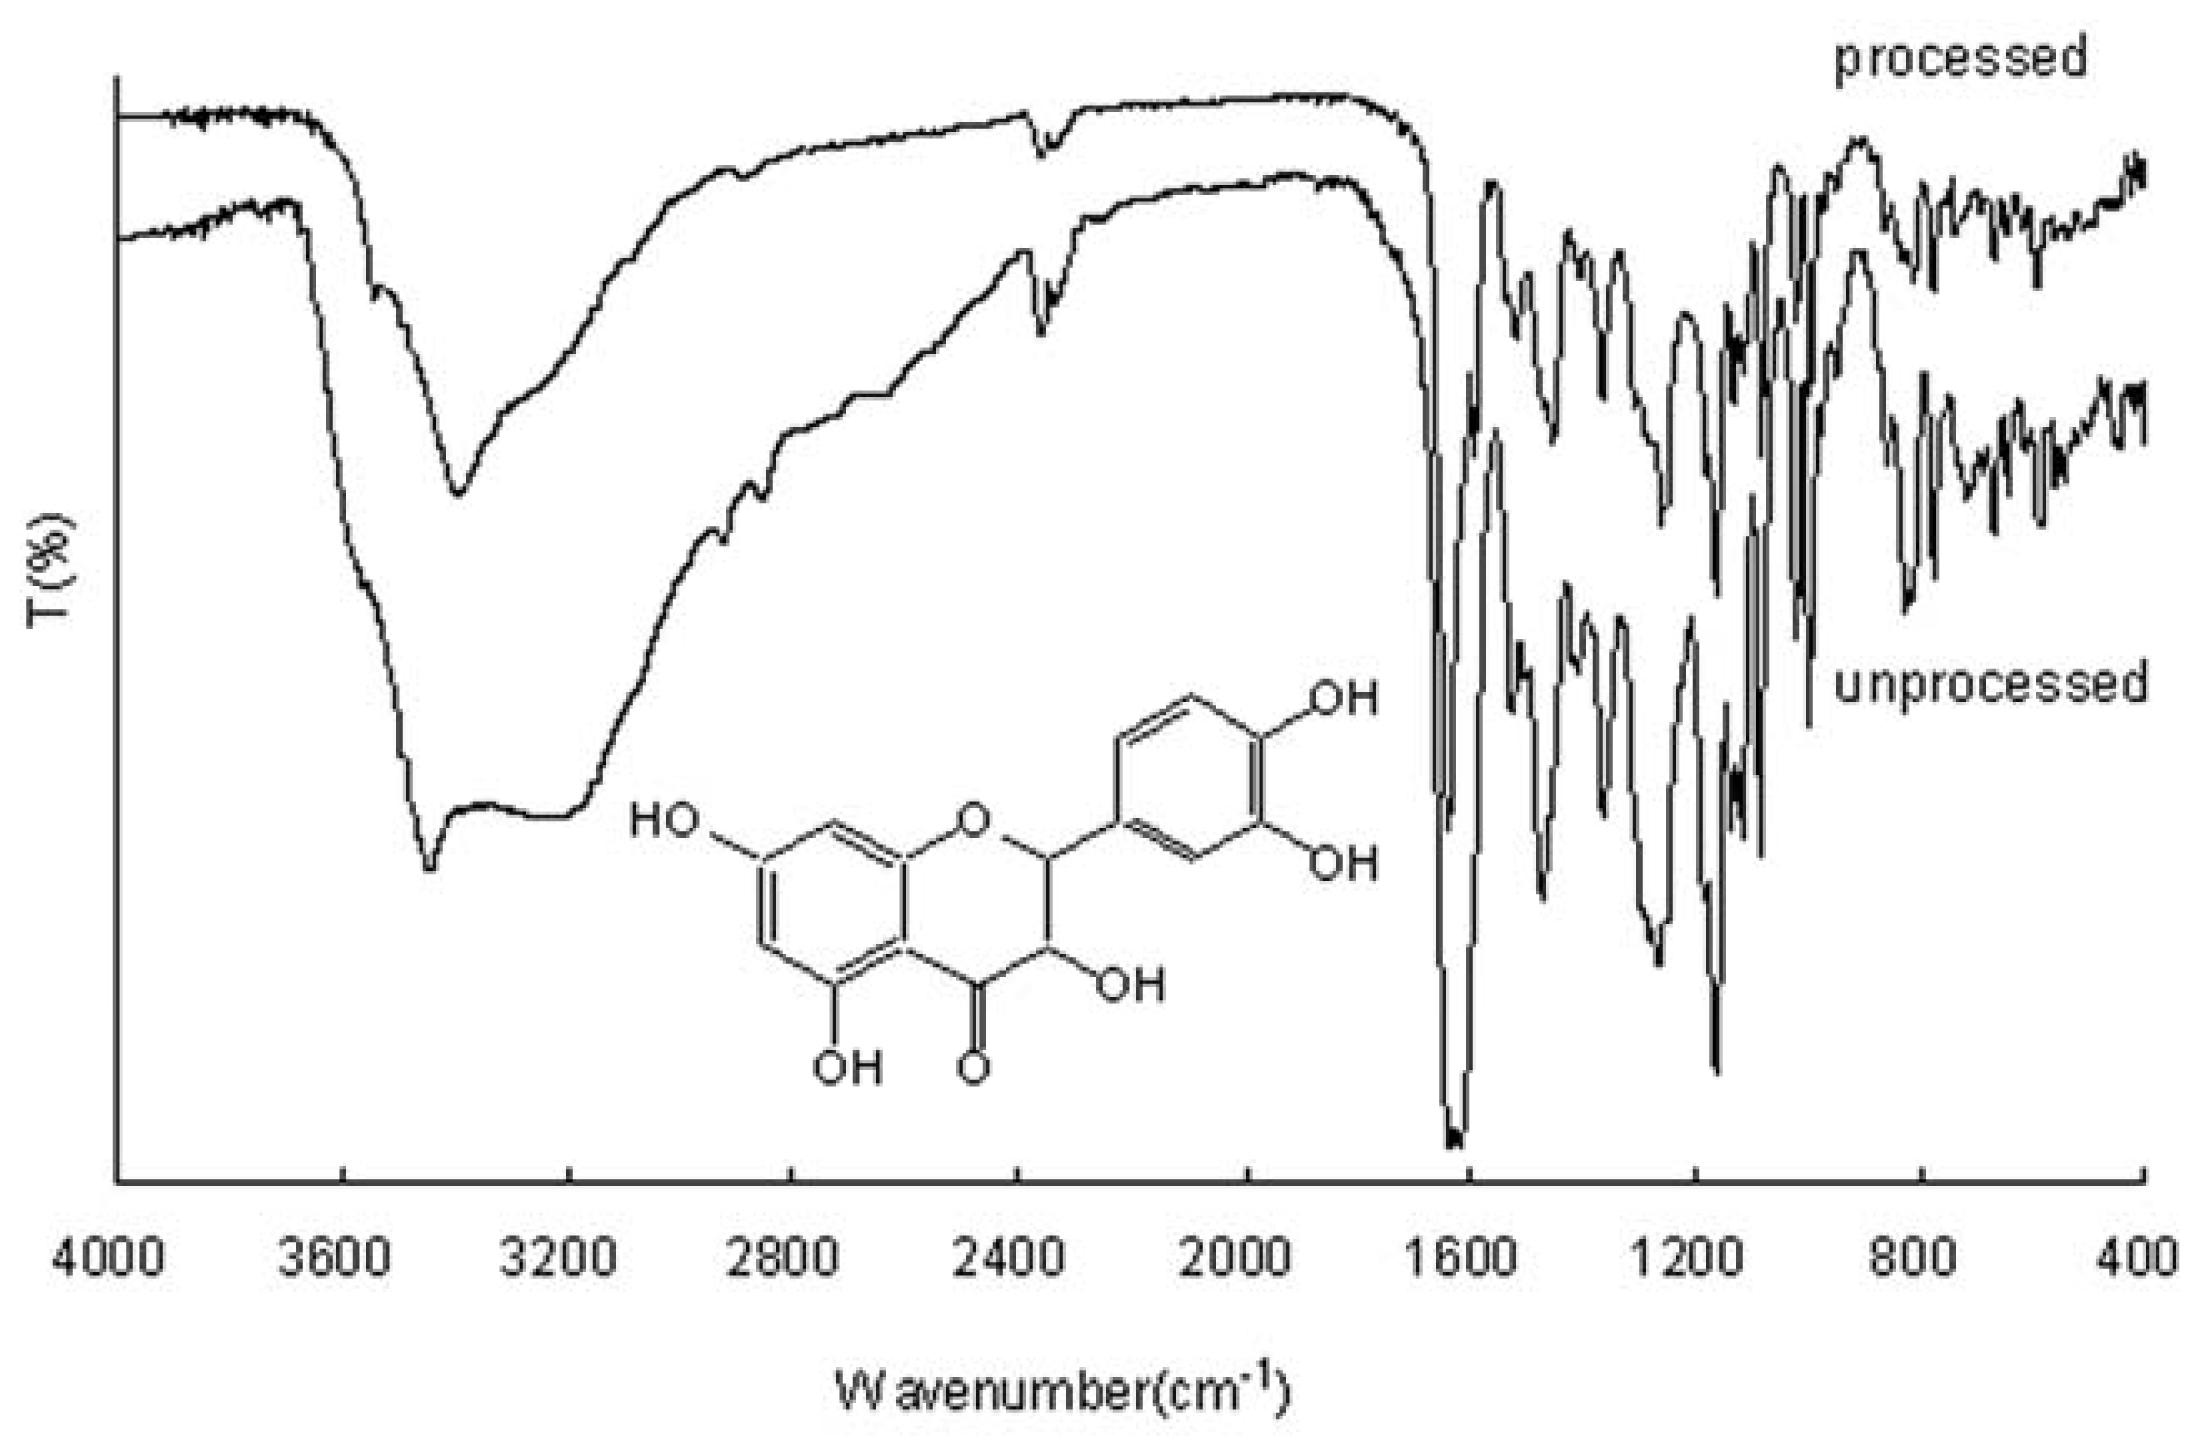
2.2. FTIR Analysis
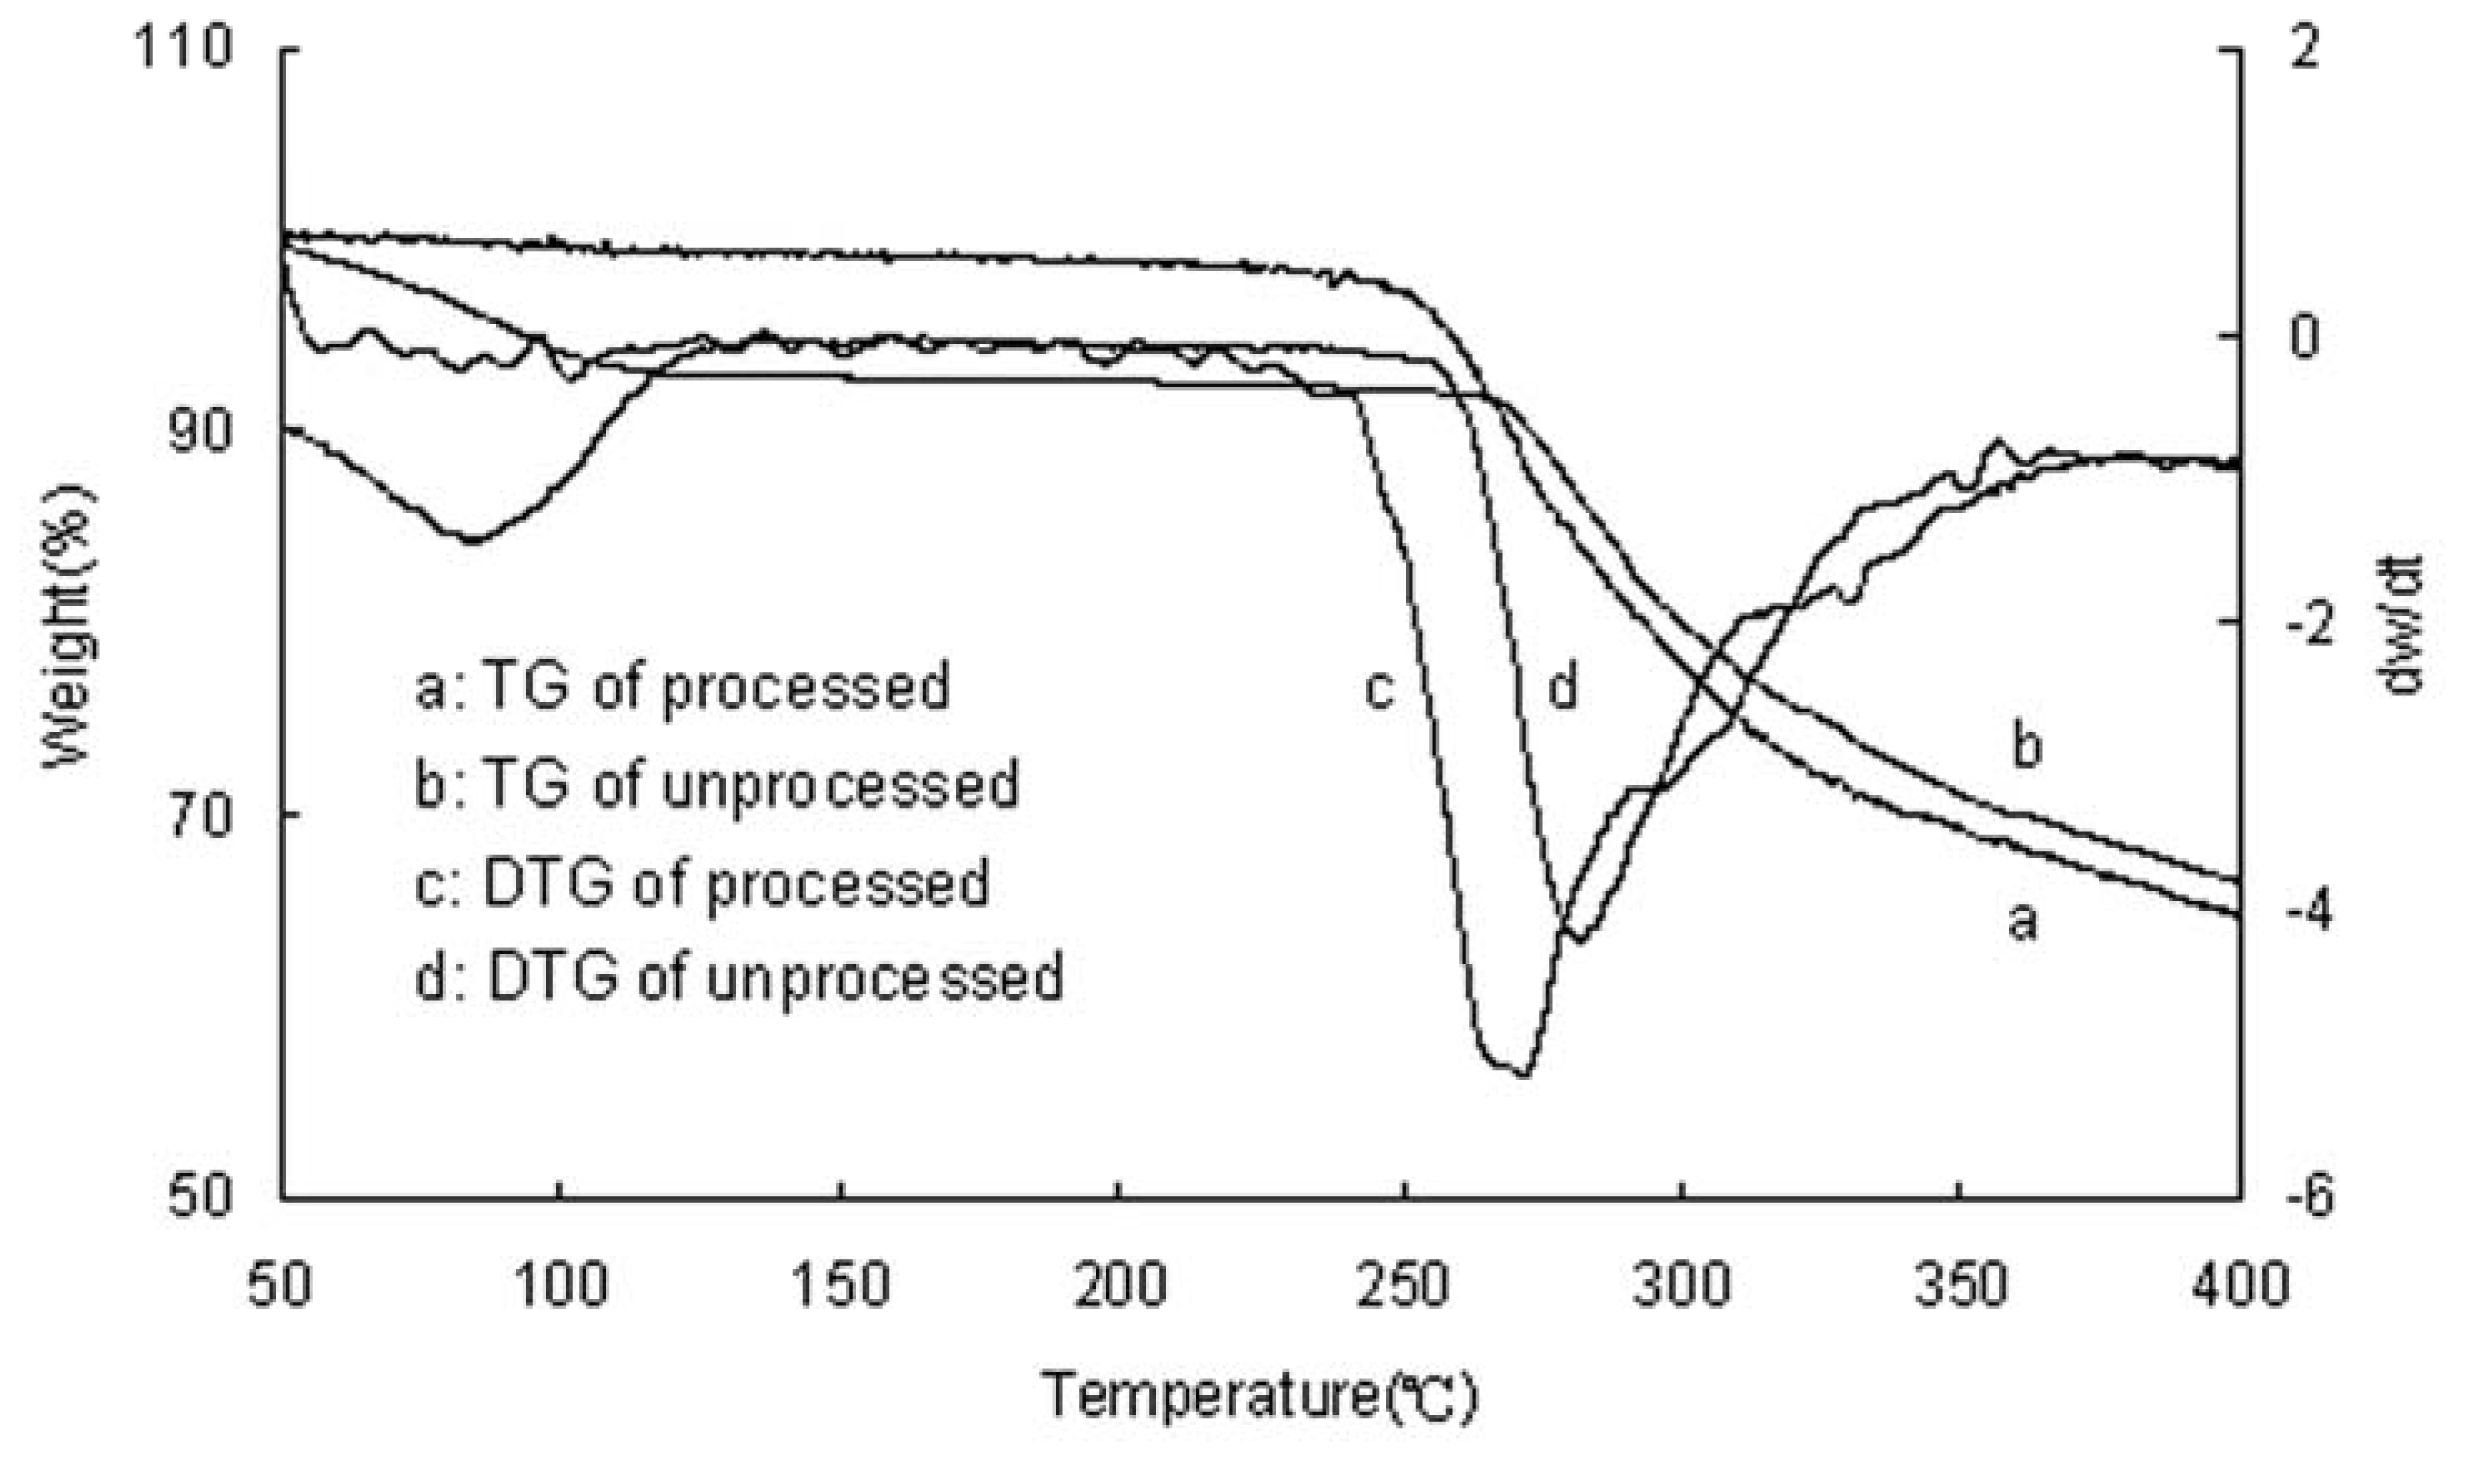
2.3. TG Analysis
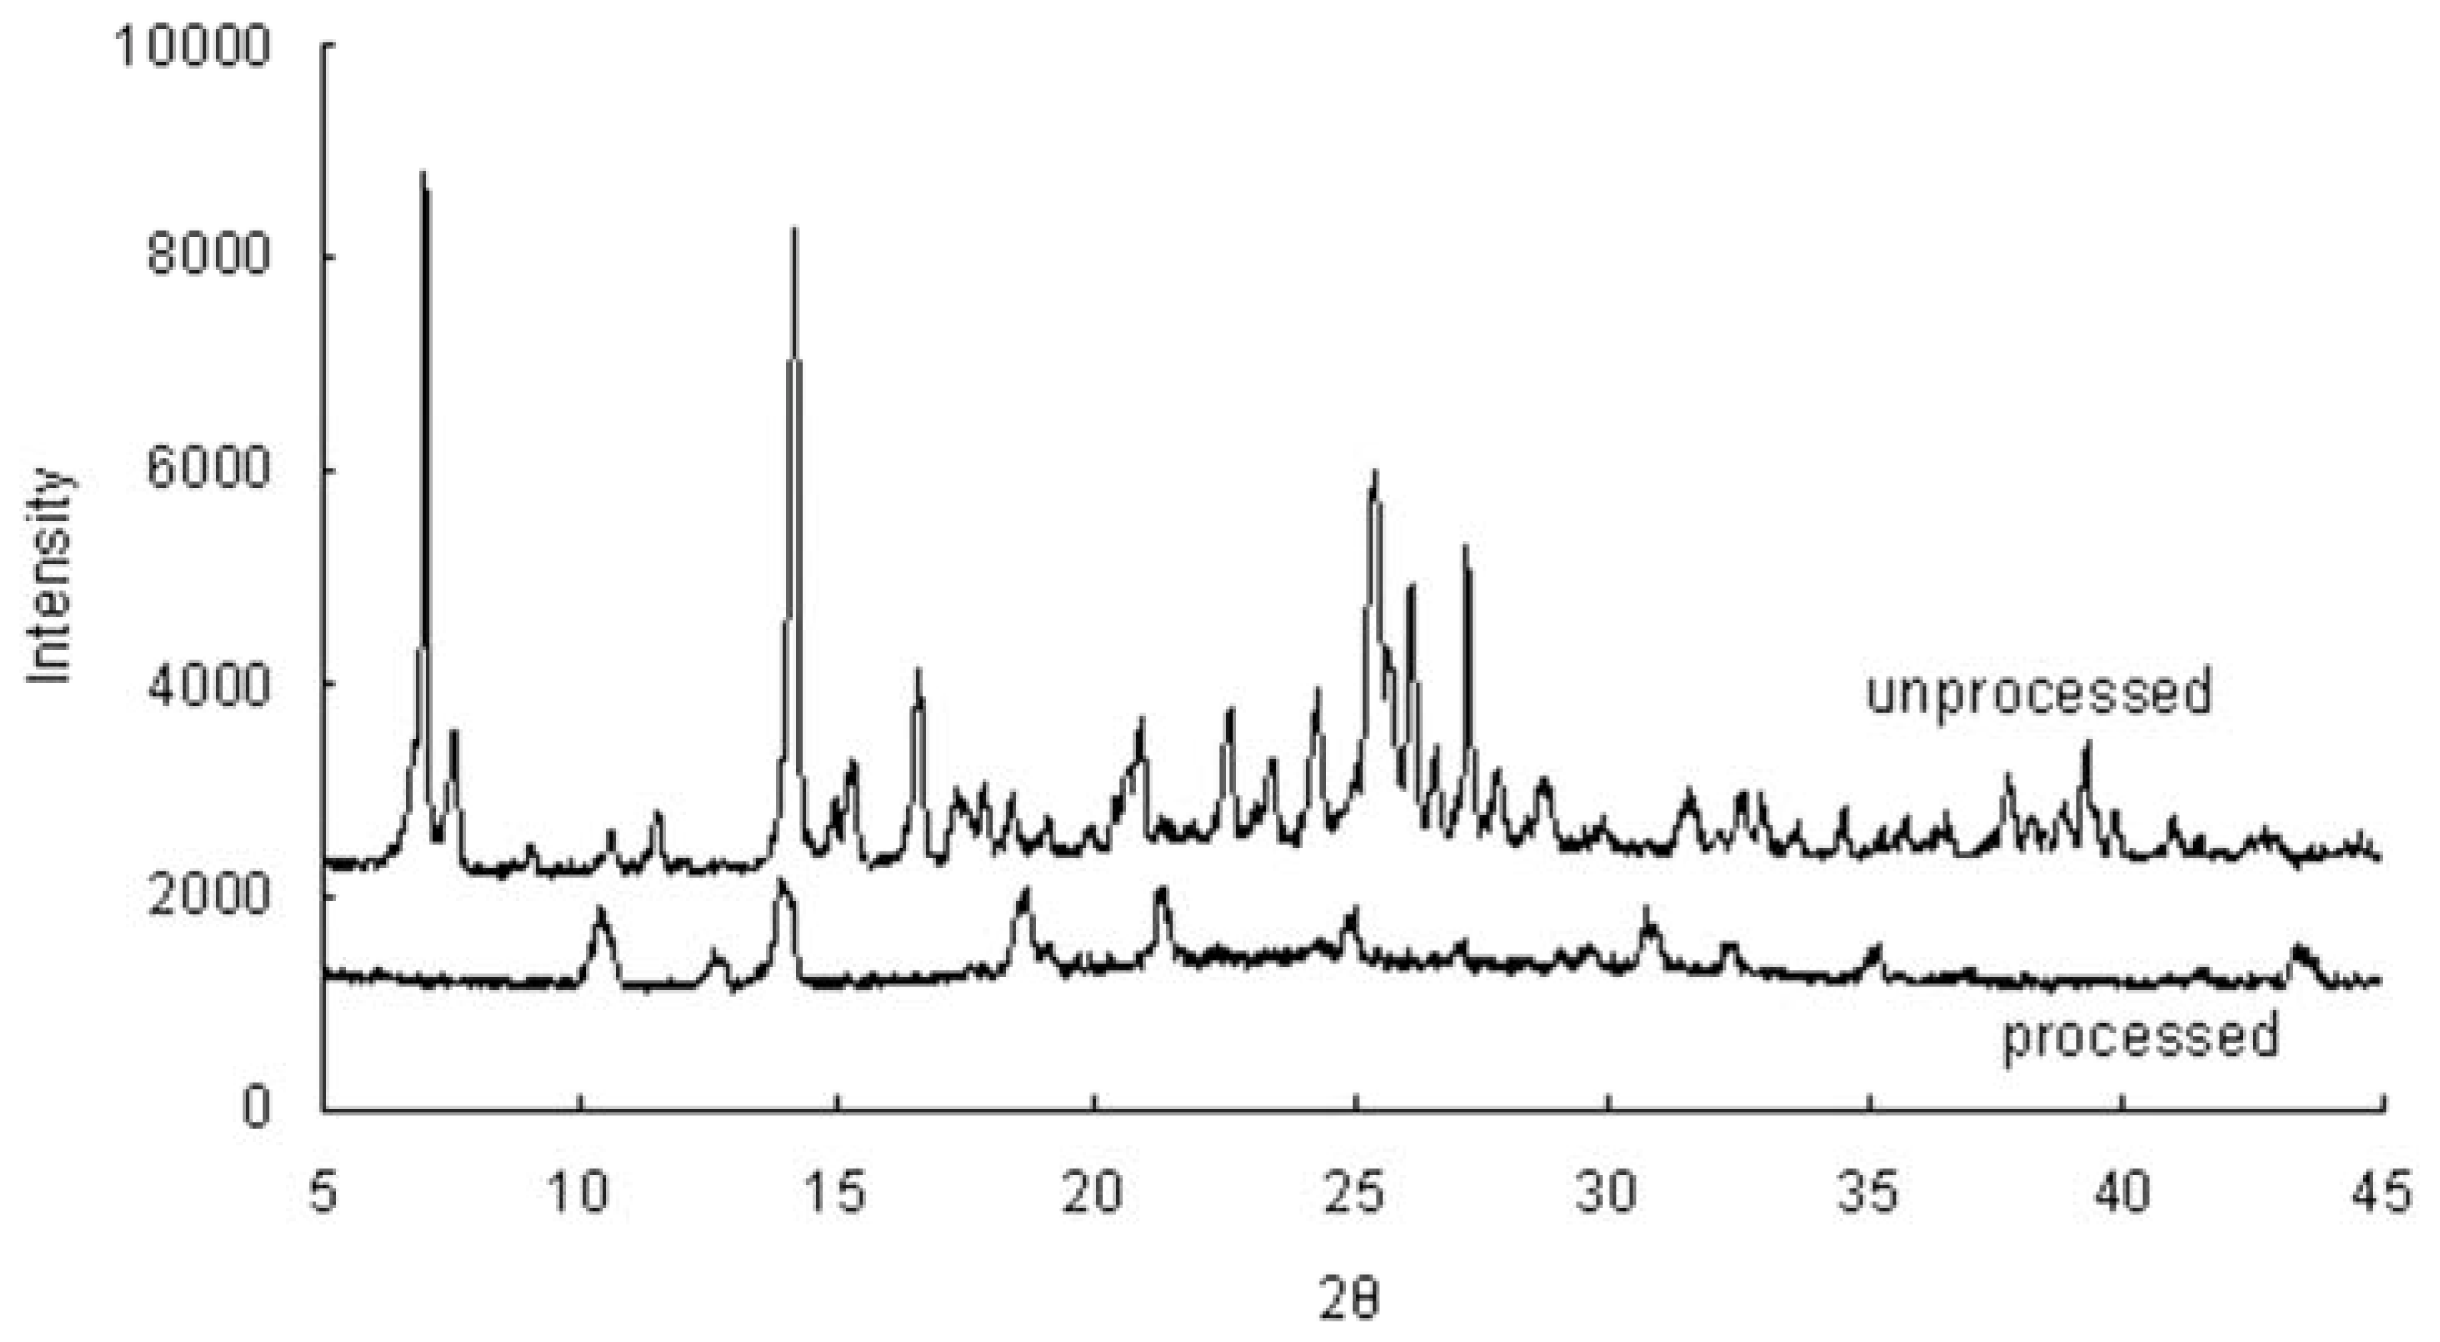
2.4. Powder X-ray Diffraction (XRD)
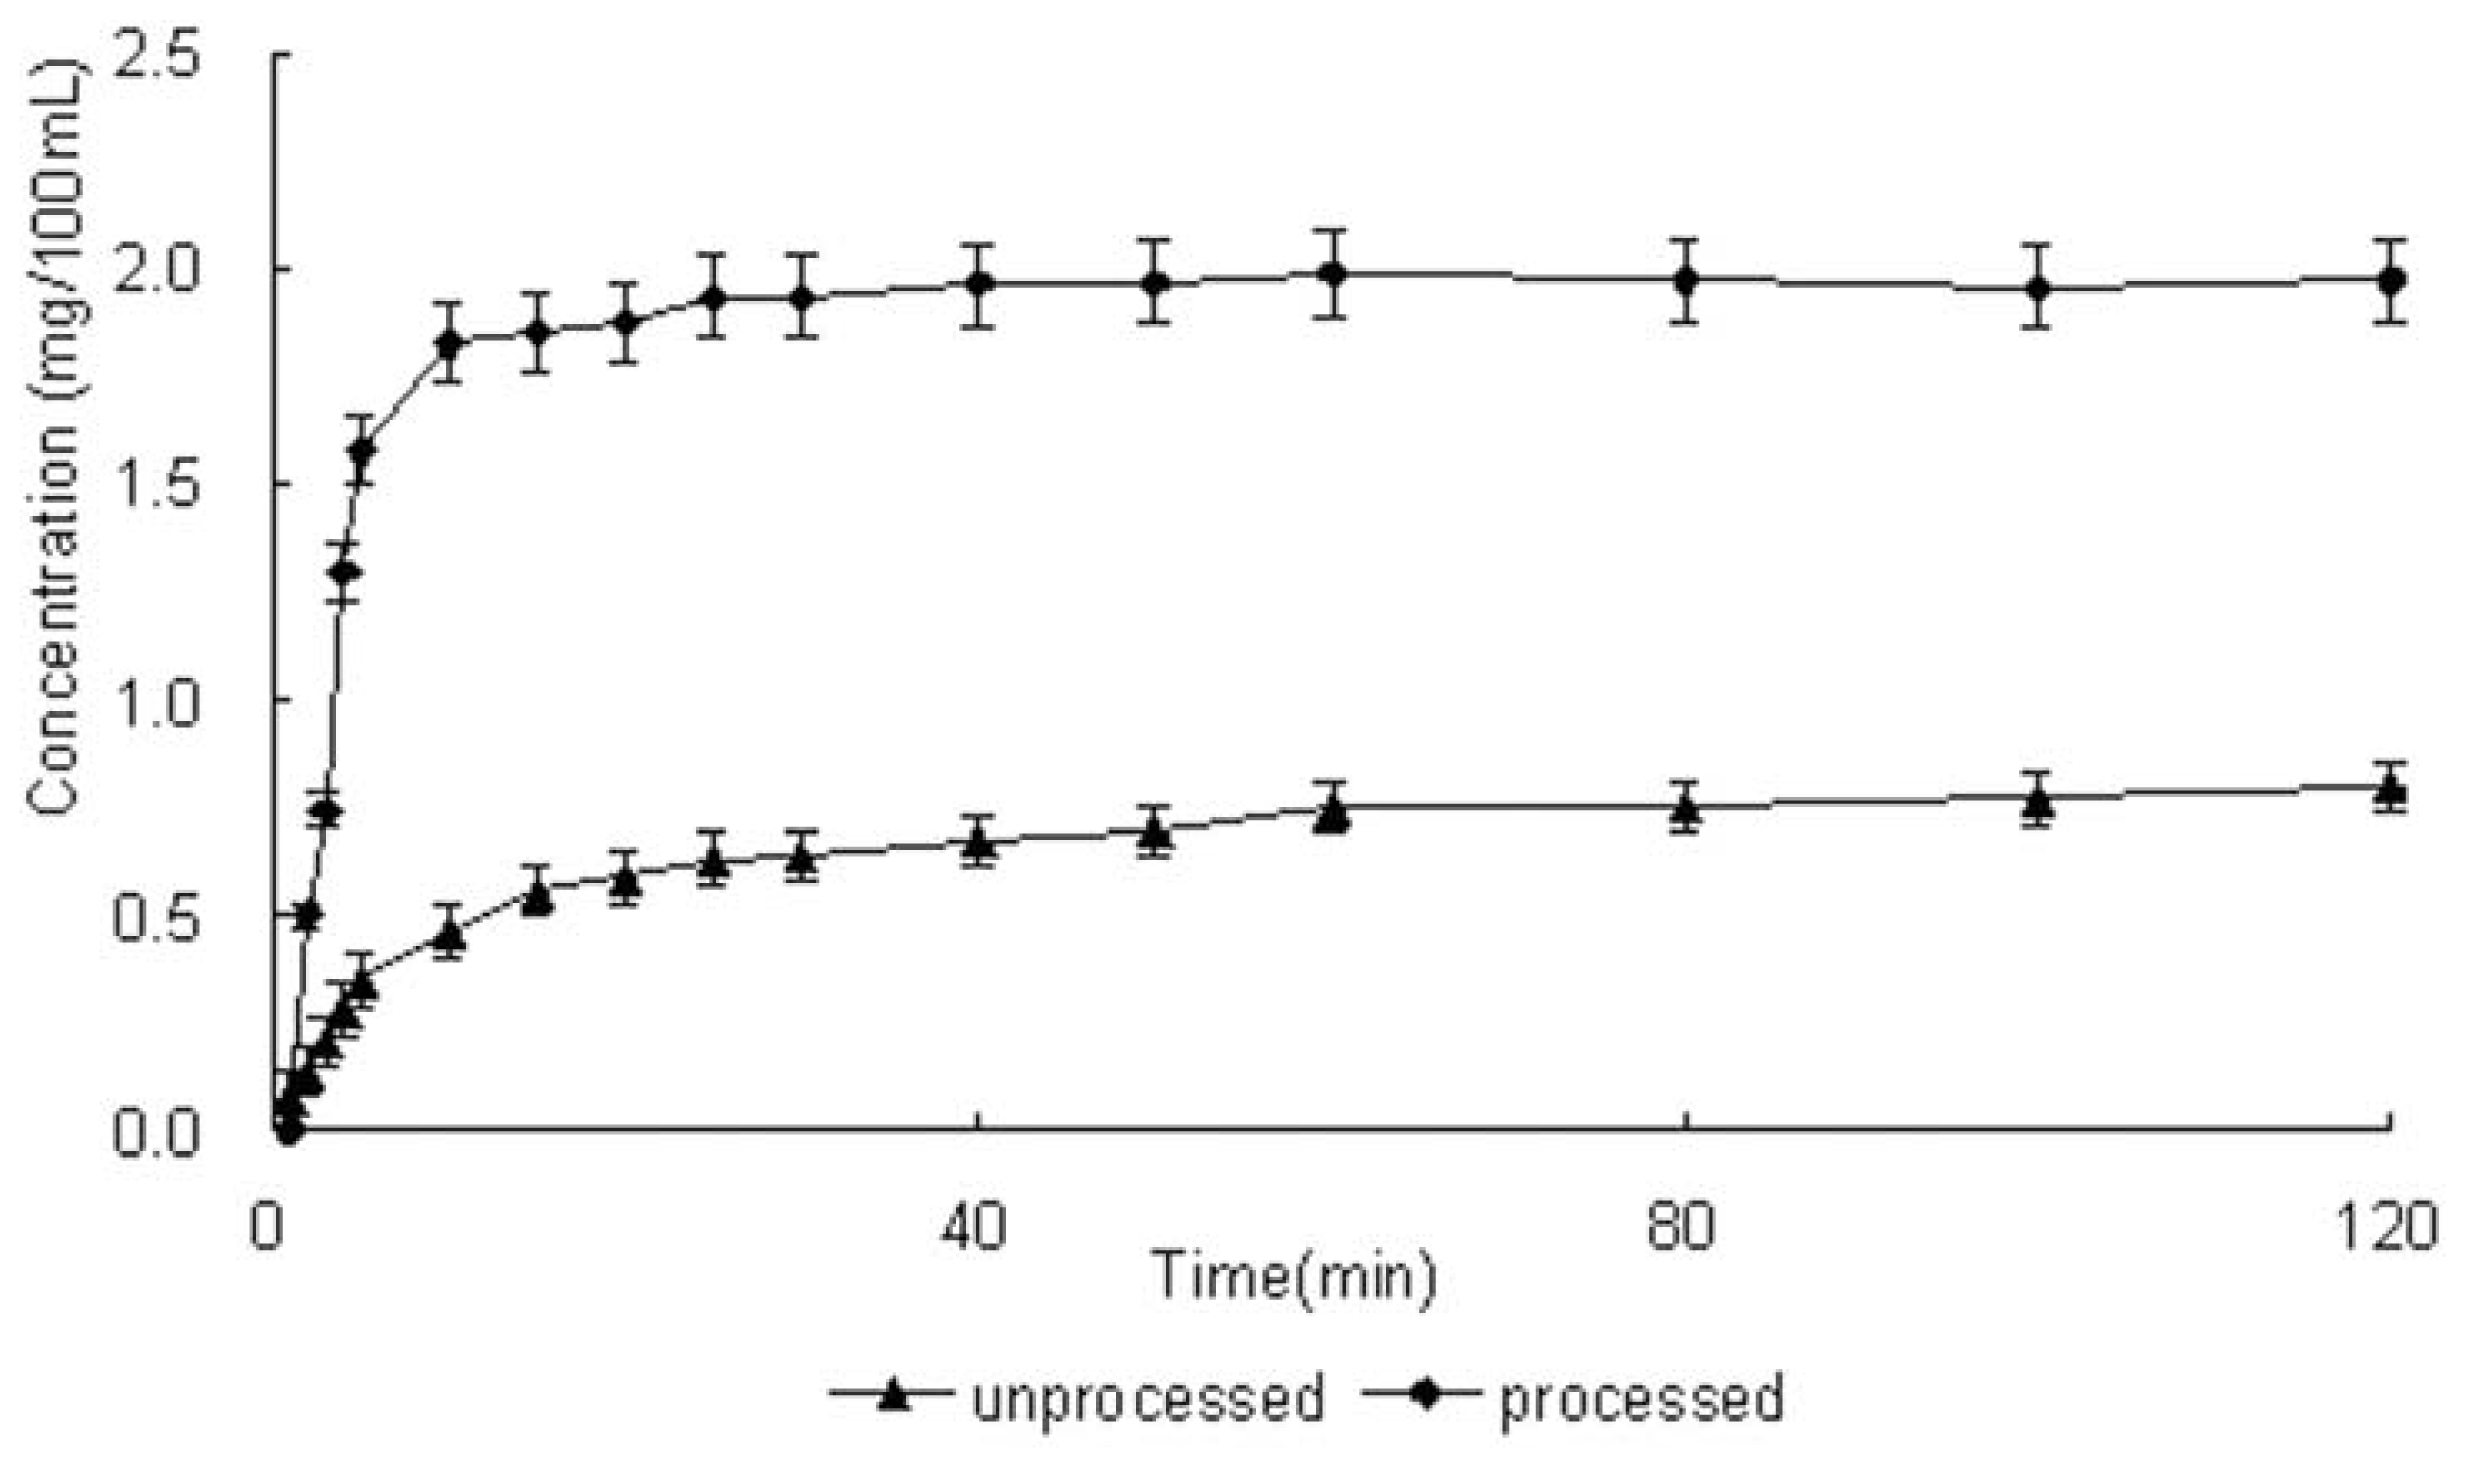
2.5. Solubility and Dissolution Rate
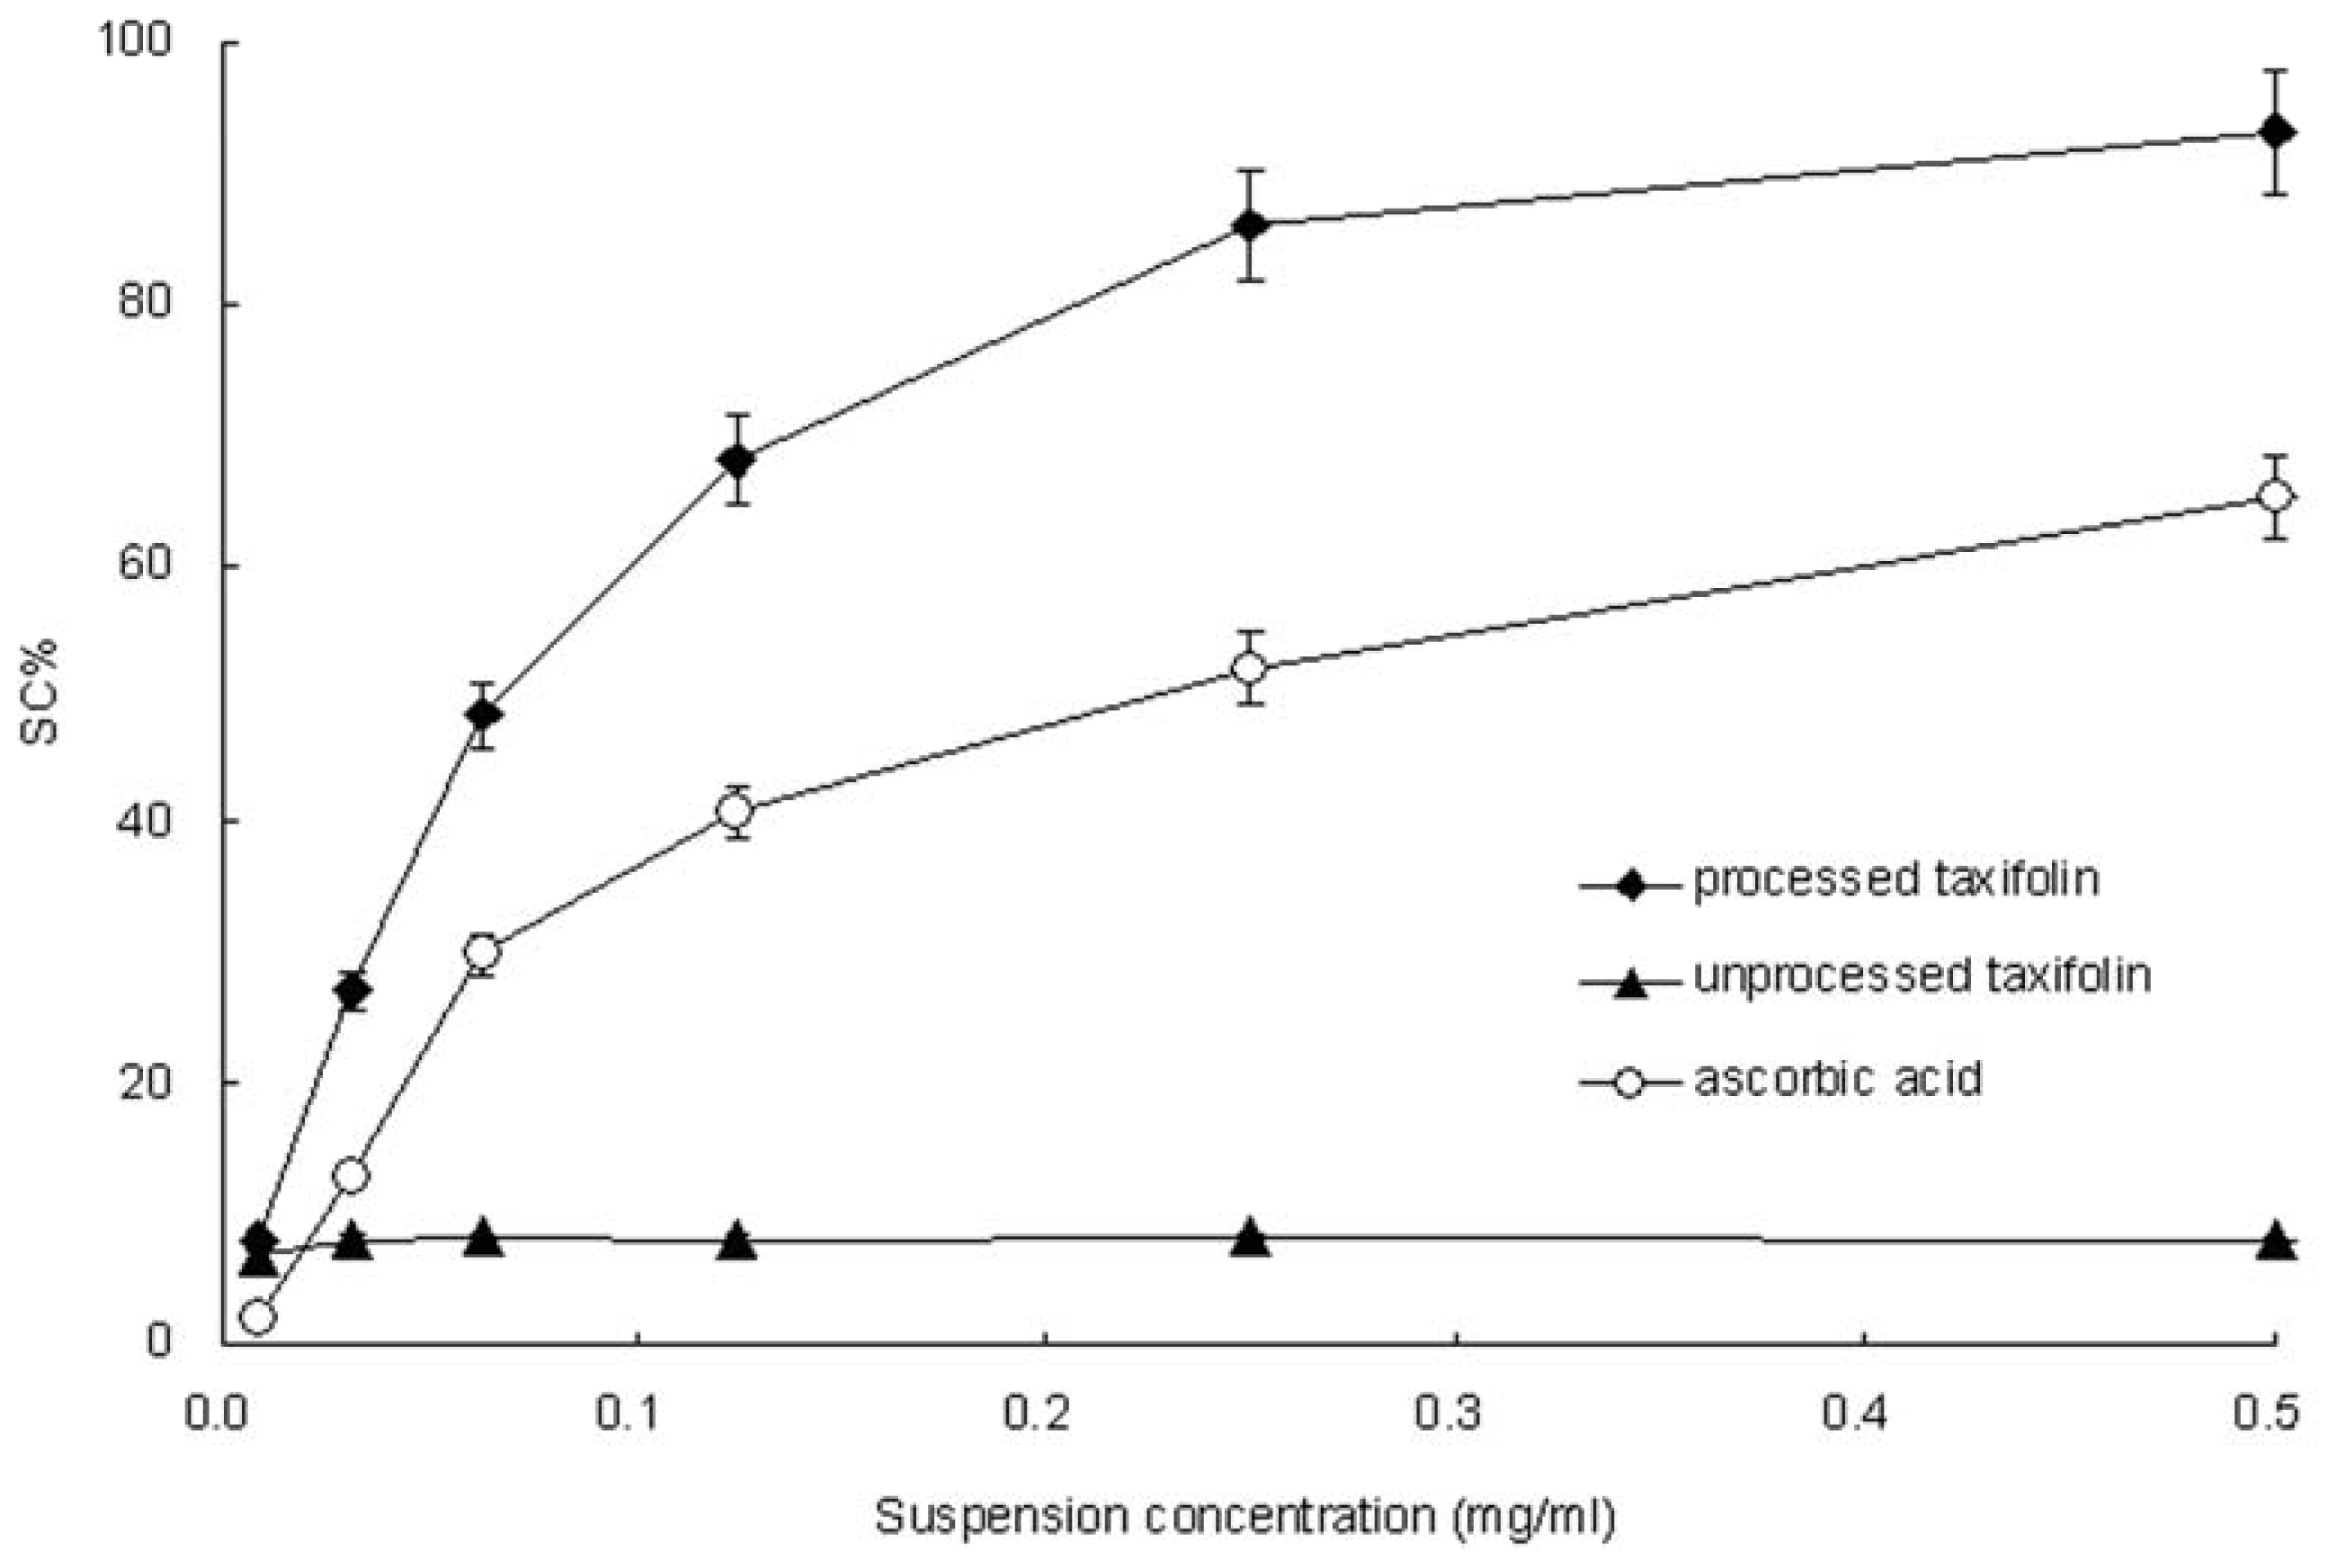
2.6. 2,2-Diphenyl-1-picrylhydrazyl (DPPH) Radical-Scavenging Activity
3. Experimental Section
3.1. Materials
3.2. Preparation of Micronized Taxifolin Powder by SAS
3.3. Scanning Electron Microscopy (SEM)
3.4. Fourier Transforms Infrared Spectroscopy (FTIR)
3.5. Thermal Gravimetric Analysis (TG)
3.6. X-ray Powder Diffraction (XRD)
3.7. BET Specific Surface Area Measurement
3.8. Dissolution Test
3.9. DPPH Assay
3.10. Statistical Analysis
4. Conclusions
Acknowledgments
References
- Wang, Y.; Zu, Y.; Long, J.; Fu, Y.; Li, S.; Zhang, D.; Li, J.; Wink, M.; Efferth, T. Enzymatic water extraction of taxifolin from wood sawdust of Larix gmelini (Rupr.) Rupr. and evaluation of its antioxidant activity. Food Chem 2011, 126, 1178–1185. [Google Scholar]
- Yang, L.; Sun, X.; Yang, F.; Zhao, C.; Zhang, L.; Zu, Y. Application of ionic liquids in the microwave-assisted extraction of proanthocyanidins from Larix gmelinii bark. Int. J. Mol. Sci 2012, 13, 5163–5178. [Google Scholar]
- Teselkin, Y.O.; Babenkova, I.V.; Kolhir, V.K.; Baginskaya, A.I.; Tjukavkina, N.A.; Kolesnik, Y.A.; Selivanova, I.A.; Eichholz, A.A. Dihydroquercetin as a means of antioxidative defence in rats with tetrachloromethane hepatitis. Phytother. Res 2000, 14, 160–162. [Google Scholar]
- Trouillas, P.; Fagnère, C.; Lazzaroni, R.; Calliste, C.; Marfak, A.; Duroux, J. A theoretical study of the conformational behavior and electronic structure of taxifolin correlated with the free radical-scavenging activity. Food Chem 2004, 88, 571–582. [Google Scholar]
- Theriault, A.; Wang, Q.; Iderstine, S.C.V.; Chen, B.; Franke, A.A.; Adeli, K. Modulation of hepatic lipoprotein synthesis and secretion by taxifolin, a plant flavonoid. J. Lipid Res 2000, 41, 1969–1979. [Google Scholar]
- Wang, Y.; Wang, W.; Chang, C.; Liou, K.; Sung, Y.; Liao, J.; Chen, C.; Chang, S.; Hou, Y.; Chou, Y.; Shen, Y. Taxifolin ameliorates cerebral ischemia-reperfusion injury in rats through its anti-oxidative effect and modulation of NF-kappa B activation. J. Biomed. Sci 2006, 13, 127–141. [Google Scholar]
- Tarahovsky, Y.S.; Selezneva, I.I.; Vasilieva, N.A.; Egorochkin, M.A.; Kim, Y.A. Acceleration of fibril formation and thermal stabilization of collagen fibrils in the presence of taxifolin (dihydroquercetin). Bull. Exp. Biol. Med 2007, 144, 791–794. [Google Scholar]
- Shikov, A.N.; Pozharitskaya, O.N.; Miroshnyk, I.; Mirza, S.; Urakova, I.N.; Hirsjärvi, S.; Makarov, V.G.; Heinämäki, J.; Yliruusi, J.; Hiltunen, R. Nanodispersions of taxifolin: Impact of solid-state properties on dissolution behavior. Int. J. Pharm 2009, 377, 148–152. [Google Scholar]
- Vemavarapu, C.; Mollan, M.J.; Lodaya, M.; Needhamb, T.E. Design and process aspects of laboratory scale SCF particle formation systems. Int. J. Pharm 2005, 292, 1–16. [Google Scholar]
- Beckman, E.J. Supercritical and near-critical CO2 in green chemical synthesis and processing. J. Supercrit. Fluid 2004, 28, 121–191. [Google Scholar]
- Lee, J.Y.; Song, C.H.; Kim, J.I.; Kim, J.H. Preparation of aromatic polycarbonate nanoparticles using supercritical carbon dioxide. J. Nanopart. Res 2002, 4, 53–59. [Google Scholar]
- Kwon, S.; Lee, K.; Bae, W.; Kim, H. Synthesis of a biocompatible polymer using siloxane-based surfactants in supercritical carbon dioxide. J. Supercrit. Fluid 2008, 45, 391–399. [Google Scholar]
- Park, H.J.; Kim, M.; Lee, S.; Kim, J.; Woo, J.; Hwang, S. Recrystallization of fuconazole using the supercritical antisolvent (SAS) process. Int. J. Pharm 2007, 328, 152–160. [Google Scholar]
- Su, C.; Chen, Y. Recrystallization of salicylamide using a batch supercritical antisolvent process. Chem. Eng. Tech 2005, 28, 1177–1181. [Google Scholar]
- Pasquali, I.; Bettini, R.; Giordano, F. Solid-state chemistry and particle engineering with supercritical fluids in pharmaceutics. Eur. J. Pharm. Sci 2006, 27, 239–310. [Google Scholar]
- Yang, L.; Sun, Z.; Zu, Y.; Zhao, C.; Sun, X.; Zhang, Z.; Zhang, L. Physicochemical properties and oral bioavailability of ursolic acid nanoparticles using supercritical anti-solvent (SAS) process. Food Chem 2012, 132, 319–325. [Google Scholar]
- Sui, X.; Wei, W.; Yang, L.; Zu, Y.; Zhao, C.; Zhang, L.; Yang, F.; Zhang, Z. Preparation, characterization and in vivo assessment of the bioavailability of glycyrrhizic acid microparticles by supercritical anti-solvent process. Int. J. Pharm 2012, 423, 471–479. [Google Scholar]
- To, D.; Sundaresan, S.; Dave, R. Nanoparticle mixing through rapid expansion of high pressure and supercritical suspensions. J. Nanopart. Res 2011, 13, 4253–4266. [Google Scholar]
- Yeo, S.D.; Kim, M.S.; Lee, J.C. Recrystallization of sulfathiazole and chlorpropamide using the supercritical fluid anti-solvent process. J. Supercrit. Fluid 2003, 25, 143–154. [Google Scholar]
- Budich, M.; Brunner, G. Supercritical fluid extraction of ethanol from aqueous solutions. J. Supercrit. Fluid 2003, 25, 45–55. [Google Scholar]
- Turner, C.; King, J.W.; Mathiasson, L. Supercritical fluid extraction and chromatography for fat-soluble vitamin analysis. J. Chromatogr. A 2001, 936, 215–237. [Google Scholar]
- Fages, J.; Lochard, H.; Letourneau, J.; Sauceau, M.; Rodier, E. Particle generation for pharmaceutical applications using supercritical fluid technology. Powder Technol 2004, 141, 219–226. [Google Scholar]
- Cocero, M.J.; Ferrero, S. Crystallization of β-carotene by a GAS process in batch: Effect of operating conditions. J. Supercrit. Fluid 2002, 22, 237–245. [Google Scholar]
- Muller, M.; Meier, U.; Kessler, A.; Mazzotti, M. Experimental study of the effect of process parameters in the recrystallization of an organic compound using compressed carbon dioxide as antisolvent. Ind. Eng. Chem. Res 2000, 39, 2260–2268. [Google Scholar]
- Reverchon, E.; Marco, I.D.; Porta, G.D. Tailoring of nano- and micro-particles of some superconductor precursors by supercritical antisolvent precipitation. J. Supercrit. Fluid 2002, 23, 81–87. [Google Scholar]
- Pathak, P.; Meziani, M.J.; Desai, T.; Sun, Y.P. Nanosizing drug particles in supercritical fluid processing. J. Am. Chem. Soc 2004, 126, 10842–10843. [Google Scholar]
- Chen, A.; Li, Y. Application of organic nonsolvent in the process of solution-enhanced dispersion by supercritical CO2 to prepare puerarin fine particles. J. Supercrit. Fluid 2009, 49, 394–402. [Google Scholar]
- Barato, M.C.; Tattini, M.; Galardi, C.; Pinelli, P.; Romani, A.; Visioli, F.; Basosi, R.; Pogni, R. Antioxidant activity of galloyl quinic derivatives isolated from P. lentiscus leaves. Free Radic. Res 2003, 37, 405–412. [Google Scholar]
- Liu, X.; Jia, J.; Yang, L.; Yang, F.; Ge, H.; Zhao, C.; Zhang, L.; Zu, Y. Evaluation of antioxidant activities of aqueous extracts and fractionation from different parts of Elsholtzia ciliate. Molecules 2012, 17, 5430–5441. [Google Scholar]
- Yang, L.; Huang, J.; Zu, Y.; Ma, C.; Wang, H.; Sun, X.; Sun, Z. Preparation and radical scavenging activities of polymeric procyanidins nanoparticles by a supercritical antisolvent (SAS) process. Food Chem 2011, 128, 1152–1159. [Google Scholar]
- Lu, Q.; Liu, W.; Yang, L.; Zu, Y.; Zu, B.; Zhu, M.; Zhang, Y.; Zhang, X.; Zhang, R.; Sun, Z.; Huang, J.; Zhang, X.; Li, W. Investigation of the effects of different organosolv pulping methods on antioxidant capacity and extraction efficiency of lignin. Food Chem 2012, 131, 313–317. [Google Scholar]


| Run | Pressure MPa | Temperature °C | Concentration mg/mL | Flow rate mL/min | Length μm | Width μm | Morphology |
|---|---|---|---|---|---|---|---|
| 1 | 20 | 35 | 10 | 4 | 5–30 | 1.2–3.6 | Needle-like |
| 2 | 20 | 45 | 10 | 4 | 20–100 | 2.0–3.4 | Needle-like |
| 3 | 20 | 55 | 10 | 4 | 30–150 | 20.-3.6 | Long needles |
| 4 | 20 | 65 | 10 | 4 | 40–200 | 1.4–4.4 | Long needles |
| 5 | 10 | 35 | 10 | 4 | 10–300 | 2.5–3.2 | Long needles |
| 6 | 15 | 35 | 10 | 4 | 10–100 | 1.6–2.7 | Needle-like |
| 7 | 25 | 35 | 10 | 4 | 2–10 | 0.7–1.2 | Needle-like |
| 8 | 25 | 35 | 10 | 3 | 5–9 | 1.2–1.6 | Needle-like |
| 9 | 25 | 35 | 10 | 5 | 6–10 | 1.2–1.5 | Needle-like |
| 10 | 25 | 35 | 10 | 6 | 9–11 | 1.1–1.3 | Needle-like |
| 11 | 25 | 35 | 5 | 3 | 2–11 | 1.1–1.2 | Needle-like |
| 12 | 25 | 35 | 15 | 3 | 13–18 | 1.4–2.6 | Rod-like shape |
| 13 | 25 | 35 | 20 | 3 | 24–29 | 2.4–4.6 | Long rod-like shape |
© 2012 by the authors; licensee Molecular Diversity Preservation International, Basel, Switzerland. This article is an open-access article distributed under the terms and conditions of the Creative Commons Attribution license (http://creativecommons.org/licenses/by/3.0/).
Share and Cite
Zu, S.; Yang, L.; Huang, J.; Ma, C.; Wang, W.; Zhao, C.; Zu, Y. Micronization of Taxifolin by Supercritical Antisolvent Process and Evaluation of Radical Scavenging Activity. Int. J. Mol. Sci. 2012, 13, 8869-8881. https://doi.org/10.3390/ijms13078869
Zu S, Yang L, Huang J, Ma C, Wang W, Zhao C, Zu Y. Micronization of Taxifolin by Supercritical Antisolvent Process and Evaluation of Radical Scavenging Activity. International Journal of Molecular Sciences. 2012; 13(7):8869-8881. https://doi.org/10.3390/ijms13078869
Chicago/Turabian StyleZu, Shuchong, Lei Yang, Jinming Huang, Chunhui Ma, Wenjie Wang, Chunjian Zhao, and Yuangang Zu. 2012. "Micronization of Taxifolin by Supercritical Antisolvent Process and Evaluation of Radical Scavenging Activity" International Journal of Molecular Sciences 13, no. 7: 8869-8881. https://doi.org/10.3390/ijms13078869