Next Article in Journal
Nitric Oxide Synthesis Is Increased in Cybrid Cells with m.3243A>G Mutation
Next Article in Special Issue
Recent Insights and Novel Bioinformatics Tools to Understand the Role of MicroRNAs Binding to 5' Untranslated Region
Previous Article in Journal
The Dynamics of Embolism Refilling in Abscisic Acid (ABA)-Deficient Tomato Plants
Previous Article in Special Issue
Expression and Functional Studies on the Noncoding RNA, PRINS
 
 
Correction published on 3 May 2013, see Int. J. Mol. Sci. 2013, 14(5), 9685.
Article

Exploration of the Role of the Non-Coding RNA SbrE in L. monocytogenes Stress Response

1
Department of Food Science, Cornell University, Ithaca, NY 14853, USA
2
Department of Food Science, Purdue University, West Lafayette, IN 47907, USA
*
Author to whom correspondence should be addressed.
Int. J. Mol. Sci. 2013, 14(1), 378-393; https://doi.org/10.3390/ijms14010378
Submission received: 5 November 2012 / Revised: 11 December 2012 / Accepted: 14 December 2012 / Published: 24 December 2012
(This article belongs to the Special Issue Non-Coding RNAs 2012)

Abstract

:
SbrE is a ncRNA in Listeria monocytogenes, reported to be up-regulated by the alternative sigma factor σB. Initial quantitative RT-PCR (qRT-PCR) experiments on parent strains and isogenic ΔsigB strains demonstrated σB-dependent expression of SbrE across the four L. monocytogenes lineages and in L. innocua. Microarray and proteomics (MDLC/MS/MS with iTRAQ labeling) experiments with the L. monocytogenes parent strain and an isogenic ΔsbrE strain identified a single gene (lmo0636) and two proteins (Lmo0637 and Lmo2094) that showed lower expression levels in the ΔsbrE strain. qRT-PCR demonstrated an increase in SbrE transcript levels in stationary phase L. monocytogenes and in bacteria exposed to oxidative stress (mean log2 transcript levels 7.68 ± 0.57 and 1.70 ± 0.71 greater than in mid-log phase cells, respectively). However, no significant differences in growth or survival between the parent strain and ΔsbrE strain were confirmed under a variety of environmental stress conditions tested. Our data suggest that σB-dependent transcription of SbrE represents a conserved mechanism that contributes, across Listeria species, to fine-tuning of gene expression under specific environmental conditions that remain to be defined.

1. Introduction

Listeria monocytogenes is a Gram-positive foodborne pathogen that causes listeriosis, a life threatening invasive illness in humans and animals [1]. L. monocytogenes is ubiquitous in the environment and has the ability to adapt to harsh and stressful conditions. For instance, the bacterium is able to grow at refrigeration temperatures and can survive high salt concentrations as well as acidic conditions [25]. This ability to adapt to harsh and stressful conditions facilitates L. monocytogenes survival under environmental, food, and host associated stress conditions. A complex transcriptional response network consisting of various signaling pathways and transcriptional regulators, including alternative sigma factors and non-coding RNAs (ncRNAs), supports the ability of L. monocytogenes to respond to and survive under a wide range of stress conditions [614].
ncRNAs have been shown to be involved in a variety of regulatory functions in bacteria, including regulation of bacterial response to stress and virulence related functions, through transcriptional, translational, and post-transcriptional regulation of gene expression [1527]. In L. monocytogenes, more than 100 ncRNAs have been identified to date, including ncRNAs involved in virulence and stress response [7,11,14,2834]. The alternative sigma factor Sigma B (σB) is estimated to regulate transcription of 100 to 200 L. monocytogenes genes and contributes critically to the ability of this pathogen to survive stressful conditions encountered inside and outside the host [7,8,1113]. σB is involved in the transcriptional response of L. monocytogenes to a variety of stresses, including osmotic and acid stress, as well as the regulation of metabolism and virulence [6,8,13]. In vitro and/or in vivo studies indicate that σB also directly regulates at least four ncRNAs in L. monocytogenes[7,11,30,31], in addition to possibly regulating ncRNAs indirectly by affecting transcription of hfq, which encodes a protein (Hfq) that binds to and regulates ncRNAs [7,11,27,35]. One σB-dependent L. monocytogenes ncRNA is SbrE (also referred to as rli47), which was found to be highly transcribed in stationary phase cells using RNA-sequencing (RNA-Seq) [7]. A study using tiling arrays also found SbrE to be expressed at higher levels in stationary phase cells and in the intestinal lumen compared to exponential phase cells [11]. In addition, SbrE appears to be transcribed at higher levels in macrophages compared to exponential phase cells [36]. The 514 nucleotide sequence for SbrE is 96.6% conserved among 18 L. monocytogenes genomes, including EGD-e and F2365, and was found to be present in one L. innocua and one L. welshimeri genome [7]. In addition to identification of a putative σB-dependent promoter upstream of SbrE, SbrE has been reported to show σB-dependent transcript levels in L. monocytogenes strain 10403S [7] and EGD-e [11]. SbrE was also found to show σB-dependent transcript levels in exponential phase cells and in L. monocytogenes present in the intestinal lumen, but not in L. monocytogenes inoculated into human blood [11]. As the role of SbrE has not yet been defined, we employed transcriptomic, proteomic, and phenotypic approaches to characterize the role of SbrE in σB-dependent stress responses.

2. Results and Discussion

In this study, we demonstrate that (i) SbrE is σB-dependent across L. monocytogenes lineages and in the non-pathogenic species L. innocua, and SbrE transcript levels are induced in stationary phase and under oxidative stress; (ii) SbrE contributes to the expression of an operon composed of lmo0636 and lmo0637; (iii) contributions of SbrE to L. monocytogenes survival and growth under different stress conditions could not be identified, suggesting that SbrE may play a role in “fine-tuning of gene expression” in L. monocytogenes, which may only have phenotypic consequences under very specific growth conditions, as previously suggested for SbrA, another σB-dependent ncRNA in L. monocytogenes[30].

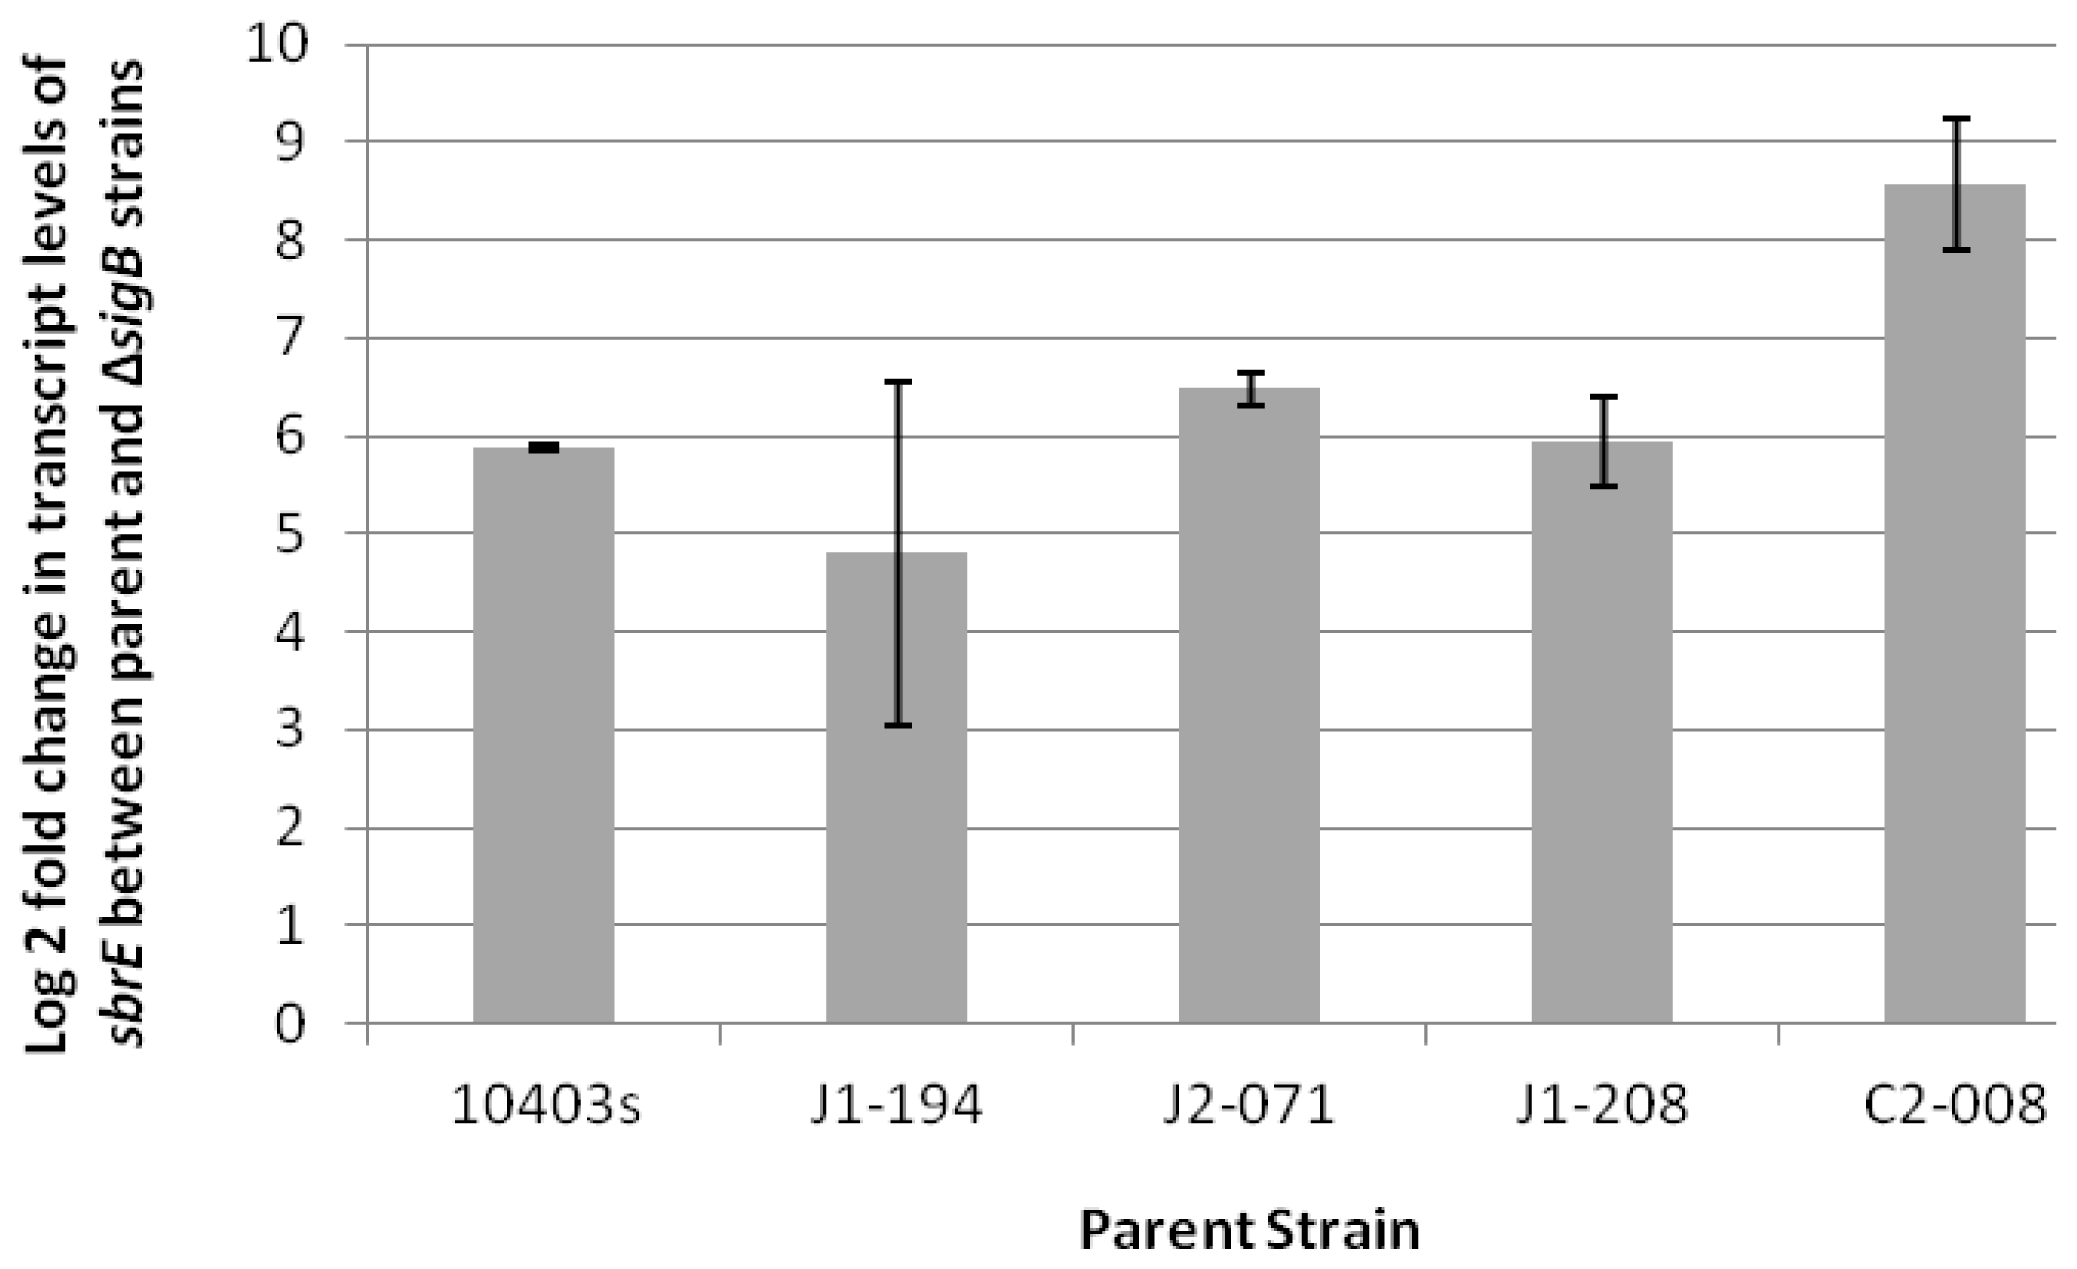
2.1. SbrE Is σB-Dependent Across L. monocytogenes Lineages and Induced in Stationary Phase and under Oxidative Stress

qRT-PCR showed that, in stationary phase bacteria, SbrE transcript levels were significantly higher in parent strains relative to their ΔsigB mutants in (i) four strains representing all four L. monocytogenes lineages and (ii) an L. innocua strain (4.8 ± 1.76 to 8.6 ± 0.67 higher log2 SbrE transcript in the parent strain) (Figure 1), supporting σB-dependent transcription of SbrE across L. monocytogenes lineages and in L. innocua. While these findings were not necessarily unexpected, they are still valuable as other studies have shown some diversification of the σB regulon and variation in σB-dependent regulation of conserved genes, among L. monocytogenes lineages and Listeria species [10,37]. qRT-PCR of SbrE transcripts in the L. monocytogenes strain 10403S showed higher transcript levels in early stationary phase cells (OD 1.0 + 3h) as compared to mid-log phase (OD 0.4) or late log phase (OD 1.0) cells, consistent with σB-dependent transcription of SbrE (as σB is induced in stationary phase cells) [7,11]. While SbrE transcript levels were not induced after exposure of mid-log phase cells to salt stress (Figure S1), they were induced after exposure to oxidative stress (13 mM cumene hydroperoxide [CHP]). SbrE transcript levels were 1.70 ± 0.71 log2 (absolute, non log-transformed fold change of approximately 3) higher in CHP treated cells, relative to mid-log phase cells.

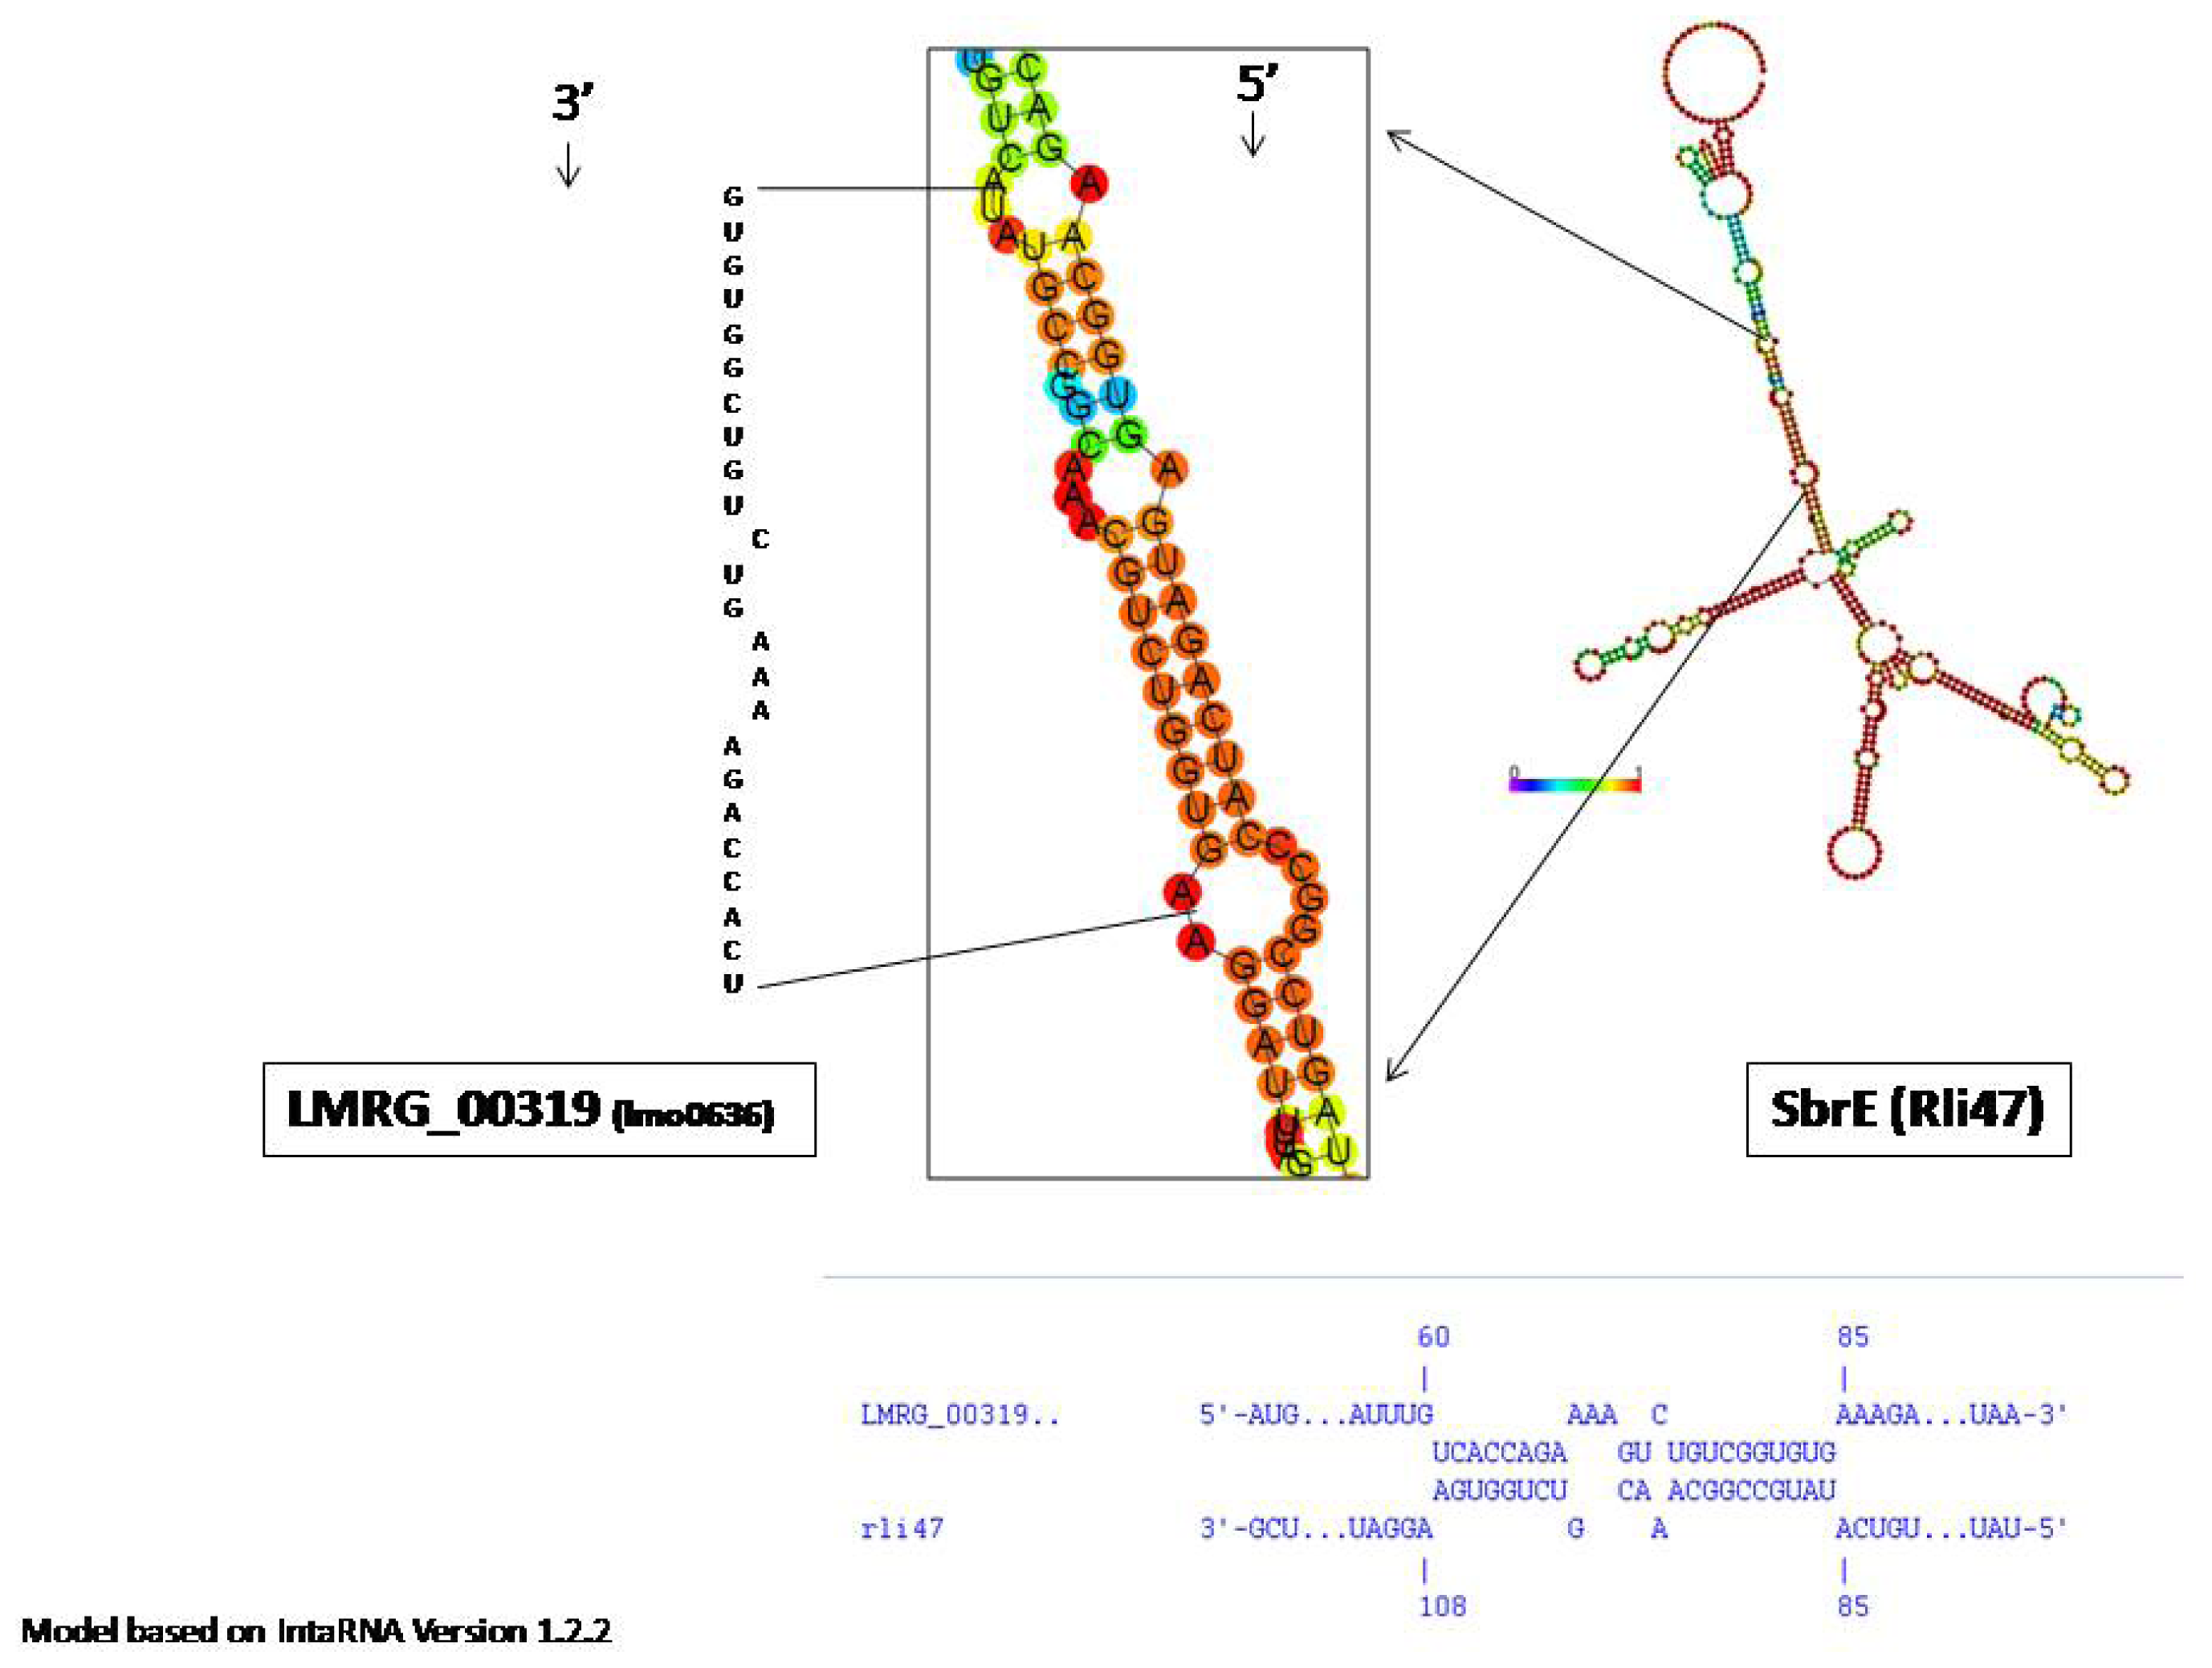
2.2. SbrE Contributes to the Expression of an Operon Composed of lmo0636 and lmo0637

Microarray experiments comparing transcript levels in L. monocytogenes 10403S parent and ΔsbrE strains identified a single gene that showed differential transcript levels (FC ≥ 1.5 and p ≤ 0.05). Specifically, lmo0636 showed 2 fold lower transcript levels in ΔsbrE as compared to the parent strain. lmo0636 transcript levels were also found to be downregulated in ΔsigB, as compared to the parent strain (FC = −2.17; p < 0.05). lmo0636 transcript levels were not found to be significantly different in the microarray comparison between ΔsigB and ΔsbrE. qRT-PCR confirmed lower lmo0636 transcript levels in ΔsbrE as compared to the parent strain (1.38 ± 0.16 log2 lower in ΔsbrE; p < 0.05 one sample t-test). These data indicate that lmo0636 is positively regulated by SbrE.
Proteomics experiments identified two proteins that were differentially expressed (FC ≥ 1.2 and p < 0.05) between the L. monocytogenes parent strain and ΔsbrE. Lmo0637 and Lmo2094 both showed lower protein levels in the ΔsbrE strain (1.45 and 1.2 fold, respectively). Lmo2094 has been annotated as a metal ion binding, class II aldolase/adducin domain protein (Uniprot, www.uniprot.org). Lmo0637, annotated as an UbiE/COQ5 family methyltransferase, is encoded by a gene that forms a 2 gene operon with lmo0636[11]. Hence, the combination of transcriptional and proteomics results indicates that SbrE regulates the expression of the lmo0636-lmo0637 operon. lmo0636 encodes a protein that was annotated as a hypothetical 2Fe-2S cluster/DNA binding protein of the Rrf2 family of regulators, which belongs to the winged helix-turn-helix superfamily of transcriptional regulators [38]. The N-terminal and C-terminal regions of Rrf2 family proteins are generally involved in DNA binding and signaling, respectively, and may function as redox sensors [39]. Interestingly, previous studies were not able to identify lmo0636/lmo0637 transcription patterns that would point towards a specific mechanism for regulation of this operon. While Raengpradub et al. [10] did not find lmo0636 and lmo0637 to be significantly differentially expressed in comparisons of L. monocytogenes 10403S and ΔsigB, in an L. monocytogenes prfA* genetic background (which expressed a constitutively active PrfA), both genes were found to have significantly higher transcript levels in ΔsigB strains, suggesting that they are negatively regulated by σB in the presence of an active PrfA [9]. On the other hand, lmo0637 was found to be up-regulated in the host during mouse infection with L. monocytogenes EGD-e, as compared to stationary phase and exponential phase cells grown in BHI, while lmo0636 was reported to be downregulated in the host as compared to stationary phase cells grown in BHI [40]. These data suggest that transcriptional regulation of lmo0636/lmo0637 is highly dependent on environmental conditions and may be fine-tuned by SbrE and σB-dependent transcription of sbrE.
As trans-encoded ncRNAs largely act through base pairing with target RNAs, typically the 5′UTR, consequently affecting their translation and/or stability [27], we modeled the putative interaction between SbrE and lmo0636 in silico, using IntaRNA version 1.2.2 [41] (Figure 2). We only found an interaction with a ΔEnergy of −11.75 kcal/mol, indicating limited complementarily between SbrE and lmo0636 (including its 5′UTR). A preliminary target capture experiment that used biotin-labeled SbrE bound to BioMag Streptavidin beads (Qiagen, Valencia, CA, USA) to capture lmo0636 RNA (with subsequent detection by qRT-PCR) also found no evidence for a specific interaction between SbrE and lmo0636. Specifically, levels of lmo0636 RNA recovered were not different from levels of RNA recovered for another L. monocytogenes gene with no evidence for SbrE dependent expression (i.e., lmo0514). Future experiments are thus needed to identify the direct or indirect mechanism by which SbrE may influence the expression of the lmo0636-lmo0637 operon or to identify other SbrE targets.

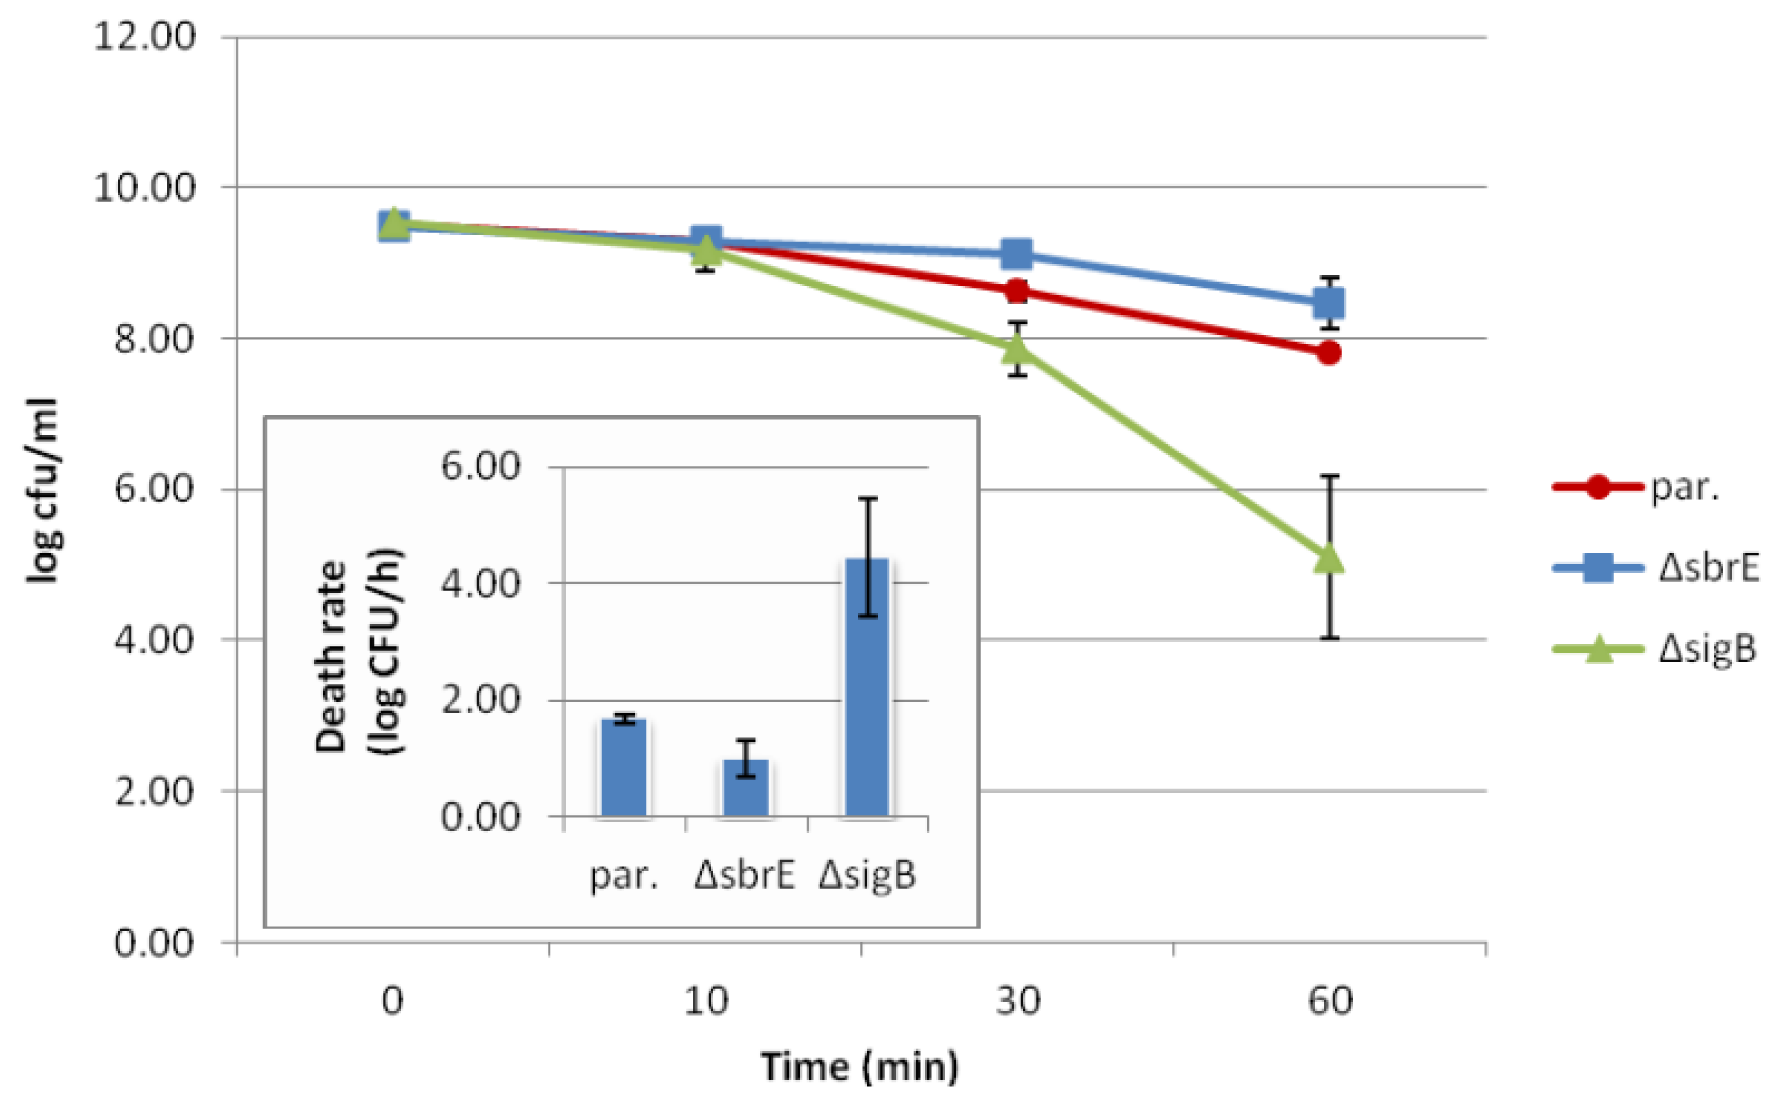
2.3. Contributions of SbrE to L. monocytogenes Survival and Growth under Different Stress Conditions could not Be Identified

As Lmo0636 is annotated as a protein that may play a role in oxidative stress response (see Section 2.2), we initially focused on characterizing the oxidative stress survival phenotype of the ΔsbrE mutant constructed here. Initial assays showed relative killing of 1.95 log CFU/mL for the ΔsbrE mutant as compared to 1.11 log CFU/mL for the parent strain after oxidative stress (13 mM CHP) exposure for 15 min, indicating a potentially small but significantly (p = 0.0084) reduced ability to survive oxidative stress for the ΔsbrE mutant (Figure S2).
As the difference in survival between the parent and the ΔsbrE strain was <1 log (i.e., 0.84 ± 0.29 log CFU/mL), follow up experiments were conducted to monitor oxidative stress (13 mM CHP exposure) survival over 60 min. In these experiments, we found no significant differences in log reduction for the parent and the ΔsbrE strain after CHP exposure for 15, 30, and 60 min (p > 0.05), even though the ΔsbrE strain showed numerically higher log CFU reductions, as compared to the parent strain at each time point, with the difference being <1 log at each time point (Table 1 and Figure S3). We thus used a competitive index experiment, which provides a more sensitive approach to identify phenotypic differences between two strains, to compare the oxidative stress resistance between the parent and the ΔsbrE strain. After 13 mM CHP exposure for 15 min the competitive index comparing the Ermr parent strain and the Erms ΔsbrE mutant was 1.63, virtually the same as for the control comparing the Ermr parent strain to an Erms parent (1.50), suggesting no difference in oxidative stress survival between the parent and ΔsbrE strains in this experiment. In all three experiments detailed above we did find evidence for significantly reduced oxidative stress resistance of the ΔsigB strain, including a competitive index of 13.29 for the comparison between the parent strain and the ΔsigB strain. These findings are consistent with previous reports, which showed that σB contributes to oxidative stress resistance in L. monocytogenes[8].
Further phenotypic evaluation of the ΔsbrE strain showed no significant effect of the sbrE deletion on (i) ability to survive acid stress (pH 2.5, 1 h; see Table 1 and Figure 3), (ii) ability to survive under salt stress (1.75 M NaCl, 12 h; see Table 1 and Figure S4); (iii) growth under glucose-limiting conditions (0.04% wt/vol glucose, 30 h; see Table 1 and Figure S5), and (iii) growth at 7 °C for 12 days (Table 1 and Figure S6). On the other hand, the ΔsigB strain, which was included as a control, showed (i) significantly higher death rate under acid stress as compared to the parent strain (p = 0.0054) and ΔsbrE (p = 0.0022) (Table 1 and Figure 3); (ii) significantly reduced ability to survive salt stress as compared to the parent strain (p = 0.0039) and ΔsbrE (p = 0.0039) (Table 1 and Figure S4); and (iii) significantly greater increase in cell density under glucose limiting conditions as compared to the parent strain (p = 0.0008) and ΔsbrE (p = 0.0014) (Table 1 and Figure S5). The ΔsigB strain showed a small but significant (p = 0.0371) reduction in growth rate under cold stress compared to wildtype, with a difference of 0.06 ± 0.03 log CFU/mL/day (Table 1 and Figure S6). Susceptibility to infection from the 22 Listeriaphages tested did not differ between wildtype, ΔsbrE, and ΔsigB strains (Table S1).
Our data suggest that SbrE does not contribute to L. monocytogenes survival and growth under a number of stress conditions that are well established to require σB for optimal growth and survival. Overall, we found that a SbrE deletion does not affect L. monocytogenes growth under cold stress or energy stress or L. monocytogenes acid stress survival or phage resistance. SbrE did however show a small but significant contribution to the survival of L. monocytogenes 10403S under oxidative stress in our initial experiments; however, this phenotype was not confirmed by subsequent experiments. These data indicate potential contributions of L. monocytogenes SbrE to growth and survival under very specific and defined environmental stress conditions. Interestingly, the characterization of the σB-dependent ncRNA SbrA also found no phenotypes for a ΔsbrA mutant strain under the conditions tested [30].

3. Experimental Section

3.1. Bacterial Strains and Growth Conditions

Strains used in this study are listed in Table 2. Stock cultures of all strains were stored at −80 °C in Brain Heart Infusion (BHI) medium containing 15% glycerol. Cultures were streaked onto BHI agar and incubated at 37 °C for 24 h to obtain isolated colonies for inoculation of overnight cultures. Specific growth conditions for each experiment are described below.

3.2. Construction of L. monocytogenes Mutants

A nonpolar internal deletion mutant allele of sbrE was created by splicing by overlap extension (SOE) PCR and allelic mutagenesis, using previously described procedures [44]. Allelic exchange mutagenesis of the wildtype sbrE allele with the mutant allele was confirmed by PCR amplification and direct sequencing of the PCR product (see Table S2 for primers).

3.3. TaqMan Quantitative RT-PCR (qRT-PCR) to Measure sbrE and lmo0636 Transcript Levels

qRT-PCR was used to quantify (i) sbrE transcript levels in parent and ΔsigB mutant strains representing the different lineages of L. monocytogenes as well as one L. innocua strain, and (ii) lmo0636 transcript levels in L. monocytogenes parent strain10403S and its isogenic ΔsbrE null mutant. Briefly, cells were grown to stationary phase at 37 °C as previously described [10], with shaking at 230 rpm. After cells reached stationary phase, RNAProtect bacterial reagent (Qiagen, Valencia, CA, USA) was used to stabilize the mRNA according to manufacturer’s instructions. Bacterial cells were collected by centrifugation and stored at −80 °C prior to RNA isolation. RNA extraction was performed using TRI reagent as described previously [45]. Total RNA was incubated with RNasin (Promega, Madison, WI, USA) and RQ1 DNase (Promega) to inhibit RNases and remove DNA contamination, respectively. Further RNA cleanup and concentration was performed using the RNeasy MinElute Cleanup Kit (Qiagen). A NanoDrop ND-1000 spectrophotometer (NanoDrop, Rockland, DE, USA) was used to quantify and assess purity of the RNA. RNA quality and integrity was assessed by the Agilent 2100 Bioanalyzer (Agilent, Santa Clara, CA, USA).
One microgram of RNA from each sample was reverse transcribed to cDNA using random hexamers and reverse transcriptase (TaqMan Reverse Transcription Reagents, Applied Biosystems, Carlsbad, CA, USA) prior to qRT-PCR. To evaluate residual genomic DNA contamination, control reactions without reverse transcriptase were included for each template. qRT-PCR was performed on an ABI Prism 7000 Sequence Detection System (Applied Biosystems), using the TaqMan Universal PCR Master Mix Reagent (Applied Biosystems). Duplicate qRT-PCR reactions were loaded into MicroAmp optical 96-well reaction plates and run using the following program: 1 cycle at 50 °C for 2 min, 1 cycle at 95 °C for 10 min, followed by 40 cycles at 95 °C for 15 s and 60 °C for 1 min. Standard curves for each target template were included to determine the amplification efficiency. All qRT-PCR analyses were performed in triplicate using RNA isolated from three independent biological replicates of cells (see Table S2 for primers and probes). Relative gene transcription levels, i.e., fold changes, were calculated using the efficiency calibrated mathematical model described by Pfaffl [46]. Target transcript levels were normalized to transcript levels of the housekeeping gene rpoB, which displays relatively stable transcript levels under varying experimental conditions [8].

3.4. qRT-PCR to Determine Growth Phase and Environmental Stress Dependent sbrE Transcript Levels

qRT-PCR was used to measure sbrE transcript levels in mid-log phase (OD600 0.4), late log phase (OD600 1.0), early stationary phase (OD600 1.0 + 3 h), and after exposure of mid-log phase cells to either (i) 13 mM cumene hydroperoxide (CHP) (Sigma-Aldrich, St. Louis, MO, USA), 15 min (as described by Oliver et al. [8]), or (ii) 10% NaCl, 15 min. L. monocytogenes 10403S cells were grown as described above. To apply salt stress, an equal volume inoculum of mid-log phase cells was transferred to 5 mL 20% NaCl, and cultures were then incubated at 37 °C with shaking for 15 min. RNA extraction, cDNA synthesis, and qRT-PCR were performed as described above, with the exception that RNA was purified using two phenol-chloroform extractions and one chloroform extraction, followed by RNA precipitation and resuspension in RNase-free water, instead of the RNeasy MinElute Cleanup Kit (Qiagen) procedure described above. Relative gene transcription levels were calculated using the Pfaffl model as described above [46] with target transcript levels normalized to transcript levels of rpoB within samples. Results from all samples were normalized to SbrE transcript levels from a single replicate at mid-log phase (OD 0.4) [47].

3.5. Microarray

L. monocytogenes 10403S parent strain, ΔsbrE, and ΔsigB cells were grown to stationary phase and total RNA was extracted as described above for qRT-PCR analysis. DNA Microarray design and construction were described in a previous study [10]. cDNA synthesis, labeling with dyes, and hybridization were performed as described by Ollinger et al. [9], with the exception that samples were labeled with Cy3 and Cy5 dyes (Amersham Biosciences, Piscataway, NJ, USA). Three replicates using three independent RNA isolations were performed for each microarray comparison (ΔsbrE versus parent strain; ΔsbrE versus ΔsigB). Microarray statistical analysis was performed as described previously [10]. A n-fold change of ≥1.5 was used as the cutoff for the identification of differentially expressed genes.

3.6. Protein Isolation, Digestion, and iTRAQ Labeling

L. monocytogenes 10403S and ΔsbrE were grown to stationary phase as described above. After growth to stationary phase, bacterial cells from 25 mL of culture were collected by centrifugation. Cell pellets were quick-frozen with liquid nitrogen and stored at −80 °C prior to protein isolation. Proteins were isolated as previously described [48] with slight modifications. Briefly, cell pellets were washed in 1 M triethyl ammonium bicarbonate buffer (pH 8.5) (Sigma-Aldrich, St. Louis, MO, USA) with 0.1% (wt/vol) SDS and 10 μg/mL chloramphenicol (extraction buffer (EB)). Cells were then lysed using a bead beater (BioSpec Mini-Beadbeater-1) in a mixture of 0.5 mm zirconia/silica beads and 1 mL EB. The protein sample was separated from beads by centrifugation and protein concentrations were determined using a noninterfering protein assay kit with bovine serum albumin as the standard (Calbiochem, San Diego, CA, USA) according to the manufacturer’s instructions. 1D SDS-PAGE was used to verify sample protein concentration and quality.
Protein samples were analyzed at the Cornell University Proteomics and Mass Spectrometry Core Facility using shotgun-based quantitative proteomics. A total of 100 μg protein of each sample was denatured, reduced with 5 mM tris-(2-carboxylethyl) phosphine at 37 °C for 1 h and the cysteine residues were blocked with 8 mM methyl methanethiosulfonate for 10 min at room temperature. Protein samples were digested with 10 μg of sequence-grade-modified trypsin at 37 °C for 16 h. Efficiency of protein digestion was assessed by SDS-PAGE. Tryptic peptides from L. monocytogenes parent strain 10403S and ΔsbrE were each labeled with iTRAQ reagents, according to the manufacturer’s protocols (document #4351918A and 4350831C downloaded from docs.appliedbiosystems.com/search.taf; Applied Biosystems). The labeled samples were then combined and fractionated via Isoelectric focusing (IEF) OffGel electrophoresis (OGE) as described below.

3.7. OGE Fractionation and Nano-Scale Reverse Phase Chromatography and Tandem Mass Spectrometry (NanoLC-MS/MS)

The pooled iTRAQ labeled peptides were separated using an Agilent 3100 OFFGEL Fractionator (Agilent, G3100AA, Santa Clara, CA, USA) as described by Yang et al. [49]. Subsequent nanoLC-MS/MS was carried out using a LTQ-Orbitrap Velos (Thermo-Fisher Scientific, San Jose, CA, USA) mass spectrometer equipped with a nano-ion source as reported previously [49], with the Orbitrap Velos operated in positive ion mode with nano spray voltage set at 1.5 kV and source temperature at 175 °C.

3.8. Data Processing, Protein Identification, and Data Analysis

All MS and MS/MS raw spectra from iTRAQ experiments were processed using Proteome Discoverer 1.1 (PD1.1, Thermo) for subsequent database search using in-housed license Mascot Daemon (version 2.2.04, Matrix Science: Boston, MA, USA); quantitative processing, protein identification, and data analysis were conducted as described by Yang et al. [49], with some modifications. Briefly, the L. monocytogenes protein sequence database containing 4177 sequence entries downloaded from the Broad Institute ( www.broadinstitute.org/annotation/genome/listeria_group/GenomesIndex.html) on 22 May, 2009 was used for database search. The default Mascot search settings included (i) one missed cleavage for full trypsin with fixed MMTS modification of cysteine, (ii) fixed 4-plex iTRAQ modifications on lysine and N-terminal amines, and (iii) variable modifications of methionine oxidation and 4-plex iTRAQ on tyrosine. The peptide mass tolerance and fragment mass tolerance values were 10 ppm and 30 mDa, respectively. To estimate the false discovery rate (FDR), an automatic decoy database search was performed in Mascot. The relative quantitation ratios were normalized (bias-corrected) using the “median ratio” procedure for the iTRAQ 4-plex in each set of experiments. Two biological replicates were analyzed independently.
The Wilcoxon signed rank test was applied to peptide ratios for each identified protein to determine significant changes between strains. The Fisher’s Combined Probability Test was used to combine FDR adjusted Wilcoxon p-values from each replicate into one test statistic for every protein to obtain a combined p-value. Proteins with peptide ratios exhibiting a Fisher’s Combined Probability Test p-value <0.05 and an iTRAQ protein ratio ≥1.2 in both replicates were considered significantly differentially expressed. Statistical analyses were conducted using R Statistical Software (version 2.14.0; The R Foundation for Statistical Computing: Vienna, Austria, 2011).

3.9. Determination of Acid and Oxidative Stress Resistance as well as Phage Resistance

Acid and oxidative stress survival of ΔsbrE was compared to ΔsigB and the 10403S parent strain. Cells were grown to stationary phase (OD600 of 1.0 + 3 h) as described above. For acid stress experiments, 12 N HCl was added to 5 ml aliquot of stationary phase cells to reduce the culture pH to 2.5 as described previously [8]. Bacterial cells were quantified at 10, 30 and 60 min after addition of HCl by plating on BHI agar using a spiral plater (Autoplate 4000; Spiral Biotech, Inc., Norwood, MA, USA). Three independent replicates were performed.
For oxidative stress experiments, 900 μL of stationary phase cells were exposed to 13 mM CHP for 15 min at 37 °C as described previously [8]. Bacterial numbers were quantified by plating as described above. Three independent replicates were performed. In separate experiments, stationary phase cells were also exposed to CHP as described above over a 60 min period, and bacterial numbers were quantified by plating as described above at 15 min, 30 min, and 60 min. At least three independent replicates were performed.
Survival of ΔsbrE and ΔsigB mutants after CHP stress was also examined using competitive-index experiments. Strains used for these experiments included the erythromycin sensitive parent strain 10403S (ErmS 10403S) and an erythromycin-resistant 10403S derivative (DP-L3903; ErmR 10403S). Oxidative stress exposure (13 mM CHP) was applied as described above to strains mixed in a 1:1 ratio including (i) ErmS ΔsbrE and ErmR 10403S and (ii) ErmS ΔsigB and the ErmR 1043S (to evaluate the relative survival of ΔsbrE and ΔsigB compared to 10403S). A control competition experiment was conducted with a 1:1 mixture of ErmS 10403S and ErmR 10403S. Competition experiments conducted with and without 13 mM CHP were plated on BHI and incubated at 37 °C for 24 h. A hundred colonies from BHI plates were patched onto BHI agar containing 1 μg erythromycin/ml (BHI-erm). For differential enumeration, total colonies on BHI-erm were subtracted from total colonies on BHI (100). The competitive index was then calculated as the ratio of ErmR to ErmS colonies [43,50]. L. monocytogenes 10403S as well as ΔsbrE and ΔsigB strains were also tested for resistance against 22 diverse listeriaphages, using the procedures described by Vongkamjan et al. [51].

3.10. Salt, Cold, and Energy Stress Growth Experiments

Growth of 10403S parent strain, ΔsbrE, and ΔsigB strains under salt, cold, and energy stress conditions was compared. For salt growth experiments, cells were grown to mid-log phase (OD600 of 0.4) as described above. A 0.01% inoculum (vol/vol) was transferred to 50 mL pre-warmed BHI broth supplemented with 1.75 M NaCl in a 300 mL nephelo flask (5 μL into 50 mL). Cells were then incubated for 48 h at 37 °C with shaking (230 rpm). Cell numbers were determined, by plating on BHI agar, at specific time points over 48 h.
For cold growth experiments cells were grown to mid-log phase (OD600 of 0.4) as described above. A 0.01% inoculum (vol/vol) was transferred to pre-chilled 50 mL BHI broth in a 300 mL nephelo flask. Cells were then incubated at 7 °C for 12 days without shaking, and cell numbers were determined by plating on BHI agar using a spiral plater. For energy stress experiments, carbon starvation was induced by growing cells in defined medium (DM) containing a growth-limiting concentration of glucose (0.04%, wt/vol) [52]. Cells were initially grown in 5 mL of BHI broth at 37 °C overnight with shaking (230 rpm). A 0.1 mL aliquot of the overnight culture was inoculated into 10 mL DM supplemented with 0.4% (wt/vol) glucose and incubated for 12 h with shaking (230 rpm), followed by inoculation of a 0.01 mL aliquot into 10 mL pre-warmed DM containing 0.04% glucose and subsequent incubation for 30 h at 37 °C with aeration. Cell numbers were determined by plating on BHI agar using a spiral plater at specific time points over 30 h. Three biological replicates were performed for each growth experiment.

3.11. Statistical Analyses of Stress Experiments

The Baranyi model [53] was used to estimate maximum growth rates (μmax) for cold stress experiments, using the NLStools package (version 0.0-5) in R v2.6.2 (The R Foundation for Statistical Computing: Vienna, Austria, 2008). All other statistical analyses were performed with the Statistical Analysis Software (SAS) (version 9.0; SAS Institute, Inc. Cary, NC, USA, 2002). Regression analysis was used to calculate the death rate of cells exposed to pH 2.5, which was expressed as average log CFU death per hour for each strain. Analysis of variance (ANOVA) was used to test if there was significant difference in the death rates between the parent strain (10403S), ΔsbrE, and ΔsigB. ANOVA was also used to test for (i) differences in cell death due to oxidative stress; (ii) differences in growth rate (μmax) of cells exposed to cold stress, which was expressed as increase in cell density in log10 CFU/mL per day; (iii) differences in bacterial numbers after exposure to salt stress and growth under energy stress. Significance was set at p < 0.05 for all statistical analyses.

4. Conclusions

Our work showed that SbrE is a conserved part of the σB regulon, being σB-dependent across L. monocytogenes lineages and in L. innocua. A combination of proteomics and microarray approaches indicates that SbrE contributes to regulating the expression of an operon composed of lmo0636 and lmo0637, which encodes two proteins annotated as a hypothetical 2Fe-2S cluster/DNA binding protein and methyltransferase, respectively. SbrE dependent regulation of this operon likely occurs directly or indirectly at the mRNA level through the regulation of transcription or mRNA stability, as both microarray and qRT-PCR showed lower transcript levels for lmo0636 in the ΔsbrE strain. While transcription of sbrE was found to be induced under oxidative stress conditions, phenotypic data could not find consistent evidence for contributions of SbrE to oxidative stress resistance, even though a trend towards reduced oxidative stress resistance was found in some experiments. As no phenotypic consequences of a sbrE deletion were found for environmental stress conditions under which σB had previously been demonstrated to be important for survival or growth, we hypothesize that SbrE may play a role in a “fine-tuning of gene expression” in L. monocytogenes or that it may play a role for L. monocytogenes fitness under very specific growth conditions that were not tested here as previously proposed by Nielsen et al. [30] for SbrA, another σB-dependent ncRNA. Our data thus support that in addition to playing a role as a major regulator of certain stress response pathways (e.g., acid stress), σB is also likely to contribute more subtly to L. monocytogenes adaptation to other environmental stress conditions, including through complex regulatory networks. Additional experiments that utilize overexpression of SbrE will be needed, however, to gain further insight into the role of SbrE in L. monocytogenes.

Supplementary Information

ijms-14-00378-s001.pdf

Acknowledgments

This work was funded by NIH-NIAID R01 AI052151 (Kathryn Boor). S. M. was partially supported by a New York Sea Grant Scholar Fellowship (RSHH-15). We thank the Proteomics and Mass Spectrometry Core Facility at Cornell University for their services.
  • Conflict of InterestThe authors declare no conflict of interest.

References

  1. Allerberger, F.; Wagner, M. Listeriosis: A resurgent foodborne infection. Clin. Microbiol. Infect 2010, 16, 16–23. [Google Scholar]
  2. Cole, M.B.; Jones, M.V.; Holyoak, C. The effect of pH, salt concentration and temperature on the survival and growth of Listeria monocytogenes. J. Appl. Bacteriol 1990, 69, 63–72. [Google Scholar]
  3. Ferreira, A.; Sue, D.; O’Byrne, C.P.; Boor, K.J. Role of Listeria monocytogenes Sigma(B) in survival of lethal acidic conditions and in the acquired acid tolerance response. Appl. Environ. Microbiol 2003, 69, 2692–2698. [Google Scholar]
  4. Vasseur, C.; Baverel, L.; Hebraud, M.; Labadie, J. Effect of osmotic, alkaline, acid or thermal stresses on the growth and inhibition of Listeria monocytogenes. J. Appl. Microbiol 1999, 86, 469–476. [Google Scholar]
  5. Walker, S.J.; Archer, P.; Banks, J.G. Growth of Listeria monocytogenes at refrigeration temperatures. J. Appl. Bacteriol 1990, 68, 157–162. [Google Scholar]
  6. O’Byrne, C.P.; Karatzas, K.A. The role of Sigma B (Sigma B) in the stress adaptations of Listeria monocytogenes: Overlaps between stress adaptation and virulence. Adv. Appl. Microbiol 2008, 65, 115–140. [Google Scholar]
  7. Oliver, H.F.; Orsi, R.H.; Ponnala, L.; Keich, U.; Wang, W.; Sun, Q.; Cartinhour, S.W.; Filiatrault, M.J.; Wiedmann, M.; Boor, K.J. Deep RNA sequencing of L. monocytogenes reveals overlapping and extensive stationary phase and Sigma B-dependent transcriptomes, including multiple highly transcribed noncoding RNAs. BMC Genomics 2009, 10, 641. [Google Scholar]
  8. Oliver, H.F.; Orsi, R.H.; Wiedmann, M.; Boor, K.J. Listeria monocytogenes σB has a small core regulon and a conserved role in virulence but makes differential contributions to stress tolerance across a diverse collection of strains. Appl. Environ. Microbiol 2010, 76, 4216–4232. [Google Scholar]
  9. Ollinger, J.; Bowen, B.; Wiedmann, M.; Boor, K.J.; Bergholz, T.M. Listeria monocytogenes σB modulates PrfA-mediated virulence factor expression. Infect. Immun 2009, 77, 2113–2124. [Google Scholar]
  10. Raengpradub, S.; Wiedmann, M.; Boor, K.J. Comparative analysis of the Sigma B-dependent stress responses in Listeria monocytogenes and Listeria innocua strains exposed to selected stress conditions. Appl. Environ. Microbiol 2008, 74, 158–171. [Google Scholar]
  11. Toledo-Arana, A.; Dussurget, O.; Nikitas, G.; Sesto, N.; Guet-Revillet, H.; Balestrino, D.; Loh, E.; Gripenland, J.; Tiensuu, T.; Vaitkevicius, K.; et al. The Listeria transcriptional landscape from saprophytism to virulence. Nature 2009, 459, 950–956. [Google Scholar]
  12. Chaturongakul, S.; Raengpradub, S.; Palmer, M.E.; Bergholz, T.M.; Orsi, R.H.; Hu, Y.; Ollinger, J.; Wiedmann, M.; Boor, K.J. Transcriptomic and phenotypic analyses identify coregulated, overlapping regulons among PrfA, CtsR, HrcA, and the alternative Sigma factors SigmaB, SigmaC, SigmaH, and SigmaL in Listeria monocytogenes. Appl. Environ. Microbiol 2011, 77, 187–200. [Google Scholar]
  13. Chaturongakul, S.; Raengpradub, S.; Wiedmann, M.; Boor, K.J. Modulation of stress and virulence in Listeria monocytogenes. Trends Microbiol 2008, 16, 388–396. [Google Scholar]
  14. Cossart, P.; Archambaud, C. The bacterial pathogen Listeria monocytogenes: An emerging model in prokaryotic transcriptomics. J. Biol 2009, 8, 107. [Google Scholar]
  15. Gottesman, S.; Storz, G. Bacterial small RNA regulators: Versatile roles and rapidly evolving variations. Cold Spring Harb Perspect. Biol. 2011, 3. [Google Scholar] [CrossRef]
  16. Richards, G.R.; Vanderpool, C.K. Molecular call and response: The physiology of bacterial small RNAs. Biochim. Biophys. Acta 2011, 1809, 525–531. [Google Scholar]
  17. Storz, G.; Vogel, J.; Wassarman, K.M. Regulation by small RNAs in bacteria: Expanding frontiers. Mol. Cell 2011, 43, 880–891. [Google Scholar]
  18. Beisel, C.L.; Storz, G. Base pairing small RNAs and their roles in global regulatory networks. FEMS Microbiol. Rev 2010, 34, 866–882. [Google Scholar]
  19. Storz, G.; Opdyke, J.A.; Wassarman, K.M. Regulating bacterial transcription with small RNAs. Cold Spring Harbor Symp. Quant. Biol 2006, 71, 269–273. [Google Scholar]
  20. Majdalani, N.; Vanderpool, C.K.; Gottesman, S. Bacterial small RNA regulators. Crit. Rev. Biochem. Mol. Biol 2005, 40, 93–113. [Google Scholar]
  21. Storz, G.; Altuvia, S.; Wassarman, K.M. An abundance of RNA regulators. Annu. Rev. Biochem 2005, 74, 199–217. [Google Scholar]
  22. Mikulik, K. Structure and functional properties of prokaryotic small noncoding RNAs. Folia Microbiol. (Praha) 2003, 48, 443–468. [Google Scholar]
  23. Gottesman, S.; McCullen, C.A.; Guillier, M.; Vanderpool, C.K.; Majdalani, N.; Benhammou, J.; Thompson, K.M.; FitzGerald, P.C.; Sowa, N.A.; FitzGerald, D.J. Small RNA regulators and the bacterial response to stress. Cold Spring Harbor Symp. Quant. Biol 2006, 71, 1–11. [Google Scholar]
  24. Liu, J.M.; Camilli, A. A broadening world of bacterial small RNAs. Curr. Opin. Microbiol 2010, 13, 18–23. [Google Scholar]
  25. Masse, E.; Majdalani, N.; Gottesman, S. Regulatory roles for small RNAs in bacteria. Curr. Opin. Microbiol 2003, 6, 120–124. [Google Scholar]
  26. Toledo-Arana, A.; Repoila, F.; Cossart, P. Small noncoding RNAs controlling pathogenesis. Curr. Opin. Microbiol 2007, 10, 182–188. [Google Scholar]
  27. Waters, L.S.; Storz, G. Regulatory RNAs in bacteria. Cell 2009, 136, 615–628. [Google Scholar]
  28. Christiansen, J.K.; Nielsen, J.S.; Ebersbach, T.; Valentin-Hansen, P.; Sogaard-Andersen, L.; Kallipolitis, B.H. Identification of small Hfq-binding RNAs in Listeria monocytogenes. RNA 2006, 12, 1383–1396. [Google Scholar]
  29. Mandin, P.; Repoila, F.; Vergassola, M.; Geissmann, T.; Cossart, P. Identification of new noncoding RNAs in Listeria monocytogenes and prediction of mRNA targets. Nucleic Acids Res 2007, 35, 962–974. [Google Scholar]
  30. Nielsen, J.S.; Olsen, A.S.; Bonde, M.; Valentin-Hansen, P.; Kallipolitis, B.H. Identification of a Sigma B-dependent small noncoding RNA in Listeria monocytogenes. J. Bacteriol 2008, 190, 6264–6270. [Google Scholar]
  31. Mellin, J.R.; Cossart, P. The non-coding RNA world of the bacterial pathogen Listeria monocytogenes. RNA Biol 2012, 9, 372–378. [Google Scholar]
  32. Izar, B.; Mraheil, M.A.; Hain, T. Identification and role of regulatory non-coding RNAs in Listeria monocytogenes. Int. J. Mol. Sci 2011, 12, 5070–5079. [Google Scholar]
  33. Deng, X.; Phillippy, A.M.; Li, Z.; Salzberg, S.L.; Zhang, W. Probing the pan-genome of Listeria monocytogenes: New insights into intraspecific niche expansion and genomic diversification. BMC Genomics 2010, 11, 500. [Google Scholar]
  34. Nielsen, J.S.; Larsen, M.H.; Lillebaek, E.M.; Bergholz, T.M.; Christiansen, M.H.; Boor, K.J.; Wiedmann, M.; Kallipolitis, B.H. A small RNA controls expression of the chitinase ChiA in Listeria monocytogenes. PLoS One 2011, 6, e19019. [Google Scholar]
  35. Christiansen, J.K.; Larsen, M.H.; Ingmer, H.; Sogaard-Andersen, L.; Kallipolitis, B.H. The RNA-binding protein Hfq of Listeria monocytogenes: Role in stress tolerance and virulence. J. Bacteriol 2004, 186, 3355–3362. [Google Scholar]
  36. Mraheil, M.A.; Billion, A.; Mohamed, W.; Mukherjee, K.; Kuenne, C.; Pischimarov, J.; Krawitz, C.; Retey, J.; Hartsch, T.; Chakraborty, T.; et al. The intracellular sRNA transcriptome of Listeria monocytogenes during growth in macrophages. Nucleic Acids Res 2011, 39, 4235–4248. [Google Scholar]
  37. Orsi, R.H.; den Bakker, H.C.; Wiedmann, M. Listeria monocytogenes lineages: Genomics, evolution, ecology, and phenotypic characteristics. Int. J. Med. Microbiol 2011, 301, 79–96. [Google Scholar]
  38. Aravind, L.; Anantharaman, V.; Balaji, S.; Babu, M.M.; Iyer, L.M. The many faces of the helix-turn-helix domain: Transcription regulation and beyond. FEMS Microbiol. Rev 2005, 29, 231–262. [Google Scholar]
  39. Midorikawa, T.; Matsumoto, K.; Narikawa, R.; Ikeuchi, M. An Rrf2-type transcriptional regulator is required for expression of psaAB genes in the cyanobacterium Synechocystis sp. PCC 6803. Plant Physiol 2009, 151, 882–892. [Google Scholar]
  40. Camejo, A.; Buchrieser, C.; Couve, E.; Carvalho, F.; Reis, O.; Ferreira, P.; Sousa, S.; Cossart, P.; Cabanes, D. In vivo transcriptional profiling of Listeria monocytogenes and mutagenesis identify new virulence factors involved in infection. PLoS Pathog 2009, 5, e1000449. [Google Scholar]
  41. Busch, A.; Richter, A.S.; Backofen, R. IntaRNA: Efficient prediction of bacterial sRNA targets incorporating target site accessibility and seed regions. Bioinformatics 2008, 24, 2849–2856. [Google Scholar]
  42. Wiedmann, M.; Arvik, T.J.; Hurley, R.J.; Boor, K.J. General stress transcription factor SigmaB and its role in acid tolerance and virulence of Listeria monocytogenes. J. Bacteriol 1998, 180, 3650–3656. [Google Scholar]
  43. Auerbuch, V.; Lenz, L.L.; Portnoy, D.A. Development of a competitive index assay to evaluate the virulence of Listeria monocytogenes actA mutants during primary and secondary infection of mice. Infect. Immun 2001, 69, 5953–5957. [Google Scholar]
  44. Chan, Y.C.; Hu, Y.; Chaturongakul, S.; Files, K.D.; Bowen, B.M.; Boor, K.J.; Wiedmann, M. Contributions of two-component regulatory systems, alternative Sigma factors, and negative regulators to Listeria monocytogenes cold adaptation and cold growth. J. Food Prot 2008, 71, 420–425. [Google Scholar]
  45. Stasiewicz, M.J.; Wiedmann, M.; Bergholz, T.M. The transcriptional response of Listeria monocytogenes during adaptation to growth on lactate and diacetate includes synergistic changes that increase fermentative acetoin production. Appl. Environ. Microbiol 2011, 77, 5294–5306. [Google Scholar]
  46. Pfaffl, M.W. A new mathematical model for relative quantification in real-time RT-PCR. Nucleic Acids Res 2001, 29, e45. [Google Scholar]
  47. Bergholz, T.M.; den Bakker, H.C.; Fortes, E.D.; Boor, K.J.; Wiedmann, M. Salt stress phenotypes in Listeria monocytogenes vary by genetic lineage and temperature. Foodborne Pathog. Dis 2010, 7, 1537–1549. [Google Scholar]
  48. Abram, F.; Su, W.L.; Wiedmann, M.; Boor, K.J.; Coote, P.; Botting, C.; Karatzas, K.A.; O’Byrne, C.P. Proteomic analyses of a Listeria monocytogenes mutant lacking SigmaB identify new components of the SigmaB regulon and highlight a role for SigmaB in the utilization of glycerol. Appl. Environ. Microbiol 2008, 74, 594–604. [Google Scholar]
  49. Yang, Y.; Qiang, X.; Owsiany, K.; Zhang, S.; Thannhauser, T.W.; Li, L. Evaluation of different multidimensional LC-MS/MS pipelines for isobaric tags for relative and absolute quantitation (iTRAQ)-based proteomic analysis of potato tubers in response to cold storage. J. Proteome Res 2011, 10, 4647–4660. [Google Scholar]
  50. Nadon, C.A.; Bowen, B.M.; Wiedmann, M.; Boor, K.J. Sigma B contributes to PrfA-mediated virulence in Listeria monocytogenes. Infect. Immun 2002, 70, 3948–3952. [Google Scholar]
  51. Vongkamjan, K.; Moreno Switt, A.; den Bakker, H.C.; Fortes, E.D.; Wiedmann, M. Silage collected on dairy farms harbors an abundance of listeriaphages with considerable host range and genome size diversity. Appl. Environ. Microbiol 2012, 78, 8666–8675. [Google Scholar]
  52. Amezaga, M.R.; Davidson, I.; McLaggan, D.; Verheul, A.; Abee, T.; Booth, I.R. The role of peptide metabolism in the growth of Listeria monocytogenes ATCC 23074 at high osmolarity. Microbiology 1995, 141, 41–49. [Google Scholar]
  53. Baranyi, J.; Roberts, T.A. A dynamic approach to predicting bacterial growth in food. Int. J. Food Microbiol 1994, 23, 277–294. [Google Scholar]
Figure 1. sbrE transcript levels detected using TaqMan qRT-PCR in parent strains relative to their ΔsigB null mutants. The y-axis shows the log2 fold change in sbrE transcript levels between parent strains and ΔsigB null mutant strains, calculated using the Pfaffl method. Data shown are mean values obtained from three independent experiments; error bars indicate standard deviation. The average log2 fold changes ranged from 4.8 to 8.6, which equals absolute (non-log transformed) fold changes of approximately 30 to 400.
Ijms 14 00378f1
Figure 2. SbrE interaction with LMRG_00319 (lmo0636) predicted using IntaRNA software. The ΔEnergy (kcal/mol) of the interaction is −11.75.
Ijms 14 00378f2
Figure 3. Acid stress survival of parent strain (par., circle), ΔsbrE (square), and ΔsigB (triangle) strains. Bacterial numbers in log Colony Forming Units per milliliter after exposure to pH 2.5 for 1 h are plotted. The inset shows the average death rate of each strain in log Colony Forming Units per hour. Values are means from three independent experiments; error bars indicate standard deviation.
Ijms 14 00378f3
Table 1. Environmental stress survival and growth of L. monocytogenes 10403S parent strain, ΔsbrE, and ΔsigB.
Reduction in cell numbers (log CFU/mL) after oxidative stress (13 mM CHP)aDeath rate (log CFU/h) after acid stress (pH 2.5 for 1 h) aAverage μmax (log CFU/mL/day) at 7 °C aIncrease in cell density (log CFU/mL) over 27 h growth in DM/0.04% glucose (Energy Stress) a,bCell numbers (log CFU/mL) after 12 h of growth in BHI with 1.75 M NaCl (Salt Stress) a
Strain15 min30 min60 min
Parent strain2.46 ± 0.362.74 ± 0.082.69 ± 0.241.70 ± 0.080.73 ± 0.020.53 ± 0.044.86 ± 0.07
ΔsbrE2.75 ± 0.623.02 ± 0.053.39 ± 0.131.01 ± 0.320.68 ± 0.010.64 ± 0.174.61 ± 0.11
ΔsigB3.99 ± 0.883.62 ± 0.15 #,^4.76 ± 0.20 #,^4.45 ± 1.02 #,^0.67 ± 0.01 #1.45 ± 0.06 #,^3.82 ± 0.12 #,^
aData shown are means of at least three biological replicates ± standard deviation;
#Indicates significant difference between the parent strain and ΔsigB;
^Indicates significant difference between ΔsigB and ΔsbrE;
bIncrease in cell density was calculated as Colony Forming Units per milliliter after 30 h in DM minus Colony Forming Units per milliliter after 3 h in DM.
Table 2. Strains used in this study.
StrainLineageSerotypeOrigin
10403SII1/2aLaboratory type strain
FSL A1-254, ΔsigBII1/2a10403S (Wiedmann et al. [42])
FSL B2-236, ΔsbrEII1/2a10403S
FSL J1-194I1/2bHuman clinical case
FSL C6-001, ΔsigBI1/2bFSL J1-194 (Oliver et al. [8])
FSL J2-071IIIA4cBovine clinical case
FSL O1-006, ΔsigBIIIA4cFSL J2-071 (Oliver et al. [8])
FSL J1-208IV4aCaprine clinical case
FSL O1-005, ΔsigBIV4aFSL J1-208 (Oliver et al.[8])
FSL C2-008L. innocua DD 680
FSL R4-009, ΔsigBL. innocua DD 680 (Raengpradub et al.[10])
DP-L3903, Ermr10403S (Auerbuch et al.[43])

