Isolation and Characterisation of 11 Polymorphic Microsatellite Markers in Papaver rhoeas L. (Corn Poppy), a Major Annual Plant Species from Cultivated Areas

 ,
,
Abstract
:1. Introduction
2. Results and Discussion
2.1. Next-Generation Sequencing Results
2.2. Development of Microsatellite Markers
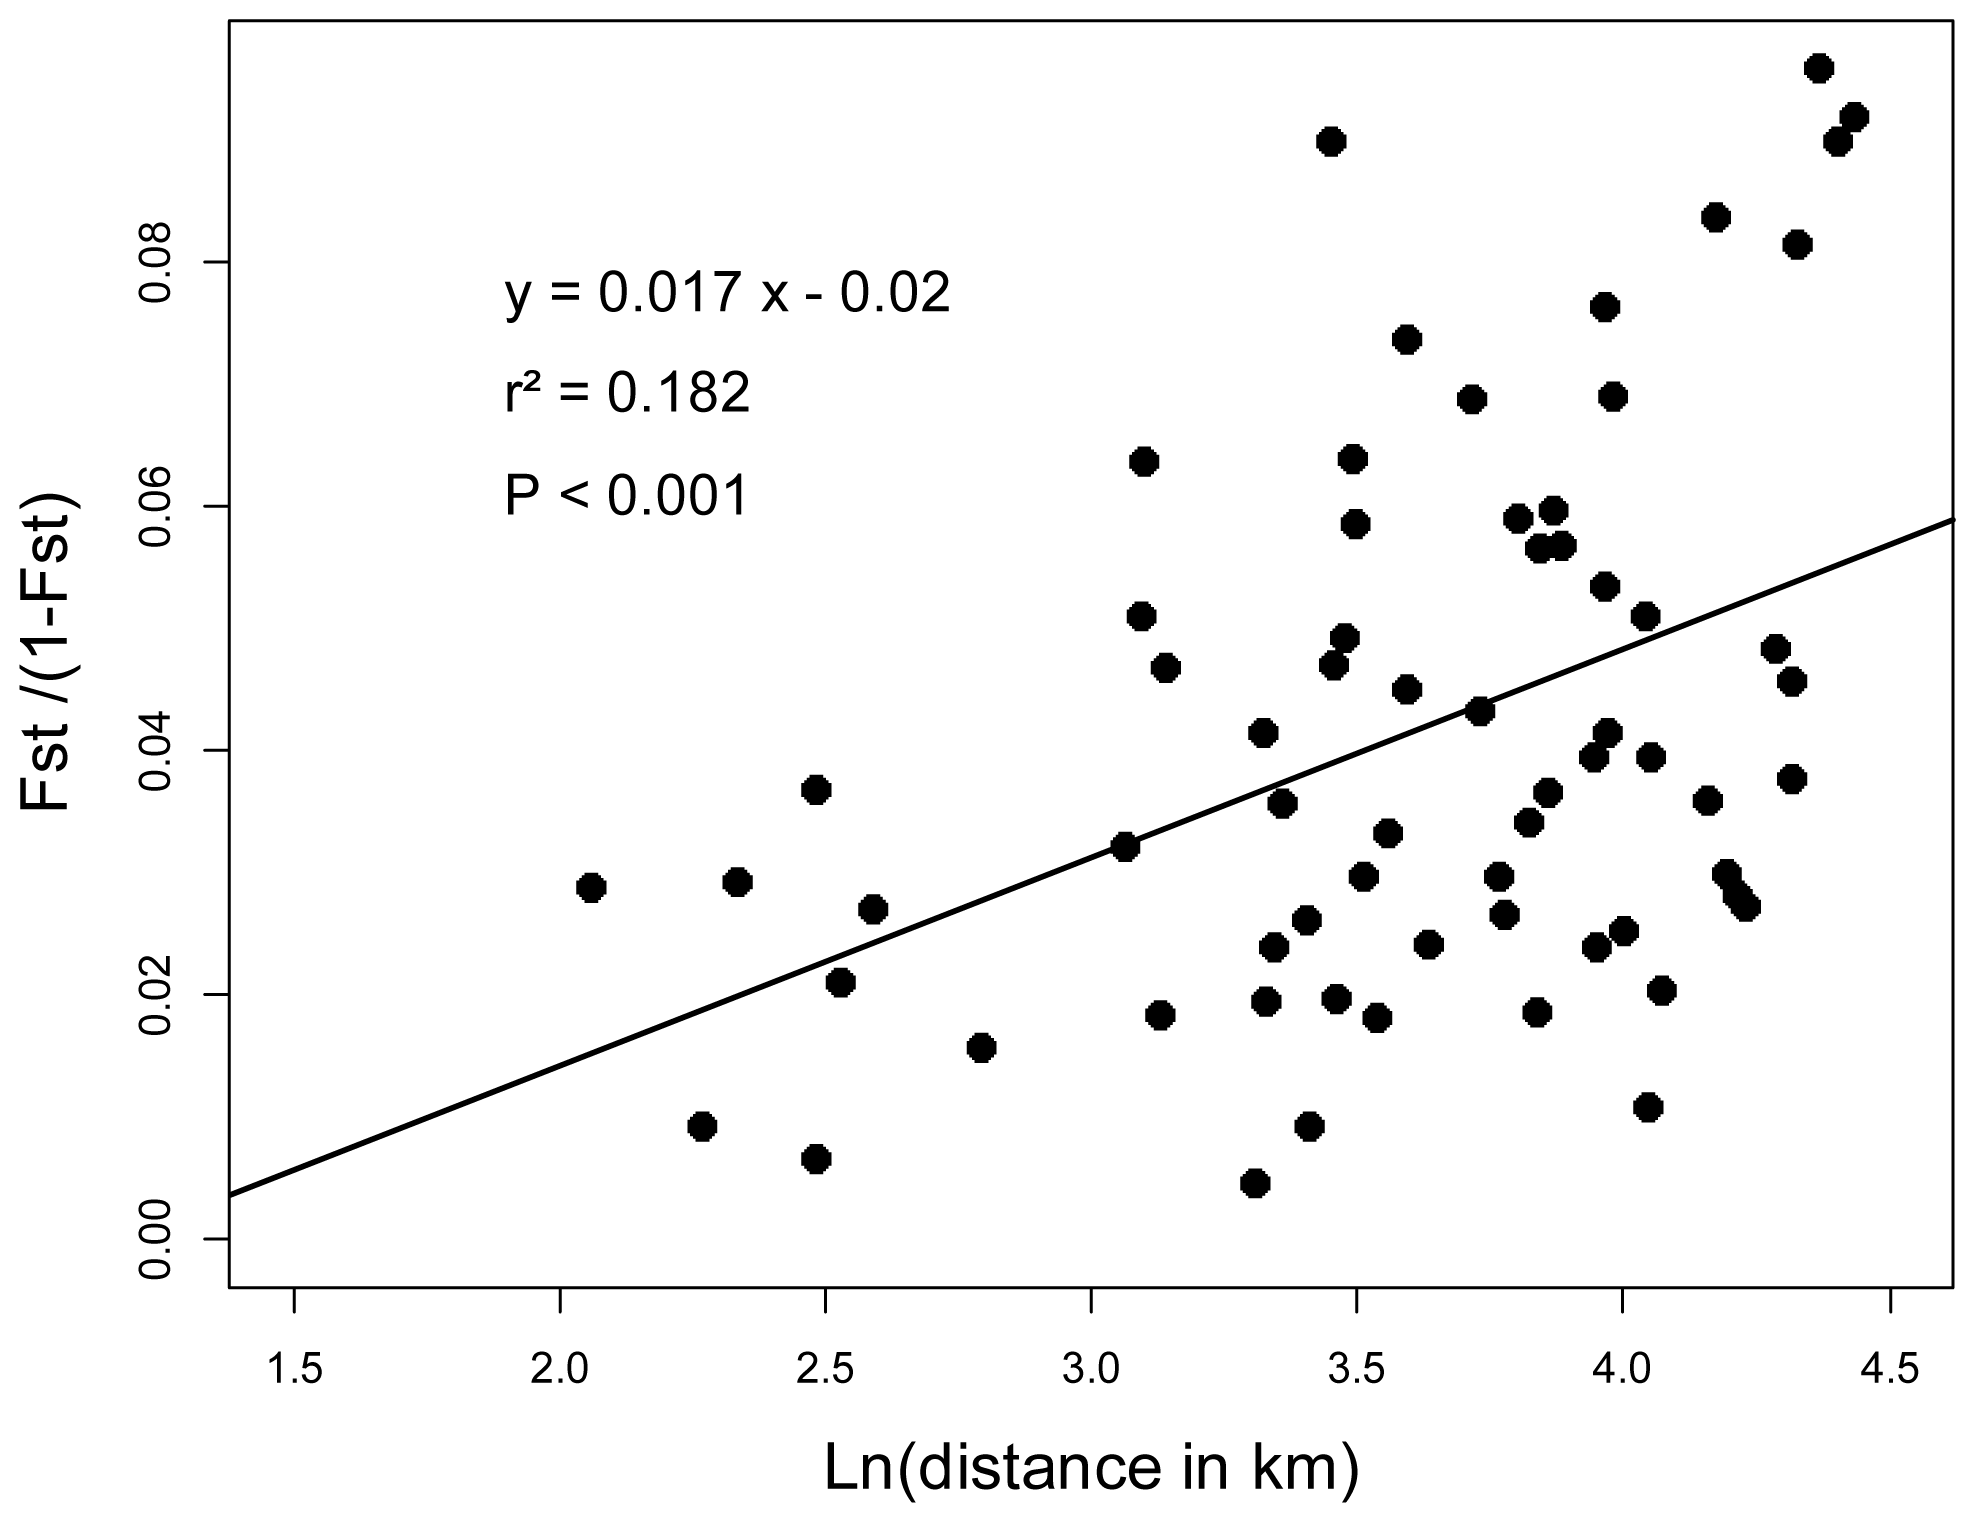
2.3. Genotyping and Population Genetics Analysis
3. Experimental Section
3.1. Plant Material
3.2. Microsatellite Library and Primer Design
3.3. Loci Selection and Primer Editing
3.4. DNA Amplification and Genotyping
3.5. Data Analysis
4. Conclusions
Acknowledgments
- Conflict of InterestThe authors declare no conflict of interest.
References
- Holm, L.; Doll, J.; Holm, E.; Pancho, J.V.; Herberger, J.P. World Weeds: Natural Histories and Distribution; John Wiley and Sons Inc: New York, NY, USA, 1997; p. 1129. [Google Scholar]
- Lutman, P.J.W.; Cussans, G.W.; Wright, K.J.; Wilson, B.J.; Lawson, H.M. The persistence of seeds of 16 weed species over six years in two arable fields. Weed Res 2002, 42, 231–241. [Google Scholar]
- Cirujeda, A.; Recasens, J.; Taberner, A. Dormancy cycle and viability of buried seeds of Papaver rhoeas. Weed Res 2006, 46, 327–334. [Google Scholar]
- Cirujeda, A.; Aibar, J.; Zaragoza, C. Remarkable changes of weed species in Spanish cereal fields from 1976 to 2007. Agron. Sustain. Dev 2011, 31, 675–688. [Google Scholar]
- Dimou, M.; Thrasyvoulou, A. Seasonal variation in vegetation and pollen collected by honeybees in Thessaloniki, Greece. Grana 2007, 46, 292–299. [Google Scholar]
- Free, J.B.; Gennard, D.; Stevenson, J.H.; Williams, I.H. Beneficial insects present on a motorway verge. Biol. Conserv 1975, 8, 61–72. [Google Scholar]
- Burgio, G.; Lanzoni, A.; Navone, P.; van Achterberg, K.; Masetti, A. Parasitic Hymenoptera fauna on Agromyzidae (Diptera) colonizing weeds in ecological compensation areas in Northern Italian agroecosystems. J. Econ. Entomol 2007, 100, 298–306. [Google Scholar]
- Torra, J.; Recasens, J. Demography of corn poppy (Papaver rhoeas) in relation to emergence time and crop competition. Weed Sci 2008, 56, 826–833. [Google Scholar]
- Stevens, M.; Smith, H.G.; Hallsworth, P.B. The host range of beet yellowing viruses among common arable weed species. Plant Pathol 1994, 43, 579–588. [Google Scholar]
- Duke, J. Utilization of Papaver. Econ. Bot 1973, 27, 390–400. [Google Scholar]
- East, E.M. The distribution of self-sterility in the flowering plants. P. Am. Philos. Soc 1940, 82, 449–518. [Google Scholar]
- Hamrick, J.L.; Godt, M.J.W. Effects of life history traits on genetic diversity in plant species. Philos. T. Roy. Soc. B 1996, 351, 1291–1298. [Google Scholar]
- McNaughton, I.H.; Harper, J.L. Biological flora of the British Isles. Papaver L. J. Ecol 1964, 52, 767–793. [Google Scholar]
- Powell, W.; Machray, G.C.; Provar, J. Polymorphism revealed by simple sequence repeats. Trends Plant Sci 1996, 1, 215–222. [Google Scholar]
- Van Oosterhout, C.; Hutchinson, W.F.; Wills, D.P.M.; Shipley, P. Micro-Checker: Software for identifying and correcting genotyping errors in microsatellite data. Mol. Ecol. Notes 2004, 4, 535–538. [Google Scholar]
- Rousset, F. Genetic differentiation and estimation of gene flow from F-statistics under isolation-by-distance. Genetics 1997, 145, 1219–1228. [Google Scholar]
- Malausa, T.; Gilles, A.; Meglécz, E.; Blanquart, H.; Duthoy, S.; Costedoat, C.; Dubut, V.; Pech, N.; Castagnone-Sereno, P.; Délye, C.; et al. High-throughput microsatellite isolation through 454 GS-FLX Titanium pyrosequencing of enriched DNA libraries. Mol. Ecol. Resour 2011, 11, 638–644. [Google Scholar]
- Meglécz, E.; Costedoat, C.; Dubut, V.; Gilles, A.; Malausa, T.; Pech, N.; Martin, J.F. QDD: A user-friendly program to select microsatellite markers and design primers from large sequencing projects. Bioinformatics 2010, 26, 403–404. [Google Scholar]
- Rozen, S.; Skaletsky, H. Primer3 on the WWW for General Users and for Biologist Programmers. In Bioinformatics Methods and Protocols; Krawetz, S., Misener, S., Eds.; Humana Press: Totowa, NJ, USA, 2000; pp. 365–386. [Google Scholar]
- Délye, C.; Boucansaud, K.; Pernin, F.; Le Corre, V. Variation in the gene encoding acetolactate-synthase in Lolium species and proactive detection of mutant, herbicide-resistant alleles. Weed Res 2009, 49, 326–336. [Google Scholar]
- Caullet, C.M.L.; Pernin, F.; Poncet, C.; Le Corre, V. Development of microsatellite markers in Capsella rubella and Capsella bursa-pastoris (Brassicaceae). Am. J. Bot 2011, 98, 176–179. [Google Scholar]
- Goudet, J. FSTAT (Version 1.2): A computer program to calculate F-statistics. J. Hered 1995, 86, 485–486. [Google Scholar]
- Cockerham, C.C.; Weir, B.S. Estimation of gene flow from F-statistics. Evolution 1993, 47, 855–863. [Google Scholar]


| Locus | Repeat motif | Primer sequences (5′-3′) | Ta (°C) | Size range (bp) | GenBank accession No. |
|---|---|---|---|---|---|
| PMS002 | TC | F: TTCACAACCTAAGTTCCCCTG | 60 | 107–139 | HF547289 |
| R: ACAAATCGAAACCCCTAATTTG | 60 | ||||
| PMS005 | CT | F: CCCCAATCAAAGAAGCTTGATG | 60 | 170–183 | HF547290 |
| R: GATATGATATGTCCCTCTCAATGG | 60 | ||||
| PMS006 | GA | F: GAATTCCATTCCCACTCAATATC | 60 | 241–255 | HF547291 |
| R: CAGCAGCAGCATTTATCCTCAAC | 60 | ||||
| PMS015 | AC | F: ATCCCCTGTTGATCCAATTG | 60 | 203–222 | HF547292 |
| R: TTGCGATGTTTATAGGGCAC | 60 | ||||
| PMS037 | TCT | F: ACTGATACTACTTCTTCCTCCACC | 60 | 78–193 | HF547293 |
| R: TCGAAGAGCCTGTATTTGAATC | 60 | ||||
| PMS039 | TC | F: TTGATCTGCTCTTACAAACCC | 60 | 105–123 | HF547294 |
| R: CCAGAAAAGTAGAATATTGATTGAGTTG | 60 | ||||
| PMS051 | GAA | F: GGAATCTCGTGGCATTCATTTAC | 60 | 201–241 | HF547295 |
| R: GAATCTTCTCCAAACACATCGAAC | 60 | ||||
| PMS052 | AG | F: TAGCTGTACGGAAGAGCAAGC | 60 | 168–249 | HF547296 |
| R: CGATCTCTTCCCGTGTCC | 60 | ||||
| PMS054 | CA | F: GACTTAAACTCGGCAACATCAC | 60 | 51–153 | HF547297 |
| R: ATATGGTTGTGAATGAGTTAGCTTG | 60 | ||||
| PMS061 | TG | F: GATGTGCGTCTACGAGATTTGG | 60 | 211–221 | HF547298 |
| R: ACCGATTACCAGAAACAGATCG | 60 | ||||
| PMS073 | TTC | F: TCTTCTGCATAAGGAGCATGAG | 60 | 127–145 | HF547299 |
| R: TGATGATATCTTGGAAGAATTGG | 60 |
| Locus | BE | CF | CY | |||||||||
|---|---|---|---|---|---|---|---|---|---|---|---|---|
| Na | HO | HE | FIS | Na | HO | HE | FIS | Na | HO | HE | FIS | |
| PMS002 | 9 | 0.548 | 0.808 | 0.321 * | 6 | 0.625 | 0.723 | 0.136 | 10 | 0.366 | 0.607 | 0.396 * |
| PMS005 | 6 | 0.594 | 0.700 | 0.152 | 6 | 0.687 | 0.690 | 0.003 | 9 | 0.687 | 0.769 | 0.106 |
| PMS006 | 5 | 0.562 | 0.641 | 0.122 | 5 | 0.719 | 0.775 | 0.073 | 5 | 0.742 | 0.709 | −0.046 |
| PMS015 | 7 | 0.437 | 0.485 | 0.098 | 4 | 0.500 | 0.592 | 0.156 | 7 | 0.406 | 0.719 | 0.435 * |
| PMS037 | 6 | 0.687 | 0.730 | 0.058 | 4 | 0.594 | 0.671 | 0.116 | 9 | 0.656 | 0.813 | 0.193 |
| PMS039 | 6 | 0.750 | 0.776 | 0.034 | 5 | 0.594 | 0.739 | 0.196 | 7 | 0.594 | 0.688 | 0.136 |
| PMS051 | 4 | 0.312 | 0.332 | 0.058 | 3 | 0.156 | 0.148 | −0.054 | 6 | 0.344 | 0.308 | −0.116 |
| PMS052 | 4 | 0.129 | 0.336 | 0.616 * | 5 | 0.125 | 0.179 | 0.303 | 8 | 0.531 | 0.616 | 0.138 |
| PMS054 | 5 | 0.531 | 0.568 | 0.065 | 6 | 0.625 | 0.583 | −0.072 | 5 | 0.500 | 0.406 | −0.232 |
| PMS061 | 4 | 0.344 | 0.327 | −0.052 | 4 | 0.406 | 0.442 | 0.080 | 2 | 0.344 | 0.425 | 0.192 |
| PMS073 | 3 | 0.156 | 0.149 | −0.047 | 3 | 0.500 | 0.411 | −0.216 | 4 | 0.500 | 0.415 | −0.205 |
| Locus | CS | DN | FE | |||||||||
| NA | HO | HE | FIS | NA | HO | HE | FIS | NA | HO | HE | FIS | |
| PMS002 | 4 | 0.166 | 0.217 | 0.231 | 6 | 0.333 | 0.763 | 0.563 * | 7 | 0.387 | 0.419 | 0.076 |
| PMS005 | 5 | 0.625 | 0.662 | 0.056 | 4 | 0.687 | 0.638 | −0.078 | 5 | 0.677 | 0.688 | 0.016 |
| PMS006 | 5 | 0.562 | 0.709 | 0.207 | 5 | 0.625 | 0.698 | 0.105 | 6 | 0.656 | 0.661 | 0.007 |
| PMS015 | 5 | 0.656 | 0.722 | 0.091 | 5 | 0.437 | 0.452 | 0.032 | 3 | 0.594 | 0.513 | −0.158 |
| PMS037 | 8 | 0.750 | 0.758 | 0.010 | 5 | 0.594 | 0.741 | 0.199 | 6 | 0.719 | 0.692 | −0.039 |
| PMS039 | 7 | 0.774 | 0.817 | 0.053 | 6 | 0.625 | 0.638 | 0.021 | 5 | 0.719 | 0.716 | −0.004 |
| PMS051 | 5 | 0.562 | 0.461 | −0.220 | 8 | 0.344 | 0.436 | 0.212 | 6 | 0.313 | 0.404 | 0.227 |
| PMS052 | 4 | 0.500 | 0.405 | −0.235 | 6 | 0.281 | 0.335 | 0.161 | 5 | 0.290 | 0.338 | 0.140 |
| PMS054 | 7 | 0.719 | 0.605 | −0.187 | 6 | 0.625 | 0.656 | 0.048 | 3 | 0.581 | 0.475 | −0.223 |
| PMS061 | 4 | 0.375 | 0.424 | 0.116 | 3 | 0.531 | 0.458 | −0.161 | 4 | 0.500 | 0.513 | 0.026 |
| PMS073 | 3 | 0.344 | 0.297 | −0.156 | 3 | 0.313 | 0.280 | −0.117 | 3 | 0.313 | 0.279 | −0.119 |
| Locus | IS | MA | MI | |||||||||
| NA | HO | HE | FIS | NA | HO | HE | FIS | NA | HO | HE | FIS | |
| PMS002 | 7 | 0.500 | 0.793 | 0.369 * | 7 | 0.400 | 0.623 | 0.358 * | 9 | 0.516 | 0.719 | 0.283 * |
| PMS005 | 6 | 0.844 | 0.751 | −0.124 | 5 | 0.500 | 0.679 | 0.264 | 5 | 0.600 | 0.484 | −0.240 |
| PMS006 | 5 | 0.594 | 0.728 | 0.184 | 5 | 0.625 | 0.658 | 0.050 | 5 | 0.594 | 0.718 | 0.173 |
| PMS015 | 6 | 0.406 | 0.425 | 0.045 | 5 | 0.500 | 0.624 | 0.199 | 5 | 0.531 | 0.584 | 0.091 |
| PMS037 | 5 | 0.594 | 0.690 | 0.139 | 6 | 0.781 | 0.741 | −0.054 | 5 | 0.531 | 0.652 | 0.185 |
| PMS039 | 6 | 0.906 | 0.788 | −0.150 | 6 | 0.656 | 0.616 | −0.065 | 5 | 0.719 | 0.696 | −0.033 |
| PMS051 | 5 | 0.156 | 0.207 | 0.246 | 6 | 0.250 | 0.475 | 0.474 * | 7 | 0.438 | 0.490 | 0.108 |
| PMS052 | 5 | 0.625 | 0.561 | −0.114 | 4 | 0.219 | 0.303 | 0.279 | 6 | 0.226 | 0.267 | 0.153 |
| PMS054 | 4 | 0.406 | 0.505 | 0.196 | 6 | 0.531 | 0.592 | 0.103 | 4 | 0.281 | 0.426 | 0.340 |
| PMS061 | 4 | 0.188 | 0.329 | 0.430 * | 3 | 0.219 | 0.352 | 0.378 | 4 | 0.484 | 0.455 | −0.064 |
| PMS073 | 2 | 0.156 | 0.146 | −0.069 | 3 | 0.406 | 0.343 | −0.185 | 3 | 0.344 | 0.303 | −0.133 |
| Locus | PY | ST | TY | |||||||||
| NA | HO | HE | FIS | NA | HO | HE | FIS | NA | HO | HE | FIS | |
| PMS002 | 9 | 0.433 | 0.559 | 0.225 | 8 | 0.467 | 0.764 | 0.389 * | 7 | 0.531 | 0.665 | 0.201 |
| PMS005 | 5 | 0.563 | 0.715 | 0.213 | 5 | 0.656 | 0.600 | −0.094 | 5 | 0.375 | 0.526 | 0.287 |
| PMS006 | 6 | 0.719 | 0.729 | 0.014 | 4 | 0.656 | 0.649 | −0.012 | 4 | 0.839 | 0.682 | −0.229 |
| PMS015 | 7 | 0.688 | 0.662 | −0.038 | 6 | 0.469 | 0.429 | −0.092 | 5 | 0.531 | 0.592 | 0.103 |
| PMS037 | 9 | 0.750 | 0.771 | 0.027 | 7 | 0.719 | 0.804 | 0.106 | 5 | 0.688 | 0.713 | 0.079 |
| PMS039 | 6 | 0.656 | 0.780 | 0.158 | 6 | 0.719 | 0.718 | −0.001 | 7 | 0.656 | 0.688 | 0.045 |
| PMS051 | 4 | 0.281 | 0.257 | −0.096 | 4 | 0.125 | 0.348 | 0.641 * | 7 | 0.469 | 0.504 | 0.069 |
| PMS052 | 5 | 0.344 | 0.458 | 0.249 | 5 | 0.387 | 0.477 | 0.188 | 8 | 0.469 | 0.447 | −0.050 |
| PMS054 | 7 | 0.613 | 0.562 | −0.091 | 6 | 0.531 | 0.643 | 0.174 | 6 | 0.563 | 0.621 | 0.095 |
| PMS061 | 4 | 0.400 | 0.542 | 0.262 | 3 | 0.469 | 0.487 | 0.037 | 6 | 0.290 | 0.341 | 0.150 |
| PMS073 | 3 | 0.219 | 0.203 | −0.080 | 3 | 0.281 | 0.252 | −0.116 | 3 | 0.188 | 0.176 | −0.063 |
| Code | Population | Latitude (N) | Longtitude (E) | Altitude (m) |
|---|---|---|---|---|
| BE | Beaunotte | 47.678028 | 4.681338 | 302 |
| CF | Chamboeuf | 47.234224 | 4.890333 | 471 |
| CY | Chevigny | 47.181531 | 5.475732 | 215 |
| CS | Chivres | 46.977046 | 5.102653 | 175 |
| DN | Détain | 47.155948 | 4.782923 | 585 |
| FE | Fénay | 47.233031 | 5.065271 | 221 |
| IS | Isômes | 47.643463 | 5.284272 | 277 |
| MA | Marliens | 47.218520 | 5.190730 | 196 |
| MI | Mirande | 47.302668 | 5.080832 | 245 |
| PY | Perrigny | 47.287745 | 5.453528 | 190 |
| ST | St Thibault | 47.368827 | 4.472117 | 356 |
| TY | Talmay | 47.380004 | 5.462555 | 217 |
© 2013 by the authors; licensee Molecular Diversity Preservation International, Basel, Switzerland. This article is an open-access article distributed under the terms and conditions of the Creative Commons Attribution license (http://creativecommons.org/licenses/by/3.0/).
Share and Cite
Kati, V.; Le Corre, V.; Michel, S.; Jaffrelo, L.; Poncet, C.; Délye, C. Isolation and Characterisation of 11 Polymorphic Microsatellite Markers in Papaver rhoeas L. (Corn Poppy), a Major Annual Plant Species from Cultivated Areas. Int. J. Mol. Sci. 2013, 14, 470-479. https://doi.org/10.3390/ijms14010470
Kati V, Le Corre V, Michel S, Jaffrelo L, Poncet C, Délye C. Isolation and Characterisation of 11 Polymorphic Microsatellite Markers in Papaver rhoeas L. (Corn Poppy), a Major Annual Plant Species from Cultivated Areas. International Journal of Molecular Sciences. 2013; 14(1):470-479. https://doi.org/10.3390/ijms14010470
Chicago/Turabian StyleKati, Vaya, Valérie Le Corre, Séverine Michel, Lydia Jaffrelo, Charles Poncet, and Christophe Délye. 2013. "Isolation and Characterisation of 11 Polymorphic Microsatellite Markers in Papaver rhoeas L. (Corn Poppy), a Major Annual Plant Species from Cultivated Areas" International Journal of Molecular Sciences 14, no. 1: 470-479. https://doi.org/10.3390/ijms14010470