A Molecular-Modeling Toolbox Aimed at Bridging the Gap between Medicinal Chemistry and Computational Sciences


Abstract
:1. Introduction
2. Methods
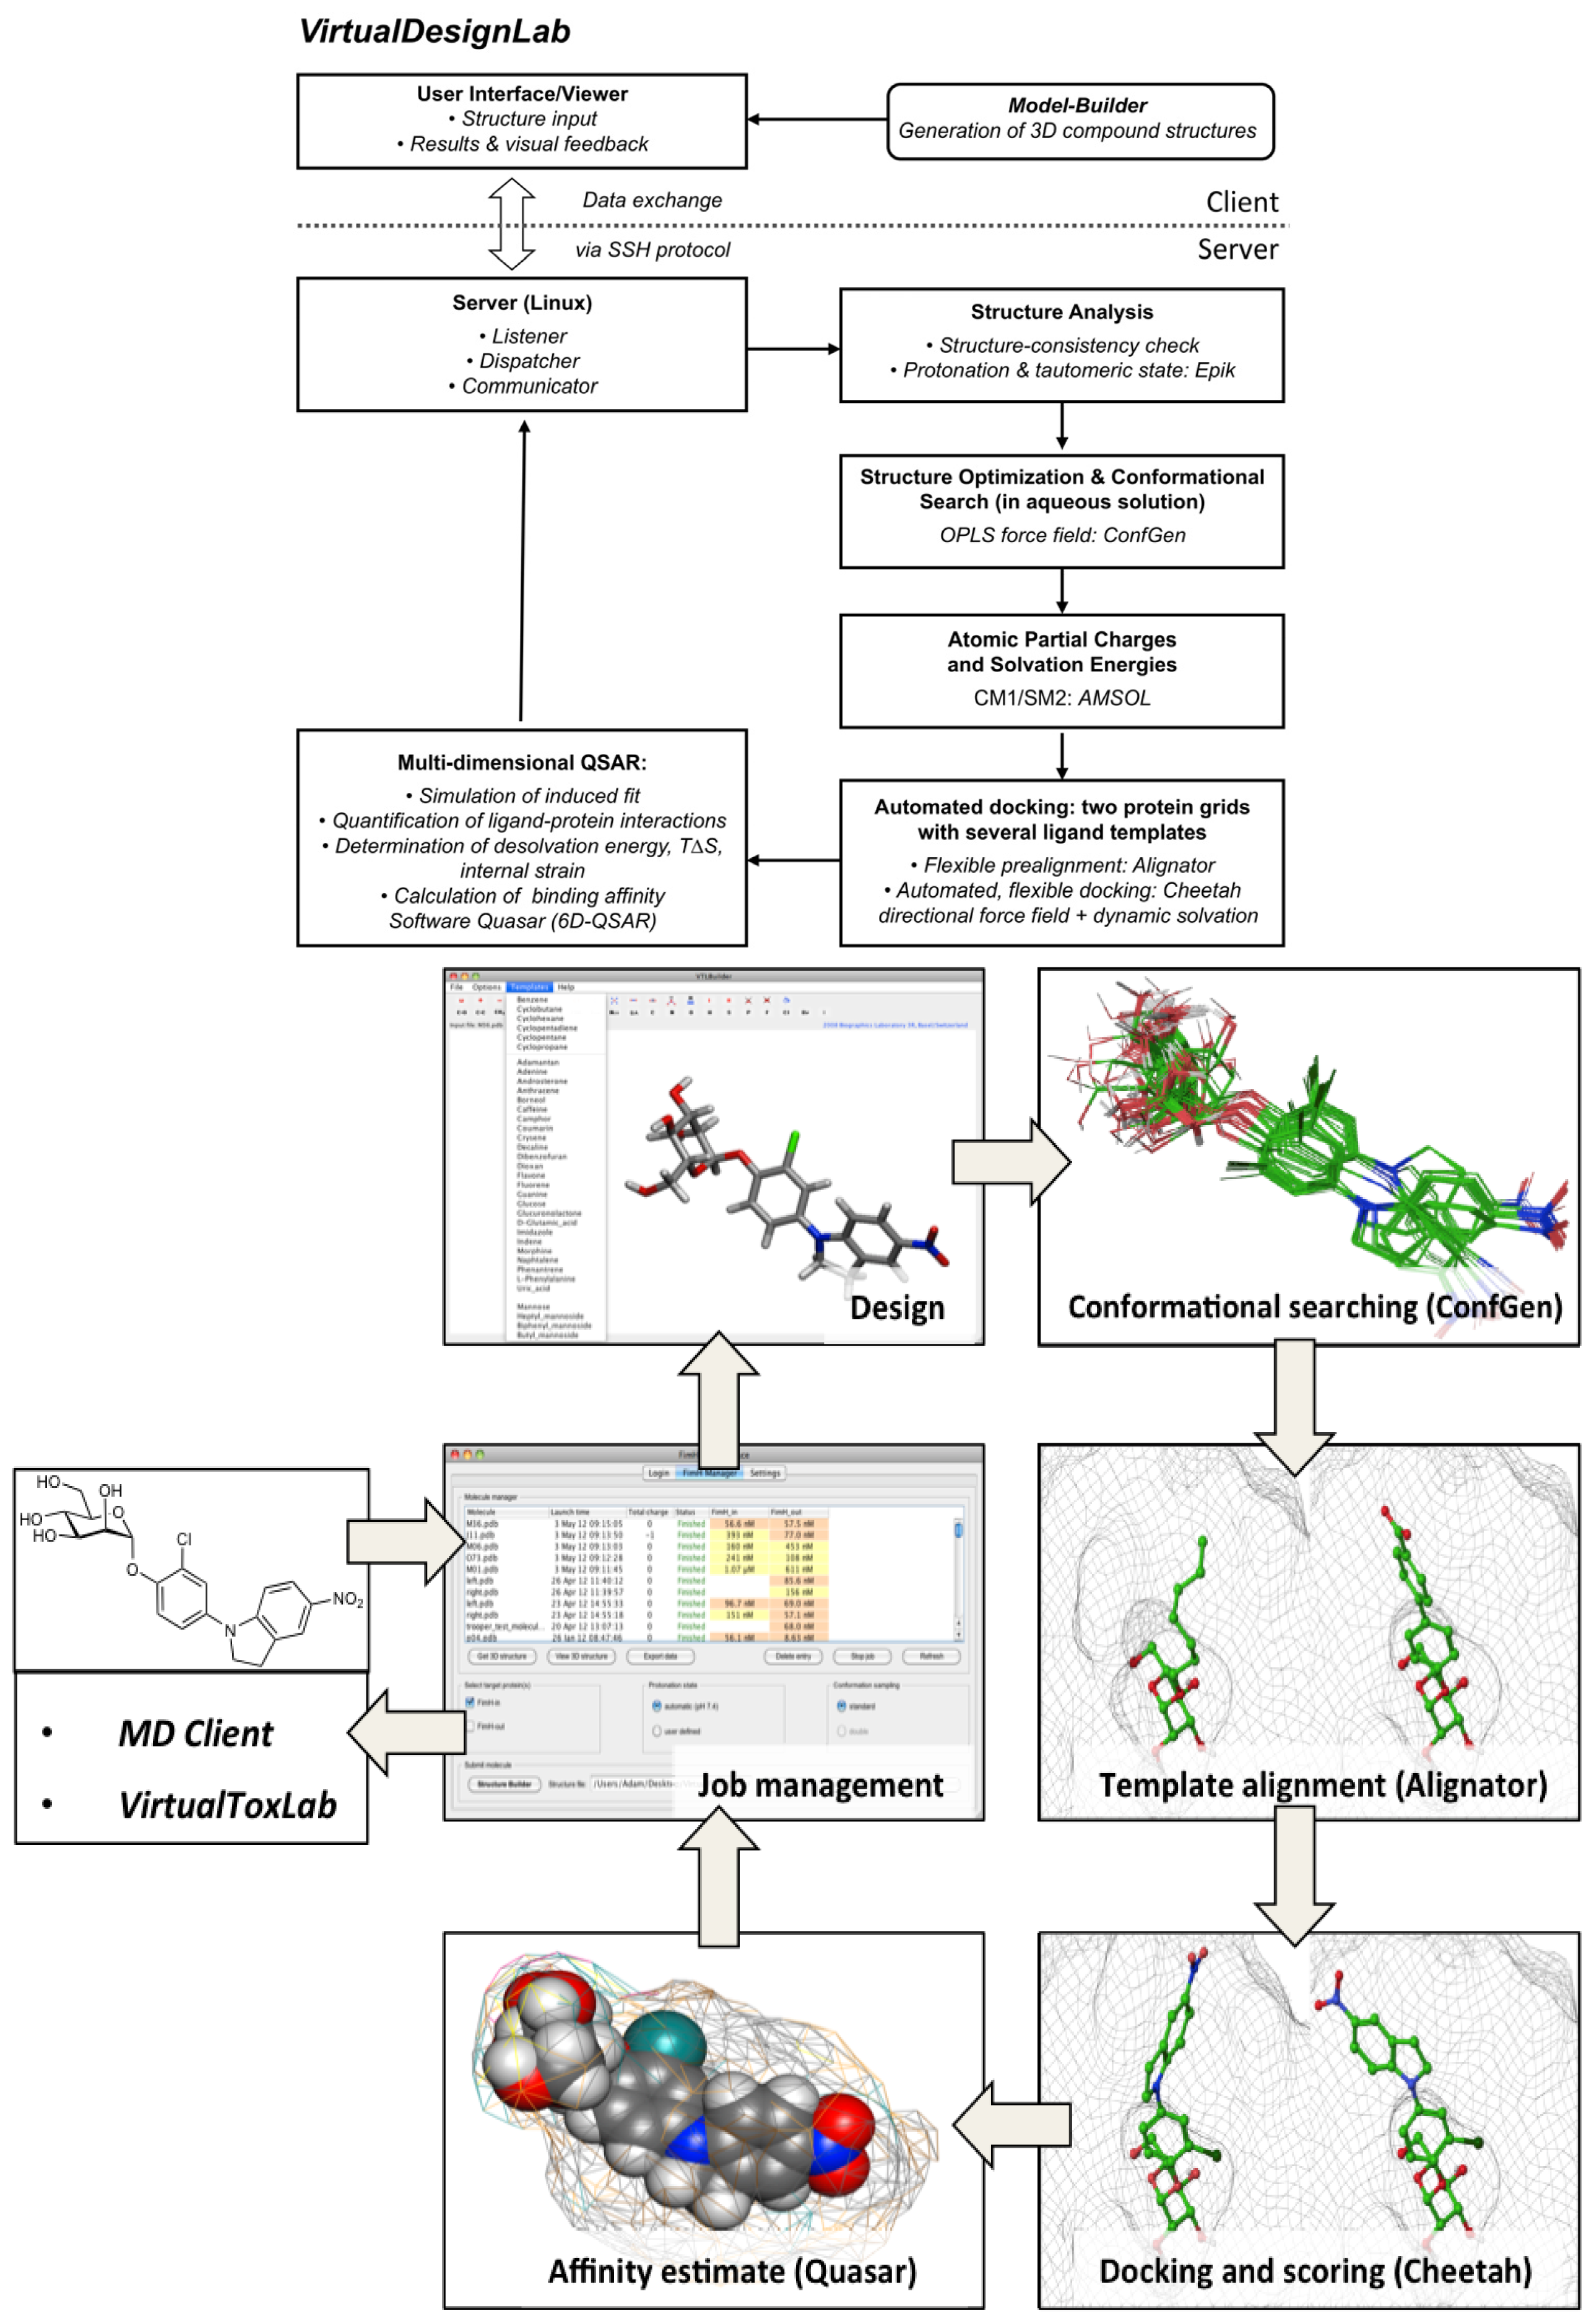
2.1. VirtualDesignLab
2.2. MD Client
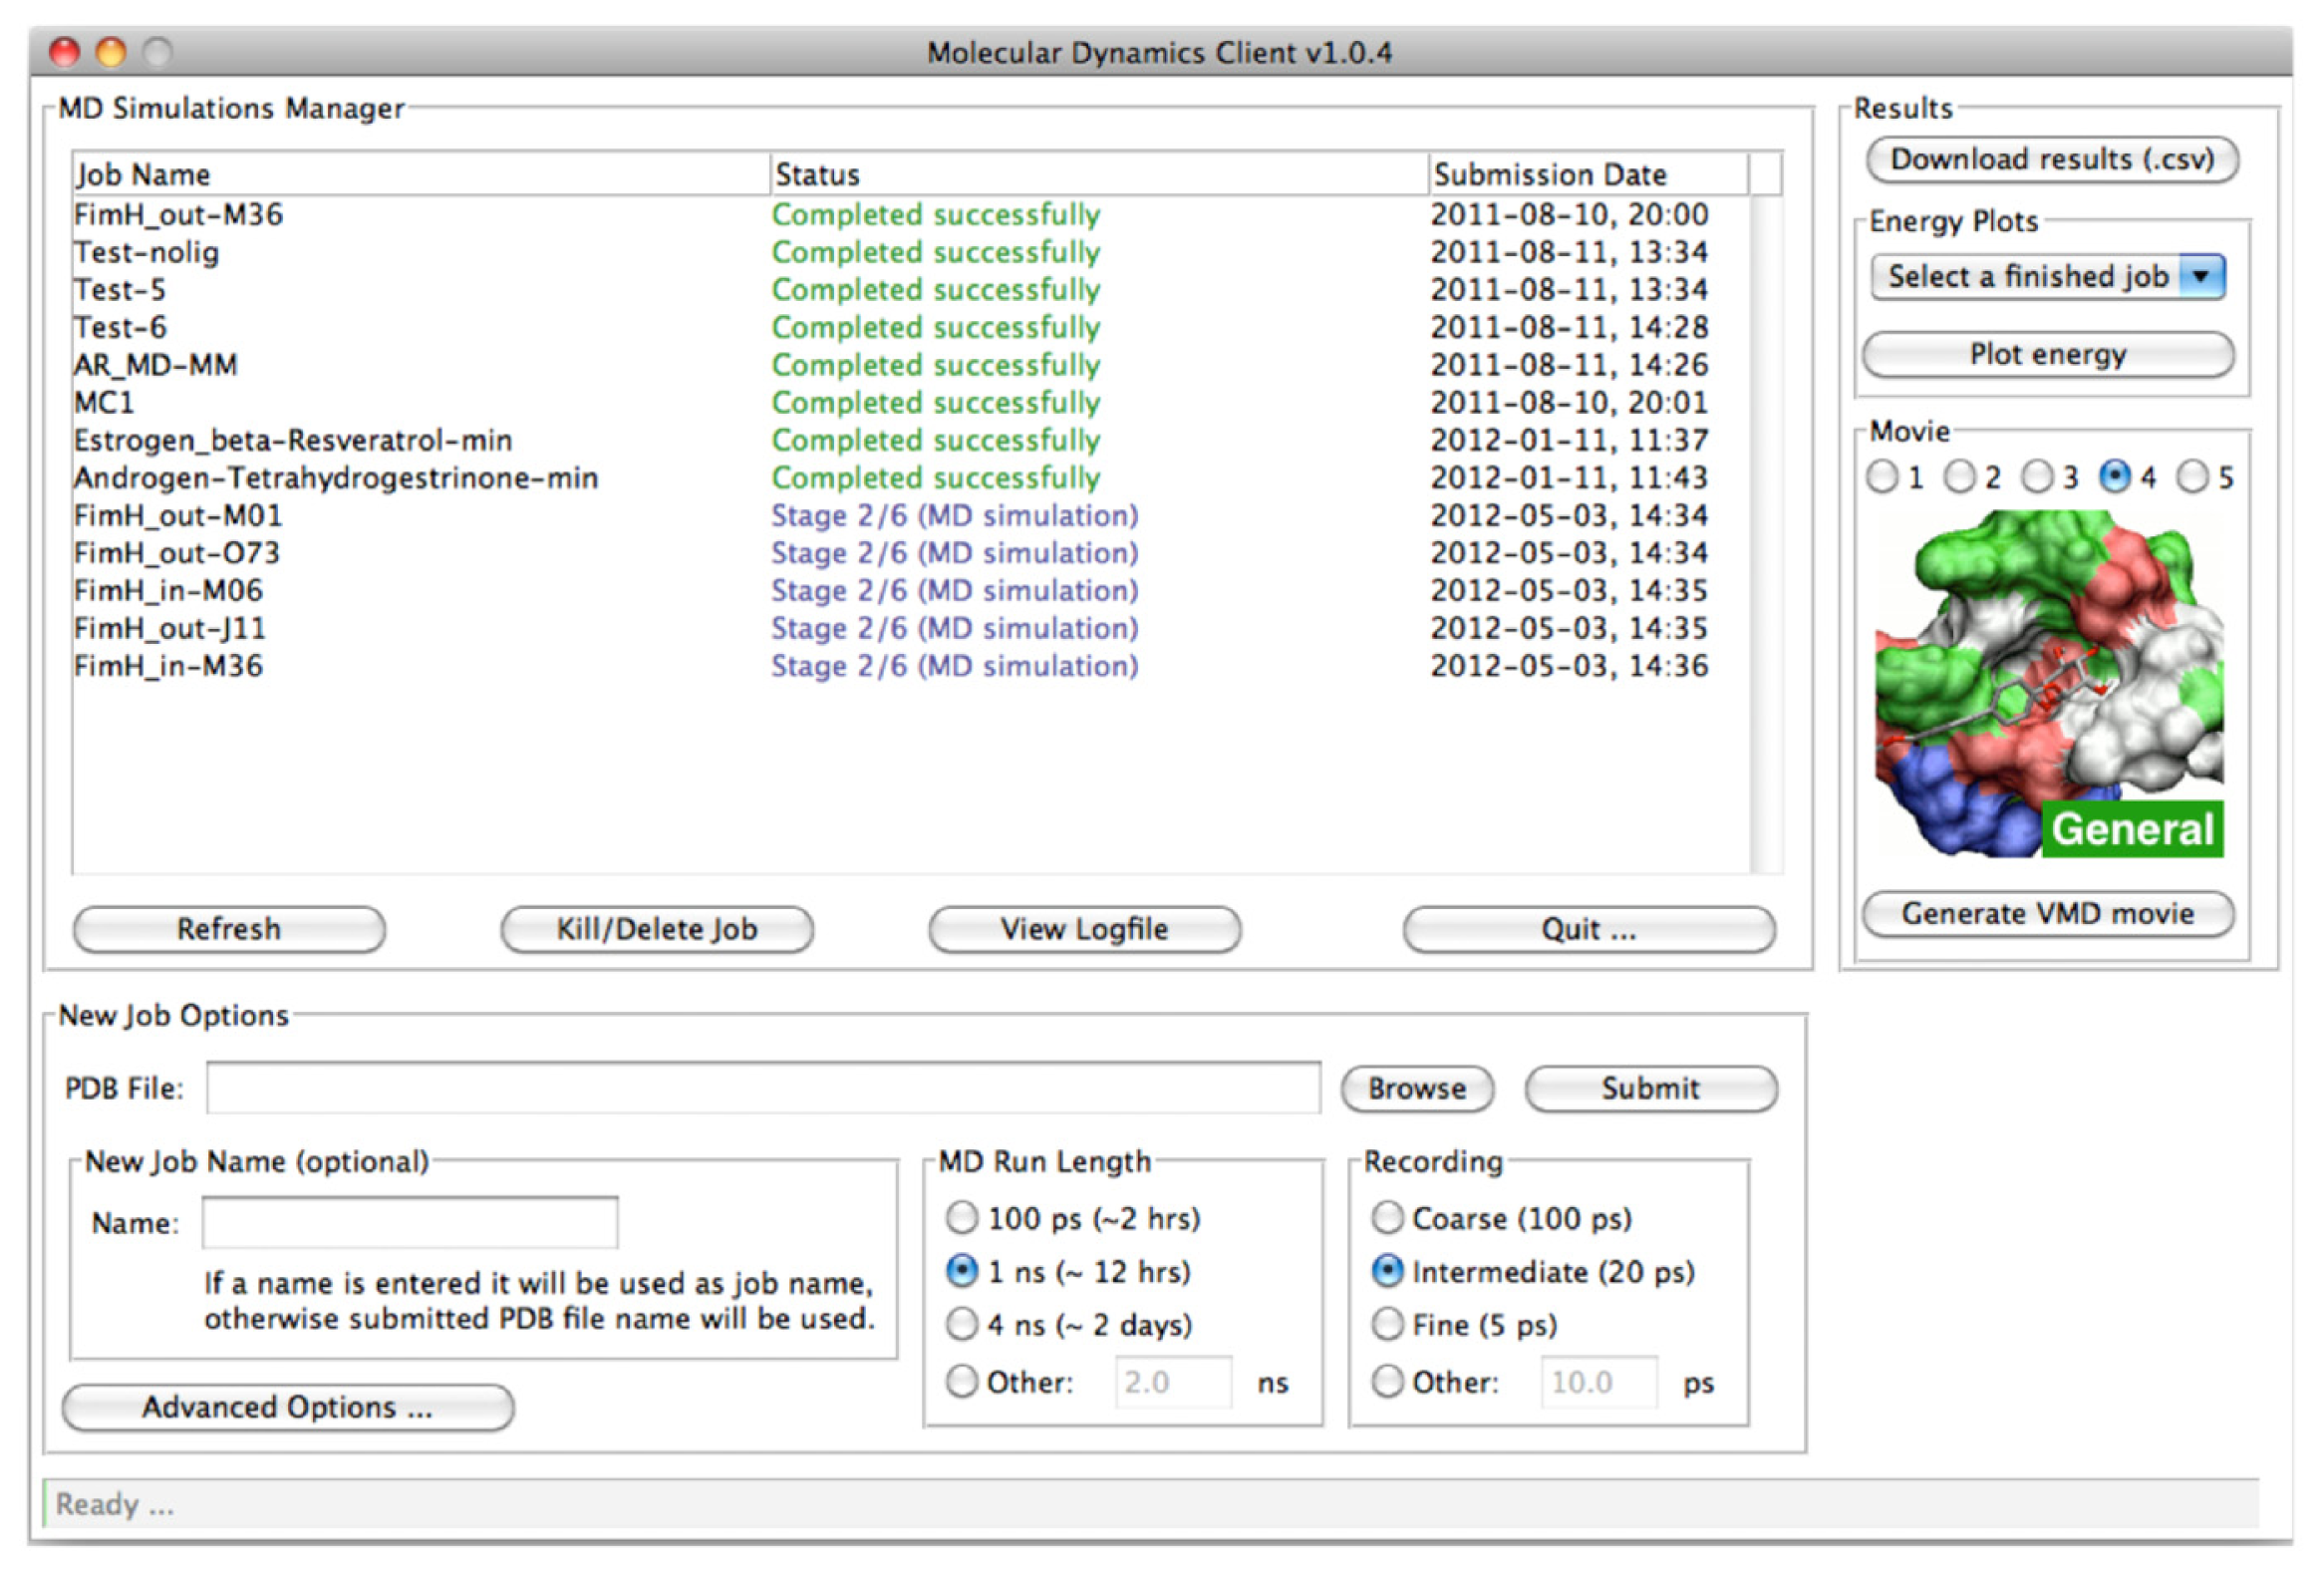
2.2.1. The MD Client Interface
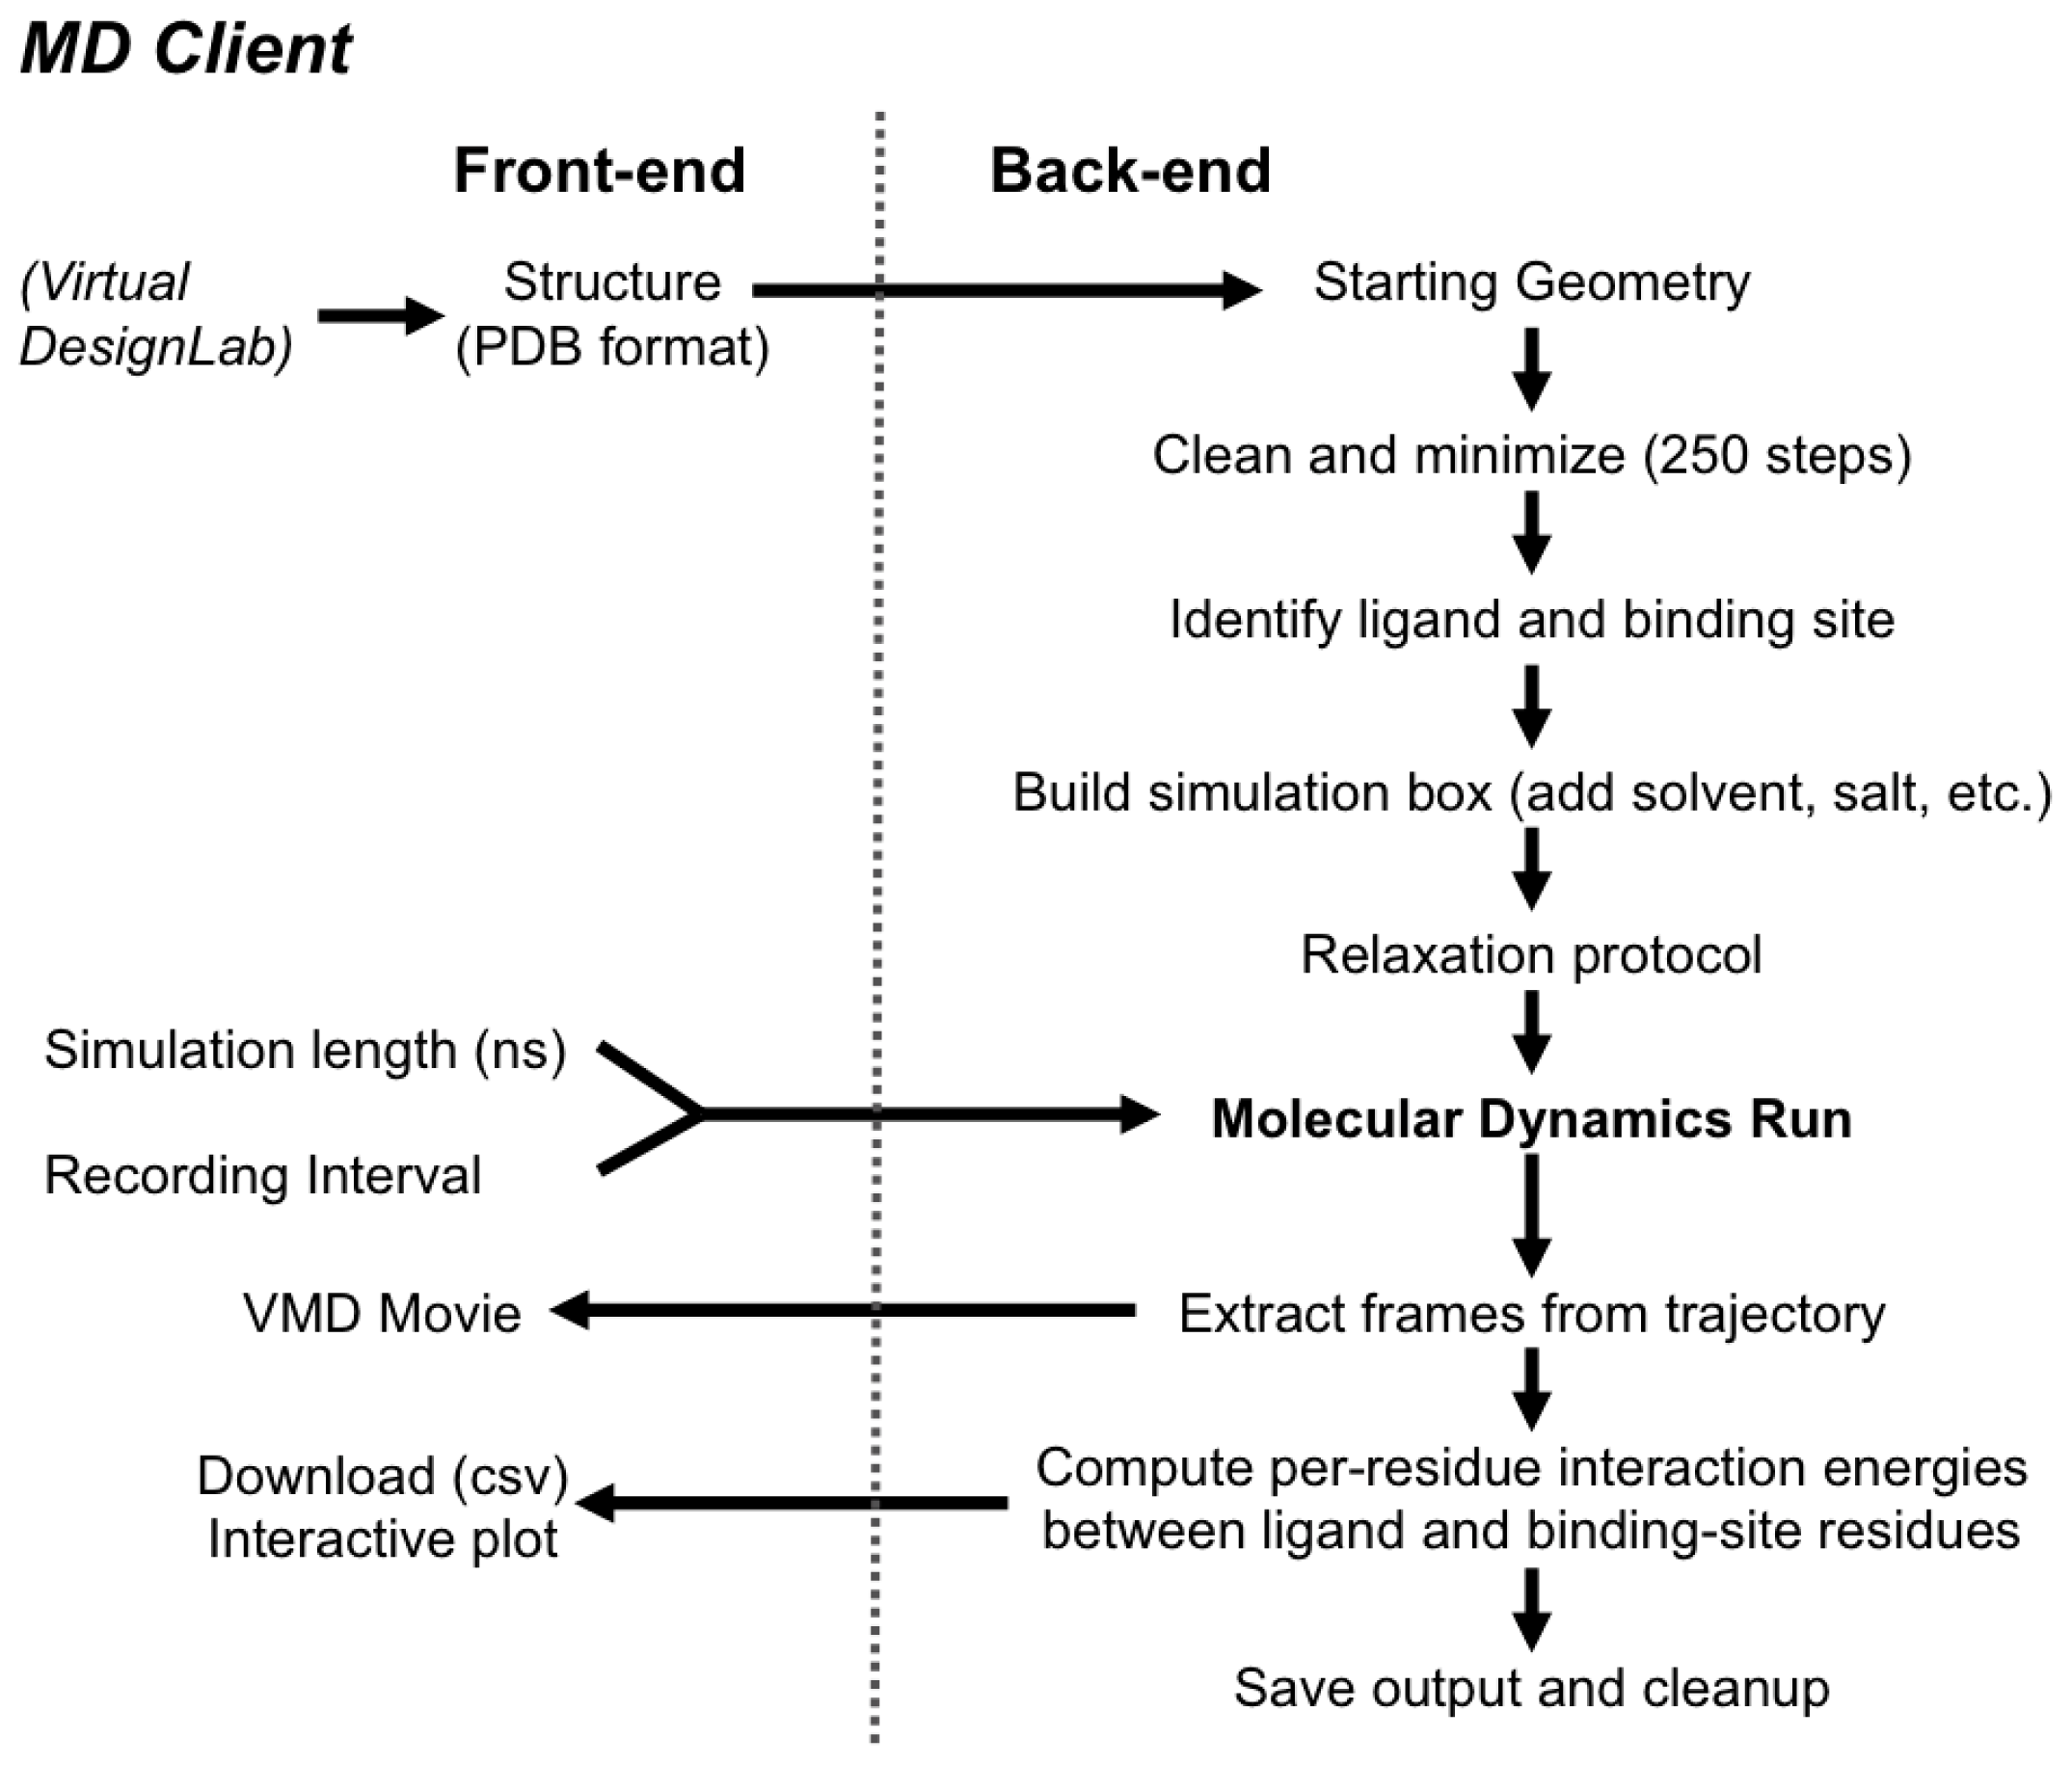
2.2.2. The MD Client Back-end
3. Results and Discussion
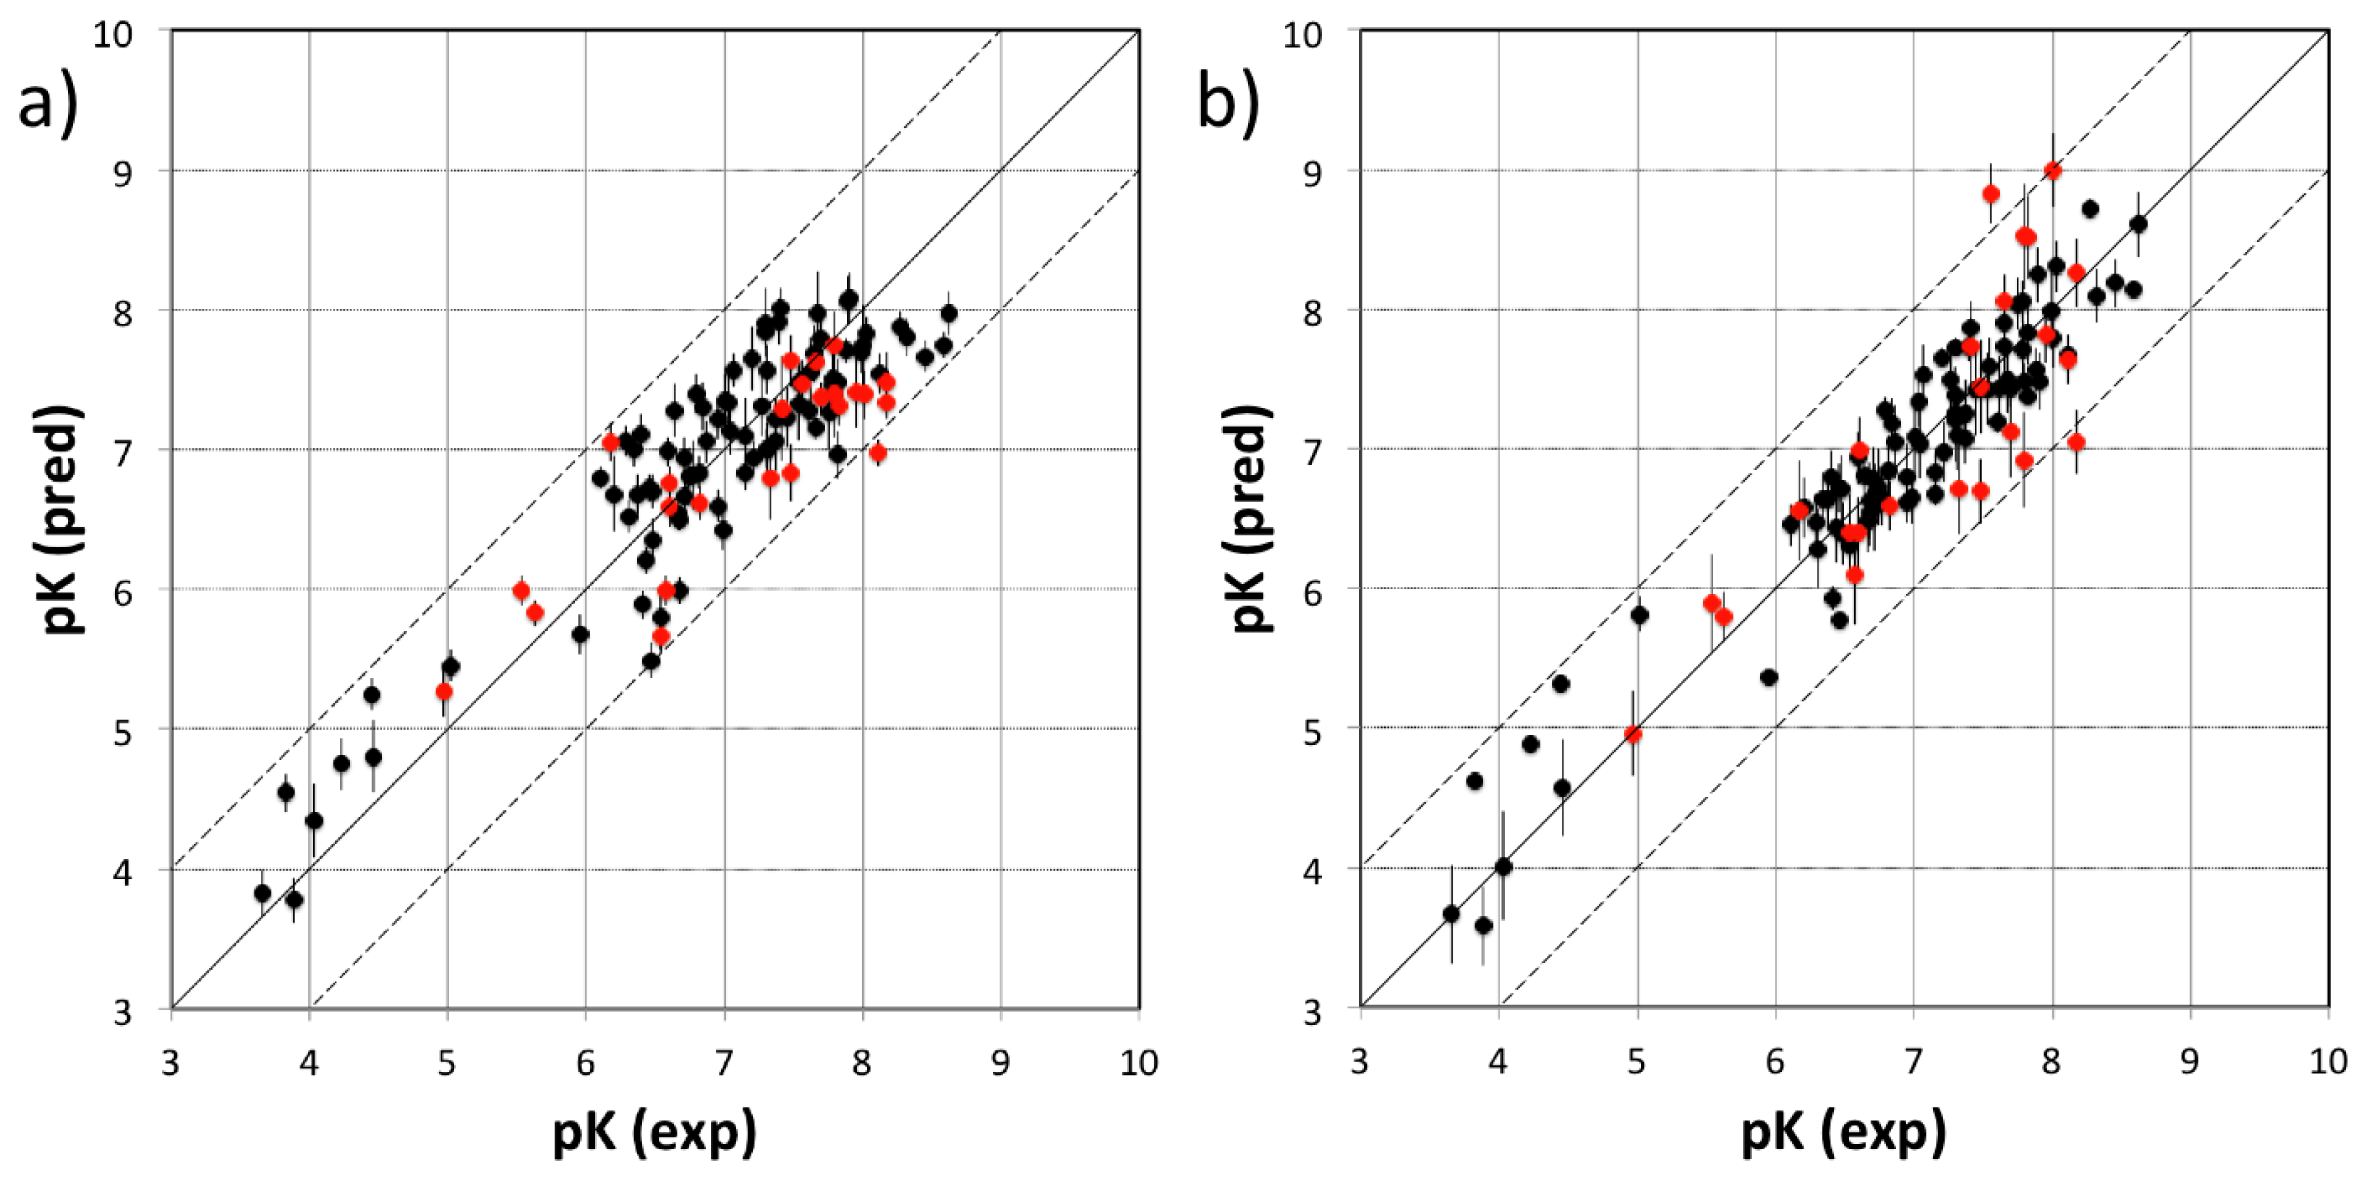
3.1. VirtualDesignLab
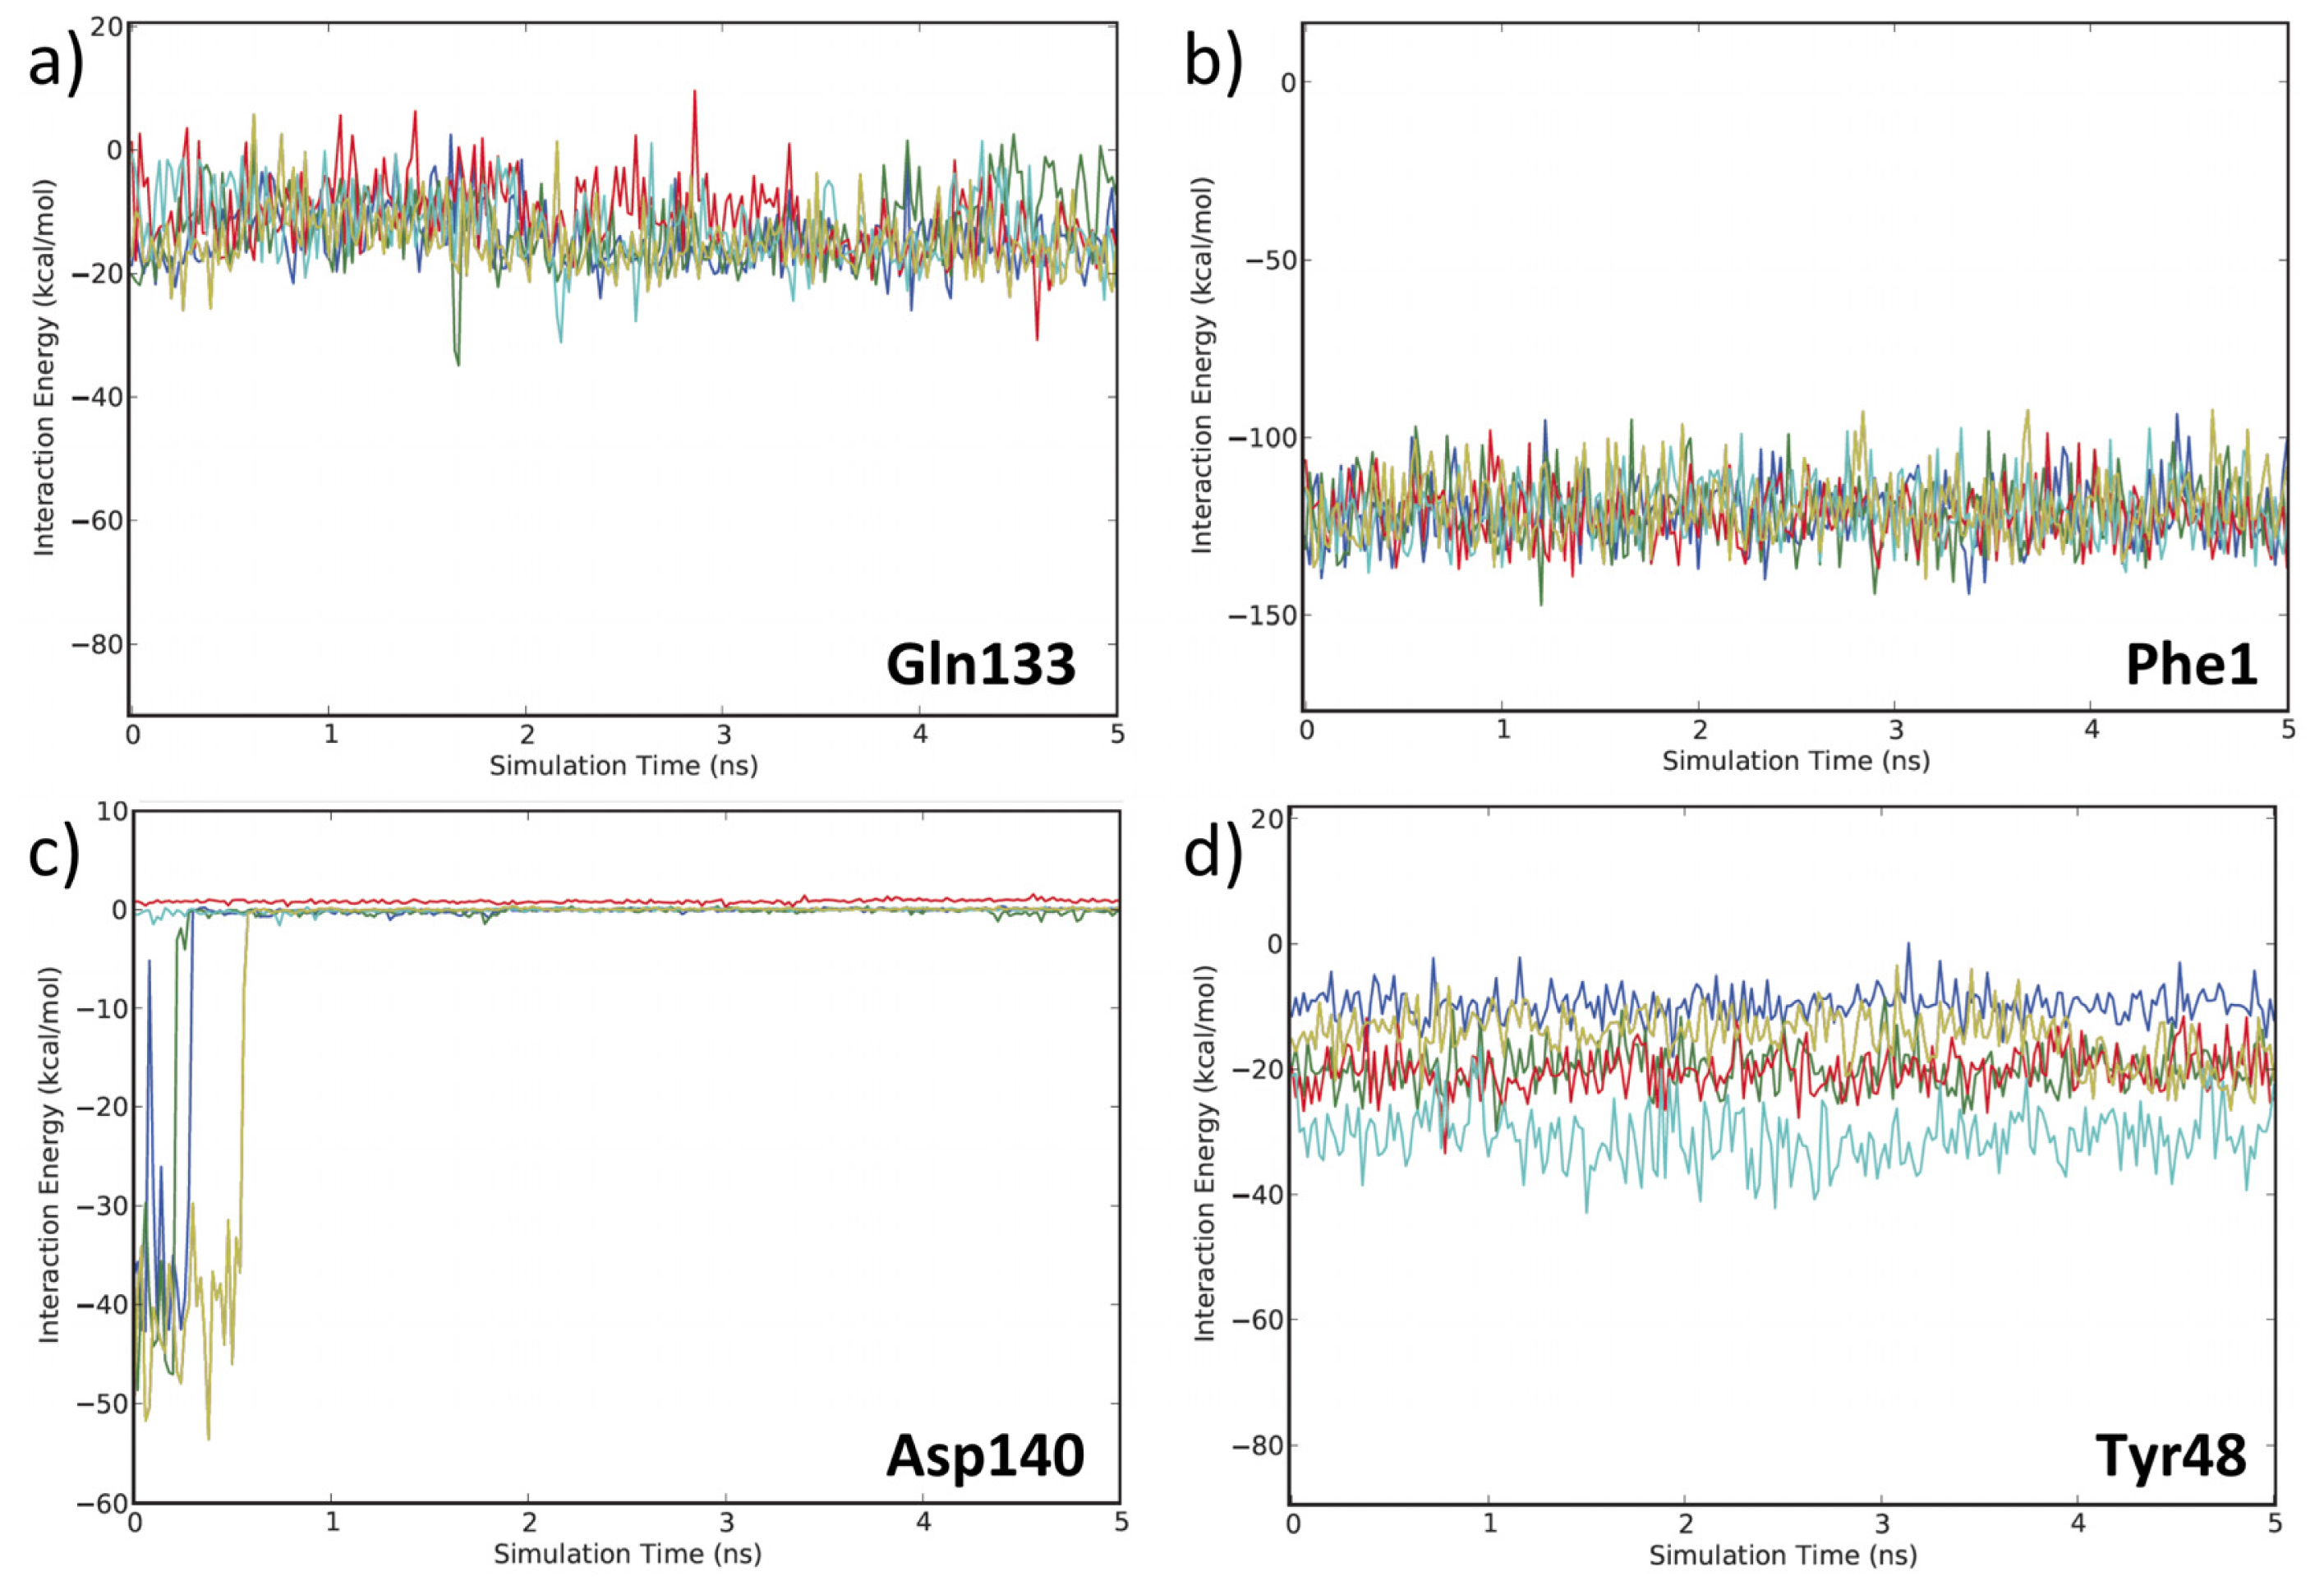
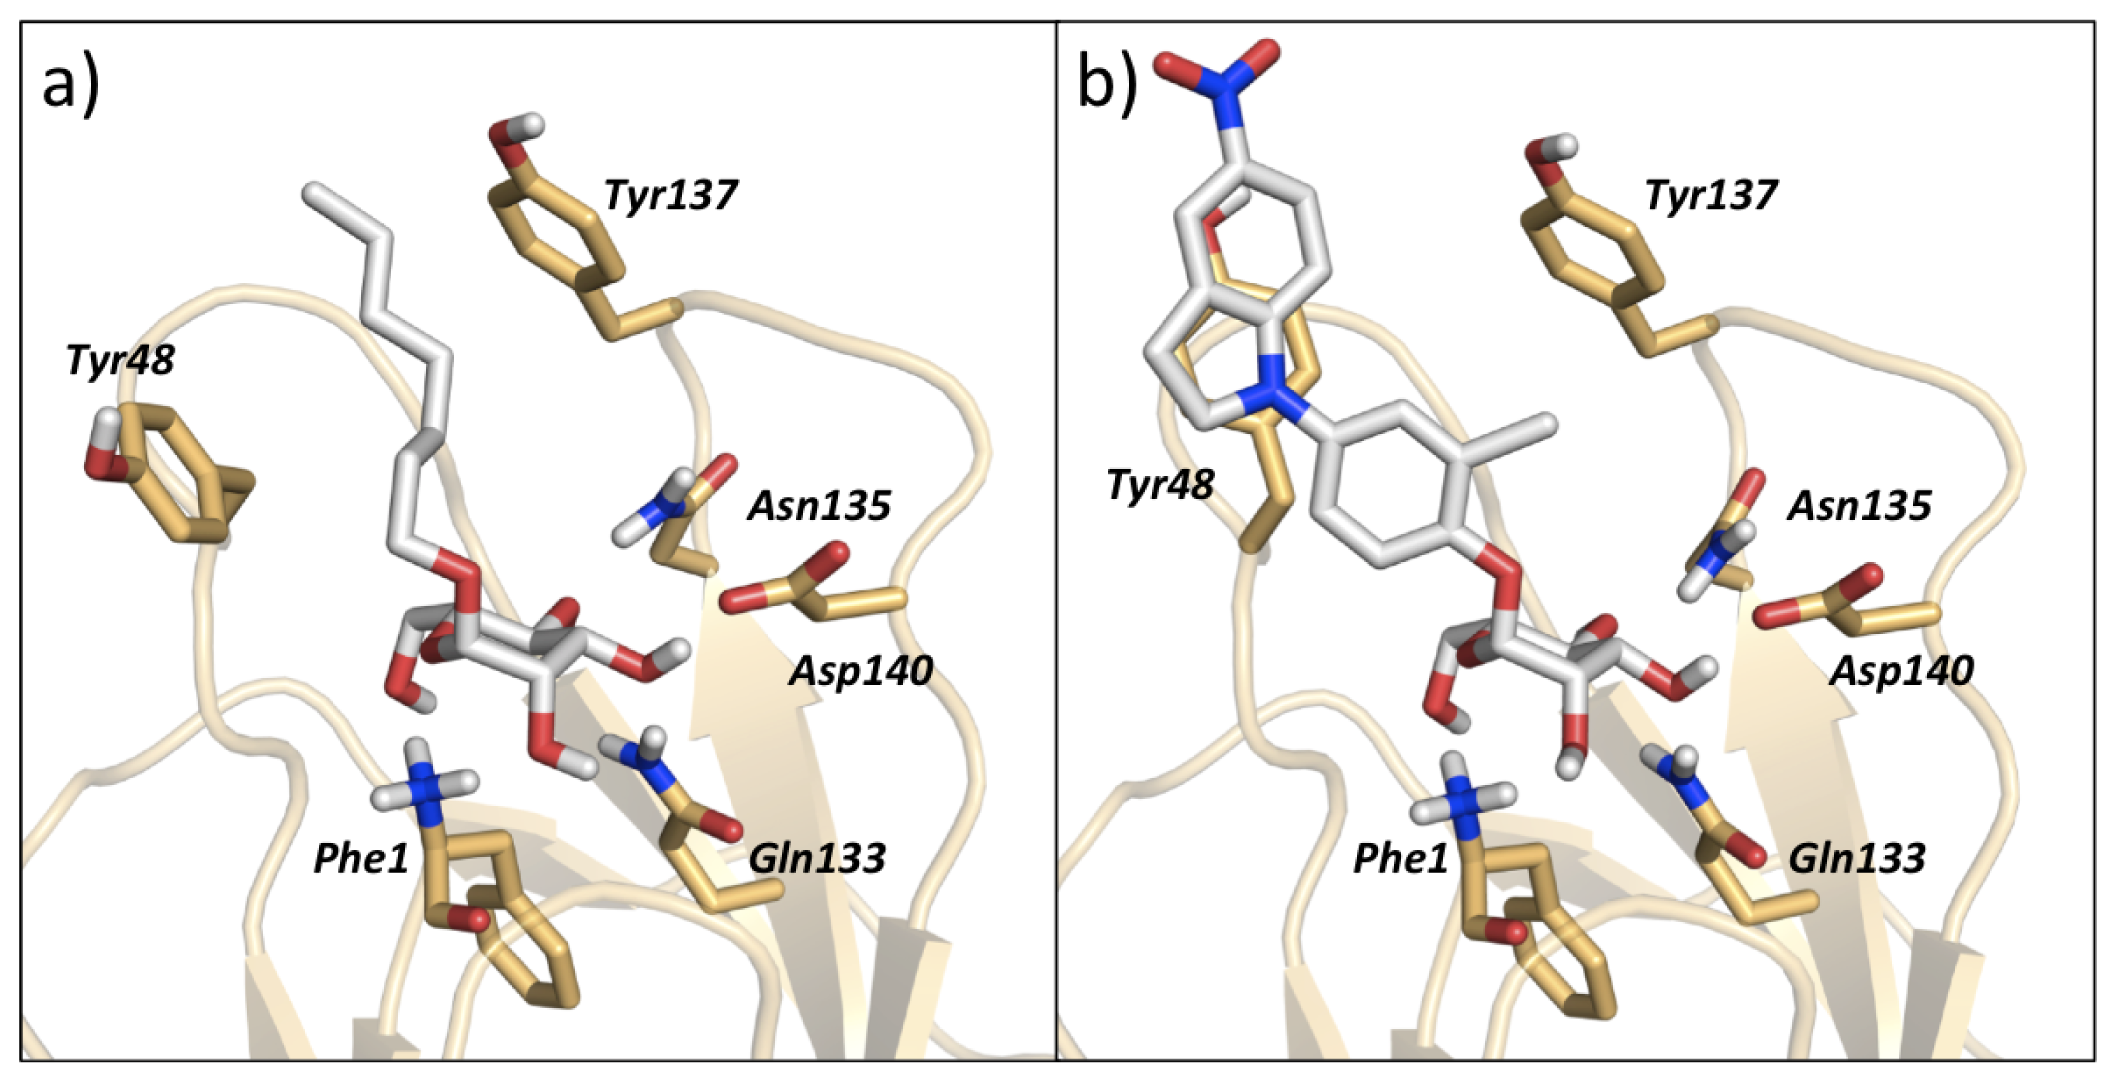
3.2. MD Client
4. Software Extension/Repurposing
4.1. VirtualDesignLab
4.2. MD Client
5. Conclusions
Supplementary Information
ijms-14-00684-s001.pdfAcknowledgments
- Conflict of InterestThe authors declare no conflict of interest.
References
- Bottegoni, G. Protein-ligand docking. Front. Biosci 2012, 17, 2289–2306. [Google Scholar]
- Kitchen, D.B.; Decornez, H.; Furr, J.R.; Bajorath, J. Docking and scoring in virtual screening for drug discovery: Methods and applications. Nat. Rev. Drug Discov 2004, 3, 935–949. [Google Scholar]
- Nantasenamat, C.; Isarankura-Na-Ayudhya, C.; Naenna, T.; Prachayasittikul, V. A practical overview of Quantitative Structure-Activity Relationship. EXCLI Journal 2009, 8, 74–88. [Google Scholar]
- Verma, J.; Khedkar, V.M.; Coutinho, E.C. 3D-QSAR in drug design—A review. Curr. Top. Med. Chem 2010, 10, 95–115. [Google Scholar]
- Karplus, M.; McCammon, J.A. Molecular dynamics simulations of biomolecules. Nat. Struct. Biol 2002, 9, 646–652. [Google Scholar]
- Cheatham, T.E.; Kollman, P.A. Molecular dynamics simulation of nucleic acids. Annu. Rev. Phys. Chem 2000, 51, 435–471. [Google Scholar]
- Alonso, H.; Bliznyuk, A.A.; Gready, J.E. Combining docking and molecular dynamic simulations in drug design. Med. Res. Rev 2006, 26, 531–568. [Google Scholar]
- Rapaport, D.C. The Art of Molecular Dynamics Simulation; Cambridge University Press: Cambridge, UK, 2004; pp. 1–10. [Google Scholar]
- Törnroth-Horsefield, S.; Wang, Y.; Hedfalk, K.; Johanson, U.; Karlsson, M.; Tajkhorshid, E.; Neutze, R.; Kjellbom, P. Structural mechanism of plant aquaporin gating. Nature 2006, 439, 688–694. [Google Scholar]
- Beckstein, O.; Tai, K.; Sansom, M.S. Not ions alone: Barriers to ion permeation in nanopores and channels. J. Am. Chem. Soc 2007, 126, 14694–14695. [Google Scholar]
- Berendsen, H.J.C. Simulating the Physical World: Hierarchical Modeling from Quantum Mechanics to Fluid Dynamics; Cambridge University Press: Cambridge, UK, 2007; p. 624. [Google Scholar]
- Muegge, I. Synergies of virtual screening approaches. Mini Rev. Med. Chem 2008, 8, 927–933. [Google Scholar]
- Kirchmair, J.; Distinto, S.; Schuster, D.; Spitzer, G.; Langer, T.; Wolber, G. Enhancing drug discovery through in silico screening: Strategies to increase true positives retrieval rates. Curr. Med. Chem 2008, 15, 2040–2053. [Google Scholar]
- Schrödinger Suite. Available online: http://www.schrodinger.com accessed on 12 December 2012.
- Accelrys Discovery Studio. Available online: http://accelrys.com/products/discovery-studio accessed on 12 December 2012.
- SYBYL-X Suite. Available online: http://tripos.com accessed on 12 December 2012.
- Molecular Operating Environment. Available online: http://www.chemcomp.com accessed on 12 December 2012.
- Morris, G.M.; Goodsell, D.S.; Halliday, R.S.; Huey, R.; Hart, W.E.; Belew, R.K.; Olson, A.J. Automated docking using a Lamarckian genetic algorithm and an empirical binding free energy function. J. Comput. Chem 1998, 19, 1639–1662. [Google Scholar]
- Vedani, A.; Dobler, M. 5D-QSAR: The key for simulating induced fit? J. Med. Chem 2002, 45, 2139–2149. [Google Scholar]
- Bowers, K.J.; Chow, E.; Xu, H.; Dror, R.O.; Eastwood, M.P.; Gregersen, B.A.; Klepeis, J.L.; Kolossvary, I.; Moraes, M.A.; Sacerdoti, F.D.; et al. Scalable Algorithms for Molecular Dynamics Simulations on Commodity Clusters. Proceedings of the ACM/IEEE Conference on Supercomputing (SC06), Tampa, FL, USA, 11–17 November 2006.
- Irwin, J.J.; Shoichet, B.K.; Mysinger, M.M.; Huang, N.; Colizzi, F.; Wassam, P.; Cao, Y. Automated docking screens: A feasibility study. J. Med. Chem 2009, 52, 5712–5720. [Google Scholar]
- Klein, T.; Abgottspon, D.; Wittwer, M.; Rabbani, S.; Herold, J.; Jiang, X.; Kleeb, S.; Luthi, C.; Scharenberg, M.; Bezencon, J.; et al. FimH Antagonists for the oral treatment of urinary tract infections: From design and synthesis to in vitro and in vivo evaluation. J. Med. Chem. 2010, 53, 8627–8641. [Google Scholar]
- Schwardt, O.; Rabbani, S.; Hartmann, M.; Abgottspon, D.; Wittwer, M.; Kleeb, S.; Zalewski, A.; Smieško, M.; Cutting, B.; Ernst, B. Design, synthesis and biological evaluation of mannosyl triazoles as FimH antagonists. Bioorg. Med. Chem 2011, 19, 6454–6473. [Google Scholar]
- Jiang, X.; Abgottspon, D.; Kleeb, S.; Rabbani, S.; Scharenberg, M.; Wittwer, M.; Haug, M.; Schwardt, O.; Ernst, B. Antiadhesion therapy for urinary tract infections—A balanced PK/PD profile proved to be key for success. J. Med. Chem 2012, 55, 4700–4713. [Google Scholar]
- QikProp, version 3.4; Schrödinger, LLC: New York, NY, USA, 2011.
- Vedani, A.; Dobler, M.; Smieško, M. VirtualToxLab—A platform for estimating the toxic potential of drugs, chemicals and natural products. Toxicol. Appl. Pharmacol 2012, 261, 142–153. [Google Scholar]
- VirtualToxLab Online Documentation. Available online: http://www.biograf.ch/downloads/VirtualToxLab.pdf accessed on 12 December 2012.
- MacroModel, version 9.9; Schrödinger, LLC: New York, NY, USA, 2011.
- Storer, J.W.; Giesen, D.J.; Cramer, C.J.; Truhlar, D.G. Class IV charge models: A new semiempirical approach in quantum chemistry. J. Comput. Aided Mol. Des 1995, 9, 87–110. [Google Scholar]
- ConfGen, version 2.1; Schrödinger, LLC: New York, NY, USA, 2009.
- Smieško, M. Personal communication, University of Basel: Basel, Switzerland, 2012.
- Rossato, G.; Ernst, B.; Smiesko, M.; Spreafico, M.; Vedani, A. Probing small-molecule binding to cytochrome P450 2D6 and 2C9: An in silico protocol for generating toxicity alerts. ChemMedChem 2010, 5, 2088–2101. [Google Scholar]
- Han, Z.; Pinkner, J.S.; Ford, B.; Obermann, R.; Nolan, W.; Wildman, S.A.; Hobbs, D.; Ellenberger, T.; Cusumano, C.K.; Hultgren, S.J.; et al. Structure-based drug design and optimization of mannoside bacterial FimH antagonists. J. Med. Chem 2010, 53, 4779–4792. [Google Scholar]
- Maestro, version 9.2; Schrödinger, LLC: New York, NY, USA, 2011.
- Vedani, A.; Dobler, M.; Lill, M.A. Combining protein modeling and 6D-QSAR. Simulating the binding of structurally diverse ligands to the estrogen receptor. J. Med. Chem 2005, 48, 3700–3703. [Google Scholar]
- Vedani, A.; Huhta, D.W. A new force field for modeling metalloproteins. J. Amer. Chem. Soc 1990, 112, 4759–4767. [Google Scholar]
- Rojewska, D.; Elber, R. Molecular dynamics study of secondary structure motions in proteins: application to myohemerythrin. Proteins 1990, 7, 265–279. [Google Scholar]
- Wan, S.; Flower, D.R.; Coveney, P.V. Toward an atomistic understanding of the immune synapse: Large-scale molecular dynamics simulation of a membrane-embedded TCR-pMHC-CD4 complex. Mol. Immunol 2008, 45, 1221–1230. [Google Scholar]
- Knapp, B.; Omasits, U.; Bohle, B.; Maillere, B.; Ebner, C.; Schreiner, W.; Jahn-Schmid, B. 3-Layer-based analysis of peptide-MHC interaction: In silico prediction, peptide binding affinity and T cell activation in a relevant allergen-specific model. Mol. Immunol 2009, 46, 1839–1844. [Google Scholar]
- Coll, E.P.; Kandt, C.; Bird, D.A.; Samuels, A.L.; Tieleman, D.P. The distribution and conformation of very long-chain plant wax components in a lipid bilayer. J. Phys. Chem. B 2007, 111, 8702–8704. [Google Scholar]
- Kandt, C.; Ash, W.L.; Tieleman, D.P. Setting up and running molecular dynamics simulations of membrane proteins. Methods 2007, 41, 475–488. [Google Scholar]
- Heller, H.; Schaefer, M.; Schulten, K. Molecular dynamics simulation of a bilayer of 200 lipids in the gel and in the liquid crystal phase. J. Phys. Chem 1993, 97, 8343–8360. [Google Scholar]
- Miller, J.L.; Kollman, P.A. Theoretical studies of an exceptionally stable RNA tetraloop: Observation of convergence from an incorrect NMR structure to the correct one using unrestrained molecular dynamics. J. Mol. Biol 1997, 270, 436–450. [Google Scholar]
- Luo, J.; Bruice, T.C. Nanosecond molecular dynamics of hybrid triplex and duplex of polycation deoxyribonucleic guanidine strands with a complimentary DNA strand. J. Amer. Chem. Soc 1998, 120, 1115–1123. [Google Scholar]
- Case, D.A.; Cheatham, T.E., III; Darden, T.; Gohlke, H.; Luo, R.; Merz, K.M., Jr; Onufriev, A.; Simmerling, C.; Wang, B.; Woods, R.J. The Amber biomolecular simulation programs. J. Comput. Chem. 2005, 26, 1668–1688. [Google Scholar]
- Brooks, B.R.; Bruccoleri, R.E.; Olafson, B.D.; States, D.J.; Swaminathan, S.; Karplus, M. CHARMM: A program for macromolecular energy, minimization and dynamics calculations. J. Comput. Chem 1983, 4, 187–217. [Google Scholar]
- Christen, M.; Hünenberger, P.H.; Bakowies, D.; Baron, R.; Bürgi, R.; Geerke, D.P.; Heinz, T.N.; Kastenholz, M.A.; Kräutler, V.; Oostenbrink, C.; et al. The GROMOS software for biomolecular simulation: GROMOS05. J. Comp. Chem 2005, 26, 1719–1751. [Google Scholar]
- Hess, B.; Kutzner, C.; van der Spoel, D.; Lindahl, E. GROMACS 4: Algorithms for highly efficient, load-balanced and scalable molecular simulation. J. Chem. Theory Comput 2008, 4, 435–447. [Google Scholar]
- Berman, H.M.; Westbrook, J.; Feng, Z.; Gilliland, G.; Bhat, T.N.; Weissig, H.; Shindyalov, I.N.; Bourne, P.E. The protein data bank. Nucleic Acids Res 2000, 28, 235–242. [Google Scholar]
- Humphrey, W.; Dalke, A.; Schulten, K. VMD: Visual molecular dynamics. J. Mol. Graph 1996, 14, 33–38. [Google Scholar]
- Desmond Molecular Dynamics System, version 3.1; D. E. Shaw Research: New York, NY, USA, 2012.
- Maestro-Desmond Interoperability Tools, version 3.1; Schrödinger: New York, NY, USA, 2012.
- Rabbani, S.; Jiang, X.; Schwardt, O.; Ernst, B. Expression of the carbohydrate recognition domain of FimH and development of a competitive binding assay. Anal. Biochem. 2010, 407, 188–195. [Google Scholar]
- Lill, M.A.; Vedani, A.; Dobler, M. Raptor: Combining dual-shell representation, induced-fit simulation and hydrophobicity scoring in receptor modeling: Application toward the simulation of structurally diverse ligand sets. J. Med. Chem 2004, 47, 6174–6186. [Google Scholar]
- Satyanarayanajois, S.D.; Hill, R.A. Medicinal chemistry for 2020. Future Med. Chem 2011, 3, 1765–1786. [Google Scholar]
- Ritchie, T.J.; McLay, I.M. Should medicinal chemists do molecular modelling? Drug Discov. Today 2012, 17, 534–537. [Google Scholar]
- Open VirtualToxLab. Available online: http://www.virtualtoxlab.org accessed on 12 December 2012.


 | |||||||||
|---|---|---|---|---|---|---|---|---|---|
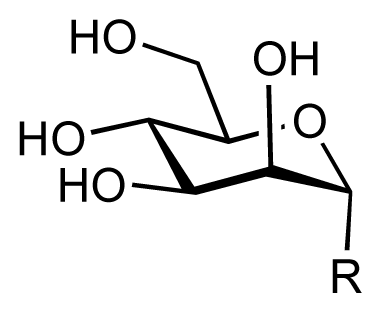
| R | Exp. affinity | Pred. affinity | Residual | R | Exp. affinity | Pred. affinity | Residual | ||
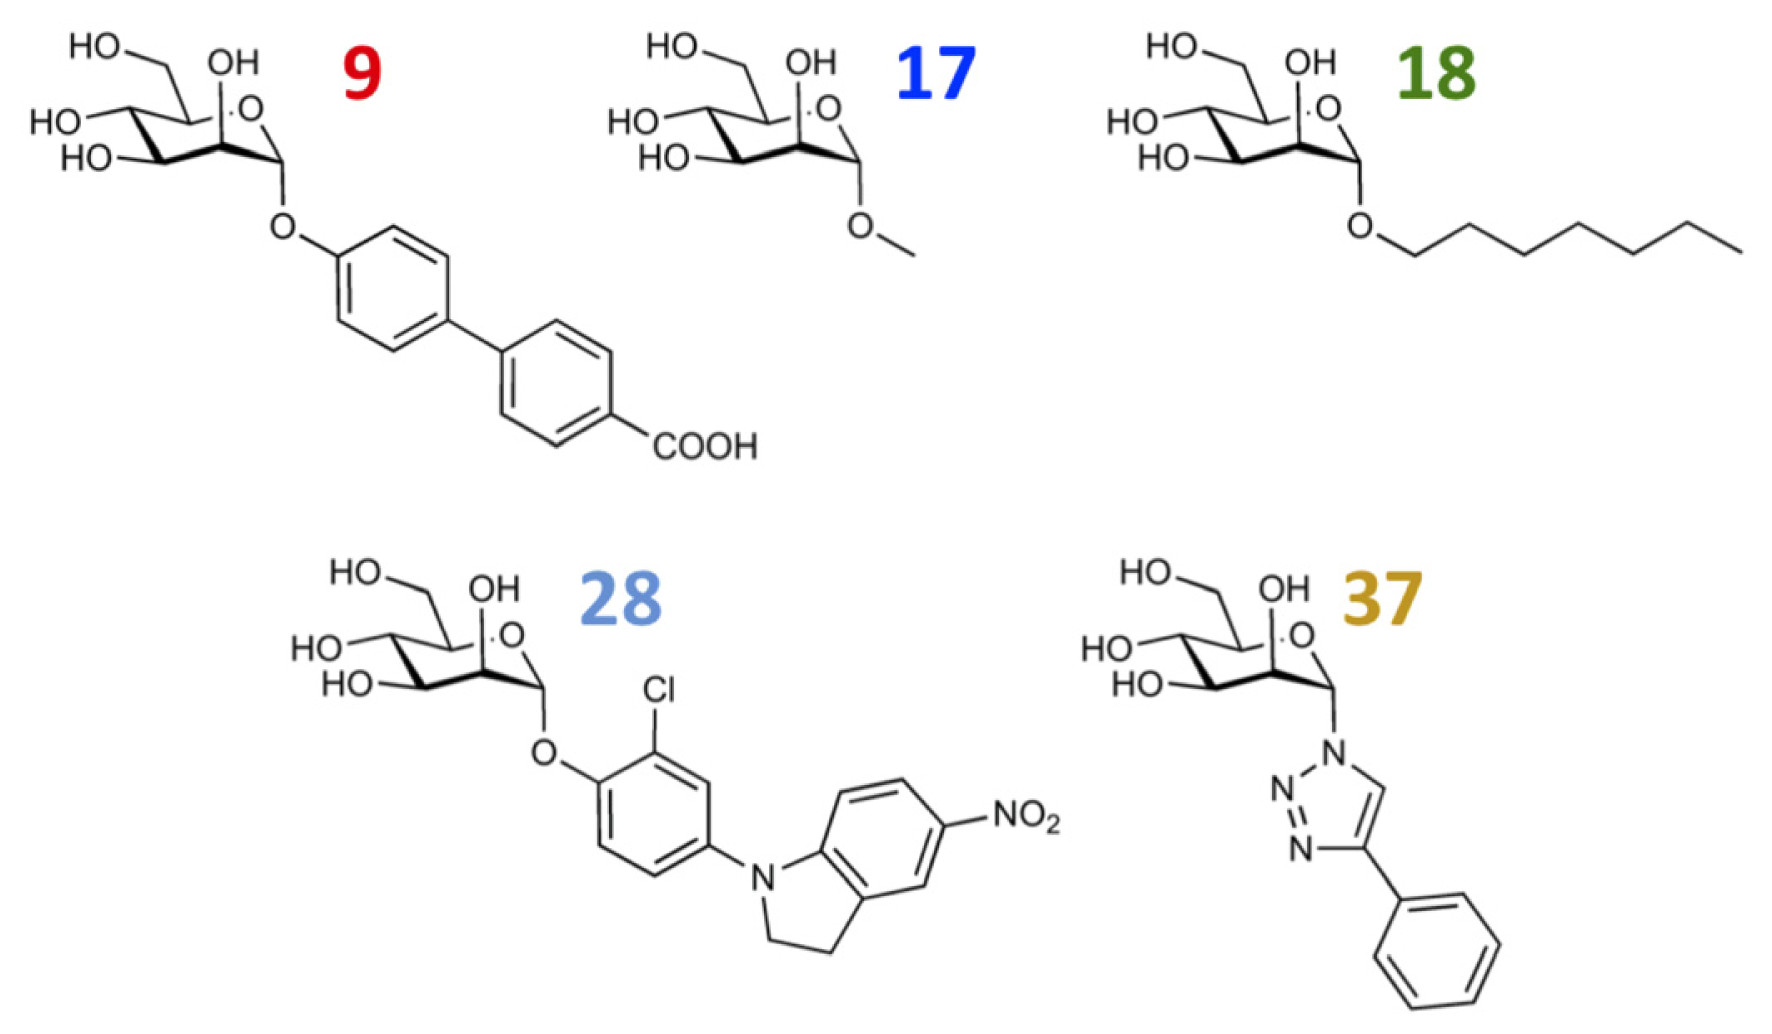
| 1 |  | 7.3 | 7.6 | 0.3 | 2 |  | 7.0 | 7.4 | 0.4 |
| 3 |  | 7.5 | 7.5 | 0 | 4 |  | 6.7 | 6.5 | −0.2 |
| 5 | 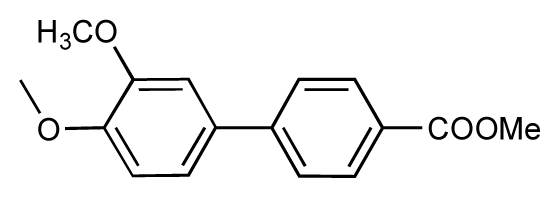 | 8.5 | 7.7 | −0.8 | 6 |  | 8.6 | 7.8 | −0.8 |
| 7 | 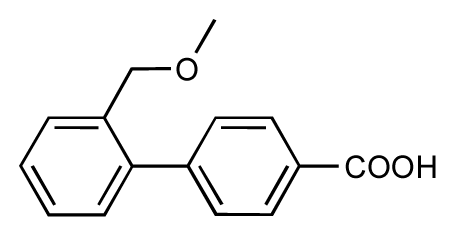 | 6.2 | 6.7 | 0.5 | 8 | 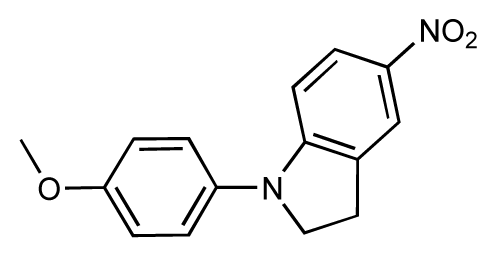 | 7.8 | 7.0 | −0.8 |
| 9 | 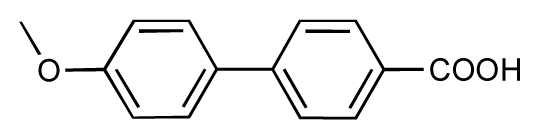 | 8.0 | 7.4 | −0.6 | 10 |  | 7.5 | 7.2 | −0.3 |
| 11 |  | 7.8 | 7.3 | −0.5 | 12 |  | 8.1 | 7.0 | −1.1 |
| 13 |  | 7.8 | 7.5 | −0.3 | 14 |  | 6.6 | 7.0 | 0.4 |
| 15 |  | 6.8 | 6.6 | −0.2 | 16 |  | 6.4 | 6.2 | −0.2 |
| 17 |  | 5.5 | 6.0 | 0.5 | 18 |  | 7.2 | 6.9 | −0.3 |
| 19 |  | 6.2 | 7.1 | 0.9 | 20 |  | 6.4 | 6.7 | 0.3 |
| 21 |  | 6.9 | 7.1 | 0.2 | 22 | 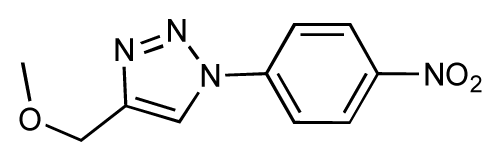 | 6.4 | 7.1 | 0.7 |
| 23 | 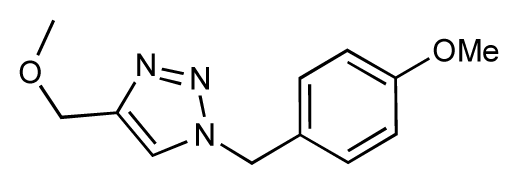 | 6.3 | 7.1 | 0.8 | 24 |  | 6.3 | 7.0 | 0.7 |
| 25 | 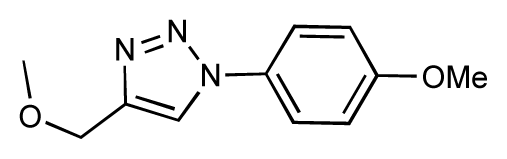 | 6.8 | 7.4 | 0.6 | 26 | 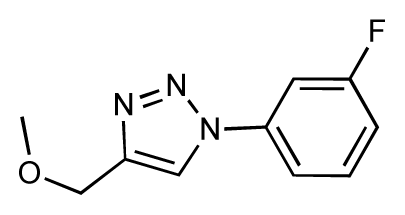 | 6.5 | 6.7 | 0.2 |
| 27 | 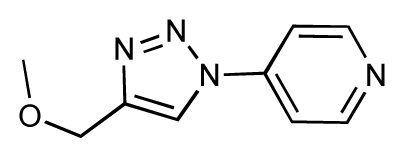 | 7.2 | 6.8 | −0.4 | 28 |  | 8.6 | 8.0 | −0.6 |
| 29 |  | 6.1 | 6.8 | 0.7 | 30 | 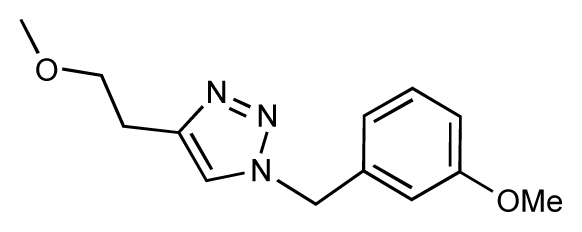 | 6.6 | 7.3 | 0.7 |
| 31 | 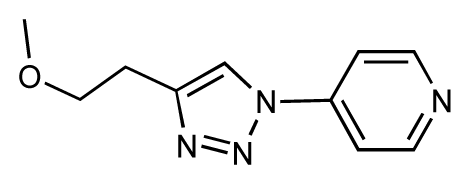 | 6.8 | 6.8 | 0 | 32 |  | 7.0 | 7.2 | 0.2 |
| 33 | 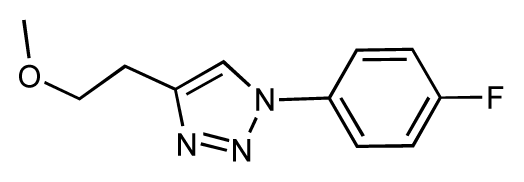 | 6.7 | 6.9 | 0.2 | 34 |  | 6.8 | 6.8 | 0 |
| 35 | 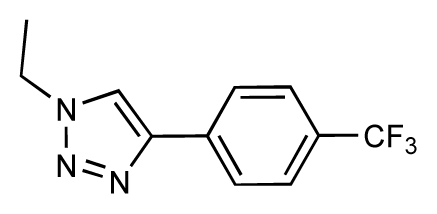 | 6.7 | 6.7 | 0 | 36 | 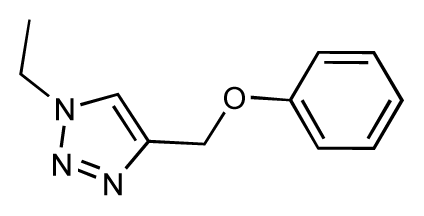 | 6.5 | 6.3 | −0.2 |
| 37 | 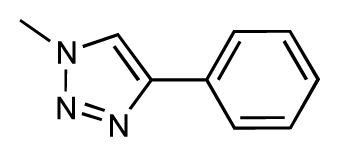 | 6.6 | 6.8 | 0.2 | 38 | 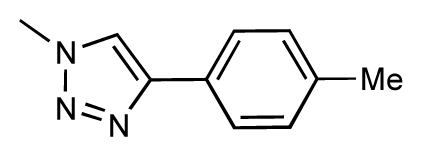 | 6.6 | 6.6 | 0 |
| 39 |  | 6.8 | 7.3 | 0.5 | 40 | 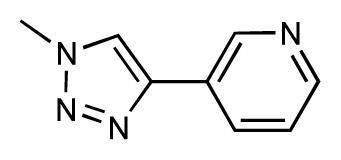 | 6.7 | 6.5 | −0.2 |
| 41 | 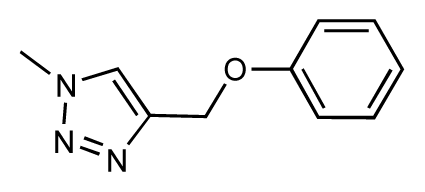 | 6.3 | 6.5 | 0.2 | 42 | 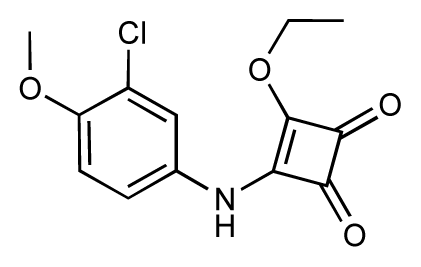 | 8.0 | 7.7 | −0.3 |
| 43 | 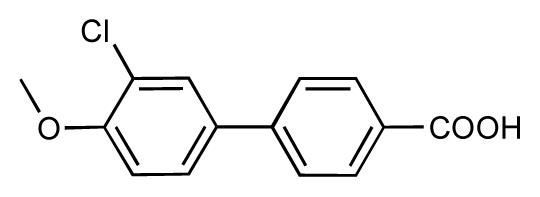 | 8.2 | 7.5 | −0.7 | 44 |  | 7.7 | 7.6 | −0.1 |
| 45 |  | 7.6 | 7.5 | −0.1 | 46 |  | 8.3 | 7.8 | −0.5 |
| 47 |  | 7.7 | 7.4 | −0.3 | 48 |  | 7.4 | 7.3 | −0.1 |
| 49 |  | 7.5 | 7.3 | −0.2 | 50 |  | 7.8 | 7.4 | −0.4 |
| 51 |  | 8.3 | 7.9 | −0.4 | 52 |  | 8.0 | 7.4 | −0.6 |
© 2013 by the authors; licensee Molecular Diversity Preservation International, Basel, Switzerland. This article is an open-access article distributed under the terms and conditions of the Creative Commons Attribution license (http://creativecommons.org/licenses/by/3.0/).
Share and Cite
Eid, S.; Zalewski, A.; Smieško, M.; Ernst, B.; Vedani, A. A Molecular-Modeling Toolbox Aimed at Bridging the Gap between Medicinal Chemistry and Computational Sciences. Int. J. Mol. Sci. 2013, 14, 684-700. https://doi.org/10.3390/ijms14010684
Eid S, Zalewski A, Smieško M, Ernst B, Vedani A. A Molecular-Modeling Toolbox Aimed at Bridging the Gap between Medicinal Chemistry and Computational Sciences. International Journal of Molecular Sciences. 2013; 14(1):684-700. https://doi.org/10.3390/ijms14010684
Chicago/Turabian StyleEid, Sameh, Adam Zalewski, Martin Smieško, Beat Ernst, and Angelo Vedani. 2013. "A Molecular-Modeling Toolbox Aimed at Bridging the Gap between Medicinal Chemistry and Computational Sciences" International Journal of Molecular Sciences 14, no. 1: 684-700. https://doi.org/10.3390/ijms14010684