Defective Generation and Maturation of Dendritic Cells from Monocytes in Colorectal Cancer Patients during the Course of Disease

Abstract
:1. Introduction
2. Results and Discussion
2.1. Patient Characteristics
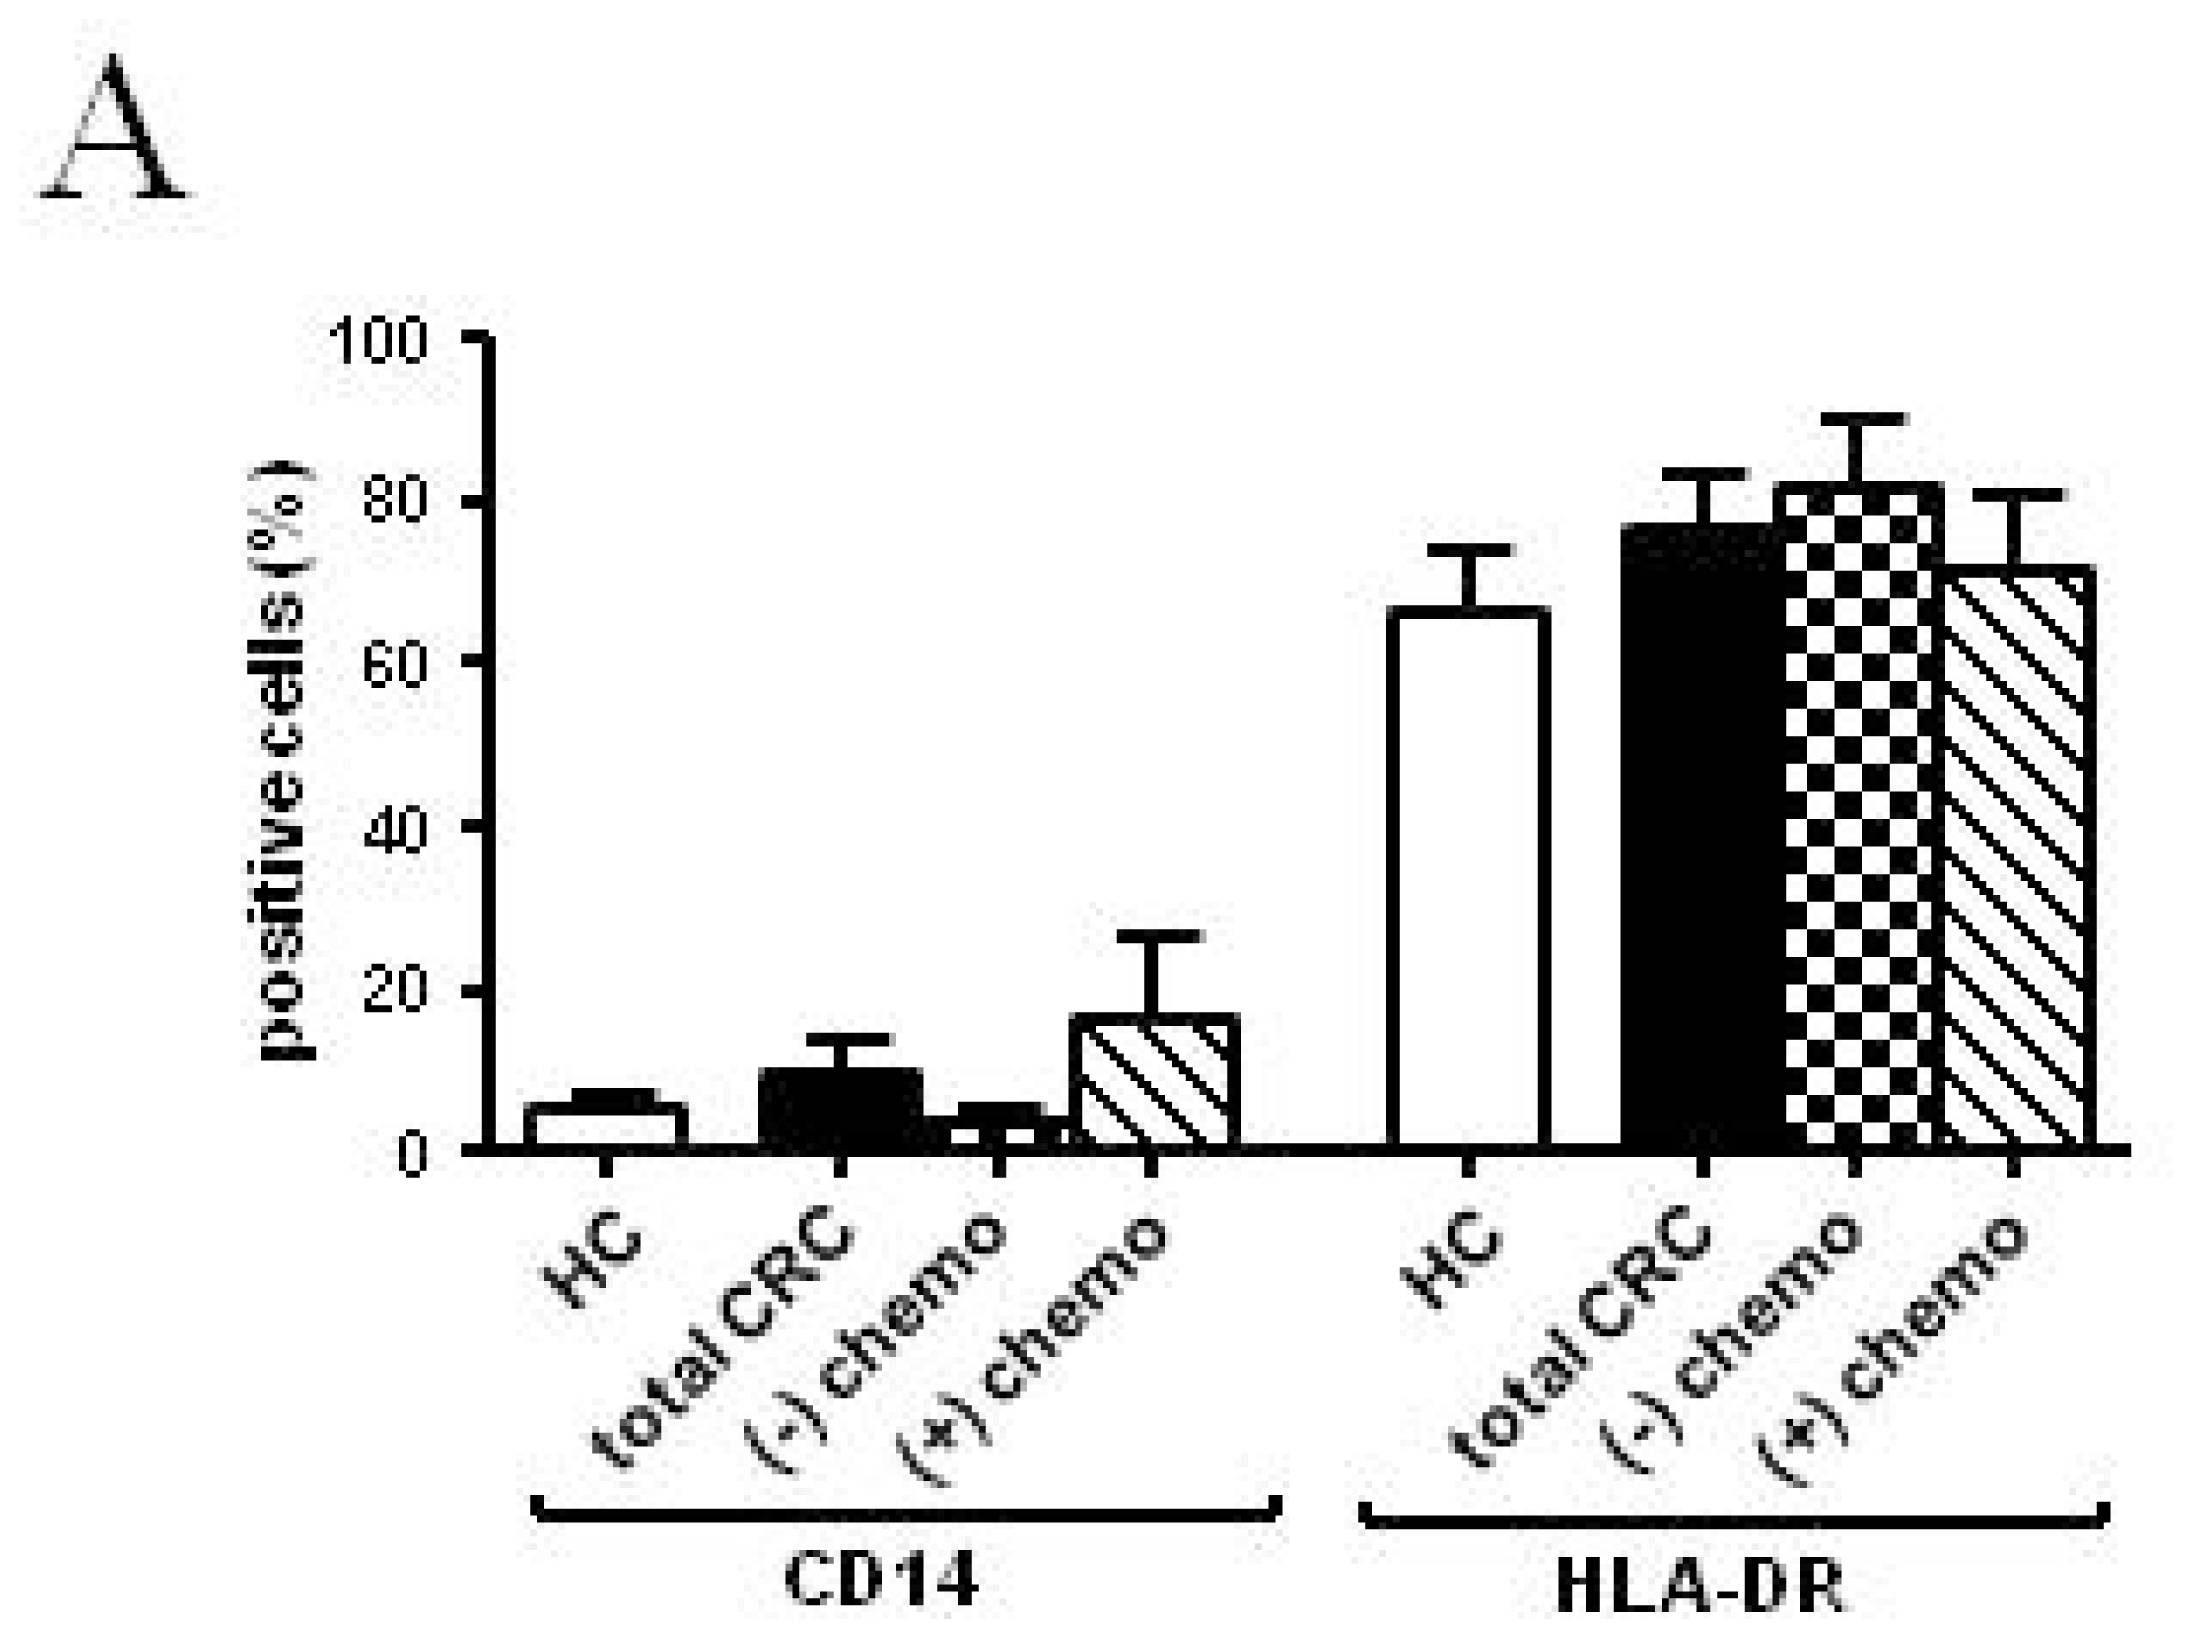
2.2. Phenotypic and Functional Characterizations of MoDCs
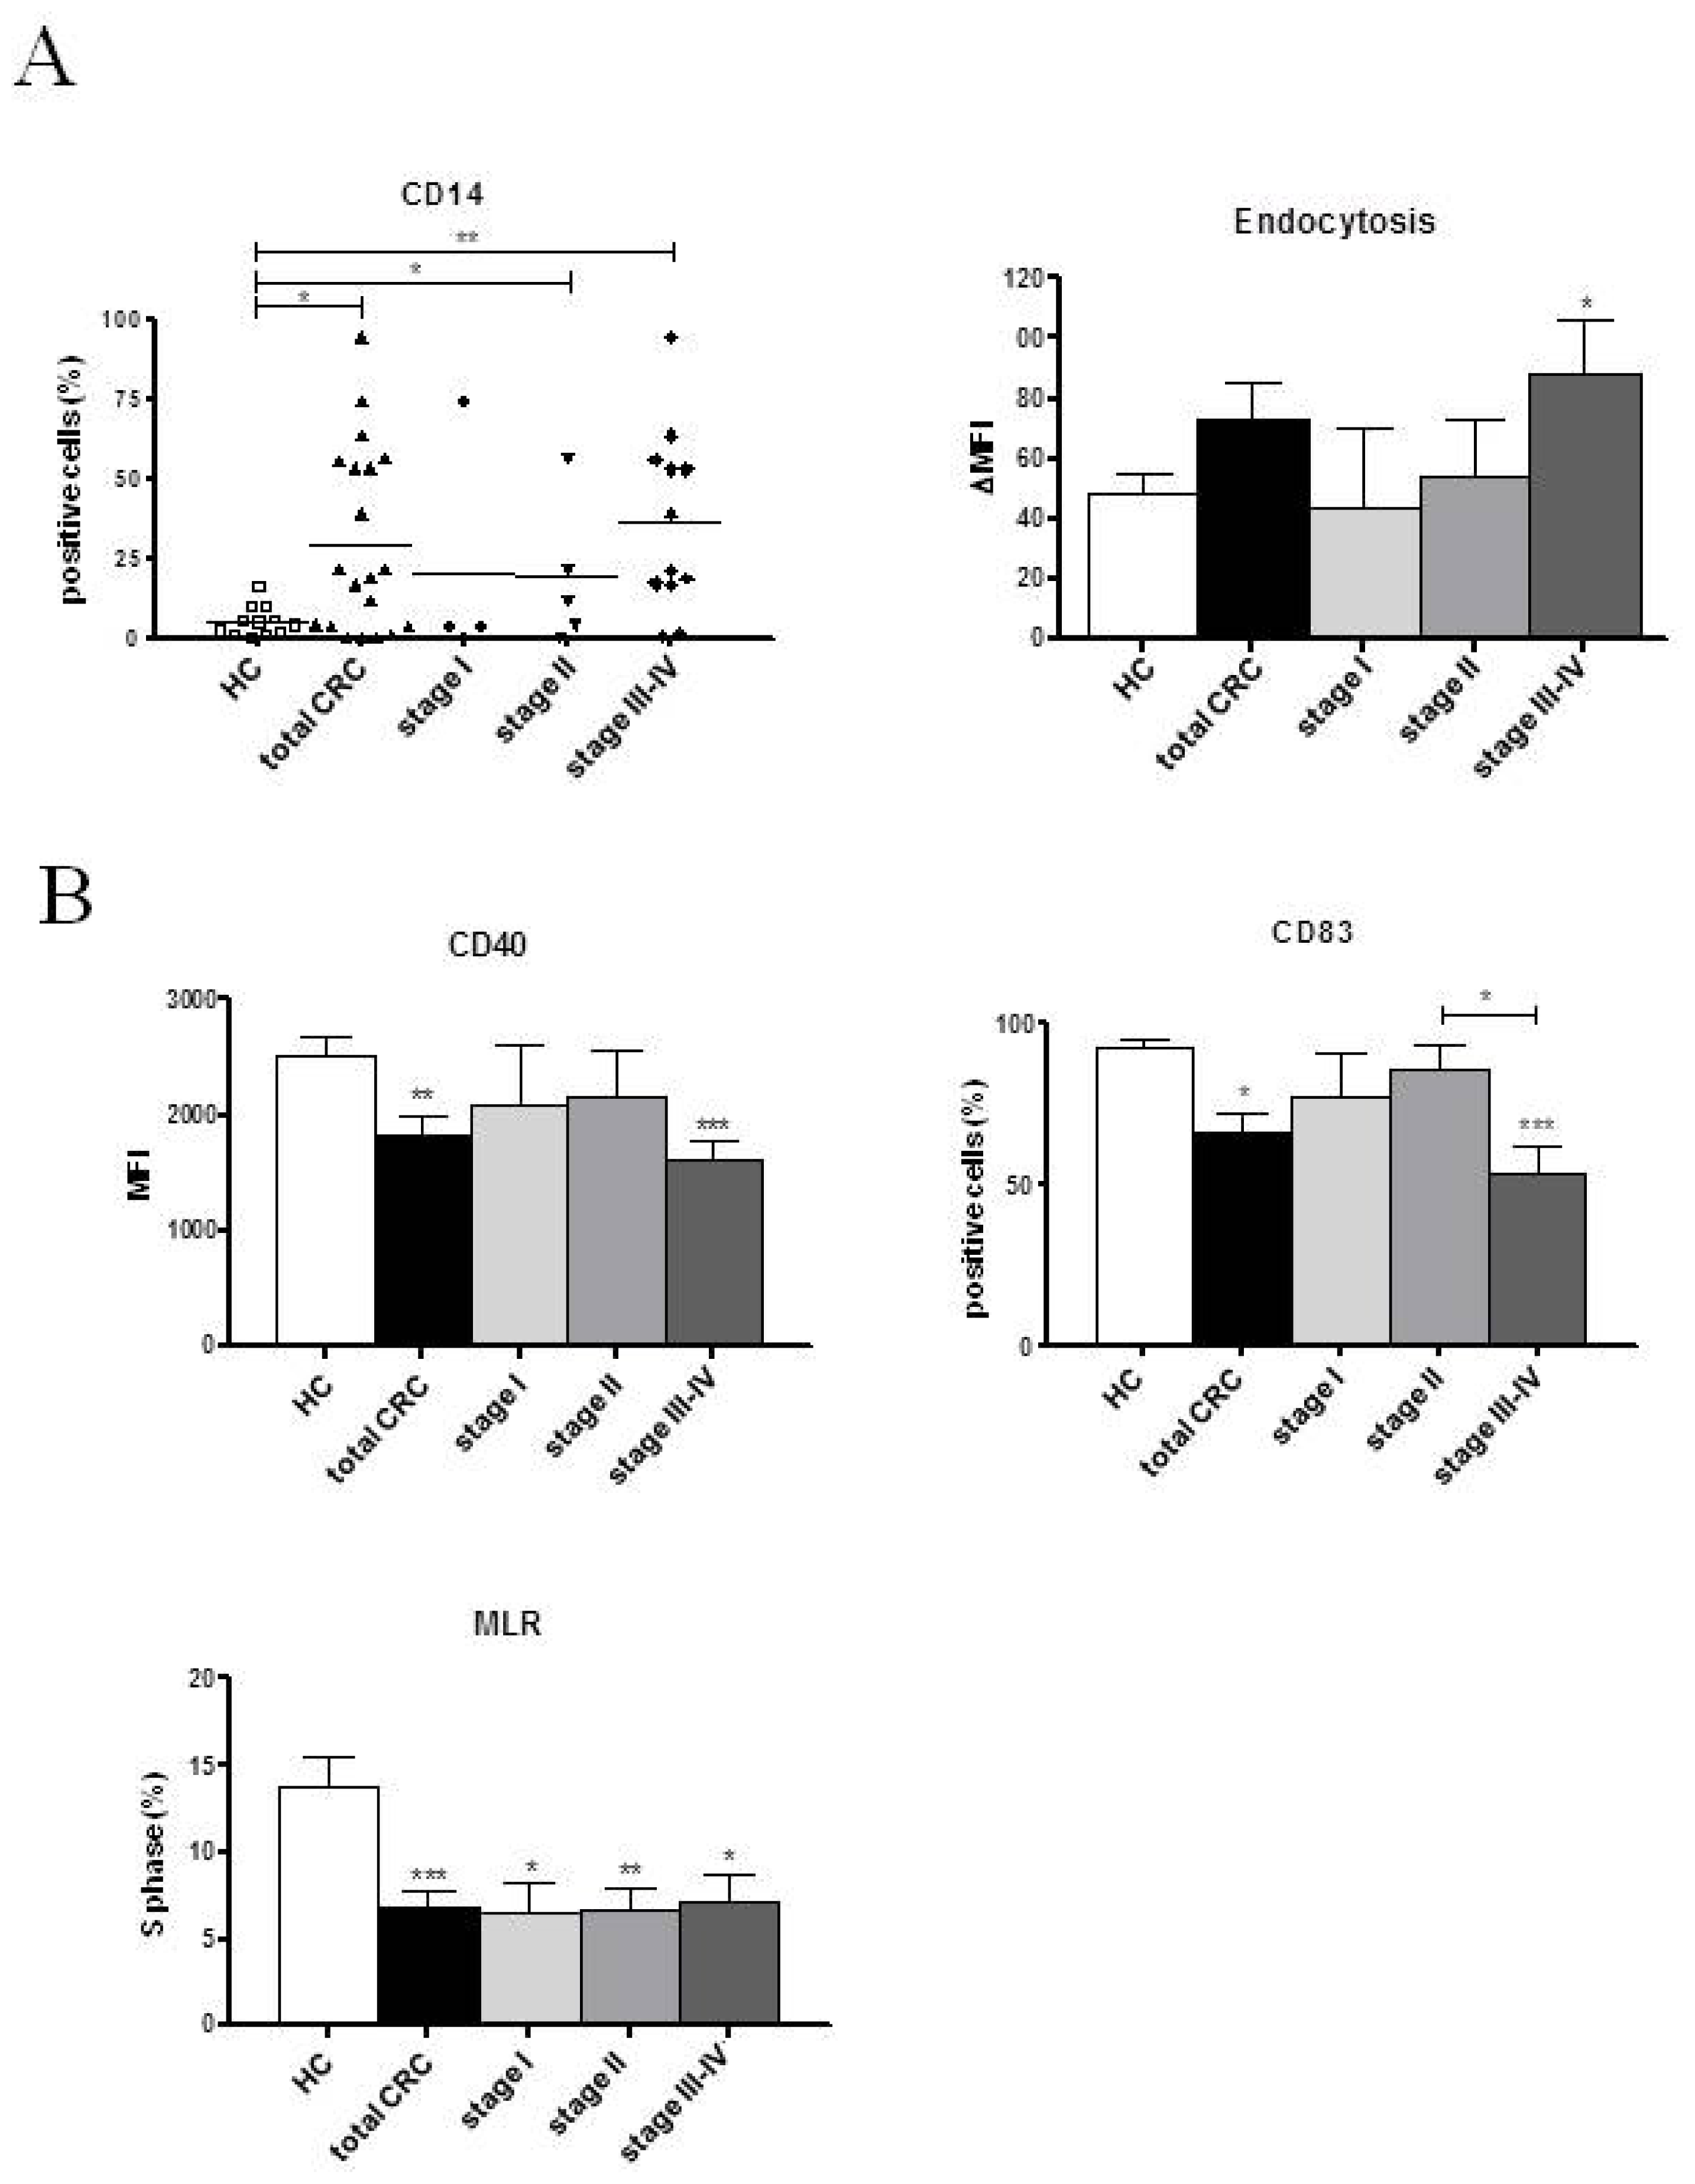
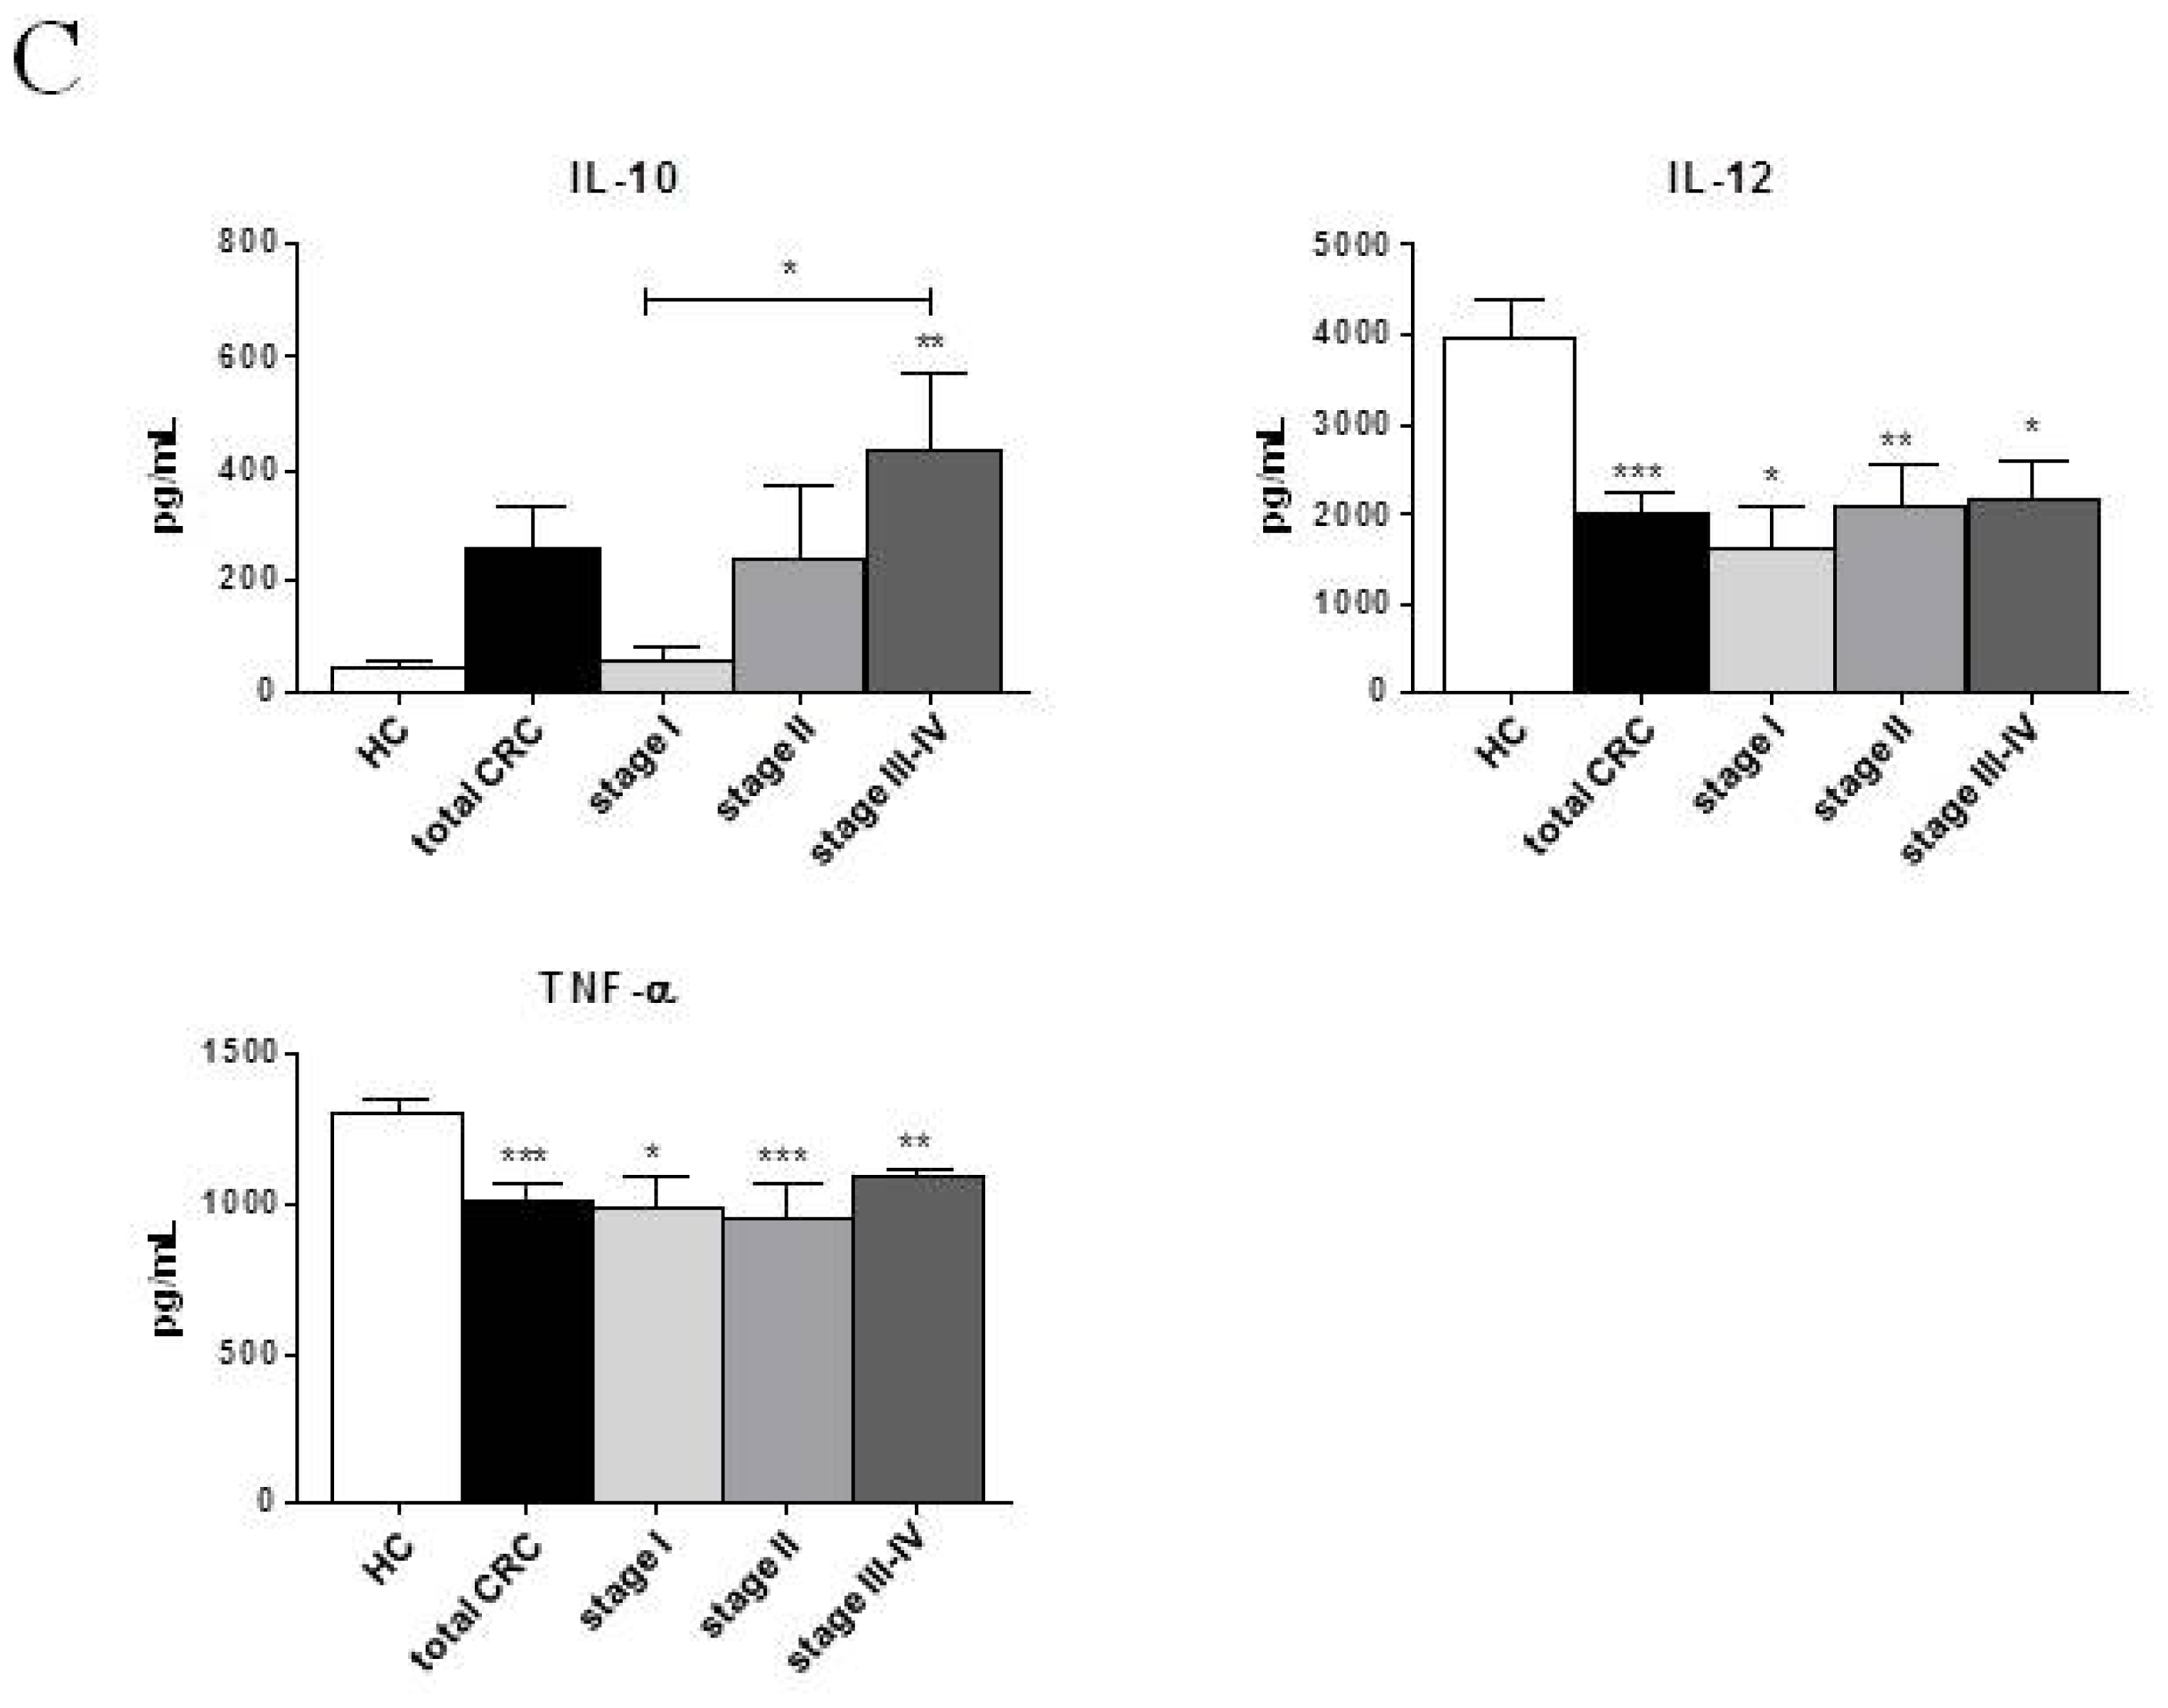
2.2.1. Pre-Surgery
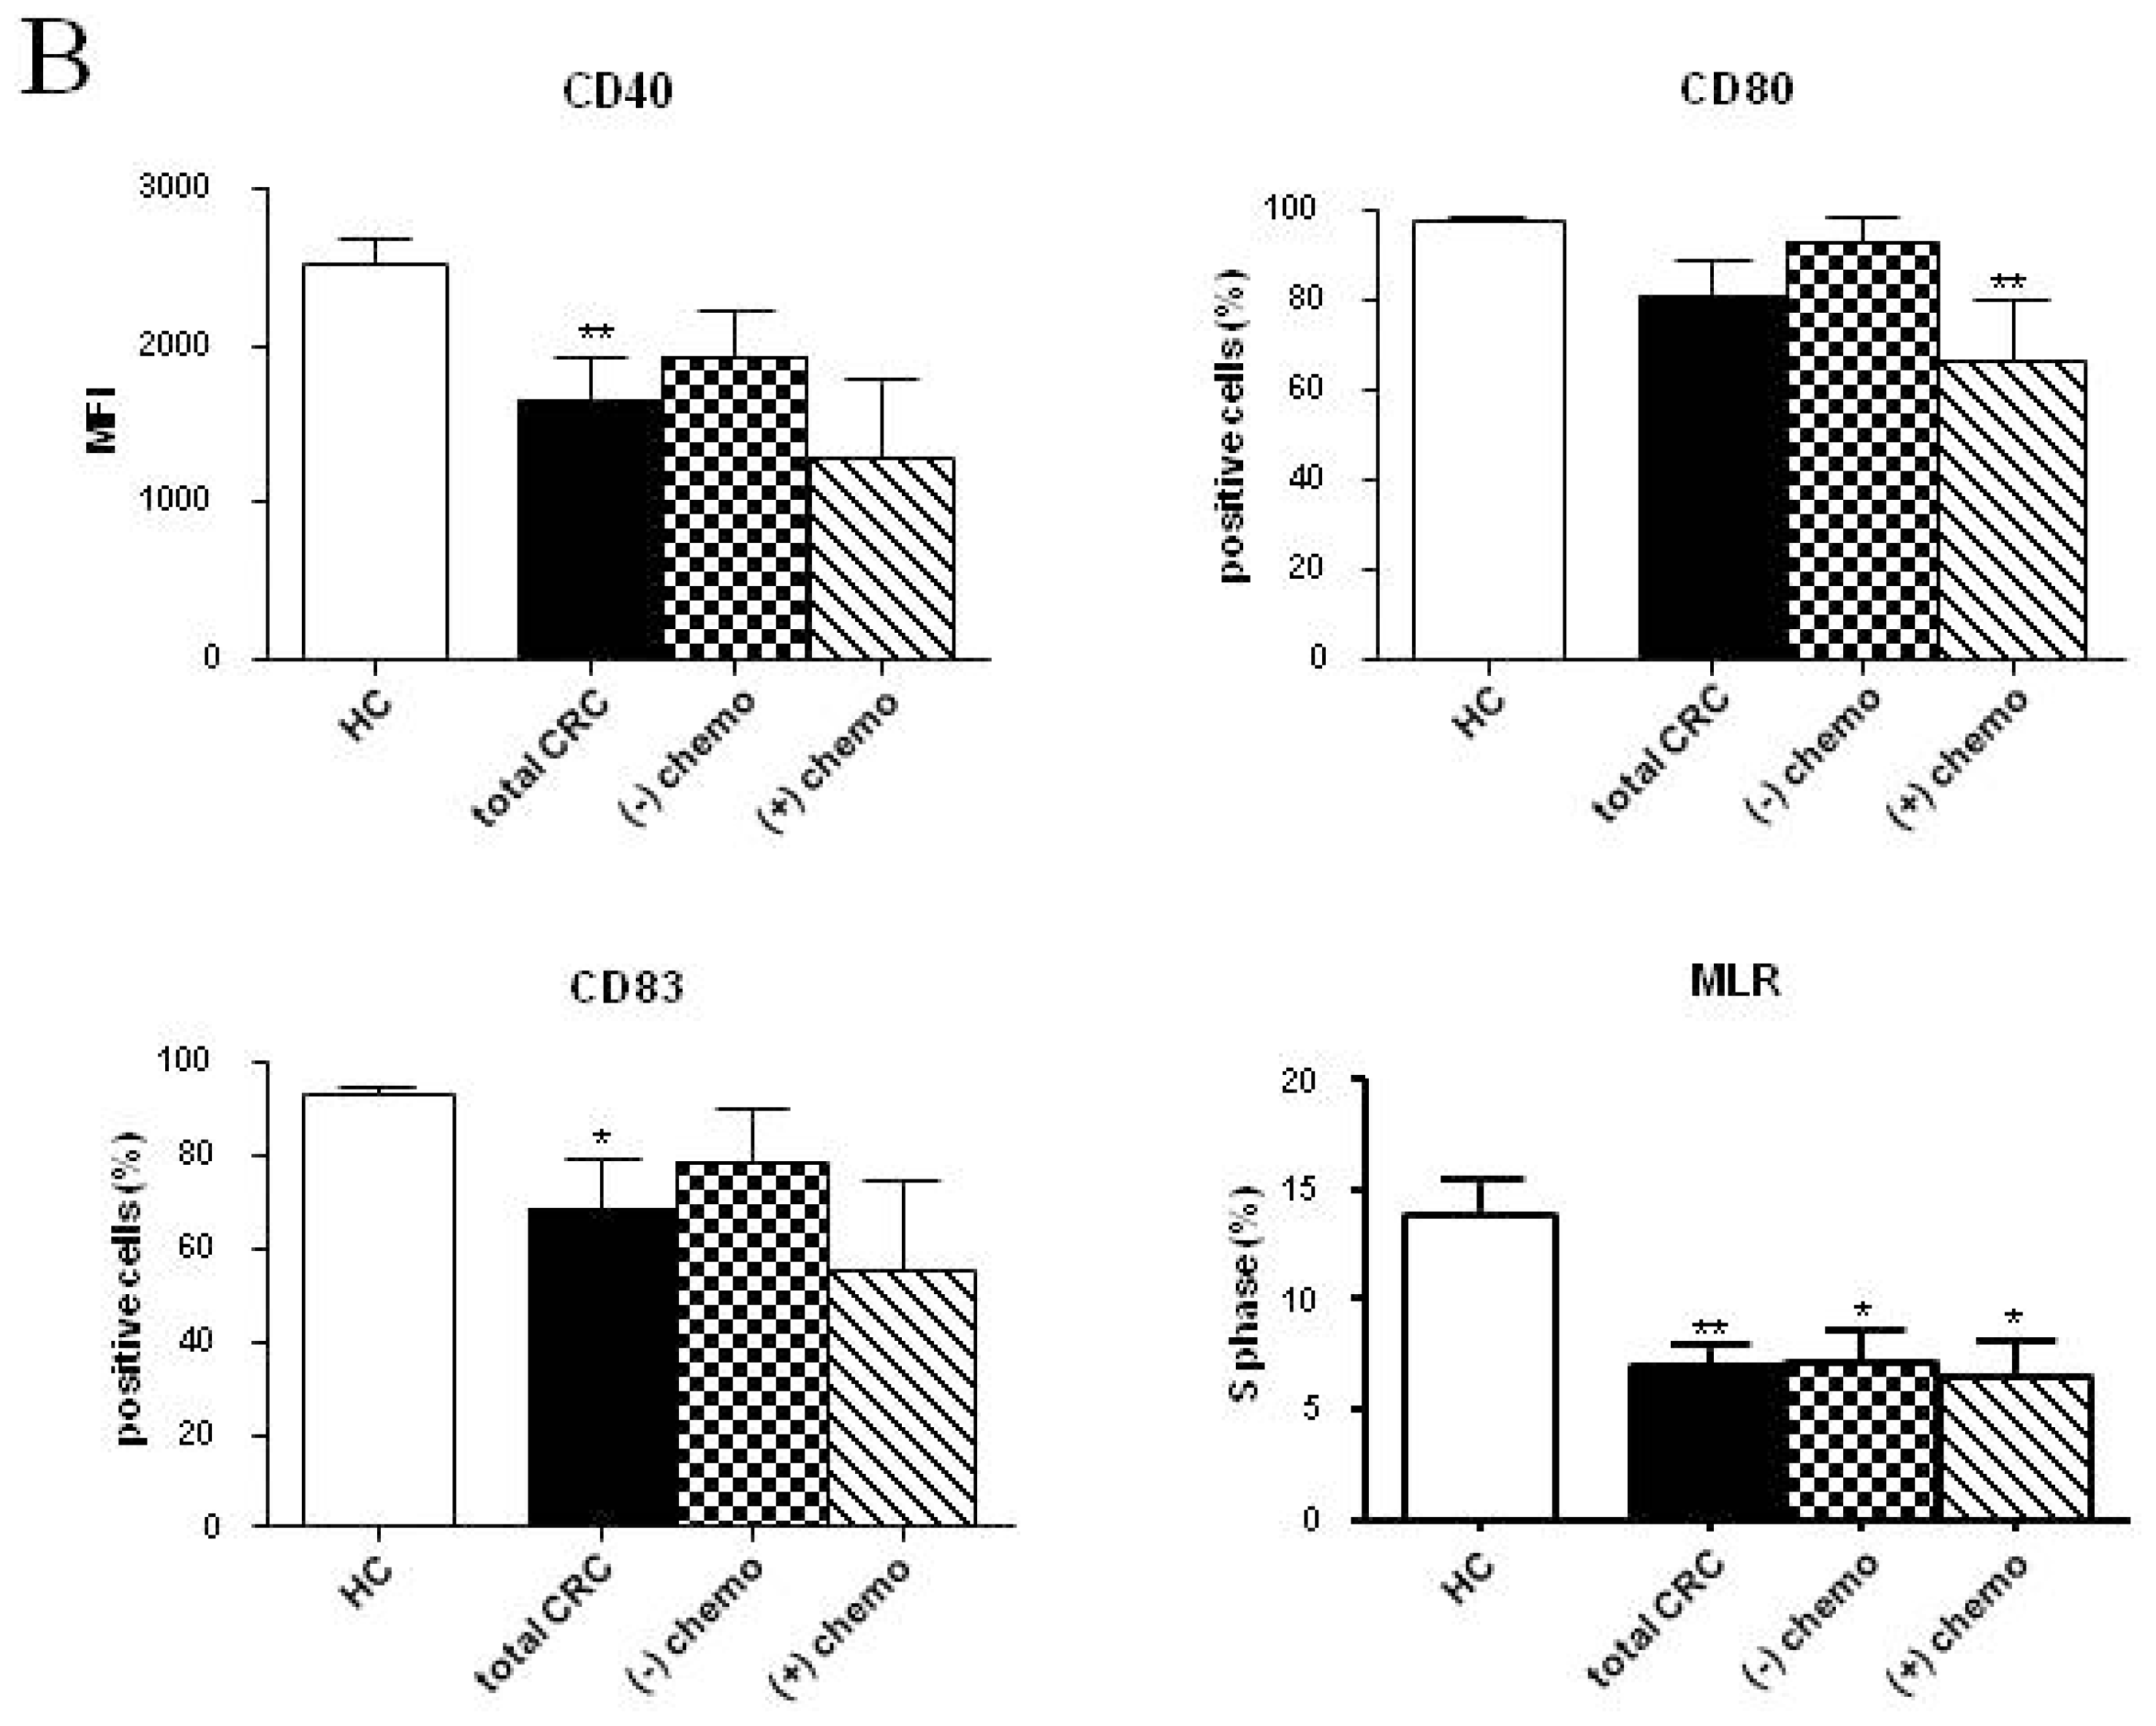
2.2.2. Follow-up
2.3. Discussion
3. Experimental Section
3.1. Study Population
3.2. Generation of Dendritic Cells
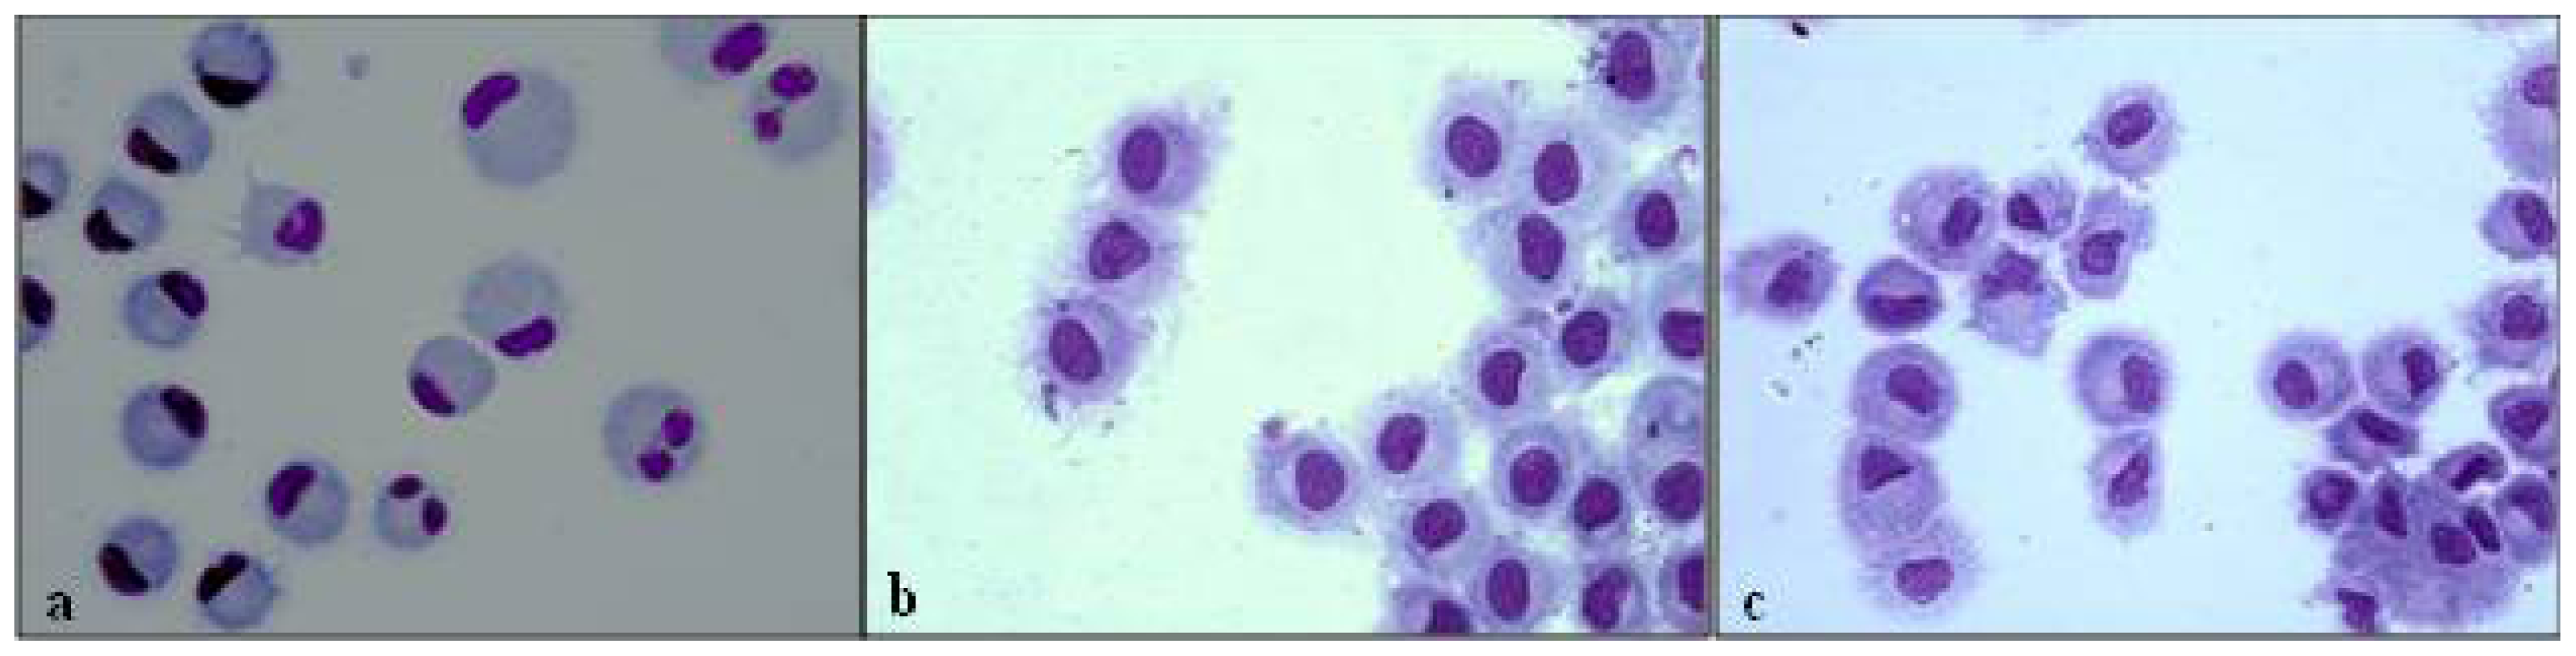
3.3. Morphological Evaluation
3.4. Phenotypic Analysis
3.5. Phagocytosis Assay
3.6. Allogeneic T Cell Proliferation Assay
3.7. Cytokine Measurements
3.8. Statistical Analysis
4. Conclusions


| HC | CRC | ||||
|---|---|---|---|---|---|
| Total CRC | Stage I | Stage II | Stage III–IV | ||
| Number of subjects (n) | 14 | 23 | 5 (21.74) | 6 (26.09) | 12 (52.17) |
| Age (years) | |||||
| Mean | 59.79 ± 4.83 | 68.48 ± 2.29 | 70.00 ± 2.41 | 69.67 ± 6.94 | 67.25 ± 2.82 |
| Range | 29–85 | 42–86 | 63–77 | 42–86 | 47–80 |
| Sex | |||||
| M | 9 | 17 | 4 | 4 | 9 |
| F | 5 | 6 | 1 | 2 | 3 |
| Tumor location: | N/A | ||||
| Right side of colon | 9 (39.13) | 2 (40.00) | 3 (50.00) | 4 (33.33) | |
| Left side of colon | 4 (17.39) | 3 (60.00) | 1 (16.67) | 0 | |
| Transverse colon | 1 (4.35) | 0 | 0 | 1 (8.33) | |
| Rectum | 9 (39.13) | 0 | 2 (33.33) | 7 (58.33) | |
| Adjuvant chemotherapy | N/A | ||||
| Lost cases ‡ | 7 (30.43) | 1 (20.00) | 1 (16.67) | 5 (41.67) | |
| Yes | 8 (34.78) | 0 | 1 (16.67) | 7 (58.33) | |
| No | 8 (34.78) | 4 (80.00) | 4 (66.67) | 0 | |
| WBC (×103/μL) | 6.80 ± 0.34 | 6.93 ± 0.36 | 5.86 ± 0.27 | 7.26 ± 0.84 | 7.22 ± 0.51 |
| MNC (×103/μL) | 2.54 ± 0.13 | 2.21 ± 0.12 * | 2.21 ± 0.16 | 2.39 ± 0.31 | 2.12 ± 0.17 |
| HC (n = 14) | Total CRC | Stage I | Stage II | Stage III | |||||
|---|---|---|---|---|---|---|---|---|---|
| 1° tp (n = 14) | 2° tp (n = 14) | 1° tp (n = 4) | 2° tp (n = 4) | 1° tp (n = 5) | 2° tp (n = 5) | 1°tp (n = 5) | 2° tp (n = 5) | ||
| DC +6 | |||||||||
| CD14 (%) | 5.51 ± 1.38 | 21.45 ± 6.53 * | 13.47 ± 4.38 | 3.39 ± 0.95 | 7.31 ± 5.96 | 19.00 ± 10.02 | 12.91 ± 6.45 | 38.84 ± 12.18 *** | 18.97 ± 9.80 |
| HLA-DR (%) | 66.15 ± 7.57 | 71.21 ± 6.49 | 67.73 ± 5.40 | 64.30 ± 14.02 | 73.57 ± 11.03 | 88.54 ± 4.74 | 64.24 ± 8.47 | 61.50 ± 10.72 | 66.55 ± 10.52 |
| Endocytosis (ΔMFI) | 48.83 ± 5.78 | 79.40 ± 18.44 | 63.67 ± 10.28 | 57.47 ± 28.90 | 57.60 ± 12.20 | 60.28 ± 19.34 | 55.76 ± 19.96 | 112.00 ± 34.50 * | 75.74 ± 14.04 * |
| DC +7 | |||||||||
| CD40 (MFI) | 2526.37 ± 147.80 | 1802.22 ± 253.70 * | 1898.17 ± 152.30 ** | 2482.10 ± 469.80 | 1792.77 ± 323.10 | 1845.64 ± 504.90 | 2172.12 ± 144.70 | 1350.86 ± 244.90 *** | 1687.46 ± 311.70 * |
| CD80 (MFI) | 137.41 ± 7.26 | 123.96 ± 21.85 | 112.65 ± 9.07 * | 153.95 ± 15.65 | 116.63 ± 16.26 | 116.90 ± 43.53 | 120.80 ± 12.11 | 108.10 ± 22.50 | 99.48 ± 20.97 |
| CD83 (%) | 92.84 ± 1.88 | 65.64 ± 8.67 | 81.56 ± 6.14 | 79.86 ± 18.39 | 84.28 ± 12.84 | 73.69 ± 12.02 | 90.98 ± 1.95 | 49.06 ± 15.02 * | 70.50 ± 13.68 |
| HLA-DR (MFI) | 267.70 ± 34.13 | 300.30 ± 34.55 | 212.20 ± 24.17 † | 388.20 ± 81.11 | 240.30 ± 62.05 | 282.20 ± 22.29 | 206.10 ± 29.21 | 260.30 ± 68.32 | 178.60 ± 29.90 |
| S phase (%) | 13.78 ± 1.73 | 7.75 ± 1.22 ** | 7.21 ± 0.96 ** | 7.97 ± 1.34 | 5.05 ± 2.33 * | 4.93 ± 0.92 ** | 7.13 ± 1.23 * | 10.43 ± 2.59 | 9.00 ± 1.13 |
| Cytokines +7 | |||||||||
| IL-6 (pg/mL) | 281.89 ± 16.37 | 253.42 ± 15.58 | 284.16 ± 10.52 | 223.13 ± 46.49 | 279.93 ± 20.07 | 264.43 ± 20.55 | 290.55 ± 20.70 | 265.13 ± 20.17 | 280.95 ± 19.05 |
| IL-10 (pg/mL) | 45.05 ± 11.59 | 239.76 ± 92.31 | 320.16 ± 86.52 * | 48.53 ± 28.10 | 254.63 ± 198.30 | 187.65 ± 152.20 | 228.55 ± 113.70 * | 435.28 ± 178.20 ** | 460.90 ± 159.80 * |
| IL-12 (pg/mL) | 3972.11 ± 443.90 | 2064.82 ± 281.10 *** | 2751.64 ± 104.30 **,† | 1863.33 ± 596.50 * | 2455.67 ± 368.00 * | 1896.75 ± 519.60 * | 2827.00 ± 25.33 * | 2384.00± 471.90 * | 2898.25 ± 20.69 * |
| TNF-α (pg/mL) | 1307.47 ± 43.63 | 991.67 ± 64.52 *** | 1064.21 ± 24.27 *** | 949.93 ± 137.80 * | 1019.77 ± 92.78 * | 916.48 ± 146.40 ** | 1069.57 ± 15.10 ** | 1098.20 ± 33.50 * | 1092.18 ± 10.15 * |
| TGF-β1 (pg/mL) | 6.18 ± 0.28 | 5.81 ± 0.60 | 5.89 ± 0.58 | 7.00 ± 0.87 | 4.93 ± 1.44 | 6.13 ± 0.72 | 5.20 ± 0.41 | 4.60 ± 1.24 | 7.30 ± 0.90 |
| HC (n = 14) | Total CRC (n = 11) | No Chemotherapy (n = 6) | Plus Chemotherapy (n = 5) | |
|---|---|---|---|---|
| IL-10 (pg/mL) | 45.05 ± 11.59 | 289.40 ± 84.10 * | 271.62 ± 118.30 * | 311.63 ± 137.10 * |
| IL-12 (pg/mL) | 3972.11 ± 443.90 | 2542.87 ± 164.10 ** | 2535.16 ± 244.30 * | 2552.50 ± 249.10 * |
| TNF-α (pg/mL) | 1307.47 ± 43.63 | 1008.46 ± 52.32 *** | 1028.70 ± 21.00 *** | 983.15 ± 123.70 * |
| HC (n = 14) | CRC | ||||||
|---|---|---|---|---|---|---|---|
| No chemotherapy (n = 6) | Plus chemotherapy (n = 5) | ||||||
| DC +6 | 1° time point | 2° time point | 3° time point | 1° time point | 2° time point | 3° time point | |
| CD14 (%) | 5.51 ± 1.38 | 8.57 ± 3.89 | 10.42 ± 4.23 | 3.72 ± 1.54 | 32.09 ± 13.47 | 25.94 ± 11.68 | 16.64 ± 9.92 |
| HLA-DR (%) | 66.15 ± 7.57 | 70.31 ± 16.73 | 65.88 ± 5.98 | 81.62 ± 8.14 | 61.06 ± 14.38 | 66.10 ± 8.76 | 71.00 ± 9.39 |
| endocytosis (ΔMFI) | 48.83 ± 5.78 | 68.58 ± 20.20 | 77.92 ± 11.30 | 58.38 ± 28.91 | 112.1 ± 45.78 | 54.08 ± 20.41 | 66.70 ± 21.38 |
| DC +7 | |||||||
| CD40 (MFI) | 2526.37 ± 147.80 | 2858.77 ± 267.40 | 1794.06 ± 130.80 *,† | 1925.86 ± 288.20 | 1549.30 ± 193.80 ** | 1977.97 ± 300.10 | 1286.78 ± 497.70 |
| CD80 (%) | 97.34 ± 0.72 | 98.97 ± 0.56 | 89.00 ± 8.16 | 92.59 ± 5.72 | 92.92 ± 2.07 | 85.58 ± 12.55 | 66.26 ± 13.24 ** |
| CD83 (%) | 92.84 ± 1.88 | 98.66 ± 0.53 * | 80.43 ± 12.15 | 78.71 ± 11.37 | 66.99 ± 14.46 | 77.87 ± 17.77 | 55.41 ± 18.87 |
| HLA-DR (MFI) | 267.70 ± 34.13 | 279.80 ± 24.21 | 225.00 ± 51.51 | 229.90 ± 44.96 | 257.00 ± 48.43 | 202.40 ± 32.99 | 187.10 ± 65.34 |
| S phase (%) | 13.78 ± 1.73 | 5.80 ± 1.31 * | 4.75 ± 1.51 ** | 6.20 ± 1.32 * | 9.70 ± 2.39 | 9.15 ± 1.44 | 6.55 ± 1.60 * |
| Cytokines +7 | |||||||
| IL-6 (pg/mL) | 281.90 ± 16.37 | 223.40 ± 46.51 | 310.50 ± 10.53 | 279.20 ± 20.80 | 265.10 ± 20.17 | 264.00 ± 20.86 | 280.50 ± 19.50 |
| IL-10 (pg/mL) | 45.05 ± 11.59 | 28.53 ± 9.59 | 260.00 ± 159.90 | 213.10 ± 132.50 | 558.90 ± 153.10 ** | 321.30 ± 175.50 * | 311.60 ± 137.10 * |
| IL-12 (pg/mL) | 3972.11 ± 443.90 | 1758.00 ± 692.50 * | 2833.33 ± 41.28 * | 2313.27 ± 370.50 * | 2852.00 ± 23.39 * | 2872.00 ± 20.95 * | 2552.50 ± 249.10 * |
| TNF-α (pg/mL) | 1307.47 ± 43.63 | 884.10 ± 203.50 * | 1106.57 ± 17.19 * | 1032.97 ± 27.06 ** | 1108.22 ± 26.63 * | 1089.03 ± 9.35 ** | 983.15 ± 123.70 * |
| TGF-β1 (pg/mL) | 6.18 ± 0.28 | 6.87 ± 0.87 | 5.87 ± 1.16 | 5.73 ± 2.28 | 4.76 ± 1.22 | 6.40 ± 1.07 | 6.40 ± 1.82 |
Acknowledgments
Conflicts of Interest
References
- Camus, M.; Tosolini, M.; Mlecnik, B.; Pagès, F.; Kirilovsky, A.; Berger, A.; Costes, A.; Bindea, G.; Charoentong, P.; Bruneval, P.; et al. Coordination of intratumoral immune reaction and human colorectal cancer recurrence. Cancer Res 2009, 69, 2685–2693. [Google Scholar]
- Jemal, A.; Bray, F.; Center, M.M.; Ferlay, J.; Ward, E.; Forman, D. Global cancer statistics. CA Cancer J. Clin 2011, 61, 69–90. [Google Scholar]
- Dalerba, P.; Maccalli, C.; Casati, C.; Castelli, C.; Parmiani, G. Immunology and immunotherapy of colorectal cancer. Crit. Rev. Oncol. Hematol 2003, 46, 33–57. [Google Scholar]
- Roxburgh, C.S.; McMillan, D.C. The role of the in situ local inflammatory response in predicting recurrence and survival in patients with primary operable colorectal cancer. Cancer Treat. Rev 2012, 38, 451–466. [Google Scholar]
- Nagorsen, D.; Voigt, S.; Berg, E.; Stein, H.; Thiel, E.; Loddenkemper, C. Tumor-infiltrating macrophages and dendritic cells in human colorectal cancer: Relation to local regulatory T cells, systemic T-cell response against tumor-associated antigens and survival. J. Transl. Med 2007, 5. [Google Scholar] [CrossRef]
- Gulubova, M.V.; Ananiev, J.R.; Vlaykova, T.I.; Yovchev, Y.; Tsoneva, V.; Manolova, I.M. Role of dendritic cells in progression and clinical outcome of colon cancer. Int. J. Colorectal Dis 2012, 27, 159–169. [Google Scholar]
- Schäkel, K. Dendritic cells—Why can they help and hurt us. Exp. Dermatol 2009, 18, 264–273. [Google Scholar]
- Bennaceur, K.; Chapman, J.A.; Touraine, J.L.; Portoukalian, J. Immunosuppressive networks in the tumour environment and their effect in dendritic cells. Biochim. Biophys. Acta 2009, 1795, 16–24. [Google Scholar]
- Palucka, K.; Banchereau, J. Cancer immunotherapy via dendritic cells. Nat. Rev. Cancer 2012, 12, 265–277. [Google Scholar]
- Dhodapkar, M.V.; Steinman, R.M.; Krasovsky, J.; Munz, C.; Bhardwaj, N. Antigen-specific inhibition of effector T cell function in humans after injection of immature dendritic cells. J. Exp. Med 2001, 193, 233–238. [Google Scholar]
- Pinzon-Charry, A.; Maxwell, T.; López, J.A. Dendritic cell dysfunction in cancer: A mechanism for immunosuppression. Immunol. Cell Biol 2005, 83, 451–461. [Google Scholar]
- Pinzon-Charry, A.; Ho, C.S.; Laherty, R.; Maxwell, T.; Walker, D.; Gardiner, R.A.; O’Connor, L.; Pyke, C.; Schmidt, C.; Furnival, C.; et al. A population of HLA-DR+ immature cells accumulates in the blood dendritic cell compartment of patients with different types of cancer. Neoplasia 2005, 7, 1112–1122. [Google Scholar]
- Ormandy, L.A.; Farber, A.; Cantz, T.; Petrykowska, S.; Wedemeyer, H.; Horning, M.; Lehner, F.; Manns, M.P.; Korangy, F.; Greten, T.F. Direct ex vivo analysis of dendritic cells in patients with hepatocellular carcinoma. World J. Gastroenterol 2006, 12, 3275–3282. [Google Scholar]
- Yamamoto, T.; Yanagimoto, H.; Satoi, S.; Toyokawa, H.; Yamao, J.; Kim, S.; Terakawa, N.; Takahashi, K.; Kwon, A.H. Circulating myeloid dendritic cells as prognostic factors in patients with pancreatic cancer who have undergone surgical resection. J. Surg. Res 2012, 173, 299–308. [Google Scholar]
- Orsini, G.; Legitimo, A.; Failli, A.; Ferrari, P.; Nicolini, A.; Spisni, R.; Miccoli, P.; Consolini, R. Quantification of blood dendritic cells in colorectal cancer patients during the course of disease. Pathol. Oncol. Res 2013. [Google Scholar] [CrossRef]
- Almand, B.; Resser, J.R.; Lindman, B.; Nadaf, S.; Clark, J.I.; Kwon, E.D.; Carbone, D.P.; Gabrilovich, D.I. Clinical significance of defective dendritic cell differentiation in cancer. Clin. Cancer Res 2000, 6, 1755–1766. [Google Scholar]
- Mazzolini, G.; Murillo, O.; Atorrasagasti, C.; Dubrot, J.; Tirapu, I.; Rizzo, M.; Arina, A.; Alfaro, C.; Azpilicueta, A.; Berasain, C.; et al. Immunotherapy and immunoescape in colorectal cancer. World J. Gastroenterol 2007, 13, 5822–5831. [Google Scholar]
- Hasebe, H.; Nagayama, H.; Sato, K.; Enomoto, M.; Takeda, Y.; Takahashi, T.A.; Hasumi, K.; Eriguchi, M. Dysfunctional regulation of the development of monocyte-derived dendritic cells in cancer patients. Biomed. Pharmacother 2000, 54, 291–298. [Google Scholar]
- Brusa, D.; Carletto, S.; Cucchiarale, G.; Gontero, P.; Greco, A.; Simone, M.; Ferrando, U.; Tizzani, A.; Matera, L. Prostatectomy restores the maturation competence of blood dendritic cell precursors and reverses the abnormal expansion of regulatory T lymphocytes. Prostate 2011, 71, 344–352. [Google Scholar]
- Hus, I.; Tabarkiewicz, J.; Lewandowska, M.; Wasiak, M.; Wdowiak, P.; Kusz, M.; Legieć, M.; Dmoszyńska, A.; Roliński, J. Evaluation of monocyte-derived dendritic cells, T regulatory and Th17 cells in chronic myeloid leukemia patients treated with tyrosine kinase inhibitors. Folia Histochem. Cytobiol 2011, 49, 153–160. [Google Scholar]
- Roy, S.; Goswami, S.; Bose, A.; Goswami, K.K.; Sarkar, K.; Chakraborty, K.; Chakraborty, T.; Pal, S.; Haldar, A.; Basu, P.; et al. Defective dendritic cell generation from monocytes is a potential reason for poor therapeutic efficacy of interferon α2b (IFNα2b) in cervical cancer. Transl. Res 2011, 158, 200–213. [Google Scholar]
- Schuler, P.J.; Börger, V.; Bölke, E.; Habermehl, D.; Matuschek, C.; Wild, C.A.; Greve, J.; Bas, M.; Schilling, B.; Bergmann, C.; et al. Dendritic cell generation and CD4+ CD25high FOXP3+ regulatory T cells in human head and neck carcinoma during radio-chemotherapy. Eur. J. Med. Res 2011, 16, 57–62. [Google Scholar]
- Chang, L.L.; Wang, S.W.; Wu, I.C.; Yu, F.J.; Su, Y.C.; Chen, Y.P.; Wu, D.C.; Kuo, C.H.; Hung, C.H. Impaired dendritic cell maturation and IL-10 production following H. pylori stimulation in gastric cancer patients. Appl. Microbiol. Biotechnol 2012, 96, 211–220. [Google Scholar]
- Ramos, R.N.; Chin, L.S.; Dos Santos, A.P.; Bergami-Santos, P.C.; Laginha, F.; Barbuto, J.A. Monocyte-derived dendritic cells from breast cancer patients are biased to induce CD4+CD25+Foxp3+ regulatory T cells. J. Leukoc. Biol 2012, 92, 673–682. [Google Scholar]
- Ambe, K.; Mori, M.; Enjoji, M. S-100 protein-positive dendritic cells in colorectal adenocarcinomas. Distribution and relation to the clinical prognosis. Cancer 1989, 63, 496–503. [Google Scholar]
- Nakayama, Y.; Inoue, Y.; Minagawa, N.; Katsuki, T.; Nagashima, N.; Onitsuka, K.; Tsurudome, Y.; Sako, T.; Hirata, K.; Nagata, N.; et al. Relationships between S-100 protein-positive cells and clinicopathological factors in patients with colorectal cancer. Anticancer Res 2003, 23, 4423–4426. [Google Scholar]
- Dadabayev, A.R.; Sandel, M.H.; Menon, A.G.; Morreau, H.; Melief, C.J.; Offringa, R.; van der Burg, S.H.; Janssen-van Rhijn, C.; Ensink, N.G.; Tollenaar, R.A.; et al. Dendritic cells in colorectal cancer correlate with other tumor-infiltrating immune cells. Cancer Immunol. Immunother 2004, 53, 978–986. [Google Scholar]
- Inoue, Y.; Nakayama, Y.; Minagawa, N.; Katsuki, T.; Nagashima, N.; Matsumoto, K.; Shibao, K.; Tsurudome, Y.; Hirata, K.; Nagata, N.; et al. Relationship between interleukin-12-expressing cells and antigen-presenting cells in patients with colorectal cancer. Anticancer Res 2005, 25, 3541–3546. [Google Scholar]
- Sandel, M.H.; Dadabayev, A.R.; Menon, A.G.; Morreau, H.; Melief, C.J.; Offringa, R.; van der Burg, S.H.; Janssen-van Rhijn, C.M.; Ensink, N.G.; Tollenaar, R.A.; et al. Prognostic value of tumor-infiltrating dendritic cells in colorectal cancer: Role of maturation status and intratumoral localization. Clin. Cancer Res 2005, 11, 2576–2582. [Google Scholar]
- Yuan, A.; Steigen, S.E.; Goll, R.; Vonen, B.; Husbekk, A.; Cui, G.; Florholmen, J. Dendritic cell infiltration pattern along the colorectal adenoma-carcinoma sequence. APMIS 2008, 116, 445–456. [Google Scholar]
- Onishi, H.; Morisaki, T.; Baba, E.; Kuga, H.; Kuroki, H.; Matsumoto, K.; Tanaka, M.; Katano, M. Dysfunctional and short-lived subsets in monocyte-derived dendritic cells from patients with advanced cancer. Clin. Immunol 2002, 105, 286–295. [Google Scholar]
- Bellik, L.; Gerlini, G.; Parenti, A.; Ledda, F.; Pimpinelli, N.; Neri, B.; Pantalone, D. Role of conventional treatments on circulating and monocyte-derived dendritic cells in colorectal cancer. Clin. Immunol 2006, 121, 74–80. [Google Scholar]
- Galon, J.; Fridman, W.H.; Pagès, F. The adaptive immunologic microenvironment in colorectal cancer: A novel perspective. Cancer Res 2007, 67, 1883–1886. [Google Scholar]
- Mlecnik, B.; Tosolini, M.; Kirilovsky, A.; Berger, A.; Bindea, G.; Meatchi, T.; Bruneval, P.; Trajanoski, Z.; Fridman, W.H.; Pagès, F.; et al. Histopathologic-based prognostic factors of colorectal cancers are associated with the state of the local immune reaction. J. Clin. Oncol 2011, 29, 610–618. [Google Scholar]
- Scarlett, U.K.; Rutkowski, M.R.; Rauwerdink, A.M.; Fields, J.; Escovar-Fadul, X.; Baird, J.; Cubillos-Riuz, J.R.; Jacobs, A.C.; Gonzalez, J.R.; Weaver, J.; et al. Ovarian cancer progression is controlled by phenotypic changes in dendritic cells. J. Exp. Med 2012, 209, 495–506. [Google Scholar]
- Nencioni, A.; Grünebach, F.; Schmidt, S.M.; Müller, M.R.; Boy, D.; Patrone, F.; Ballestrero, A.; Brossart, P. The use of dendritic cells in cancer immunotherapy. Crit. Rev. Oncol. Hematol 2008, 65, 191–199. [Google Scholar]
- Fujihara, M.; Muroi, M.; Tanamoto, K.; Suzuki, T.; Azuma, H.; Ikeda, H. Molecular mechanisms of macrophage activation and deactivation by lipopolysaccharide: Roles of the receptor complex. Pharmacol. Ther 2003, 100, 171–194. [Google Scholar]
- Kato, M.; Neil, T.K.; Fearnley, D.B.; McLellan, A.D.; Vuckovic, S.; Hart, D.N. Expression of multilectin receptors and comparative FITC-dextran uptake by human dendritic cells. Int. Immunol 2000, 12, 1511–1519. [Google Scholar]
- Bedoret, D.; Wallemacq, H.; Marichal, T.; Desmet, C.; Quesada Calvo, F.; Henry, E.; Closset, R.; Dewals, B.; Thielen, C.; Gustin, P.; et al. Lung interstitial macrophages alter dendritic cell functions to prevent airway allergy in mice. J. Clin. Invest 2009, 119, 3723–3738. [Google Scholar]
- Schmid, M.C.; Varner, J.A. Myeloid cells in the tumor microenvironment: Modulation of tumor angiogenesis and tumor inflammation. J. Oncol 2010, 2010. [Google Scholar] [CrossRef]
- Lindenberg, J.J.; van de Ven, R.; Lougheed, S.M.; Zomer, A.; Santegoets, S.J.; Griffioen, A.W.; Hooijberg, E.; van den Eertwegh, A.J.; Thijssen, V.L.; Scheper, R.J.; et al. Functional characterization of a STAT3-dependent dendritic cell-derived CD14(+) cell population arising upon IL-10-driven maturation. Oncoimmunology 2013, 2, e23837. [Google Scholar]
- Michielsen, A.J.; Hogan, A.E.; Marry, J.; Tosetto, M.; Cox, F.; Hyland, J.M.; Sheahan, K.D.; O’Donoghue, D.P.; Mulcahy, H.E.; Ryan, E.J.; et al. Tumour tissue microenvironment can inhibit dendritic cell maturation in colorectal cancer. PLoS One 2011, 6, e27944. [Google Scholar]
- Rimoldi, M.; Chieppa, M.; Salucci, V.; Avogadri, F.; Sonzogni, A.; Sampietro, G.M.; Nespoli, A.; Viale, G.; Allavena, P.; Rescigno, M. Intestinal immune homeostasis is regulated by the crosstalk between epithelial cells and dendritic cells. Nat. Immunol 2005, 6, 507–514. [Google Scholar]
- Corthay, A. How do regulatory T cells work? Scand. J. Immunol 2009, 70, 326–336. [Google Scholar]
- Lanzavecchia, A.; Sallusto, F. Regulation of T cell immunity by dendritic cells. Cell 2001, 106, 263–266. [Google Scholar]
- Joffre, O.; Nolte, M.A.; Spörri, R.; Reis e Sousa, C. Inflammatory signals in dendritic cell activation and the induction of adaptive immunity. Immunol. Rev 2009, 227, 234–247. [Google Scholar]
- Enk, A.H.; Jonuleit, H.; Saloga, J.; Knop, J. Dendritic cells as mediators of tumor-induced tolerance in metastatic melanoma. Int. J. Cancer 1997, 73, 309–316. [Google Scholar]
- Failli, A.; Legitimo, A.; Orsini, G.; Romanini, A.; Consolini, R. Numerical defect of circulating dendritic cell subsets and defective dendritic cell generation from monocytes of patients with advanced melanoma. Cancer Lett 2013, 337, 184–192. [Google Scholar]
- Gabrilovich, D.I.; Corak, J.; Ciernik, I.F.; Kavanaugh, D.; Carbone, D.P. Decreased antigen presentation by dendritic cells in patients with breast cancer. Clin. Cancer Res 1997, 3, 483–490. [Google Scholar]
- Orsini, G.; Failli, A.; Legitimo, A.; Adinolfi, B.; Romanini, A.; Consolini, R. Zoledronic acid modulates maturation of human monocyte-derived dendritic cells. Exp. Biol. Med. (Maywood) 2011, 236, 1420–1426. [Google Scholar]
© 2013 by the authors; licensee MDPI, Basel, Switzerland This article is an open access article distributed under the terms and conditions of the Creative Commons Attribution license (http://creativecommons.org/licenses/by/3.0/).
Share and Cite
Orsini, G.; Legitimo, A.; Failli, A.; Ferrari, P.; Nicolini, A.; Spisni, R.; Miccoli, P.; Consolini, R. Defective Generation and Maturation of Dendritic Cells from Monocytes in Colorectal Cancer Patients during the Course of Disease. Int. J. Mol. Sci. 2013, 14, 22022-22041. https://doi.org/10.3390/ijms141122022
Orsini G, Legitimo A, Failli A, Ferrari P, Nicolini A, Spisni R, Miccoli P, Consolini R. Defective Generation and Maturation of Dendritic Cells from Monocytes in Colorectal Cancer Patients during the Course of Disease. International Journal of Molecular Sciences. 2013; 14(11):22022-22041. https://doi.org/10.3390/ijms141122022
Chicago/Turabian StyleOrsini, Giulia, Annalisa Legitimo, Alessandra Failli, Paola Ferrari, Andrea Nicolini, Roberto Spisni, Paolo Miccoli, and Rita Consolini. 2013. "Defective Generation and Maturation of Dendritic Cells from Monocytes in Colorectal Cancer Patients during the Course of Disease" International Journal of Molecular Sciences 14, no. 11: 22022-22041. https://doi.org/10.3390/ijms141122022