Rapid and Sensitive Determination of Timosaponin AIII in Rat Plasma by LC-MS/MS and Its Pharmacokinetic Application


Abstract
:
1. Introduction
2. Experimental Section
2.1. Chemicals and Reagents
2.2. Instruments and Analytical Conditions
2.2.1. Instruments
2.2.2. Analytical Conditions
2.3. Sample Preparation
2.4. Animals and Pharmacokinetic Study
2.5. Method Validation
2.5.1. Selectivity
2.5.2. Linearity and Lower Limit of Quantification (LLOQ)
2.5.3. Precision and Accuracy
2.5.4. Extraction Recovery
2.5.5. Analyte Stability
2.5.5.1. Post-Preparative Stabilities at Room Temperature for 24 h
2.5.5.2. Stabilities of Unpreparative Sample at Room Temperature for 24 h
2.5.5.3. Three of Freeze-Thaw Cycles
2.5.5.4. Long-Term Stability Storage at −20 °C for 50 days
2.5.6. Matrix Effect
2.6. Statistical Analysis
3. Method Validation
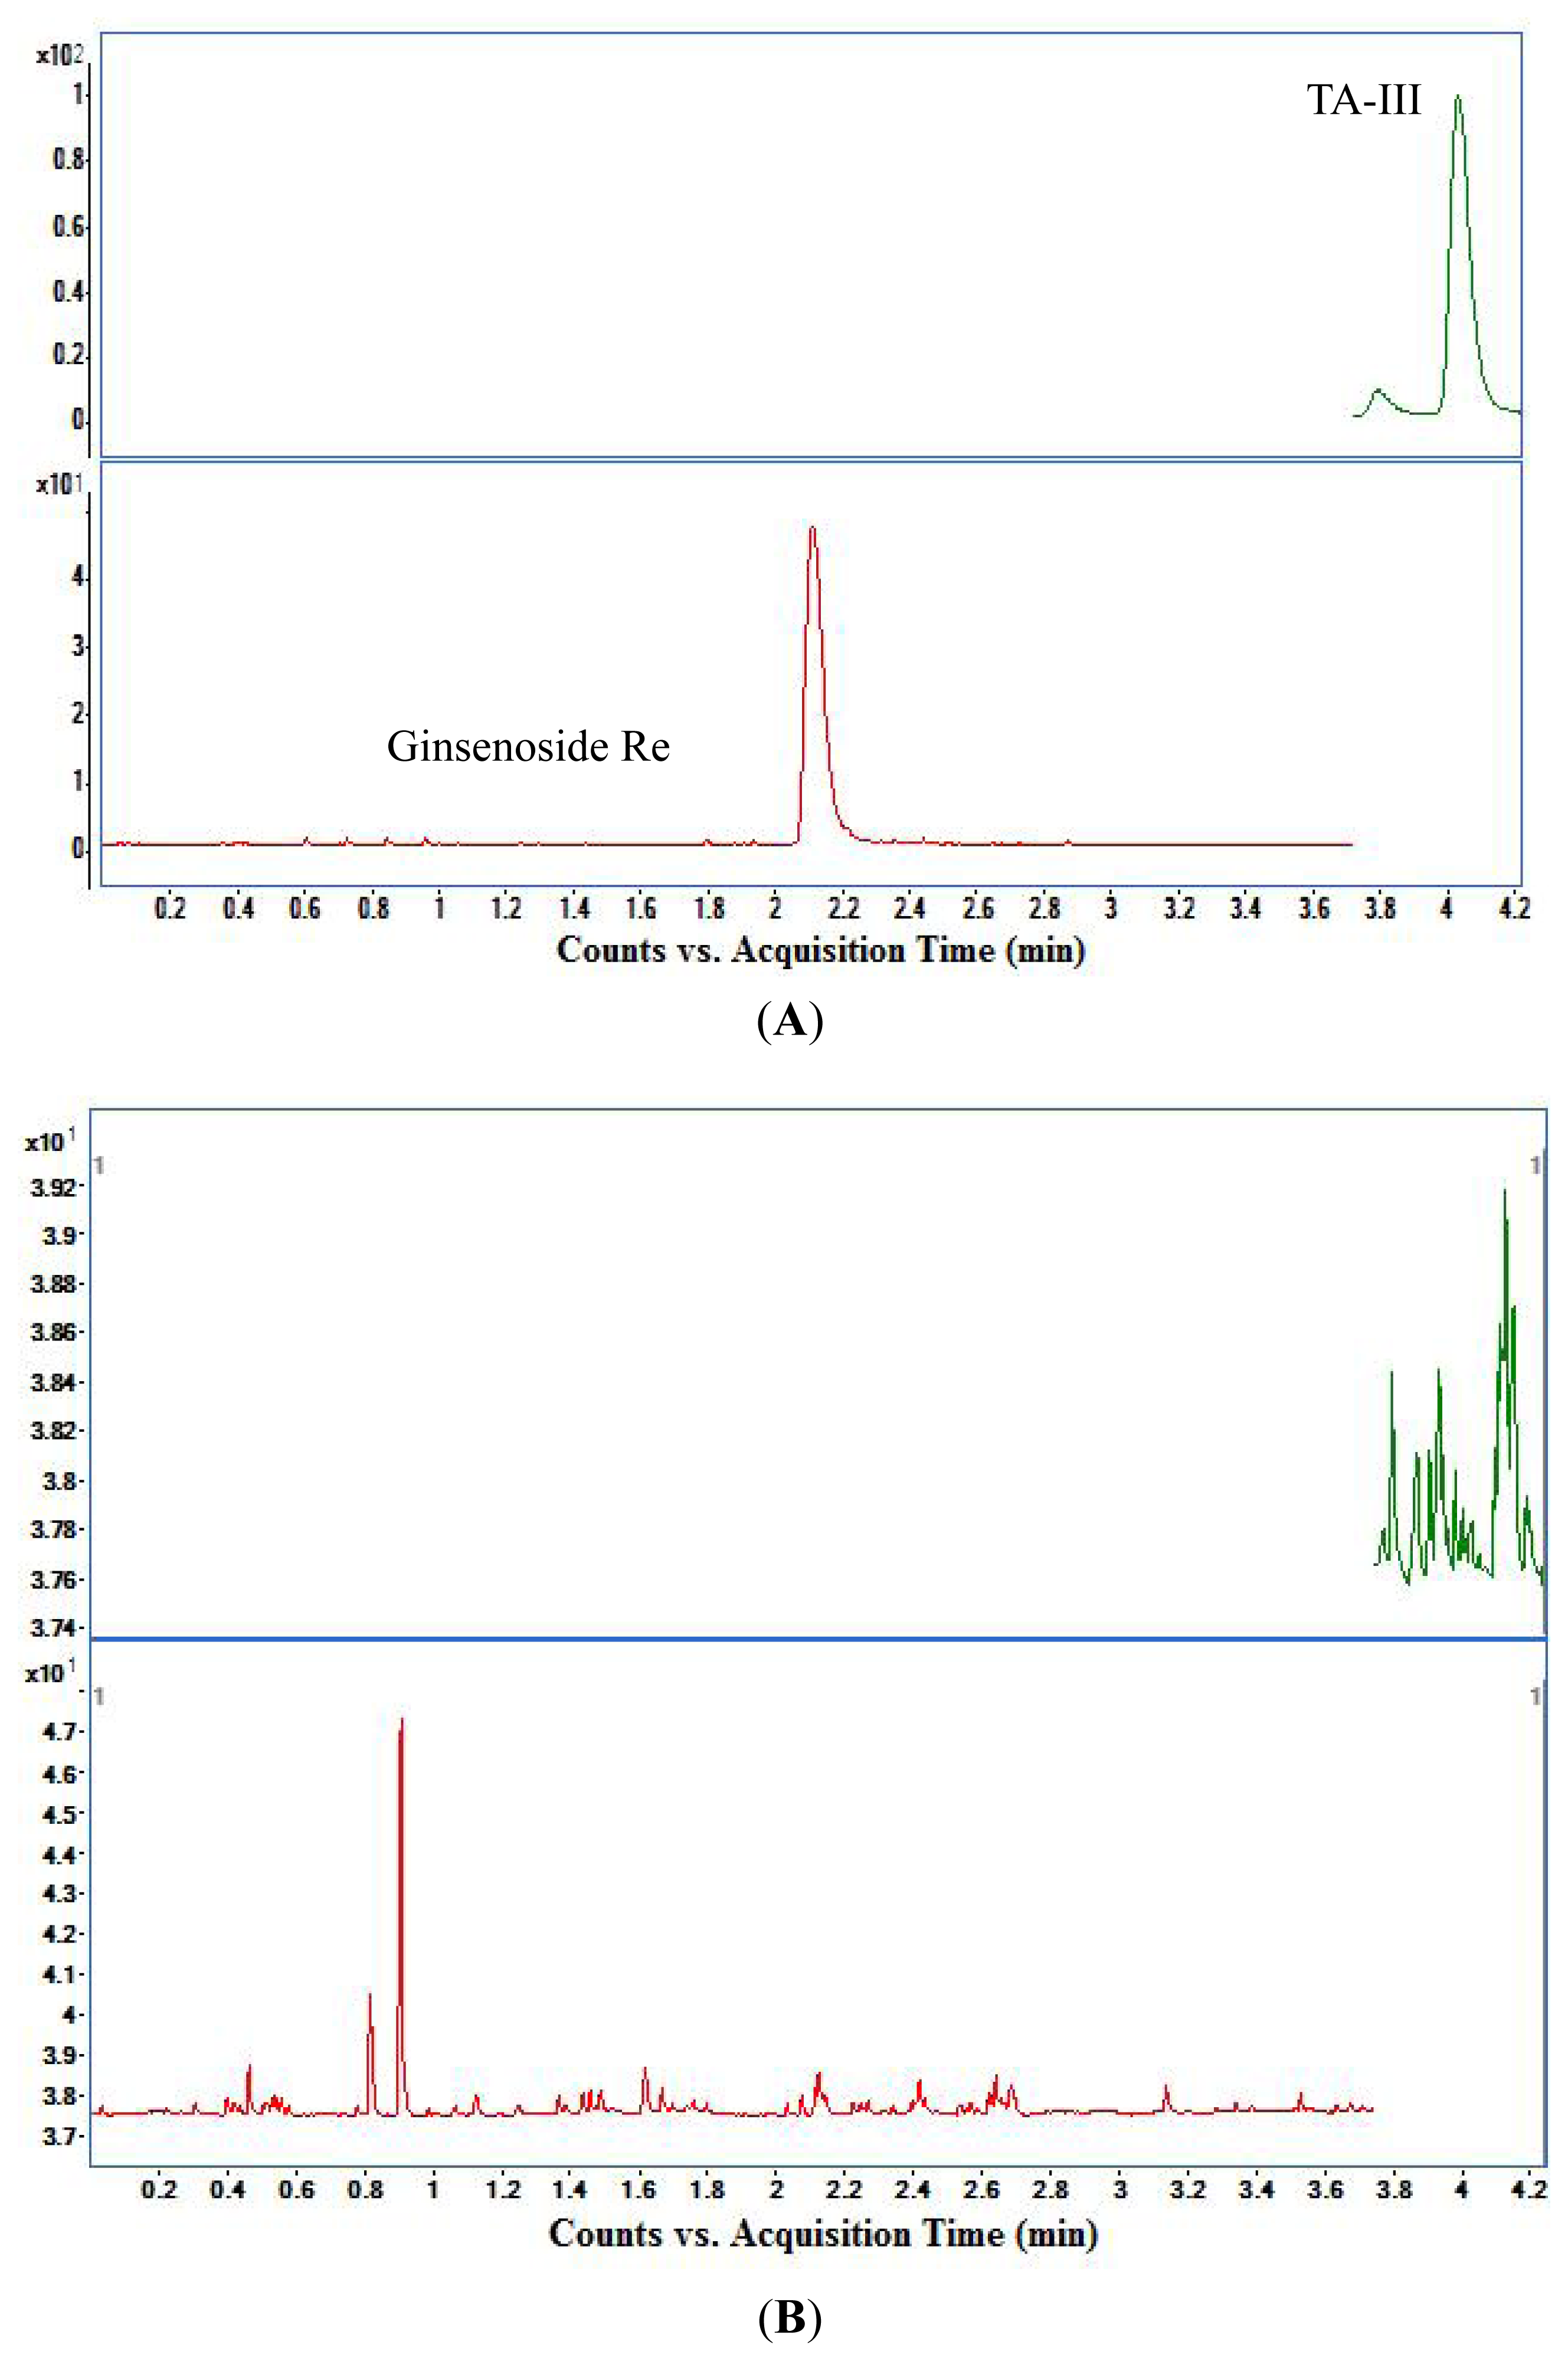
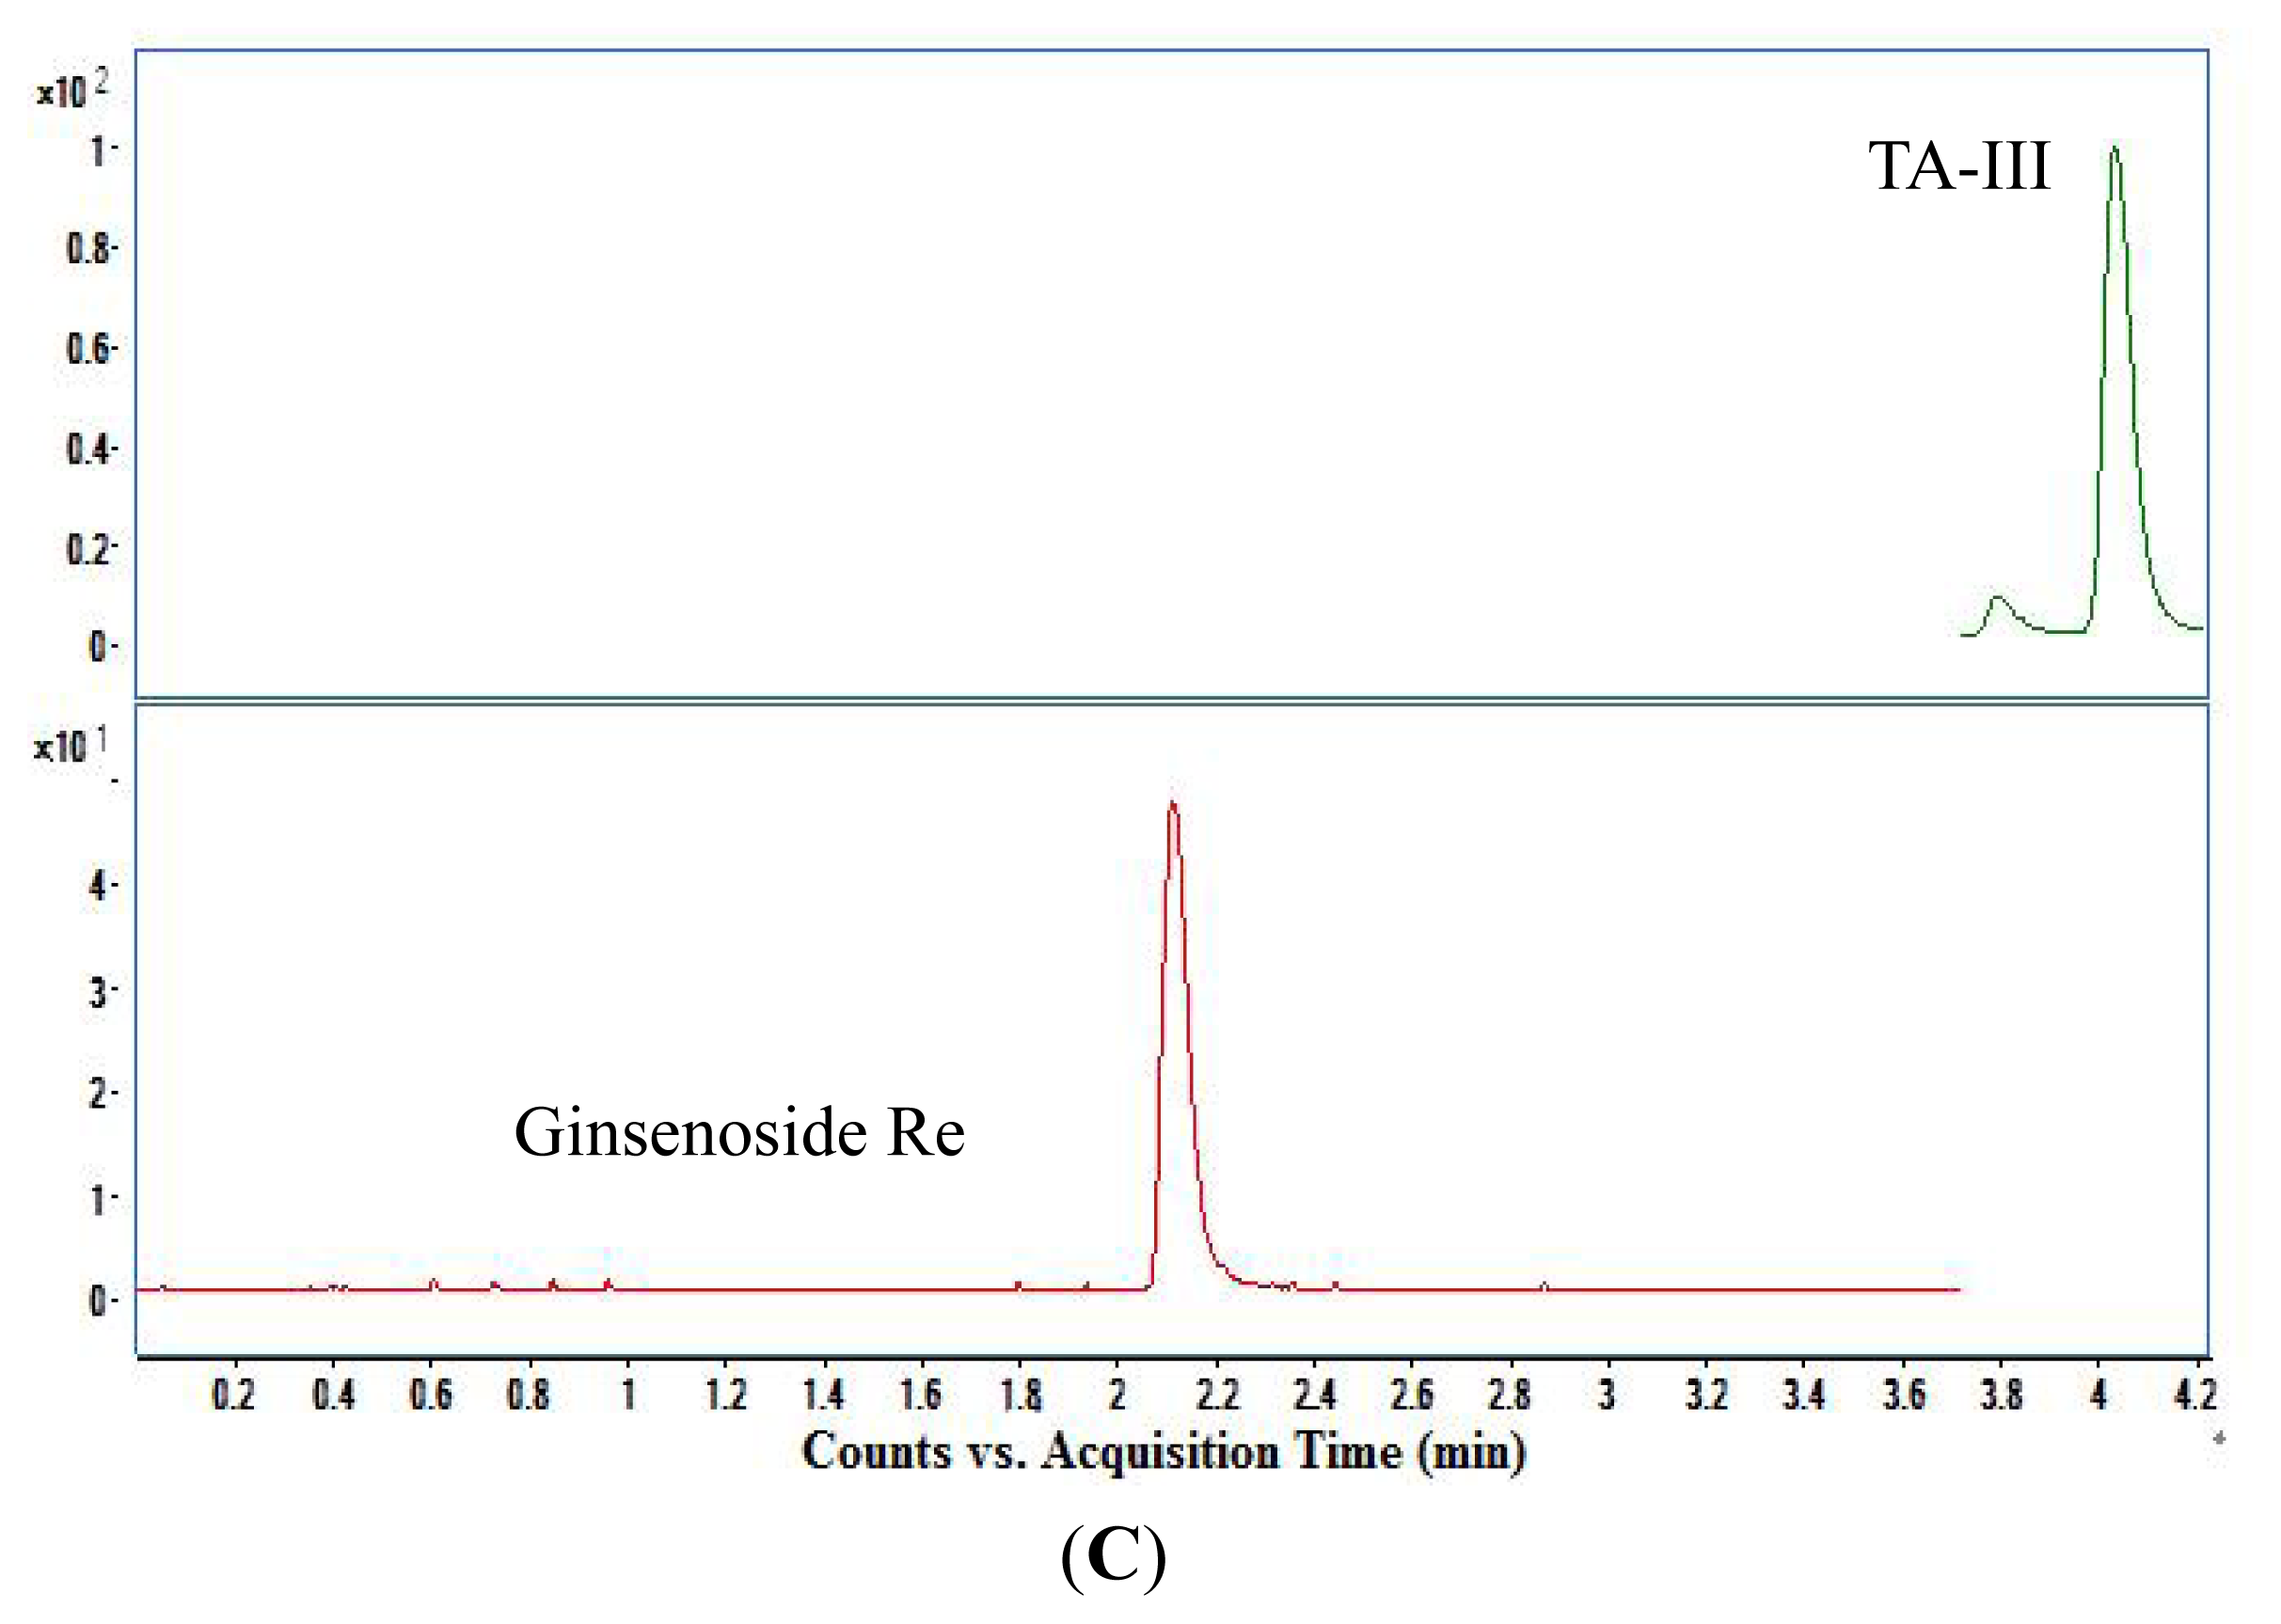
3.1. Selectivity
3.2. Linearity and Lower Limit of Quantification (LLOQ)
3.3. Precision and Accuracy
3.4. Extraction Recovery
3.5. Analyte Stability
3.6. Matrix Effect
4. Pharmacokinetic Analysis
5. Conclusions
Acknowledgements
References
- Lee, B.; Jung, K.; Kim, D.H. Timosaponin AIII, a saponin isolated from Anemarrhena asphodeloides, ameliorates learning and memory deficits in mice. Pharmacol. Biochem. Behav 2009, 93, 121–127. [Google Scholar]
- Sy, L.-K.; Yan, S.-C.; Lok, C.-N.; Man, C.N.; Che, C.M. Timosaponin A-III induces autophagypreceding mitochondria-mediated apoptosis in HeLa cancer cells. Cancer Res 2008, 68, 10229–10237. [Google Scholar]
- King, F.W.; Fong, S.; Griffin, C.; Shoemaker, M.; Staub, R.; Zhang, Y.-L.; Cohen, I.; Shtivelman, E. Timosaponin AIII is preferentially cytotoxic to tumor cells through inhibition of mTOR and induction of ER stress. PLoS One 2009, 4, e7283. [Google Scholar]
- Youn, U.J.; Jang, J.-E.; Nam, J.-W.; Lee, Y.J.; Son, Y.M.; Shin, H.J.; Han, A.-R.; Chang, J.; Seo, E.-K. Anti-respiratory syncytial virus (RSV) activity of timosaponin A-III from the rhizomes of Anemarrhena asphodeloides. J. Med. Plants Res 2011, 5, 1062–1065. [Google Scholar]
- Lok, C.-N.; Sy, L.-K.; Liu, F.L.; Che, C.-M. Activation of Autophagy of Aggregation-prone Ubiquitinated Proteins by Timosaponin A-III. J. Biol. Chem 2011, 286, 31684–31696. [Google Scholar]
- Cai, F.; Sun, L.N.; Gao, S.H.; Yang, Y.; Yang, Q.; Chen, W.S. A rapid and sensitive liquid chromatography-tandem mass spectrometric method for the determination of timosaponin B-II in blood plasma and a study of the pharmacokinetics of saponin in the rat. J. Pharm. Biomed. Anal 2008, 48, 1411–1416. [Google Scholar]
- Ma, B.P.; Dong, J.X.; Wang, B.J.; Yan, X.Z. Study on the furostanol saponin from rhizoma anemarrhenae. Acta Pharm. Sini 1996, 31, 271–277. [Google Scholar]


| Time (min) | A (H2O) | D (Acetonitrile) | Flow (mL/min) |
|---|---|---|---|
| 0 | 85% | 15% | 0.4 |
| 0.5 | 85% | 15% | 0.4 |
| 6.0 | 10% | 90% | 0.4 |
| 7.0 | 10% | 90% | 0.4 |
| 7.1 | 85% | 15% | 0.4 |
| 9 | 85% | 15% | 0.4 |
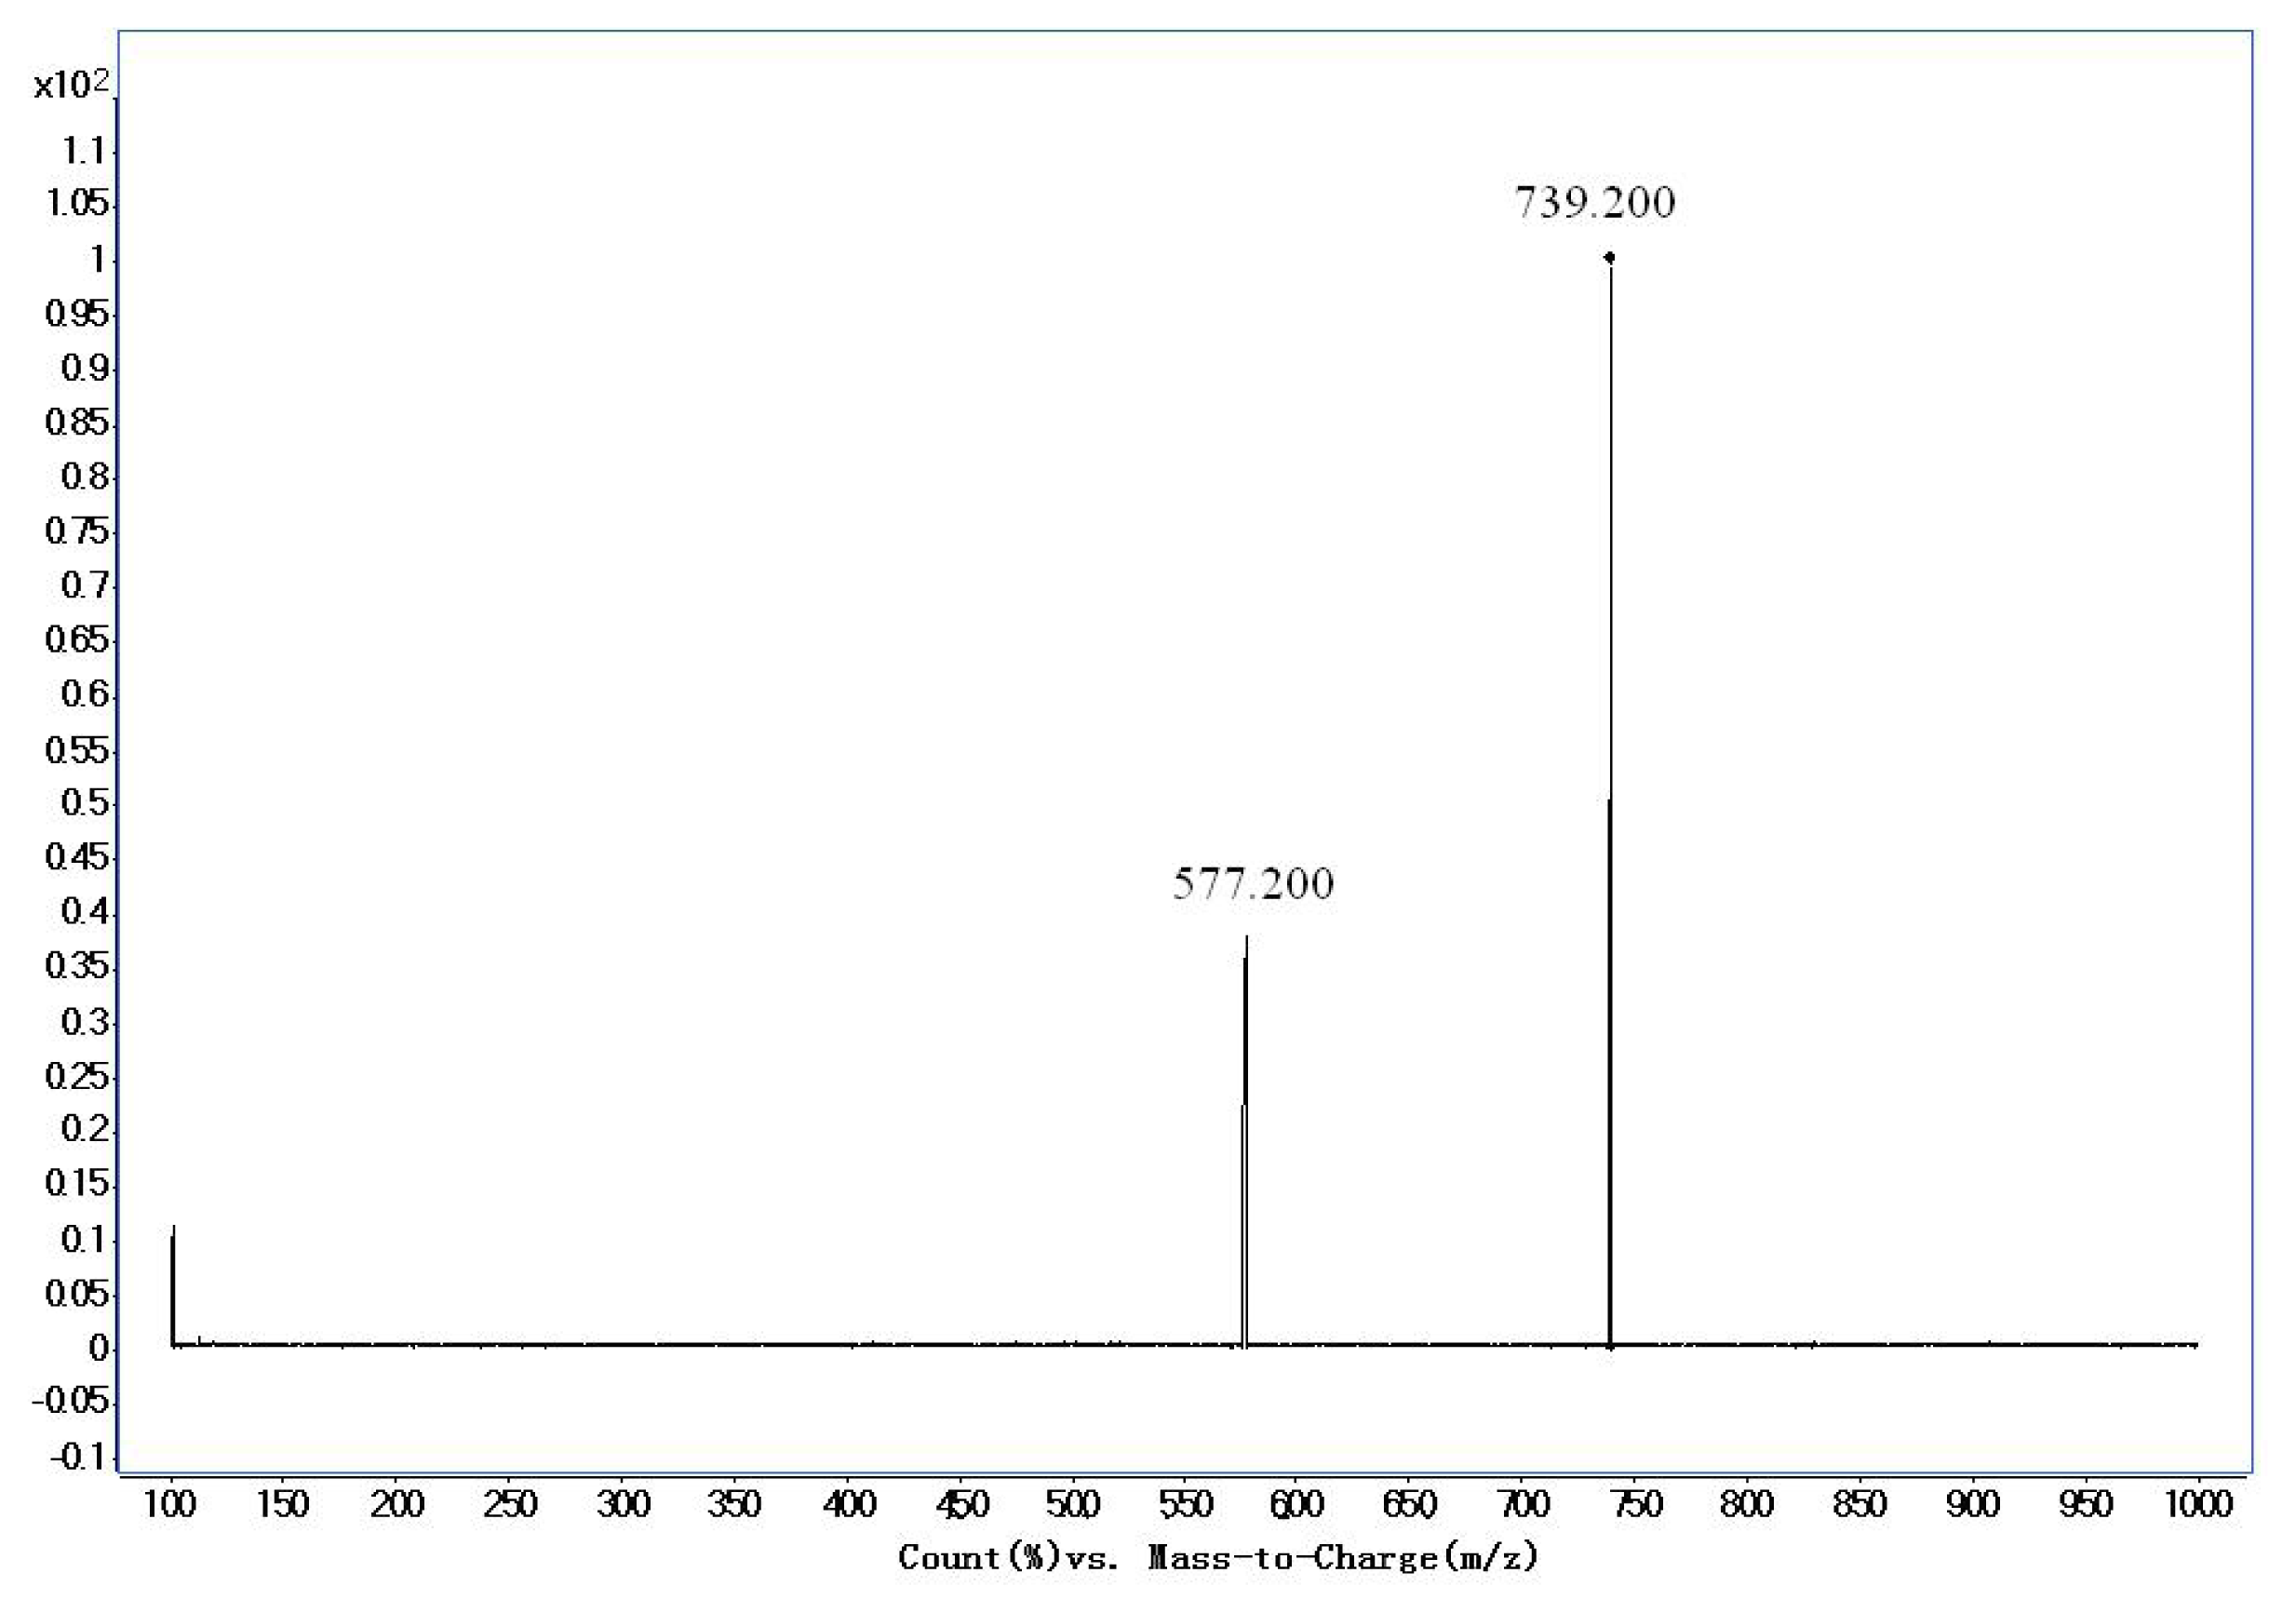
| Sample Name | Precursor/Product Ion | Dwell (msec) | Fragmentor | CE |
|---|---|---|---|---|
| Timosapoin AIII | 739.2/577.2 | 200 | 260 | 30 |
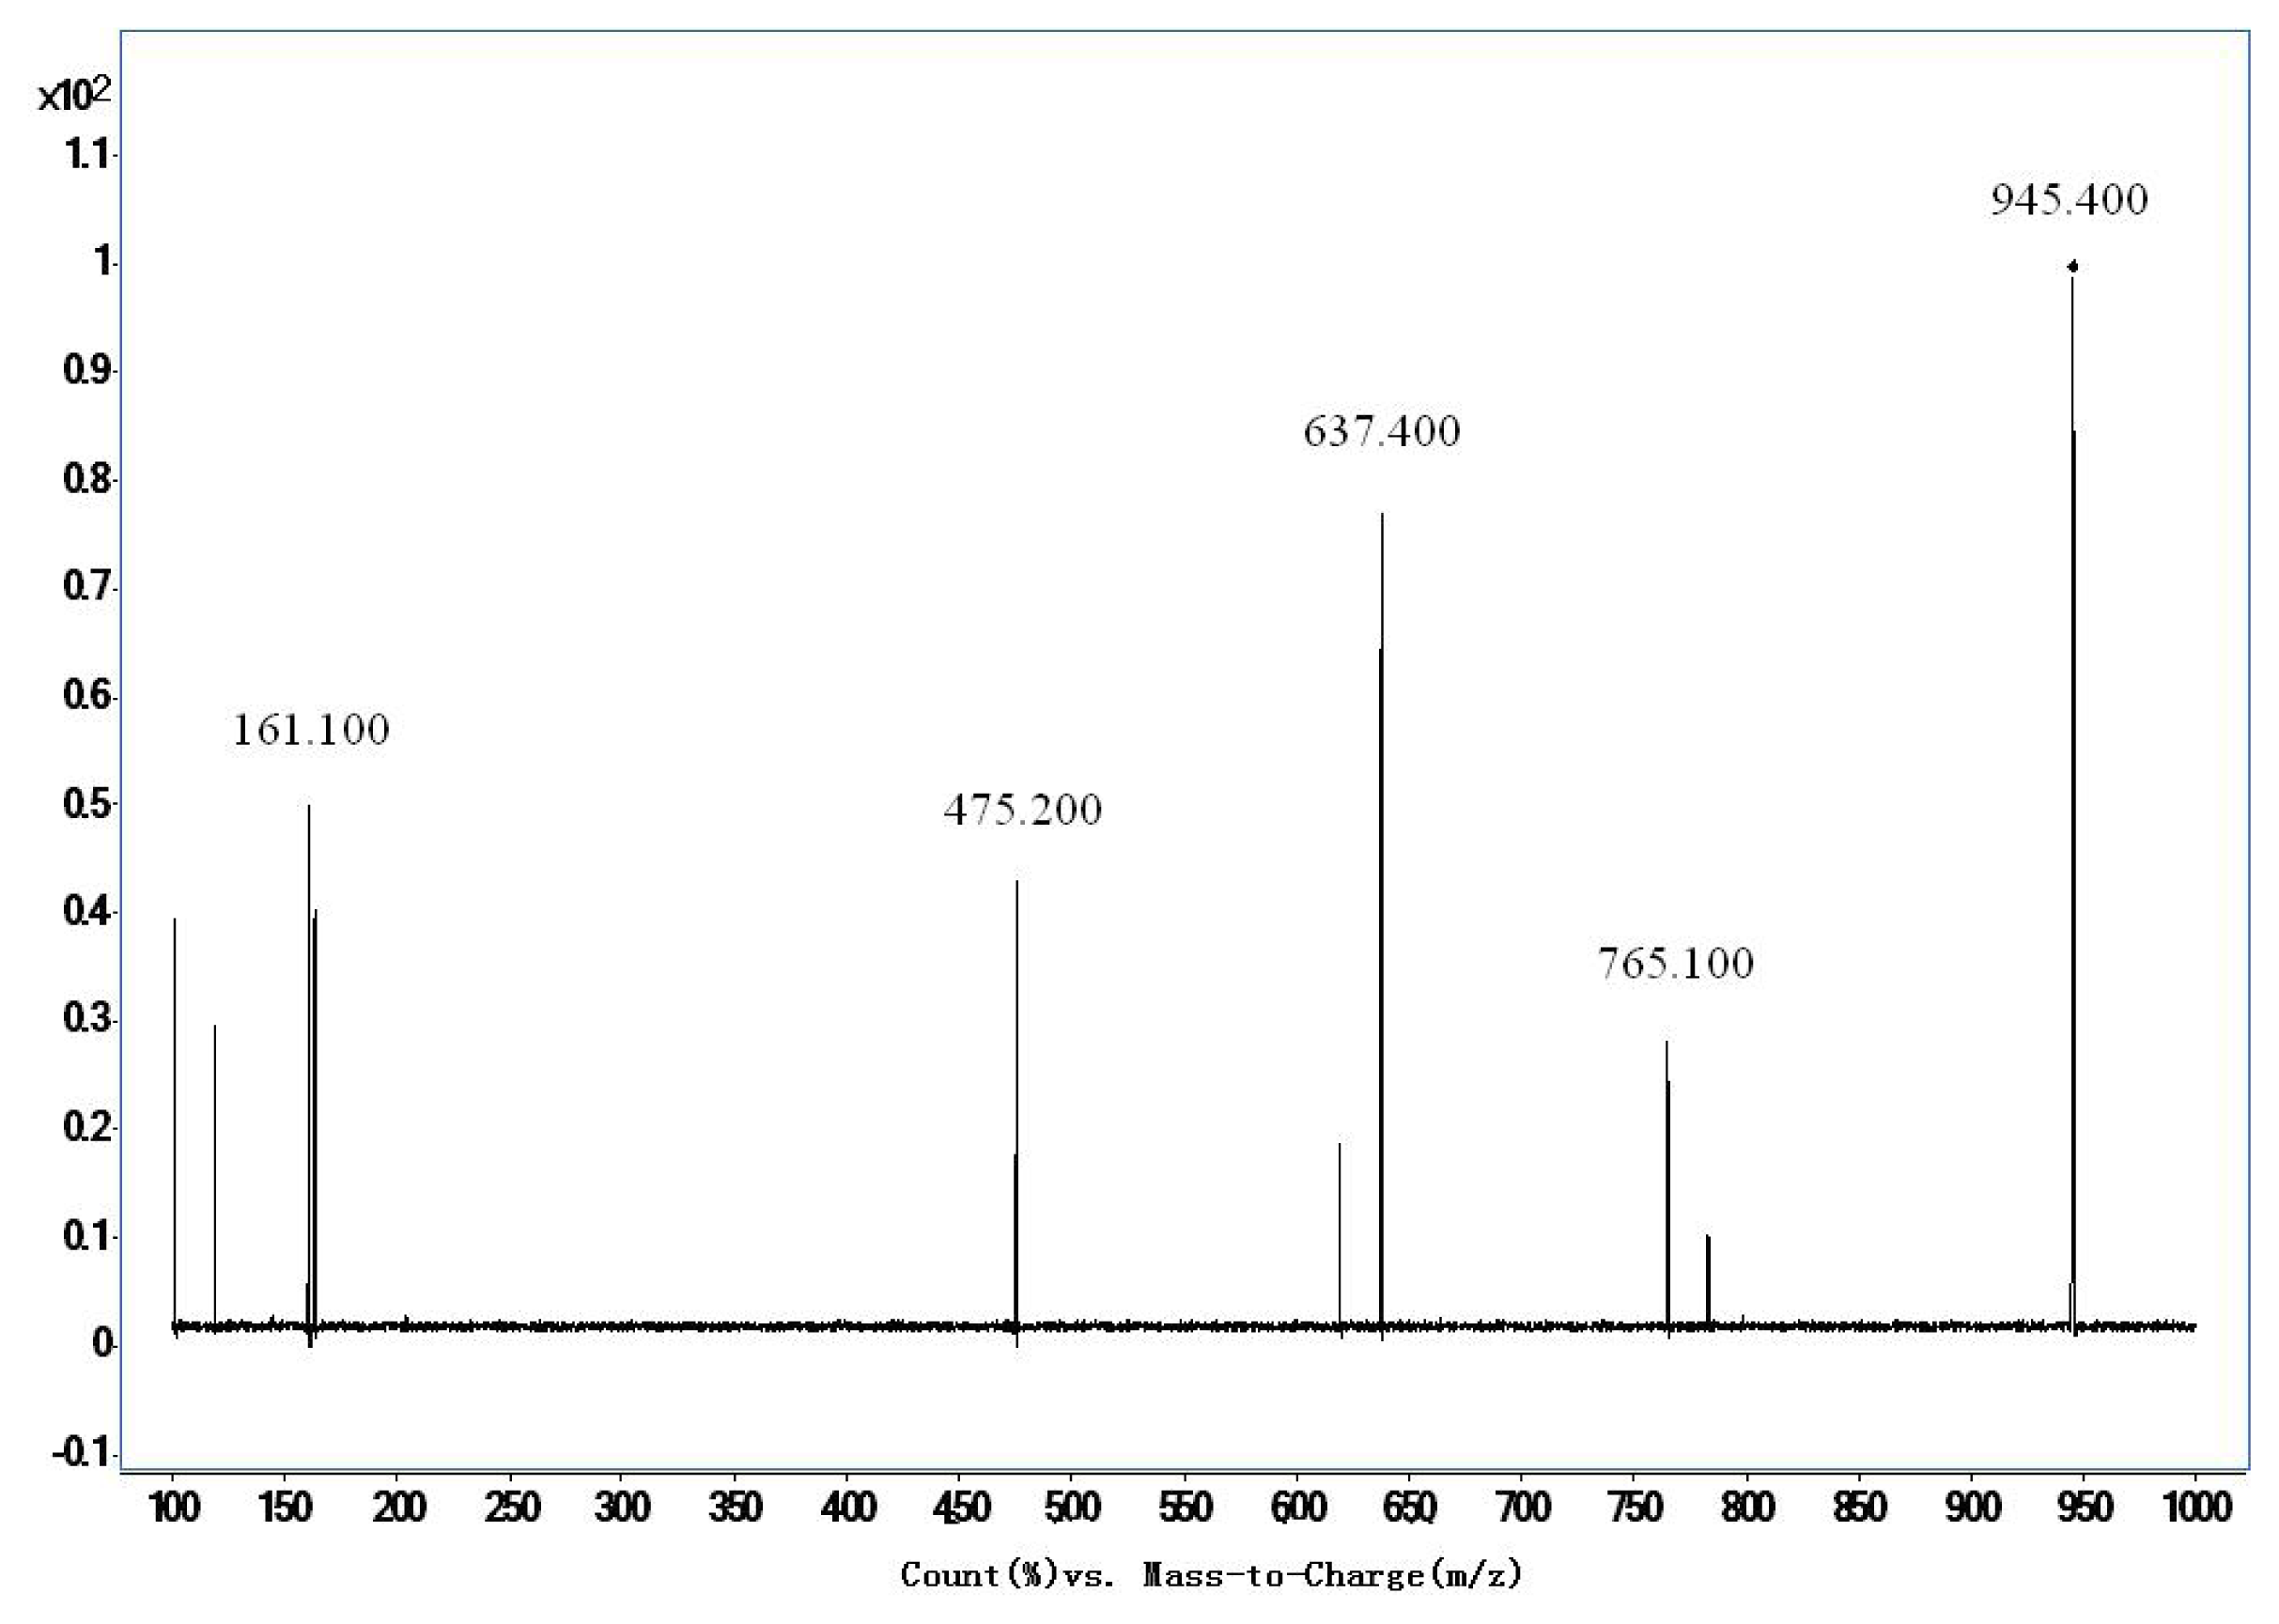
| Ginsenoside Re | 945.4/475.2 | 200 | 280 | 60 |
| Concentrations (ng/mL) | 11.14 | 55.7 | 111.4 | 278.5 | 557 | 1114 |
|---|---|---|---|---|---|---|
| Peak-area ratios (n = 6) | 0.0526 | 0.2105 | 0.4075 | 0.7726 | 1.2768 | 2.4608 |
| Calibration curve | y = 0.0021x + 0.1111(r = 0.9960, n = 6) | |||||
| Concentration (ng/mL) | 1 | 2 | 3 | 4 | 5 | 6 | AVE | RSD (%) |
|---|---|---|---|---|---|---|---|---|
| 11.14 | 10.5 | 10.7 | 10.9 | 10.9 | 11.4 | 12.9 | 11.2 | 7.8 |
| 557 | 593.3 | 554.8 | 580.6 | 602.4 | 558.5 | 562.8 | 575.4 | 3.4 |
| 1114 | 1143.3 | 1137.0 | 1108.6 | 1101.0 | 1036.9 | 1065.0 | 1098.0 | 3.8 |
| Concentration (ng/mL) | 1d | 2d | 3d | 4d | 5d | 6d | AVE | RSD (%) |
|---|---|---|---|---|---|---|---|---|
| 11.14 | 11.2 | 11.1 | 11.1 | 11.1 | 11.0 | 11.9 | 11.2 | 3.0 |
| 557 | 575.4 | 536.5 | 571.4 | 577.9 | 561.8 | 566.9 | 566.5 | 2.7 |
| 1114 | 1098.0 | 1081.4 | 1085.4 | 1072.7 | 1042.3 | 1166.0 | 1092.0 | 3.5 |
| Concentration (ng/mL) | RE (%) | AVE (%) | |||||
|---|---|---|---|---|---|---|---|
| 1 | 2 | 3 | 4 | 5 | 6 | ||
| 11.14 | 6.4 | 12.2 | 11.3 | 4.3 | 4.1 | 11.5 | 9.1 |
| 557 | 5.8 | 5.0 | 1.3 | 9.2 | 10.9 | 11.4 | 7.3 |
| 1114 | 4.8 | 11.3 | 10.4 | 0.3 | 6.6 | 5.0 | 6.4 |
| Sample | Extract recovery (%) | AVE (%) | RSD (%) | |||||
|---|---|---|---|---|---|---|---|---|
| Concentration (ng/mL) | ||||||||
| 11.14 | 93.6 | 93.8 | 99.6 | 96.1 | 89.5 | 88.4 | 93.5 | 3.9 |
| 557 | 83.2 | 93.2 | 92.5 | 94.4 | 94.0 | 96.4 | 92.3 | 5.0 |
| 1114 | 95.6 | 97.5 | 97.1 | 97.2 | 96.2 | 89.6 | 95.5 | 1.2 |
| Concentration (ng/mL) | 1 | 2 | 3 | 4 | 5 | 6 | AVE | RE (%) |
|---|---|---|---|---|---|---|---|---|
| 11.14 | 10.8 | 11.4 | 11.4 | 11.1 | 11.5 | 11.2 | 11.2 | 0.8 |
| 557 | 600.7 | 592.4 | 603.7 | 588.7 | 621.9 | 566.9 | 595.7 | 6.9 |
| 1114 | 1135.0 | 1153.7 | 1076.2 | 1062.6 | 1152.3 | 1081.9 | 1110.3 | 3.3 |
| Concentration (ng/mL) | 1 | 2 | 3 | 4 | 5 | 6 | AVE | RE (%) |
|---|---|---|---|---|---|---|---|---|
| 11.14 | 10.2 | 10.6 | 11.4 | 11.7 | 11.2 | 11.7 | 11.1 | 0.2 |
| 557 | 582.4 | 512.3 | 582.0 | 583.8 | 559.5 | 580.7 | 566.8 | 1.7 |
| 1114 | 1149.1 | 1076.6 | 1066.7 | 1131.9 | 1073.3 | 1070.2 | 1094.6 | 1.7 |
| Concentration (ng/mL) | 1 | 2 | 3 | 4 | 5 | 6 | AVE | RE (%) |
|---|---|---|---|---|---|---|---|---|
| 11.14 | 10.9 | 10.6 | 11.0 | 10.6 | 10.9 | 12.1 | 11.0 | 1.0 |
| 557 | 560.4 | 547.0 | 547.2 | 524.5 | 553.6 | 563.7 | 549.4 | 1.4 |
| 1114 | 969.8 | 1091.1 | 984.6 | 1007.6 | 1018.7 | 996.3 | 1011.4 | 9.2 |
| Concentration (ng/mL) | 1 day | 50 days | AVE | RE (%) |
|---|---|---|---|---|
| 11.14 | 11.9 | 11.2 | 11.6 | 3.3 |
| 557 | 566.9 | 564.3 | 565.6 | 1.5 |
| 1114 | 1166.0 | 1096.9 | 1131.5 | 1.6 |
| Sample | Matrix Effect of TA-III (%) | ||||||
|---|---|---|---|---|---|---|---|
| Concentration (ng/mL) | 1 | 2 | 3 | 4 | 5 | AVE (%) | RSD (%) |
| 11.14 | 112.8 | 106.1 | 106.0 | 110.4 | 104.0 | 107.9 | 3.4 |
| 557 | 110.2 | 107.8 | 92.2 | 113.6 | 115.0 | 107.8 | 8.5 |
| 1114 | 105.3 | 109.8 | 99.3 | 97.7 | 97.5 | 101.9 | 5.3 |
| Time (h) | Rat 1 | Rat 2 | Rat 3 | Rat 4 | Rat 5 | AVE | SD |
|---|---|---|---|---|---|---|---|
| 0.5 | 3.7 * | 0.0 | 0.4 * | 1.5 * | 12.2 | 3.5 * | 1.42 |
| 1 | 17.2 | 3.1 * | 6.1 * | 13.7 | 17.8 | 11.6 | 0.57 |
| 2 | 42.0 | 58.9 | 18.6 | 47.0 | 44.7 | 42.2 | 0.35 |
| 4 | 95.0 | 90.5 | 54.1 | 82.6 | 98.6 | 84.2 | 0.21 |
| 6 | 95.4 | 97.5 | 62.7 | 127.2 | 86.9 | 93.9 | 0.25 |
| 7 | 100.7 | 91.3 | 93.2 | 131.0 | 106.3 | 104.5 | 0.15 |
| 8 | 37.7 | 32.7 | 28.4 | 89.0 | 16.7 | 40.9 | 0.68 |
| 10 | 33.9 | 22.8 | 25.9 | 25.3 | 9.7 * | 23.5 | 0.37 |
| 12 | 18.4 | 13.1 | 42.3 | 39.4 | 11.0 * | 24.8 | 0.60 |
| 14 | 12.3 | 9.7 * | 47.4 | 34.5 | 16.4 | 24.1 | 0.67 |
| 24 | 6.6 * | 8.4 * | 31.8 | 21.7 | 11.1 * | 15.9 | 0.67 |
| 27 | 3.5 * | 3.9 * | 24.5 | 13.1 | 1.5 * | 9.3 * | 1.03 |
| 30 | 5.9 * | 3.8 * | 11.6 | 4.1 * | 0.2 * | 5.1 * | 0.81 |
| 36 | 1.9 * | 0.5 * | 13.0 | 11.3 * | 0.5 * | 5.4 * | 1.14 |
| 48 | 0.2 * | 1.4 * | 7.7 * | 1.9 * | 0.0 * | 2.2 * | 1.40 |
| Time (h) | Rat 1 | Rat 2 | Rat 3 | Rat 4 | Rat 5 | AVE | SD |
|---|---|---|---|---|---|---|---|
| 0.5 | 5.9 * | 27.6 | 17.8 | 17.1 | 12.7 | 16.2 | 0.49 |
| 1 | 6.6 * | 29.3 | 37.2 | 11.8 | 10.7 * | 19.1 | 0.70 |
| 2 | 12.6 | 63.1 | 94.5 | 85.0 | 15.2 | 54.1 | 0.71 |
| 4 | 29.5 | 122.2 | 129.7 | 183.8 | 53.3 | 103.7 | 0.60 |
| 6 | 45.7 | 129.5 | 237.4 | 148.0 | 122.3 | 136.6 | 0.50 |
| 7 | 71.4 | 237.4 | 340.8 | 401.1 | 131.3 | 236.4 | 0.58 |
| 8 | 109.6 | 285.6 | 285.5 | 381.8 | 261.3 | 264.8 | 0.37 |
| 10 | 234.0 | 199.9 | 226.5 | 88.0 | 181.2 | 185.9 | 0.32 |
| 12 | 55.0 | 44.9 | 108.2 | 104.4 | 131.6 | 88.8 | 0.42 |
| 14 | 69.1 | 84.7 | 87.9 | 110.4 | 107.5 | 91.9 | 0.19 |
| 24 | 1.0 * | 51.1 | 5.9 * | 10.9 * | 6.3 * | 15.0 | 1.36 |
| 27 | 11.6 | 10.6 * | 0.0 | 2.7 * | 6.2 * | 6.2 * | 0.80 |
| 30 | 13.6 | 11.0 * | 11.0 * | 5.8 * | 9.6 * | 10.2 * | 0.28 |
| 36 | 3.5 * | 1.8 * | 1.8 * | 0.0 | 3.2 * | 2.0 * | 0.68 |
| 48 | 0.4 * | 2.3 * | 1.7 * | 1.6 * | 0.0 | 1.2 * | 0.81 |
| Time (h) | Rat1 | Rat 2 | Rat 3 | Rat 4 | Rat 5 | AVE | SD |
|---|---|---|---|---|---|---|---|
| 0.5 | 0.0 | 26.3 | 0.0 | 0.0 | 0.0 | 5.3 * | 2.24 |
| 1 | 30.1 | 38.2 | 2.6 * | 9.4 * | 2.8 * | 16.6 | 0.99 |
| 2 | 15.1 | 38.2 | 11.6 | 42.0 | 20.2 | 25.4 | 0.54 |
| 4 | 54.6 | 63.2 | 8.0 | 61.1 | 51.9 | 47.8 | 0.47 |
| 6 | 170.1 | 71.7 | 48.9 | 274.2 | 71.9 | 127.3 | 0.74 |
| 7 | 304.2 | 180.0 | 104.3 | 357.5 | 414.1 | 272.1 | 0.47 |
| 8 | 546.1 | 298.7 | 363.0 | 607.3 | 583.3 | 479.7 | 0.29 |
| 10 | 300.8 | 305.0 | 196.9 | 350.9 | 247.3 | 280.2 | 0.21 |
| 12 | 141.6 | 156.4 | 117.1 | 181.0 | 99.1 | 139.0 | 0.23 |
| 14 | 121.1 | 104.9 | 121.9 | 88.9 | 60.7 | 99.5 | 0.26 |
| 24 | 51.8 | 67.0 | 22.1 | 59.8 | 103.5 | 60.8 | 0.48 |
| 27 | 37.9 | 31.5 | 19.8 | 50.5 | 22.2 | 32.4 | 0.38 |
| 30 | 49.2 | 142.5 | 6.4 * | 13.1 | 22.6 | 46.8 | 1.20 |
| 36 | 12.7 * | 12.7 | 26.9 | 16.3 | 31.5 | 20.0 | 0.43 |
| 48 | 5.6 * | 6.8 * | 8.8 * | 3.0 * | 12.5 | 7.3 * | 0.49 |
| Parameters | Rat1 | Rat 2 | Rat 3 | Rat 4 | Rat 5 | MEAN ± SD |
|---|---|---|---|---|---|---|
| T (peak)(h) | 7 | 6 | 7 | 7 | 7 | 6.8 ± 0.4 |
| C (max)(ng/mL) | 100.7 | 97.5 | 93.2 | 131 | 106.3 | 105.7 ± 14.9 |
| Ke (1/h) | 0.352 | 0.374 | 0.051 | 0.274 | 0.419 | 0.294 ± 0.146 |
| Ka (1/h) | 0.407 | 0.416 | 0.984 | 0.314 | 0.472 | 0.519 ± 0.166 |
| t1/2 (ka)(h) | 1.703 | 1.665 | 0.704 | 2.209 | 1.47 | 1.55 ± 0.546 |
| t1/2 (h) | 1.969 | 1.854 | 5.693 | 2.528 | 1.653 | 2.74 ± 1.68 |
| MRT (0–∞)(h) | 9.35 | 9.051 | 19.842 | 13.592 | 8.421 | 12.1 ± 4.8 |
| AUC (0–∞)[(ng/mL)h] | 766.1 | 729.6 | 1347.2 | 1093.9 | 672.1 | 921.8 ± 289.0 |
| Parameters | Rat1 | Rat 2 | Rat 3 | Rat 4 | Rat 5 | MEAN ± SD |
|---|---|---|---|---|---|---|
| T (peak)(h) | 10 | 8 | 7 | 7 | 8 | 8 ± 1.2 |
| C (max)(ng/mL) | 234 | 285.6 | 340.8 | 401.1 | 261.3 | 304.6 ± 66.8 |
| ke (1/h) | 0.279 | 0.195 | 0.205 | 0.3 | 0.209 | 0.238 ± 0.048 |
| ka (1/h) | 0.343 | 0.218 | 0.238 | 0.354 | 0.238 | 0.278 ± 0.065 |
| t1/2 (ka)(h) | 2.022 | 3.175 | 2.912 | 1.958 | 2.91 | 2.60 ± 0.56 |
| t1/2 (h) | 2.482 | 3.556 | 3.38 | 2.313 | 3.311 | 3.01 ± 0.57 |
| MRT (0–∞)(h) | 12.226 | 11.663 | 9.877 | 10.122 | 11.304 | 11.038 ± 1.007 |
| AUC (0–∞)[(ng/mL)h] | 1395.4 | 2682.6 | 3300.0 | 2694.1 | 2347.9 | 2484.0 ± 698.8 |
| Parameters | Rat1 | Rat 2 | Rat 3 | Rat 4 | Rat 5 | MEAN ± SD |
|---|---|---|---|---|---|---|
| T (peak)(h) | 8 | 10 | 8 | 8 | 8 | 8.4 ± 0.9 |
| C (max)(ng/mL) | 546.1 | 305 | 363 | 607.3 | 583.3 | 480.9 ± 137.4 |
| Ke (1/h) | 0.386 | 0.088 | 0.313 | 0.364 | 0.548 | 0.340 ± 0.166 |
| Ka (1/h) | 0.567 | 0.332 | 0.496 | 0.571 | 0.7 | 0.533 ± 0.134 |
| t1/2 (ka)(h) | 1.222 | 2.088 | 1.396 | 1.213 | 0.991 | 1.382 ± 0.420 |
| t1/2 (h) | 1.794 | 7.908 | 2.216 | 1.902 | 1.264 | 3.017 ± 2.756 |
| MRT (0–∞)(h) | 14.236 | 17.46 | 19.741 | 12.753 | 16.889 | 16.216 ± 2.754 |
| AUC (0–∞)[(ng/mL)h] | 2938.3 | 4081.9 | 1992.8 | 3432.8 | 2424.3 | 2974.07 ± 822.2 |
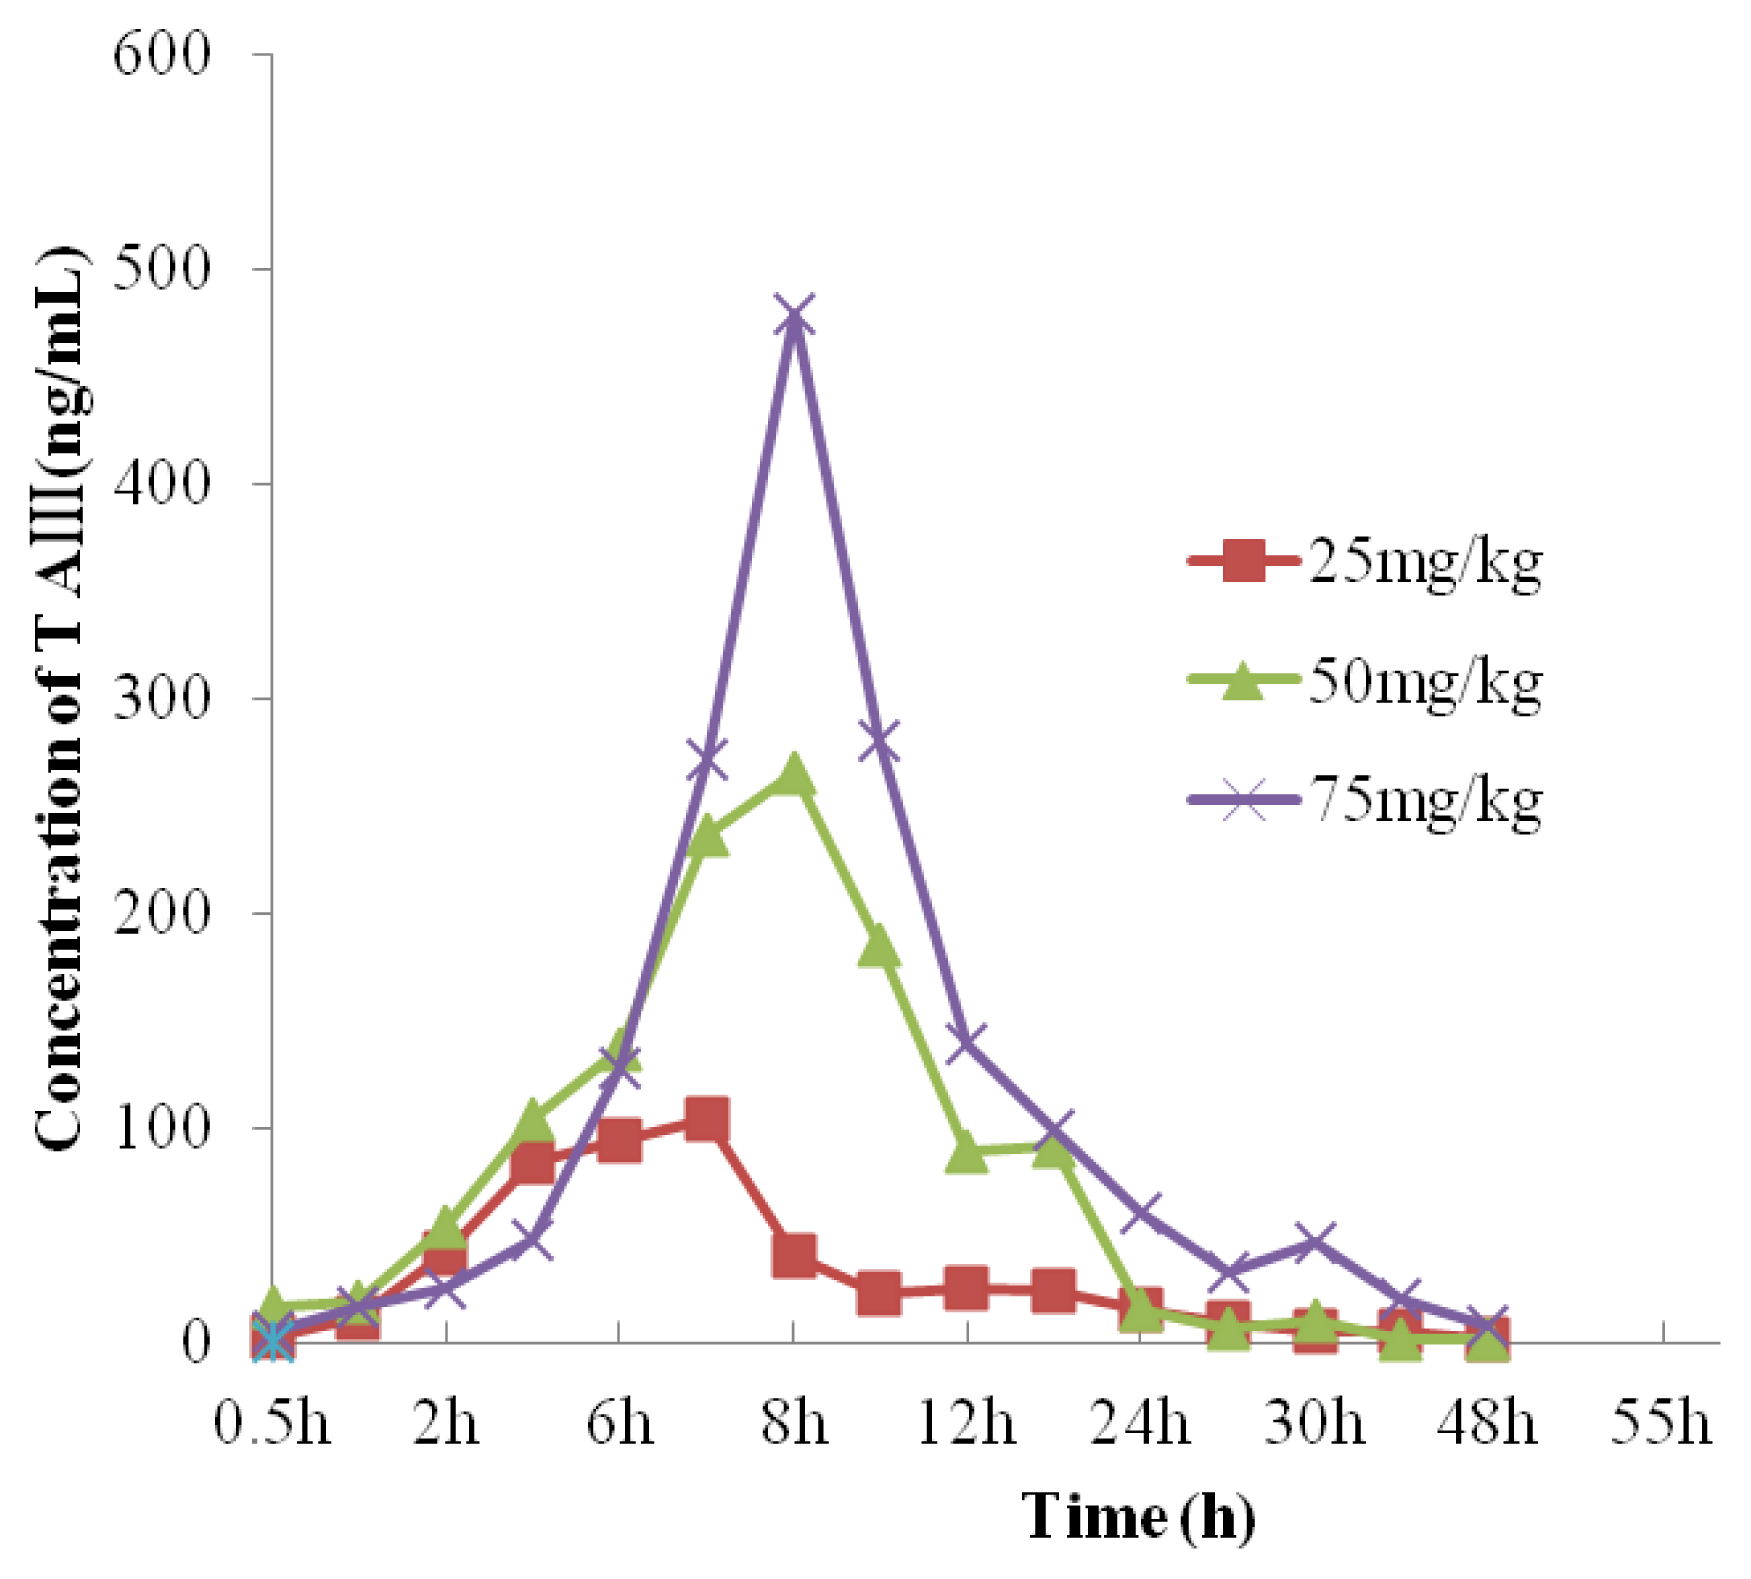
| Parameters | 25 mg/kg | 50 mg/kg | 75 mg/kg |
|---|---|---|---|
| Ke (1/h) | 0.294 ± 0.146 | 0.238 ± 0.048 | 0.340 ± 0.166 |
| Ka (1/h) | 0.519 ± 0.166 | 0.278 ± 0.065 | 0.642 ± 1.393 |
| t1/2 (ka)(h) | 1.55 ± 0.546 | 2.60 ± 0.56 | 1.382 ± 0.420 |
| t1/2 (h) | 2.74 ± 1.68 | 3.01 ± 0.57 | 3.02 ± 2.76 |
| T (peak)(h) | 6.8 ± 0.4 | 8 ± 1.2 | 8.4 ± 0.9 |
| C (max)(ng/mL) | 105.7 ± 14.9 | 304.6 ± 66.8 | 480.9 ± 137.4 |
| AUC [(ng/mL)h] | 921.8 ± 289.0 | 2484.0 ± 698.8 | 2974.07 ± 822.2 |
| MRT (h) | 12.1 ± 4.8 | 11.0 ± 1.0 | 16.2 ± 2.8 |
© 2013 by the authors; licensee Molecular Diversity Preservation International, Basel, Switzerland. This article is an open access article distributed under the terms and conditions of the Creative Commons Attribution license (http://creativecommons.org/licenses/by/3.0/).
Share and Cite
Liu, Y.; Pu, Y.; Zhang, T.; Ding, Y.; Wang, B.; Cai, Z. Rapid and Sensitive Determination of Timosaponin AIII in Rat Plasma by LC-MS/MS and Its Pharmacokinetic Application. Int. J. Mol. Sci. 2013, 14, 3656-3670. https://doi.org/10.3390/ijms14023656
Liu Y, Pu Y, Zhang T, Ding Y, Wang B, Cai Z. Rapid and Sensitive Determination of Timosaponin AIII in Rat Plasma by LC-MS/MS and Its Pharmacokinetic Application. International Journal of Molecular Sciences. 2013; 14(2):3656-3670. https://doi.org/10.3390/ijms14023656
Chicago/Turabian StyleLiu, Yanping, Yiqiong Pu, Tong Zhang, Yue Ding, Bing Wang, and Zhenzhen Cai. 2013. "Rapid and Sensitive Determination of Timosaponin AIII in Rat Plasma by LC-MS/MS and Its Pharmacokinetic Application" International Journal of Molecular Sciences 14, no. 2: 3656-3670. https://doi.org/10.3390/ijms14023656