Early Phenylpropanoid Biosynthetic Steps in Cannabis sativa: Link between Genes and Metabolites

Abstract
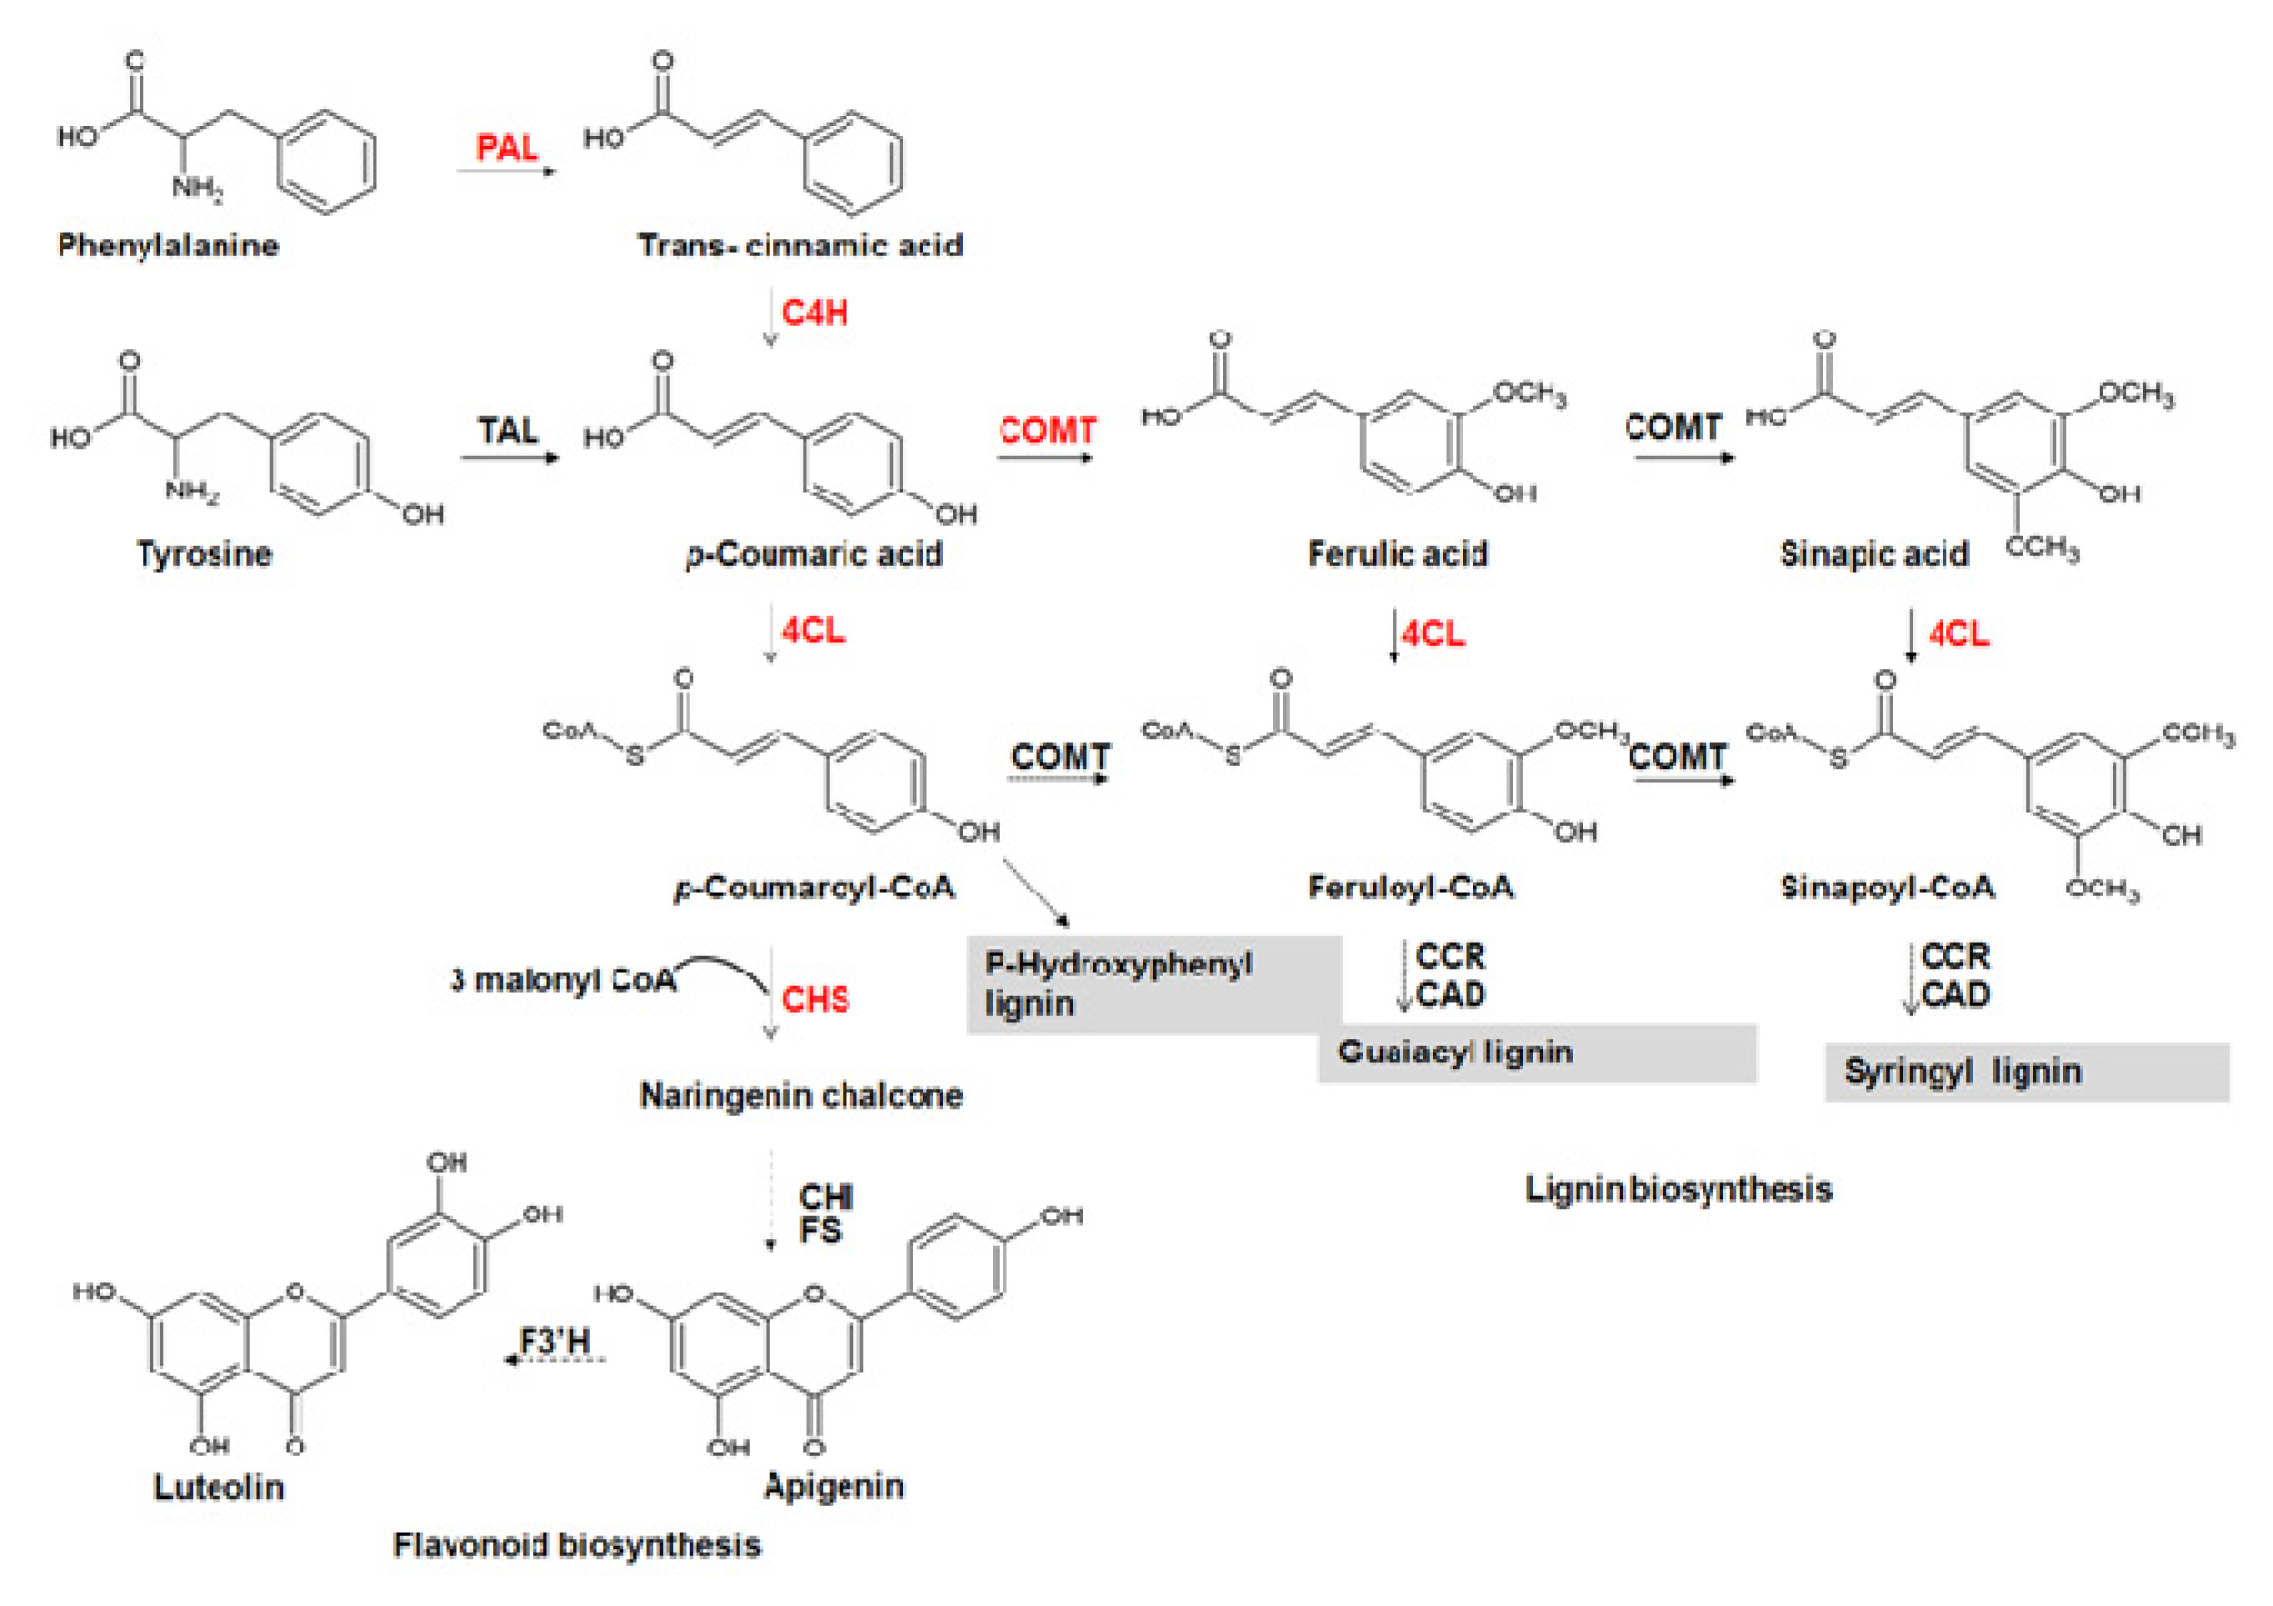
:1. Introduction
2. Results and Discussion
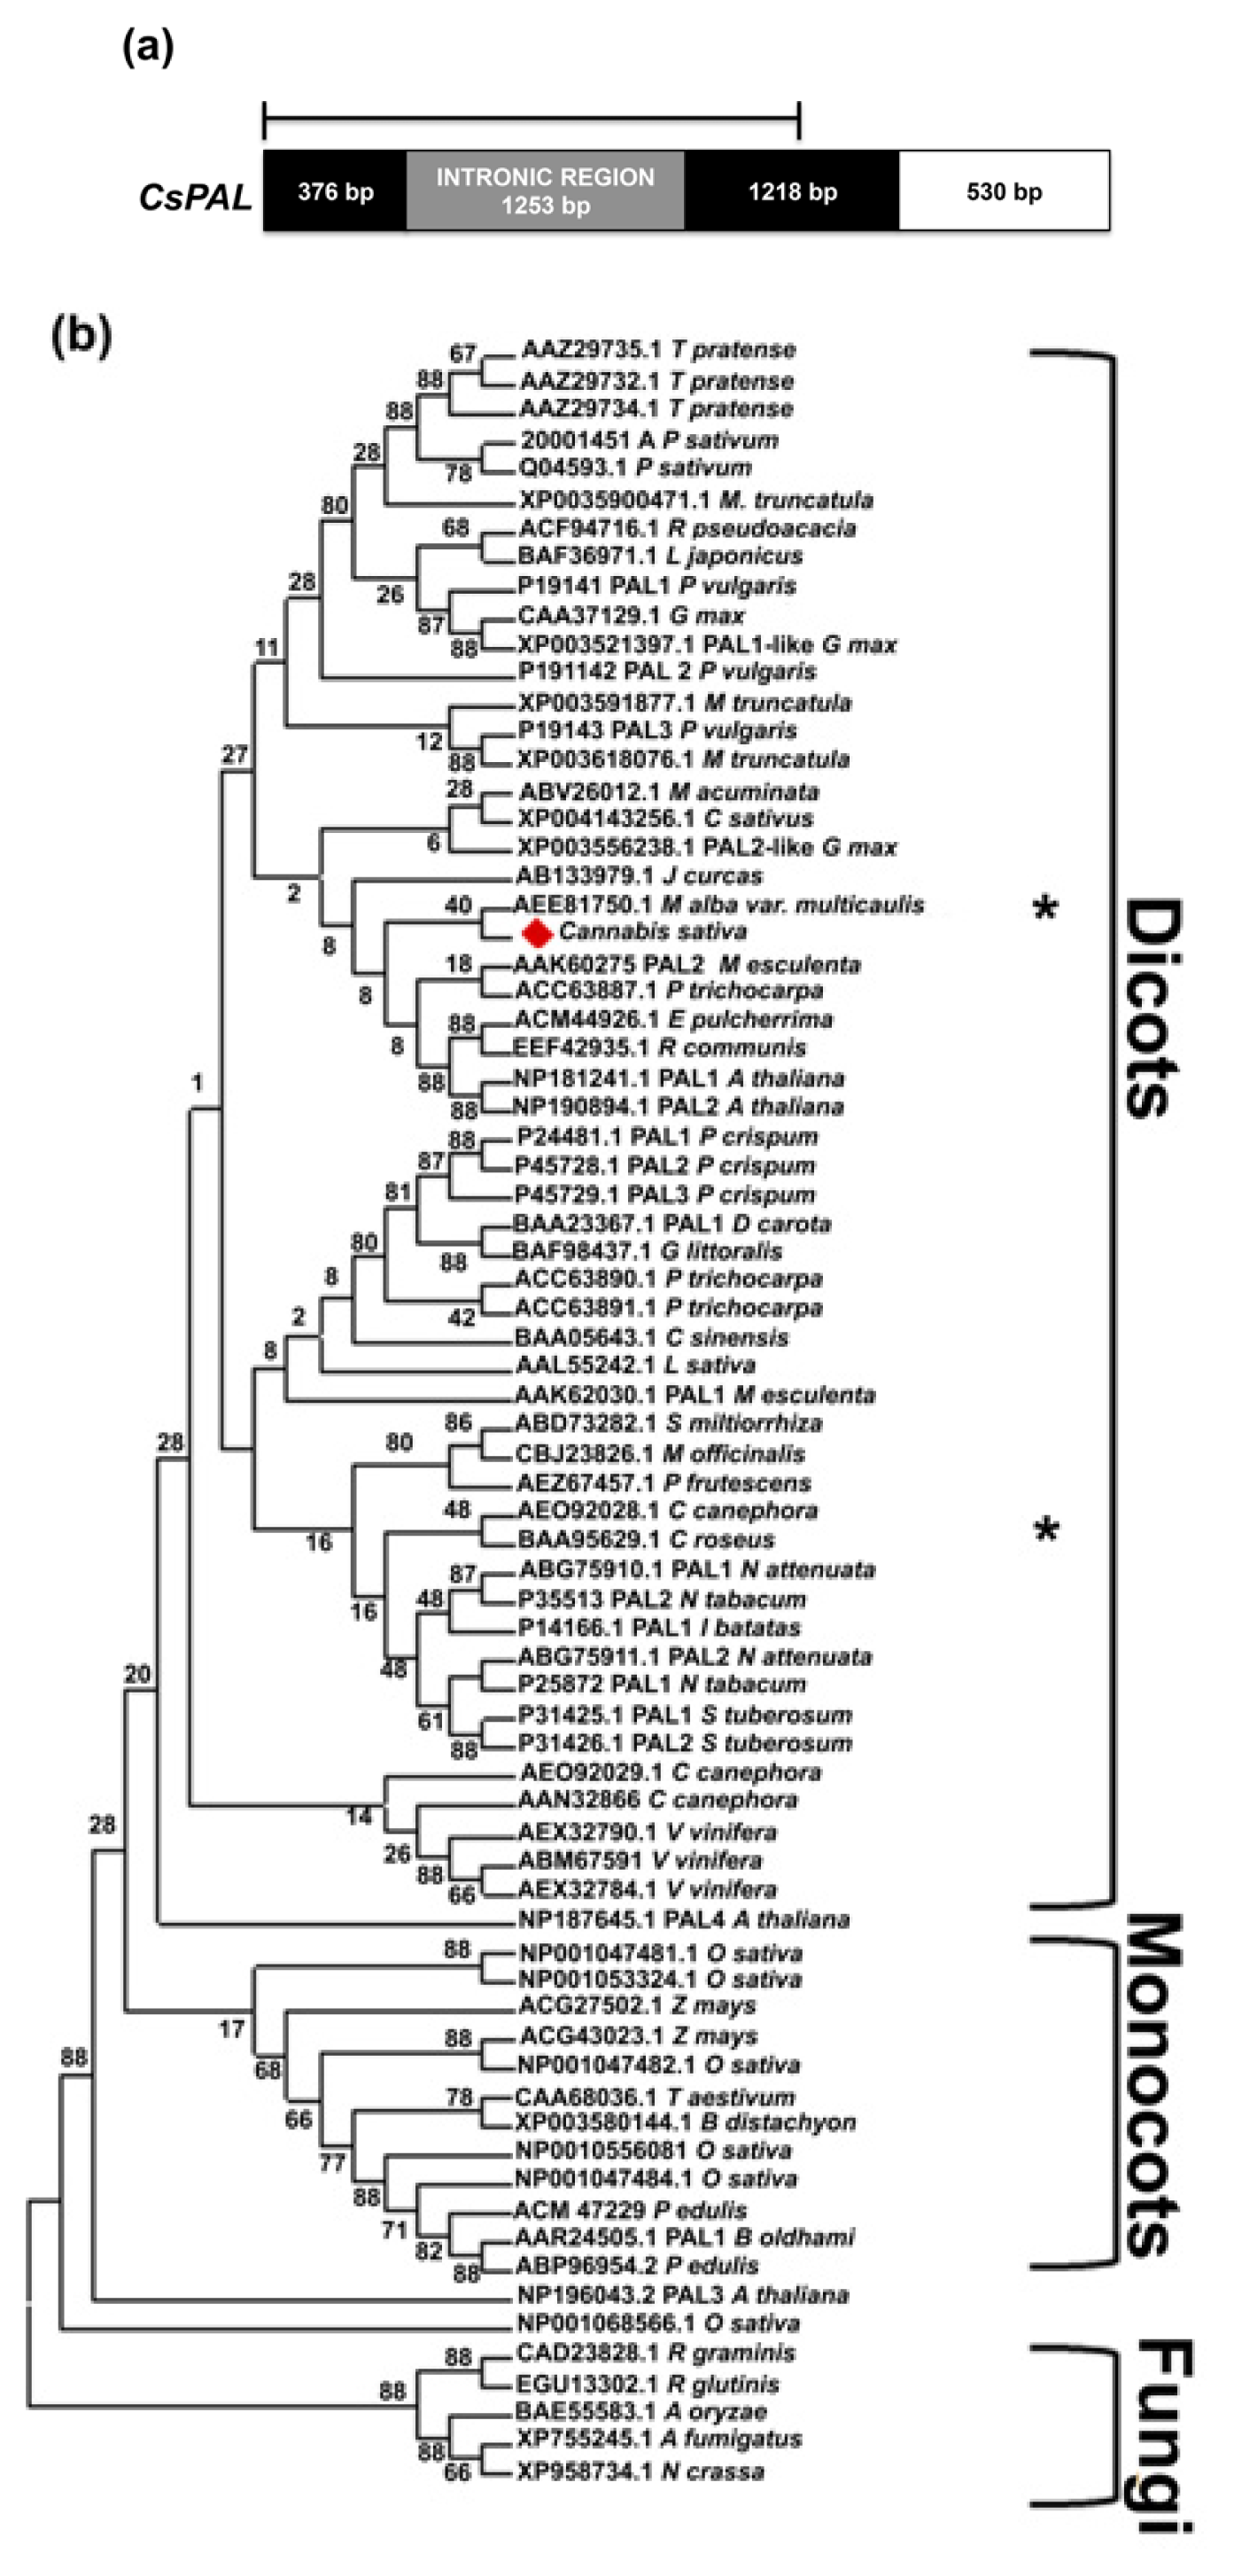
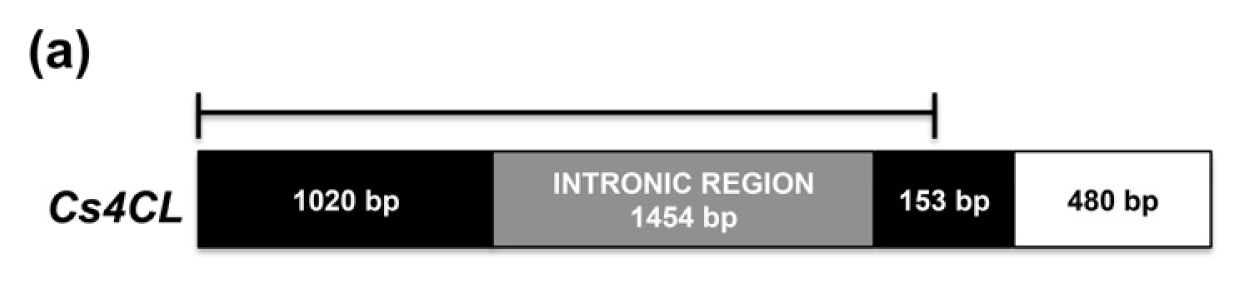
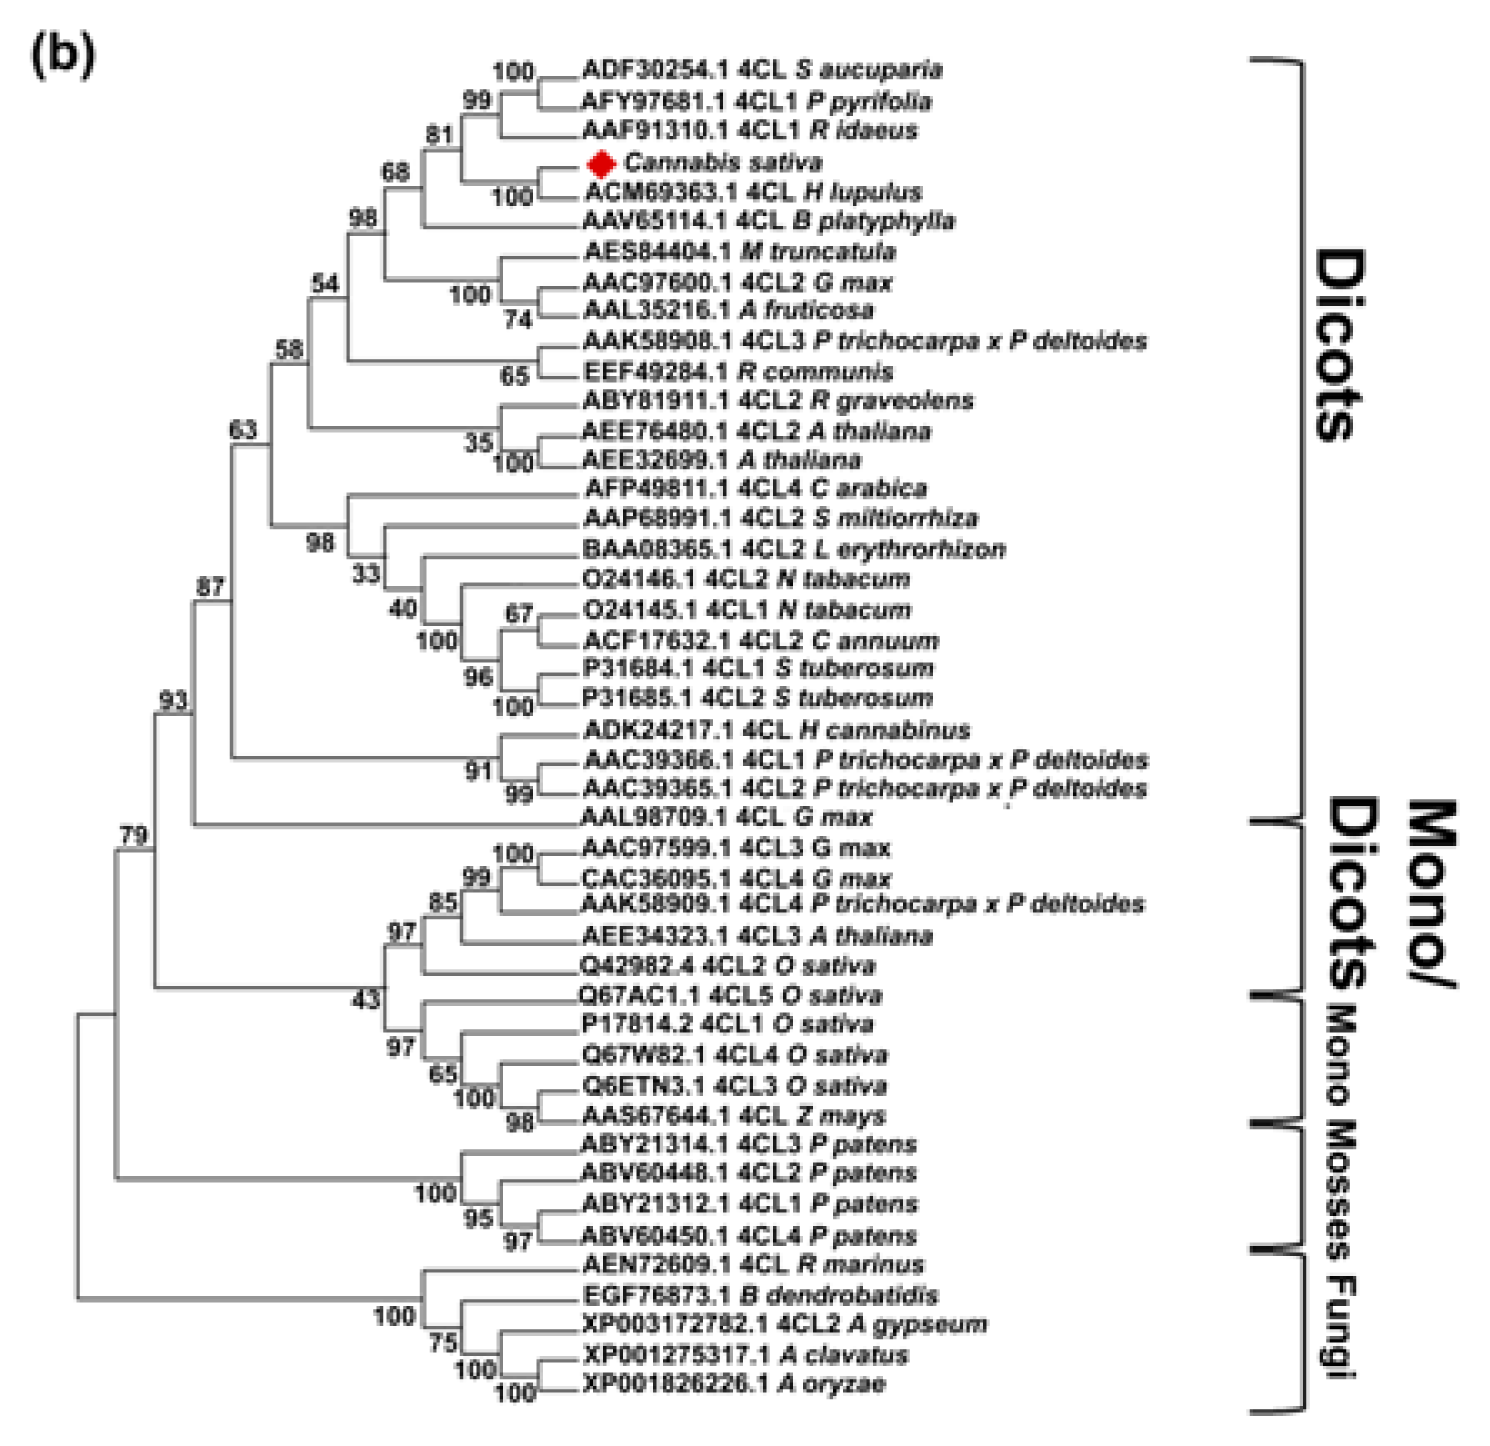
2.1. Isolation and Characterization of Cannabis Sativa Full-Length PAL and 4CL cDNAs
2.2. CsPal and Cs4CL Genomic Sequences
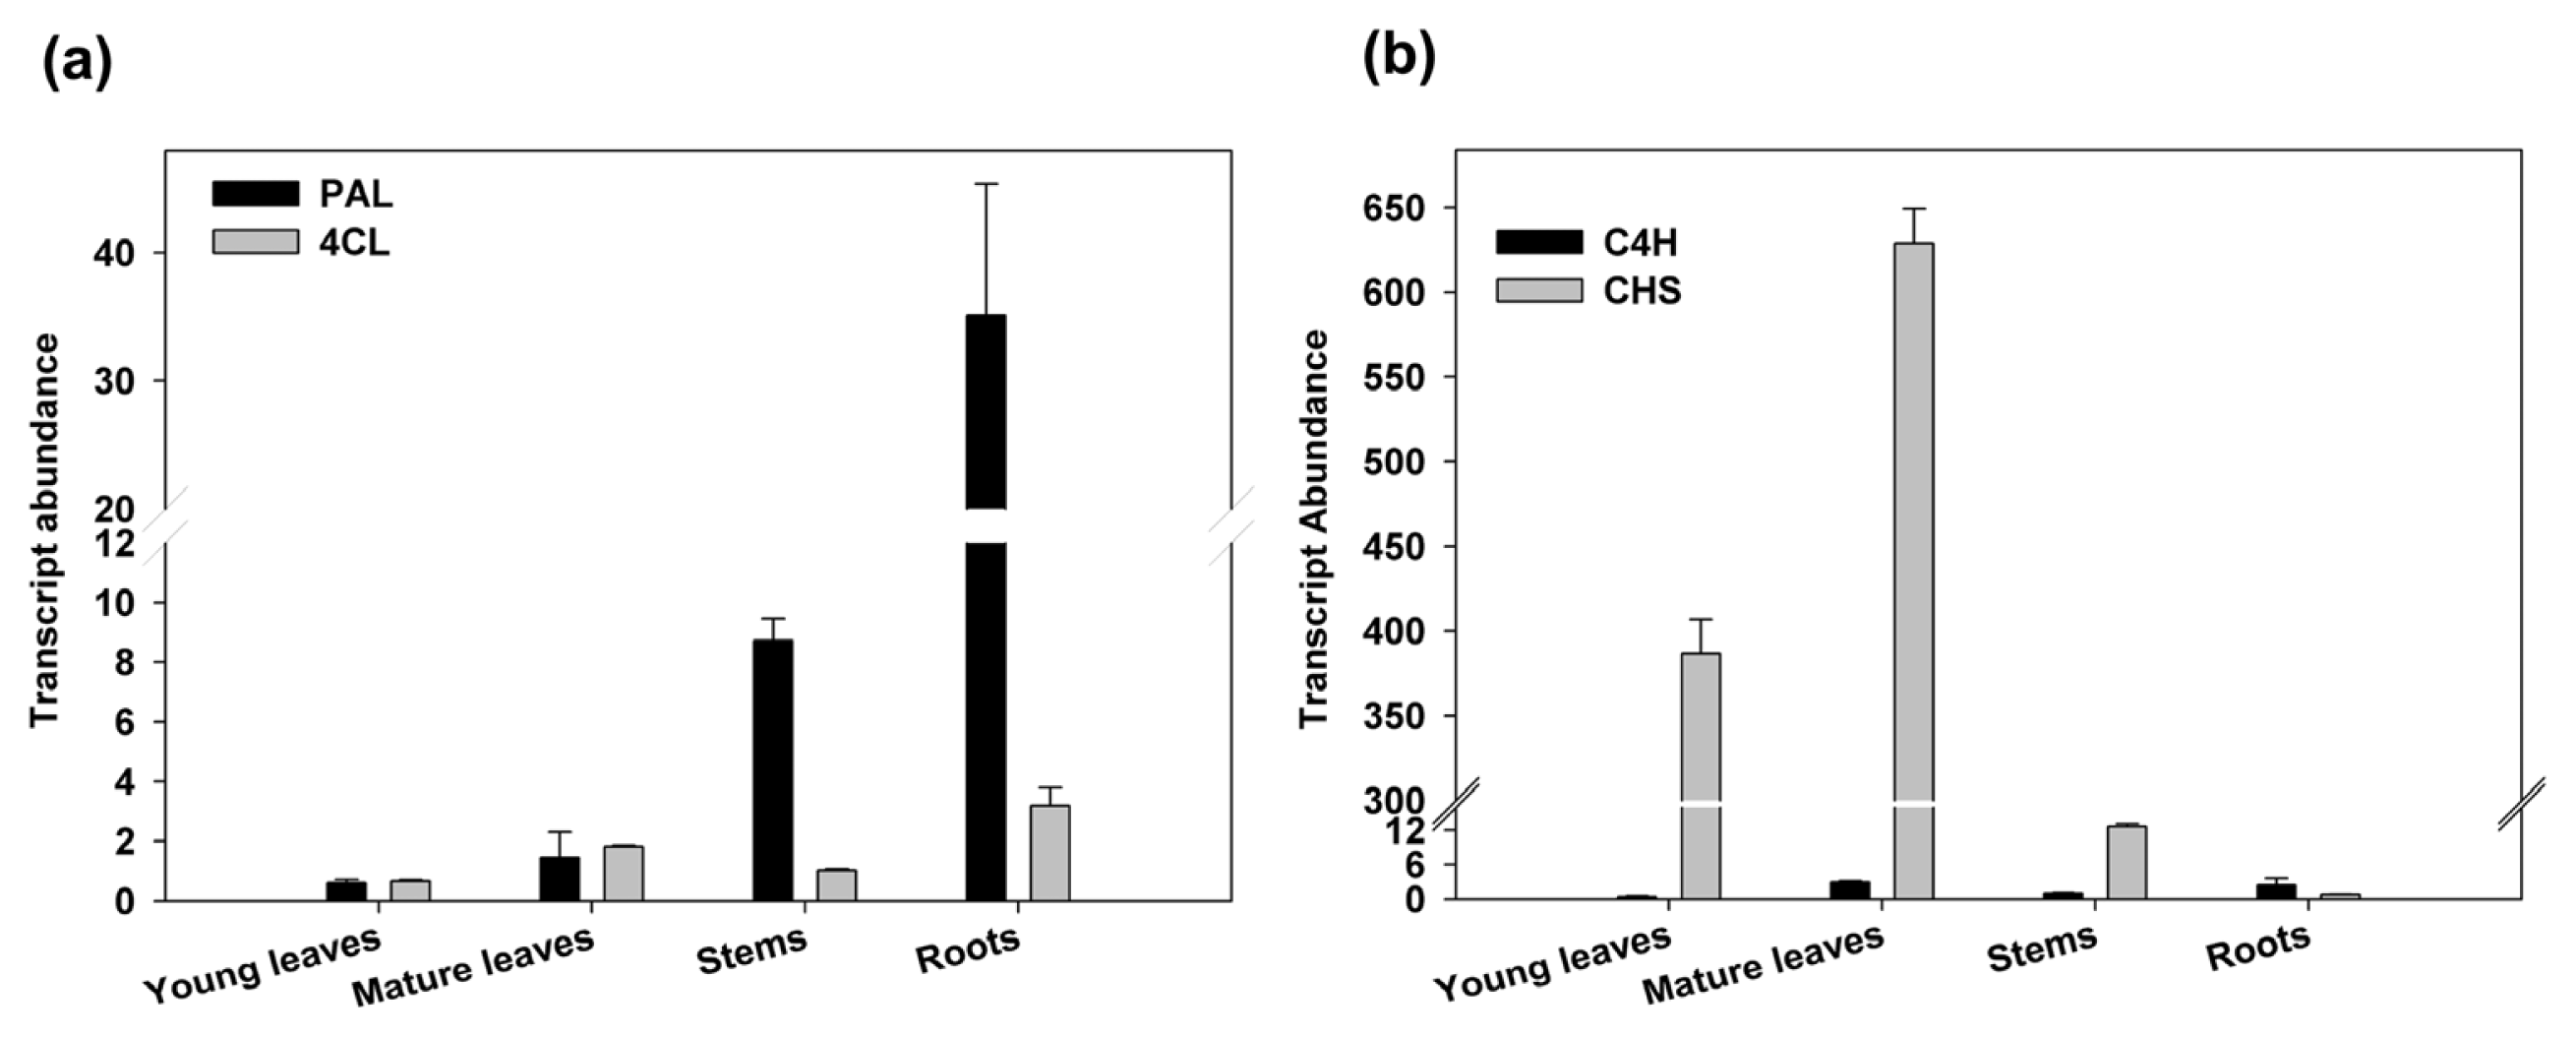
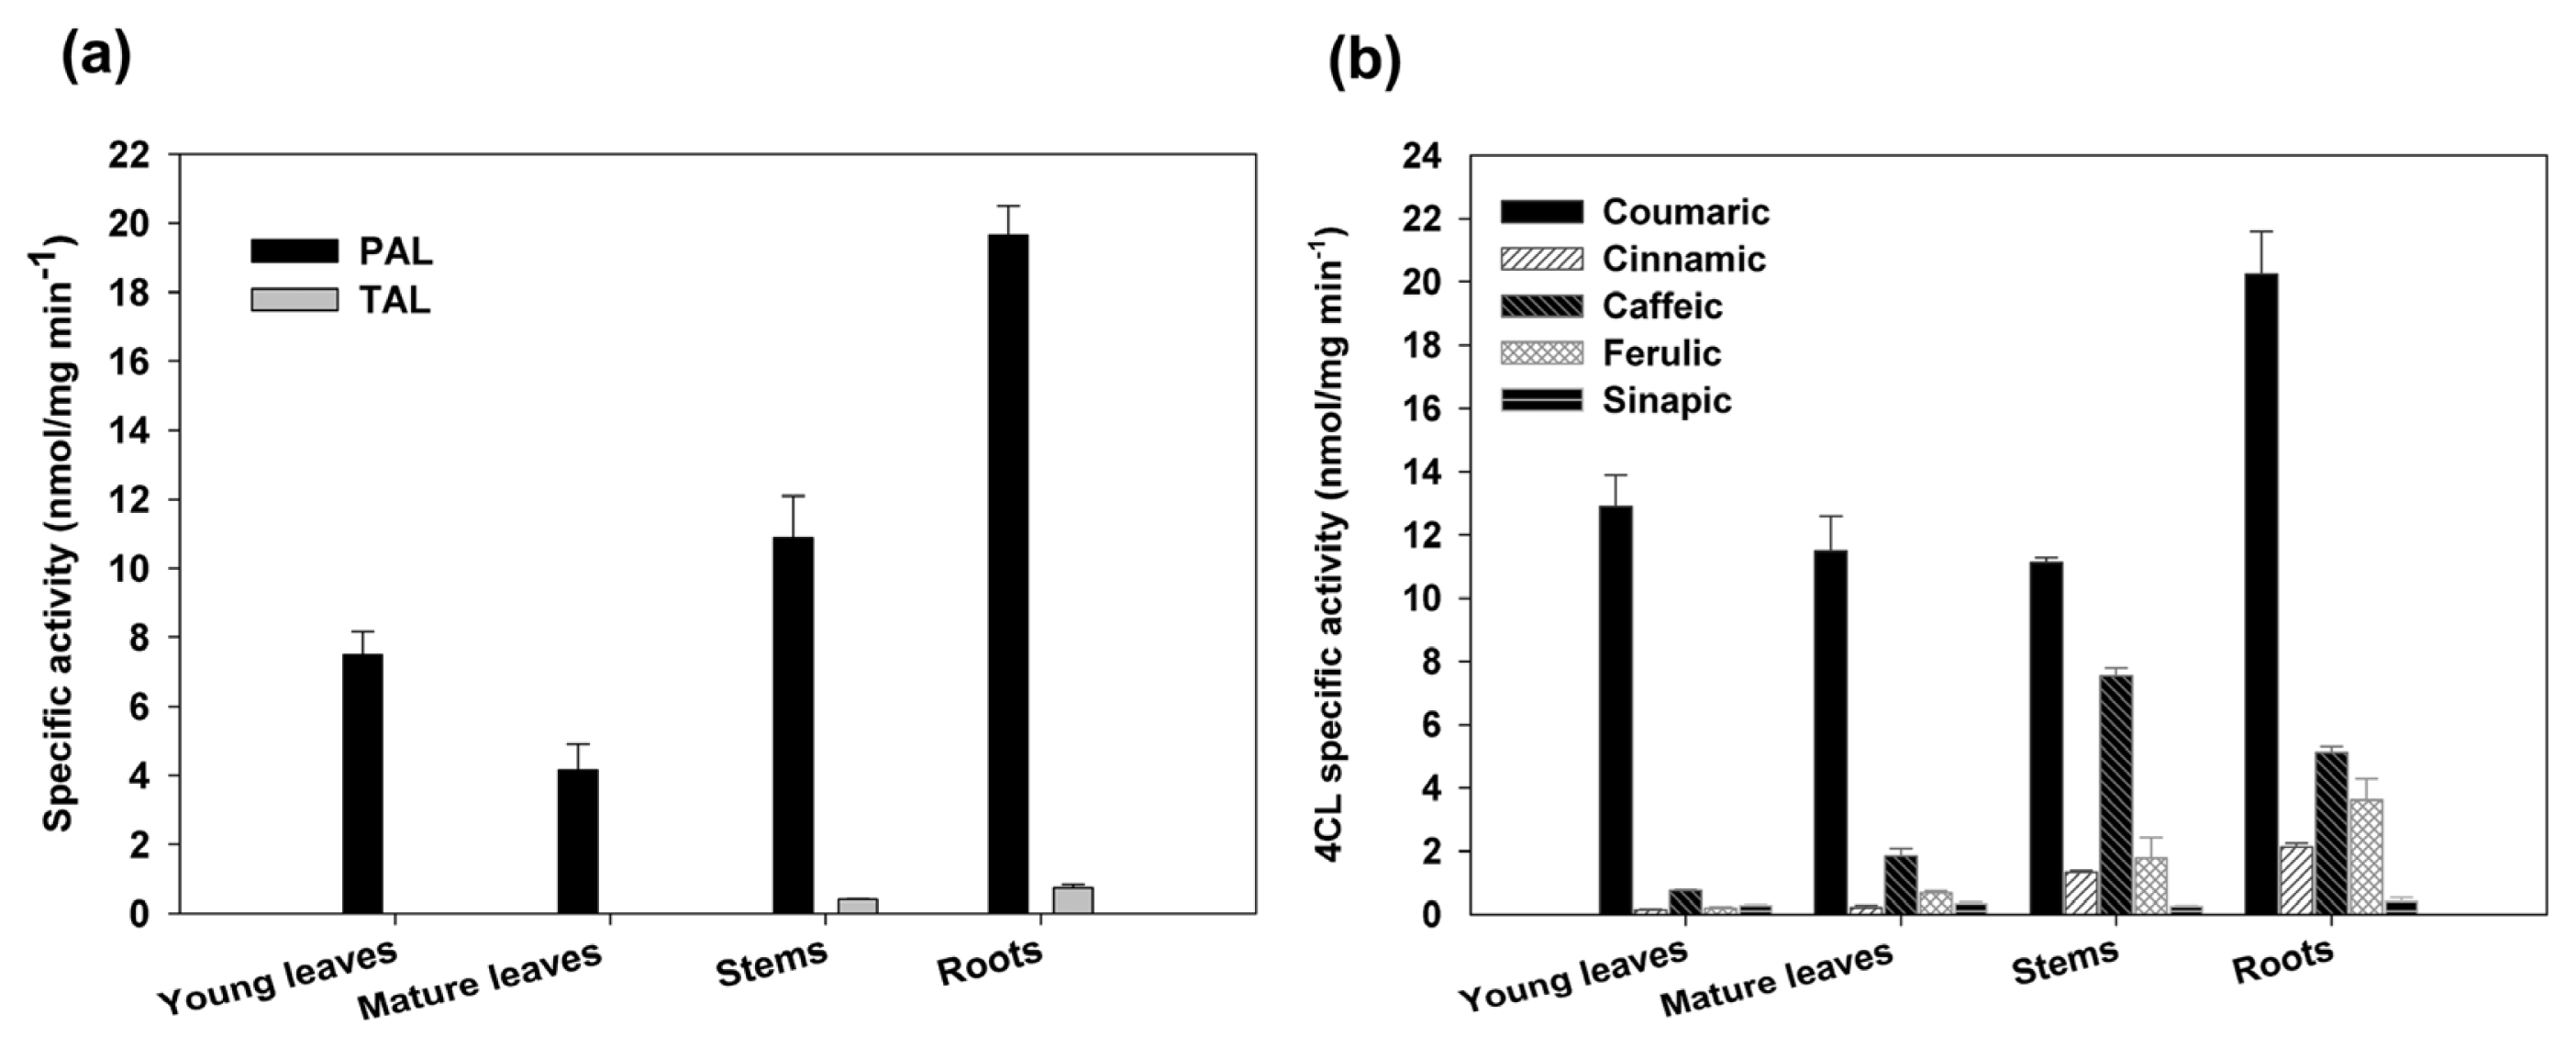
2.3. Expression Analysis and Enzymatic Activities
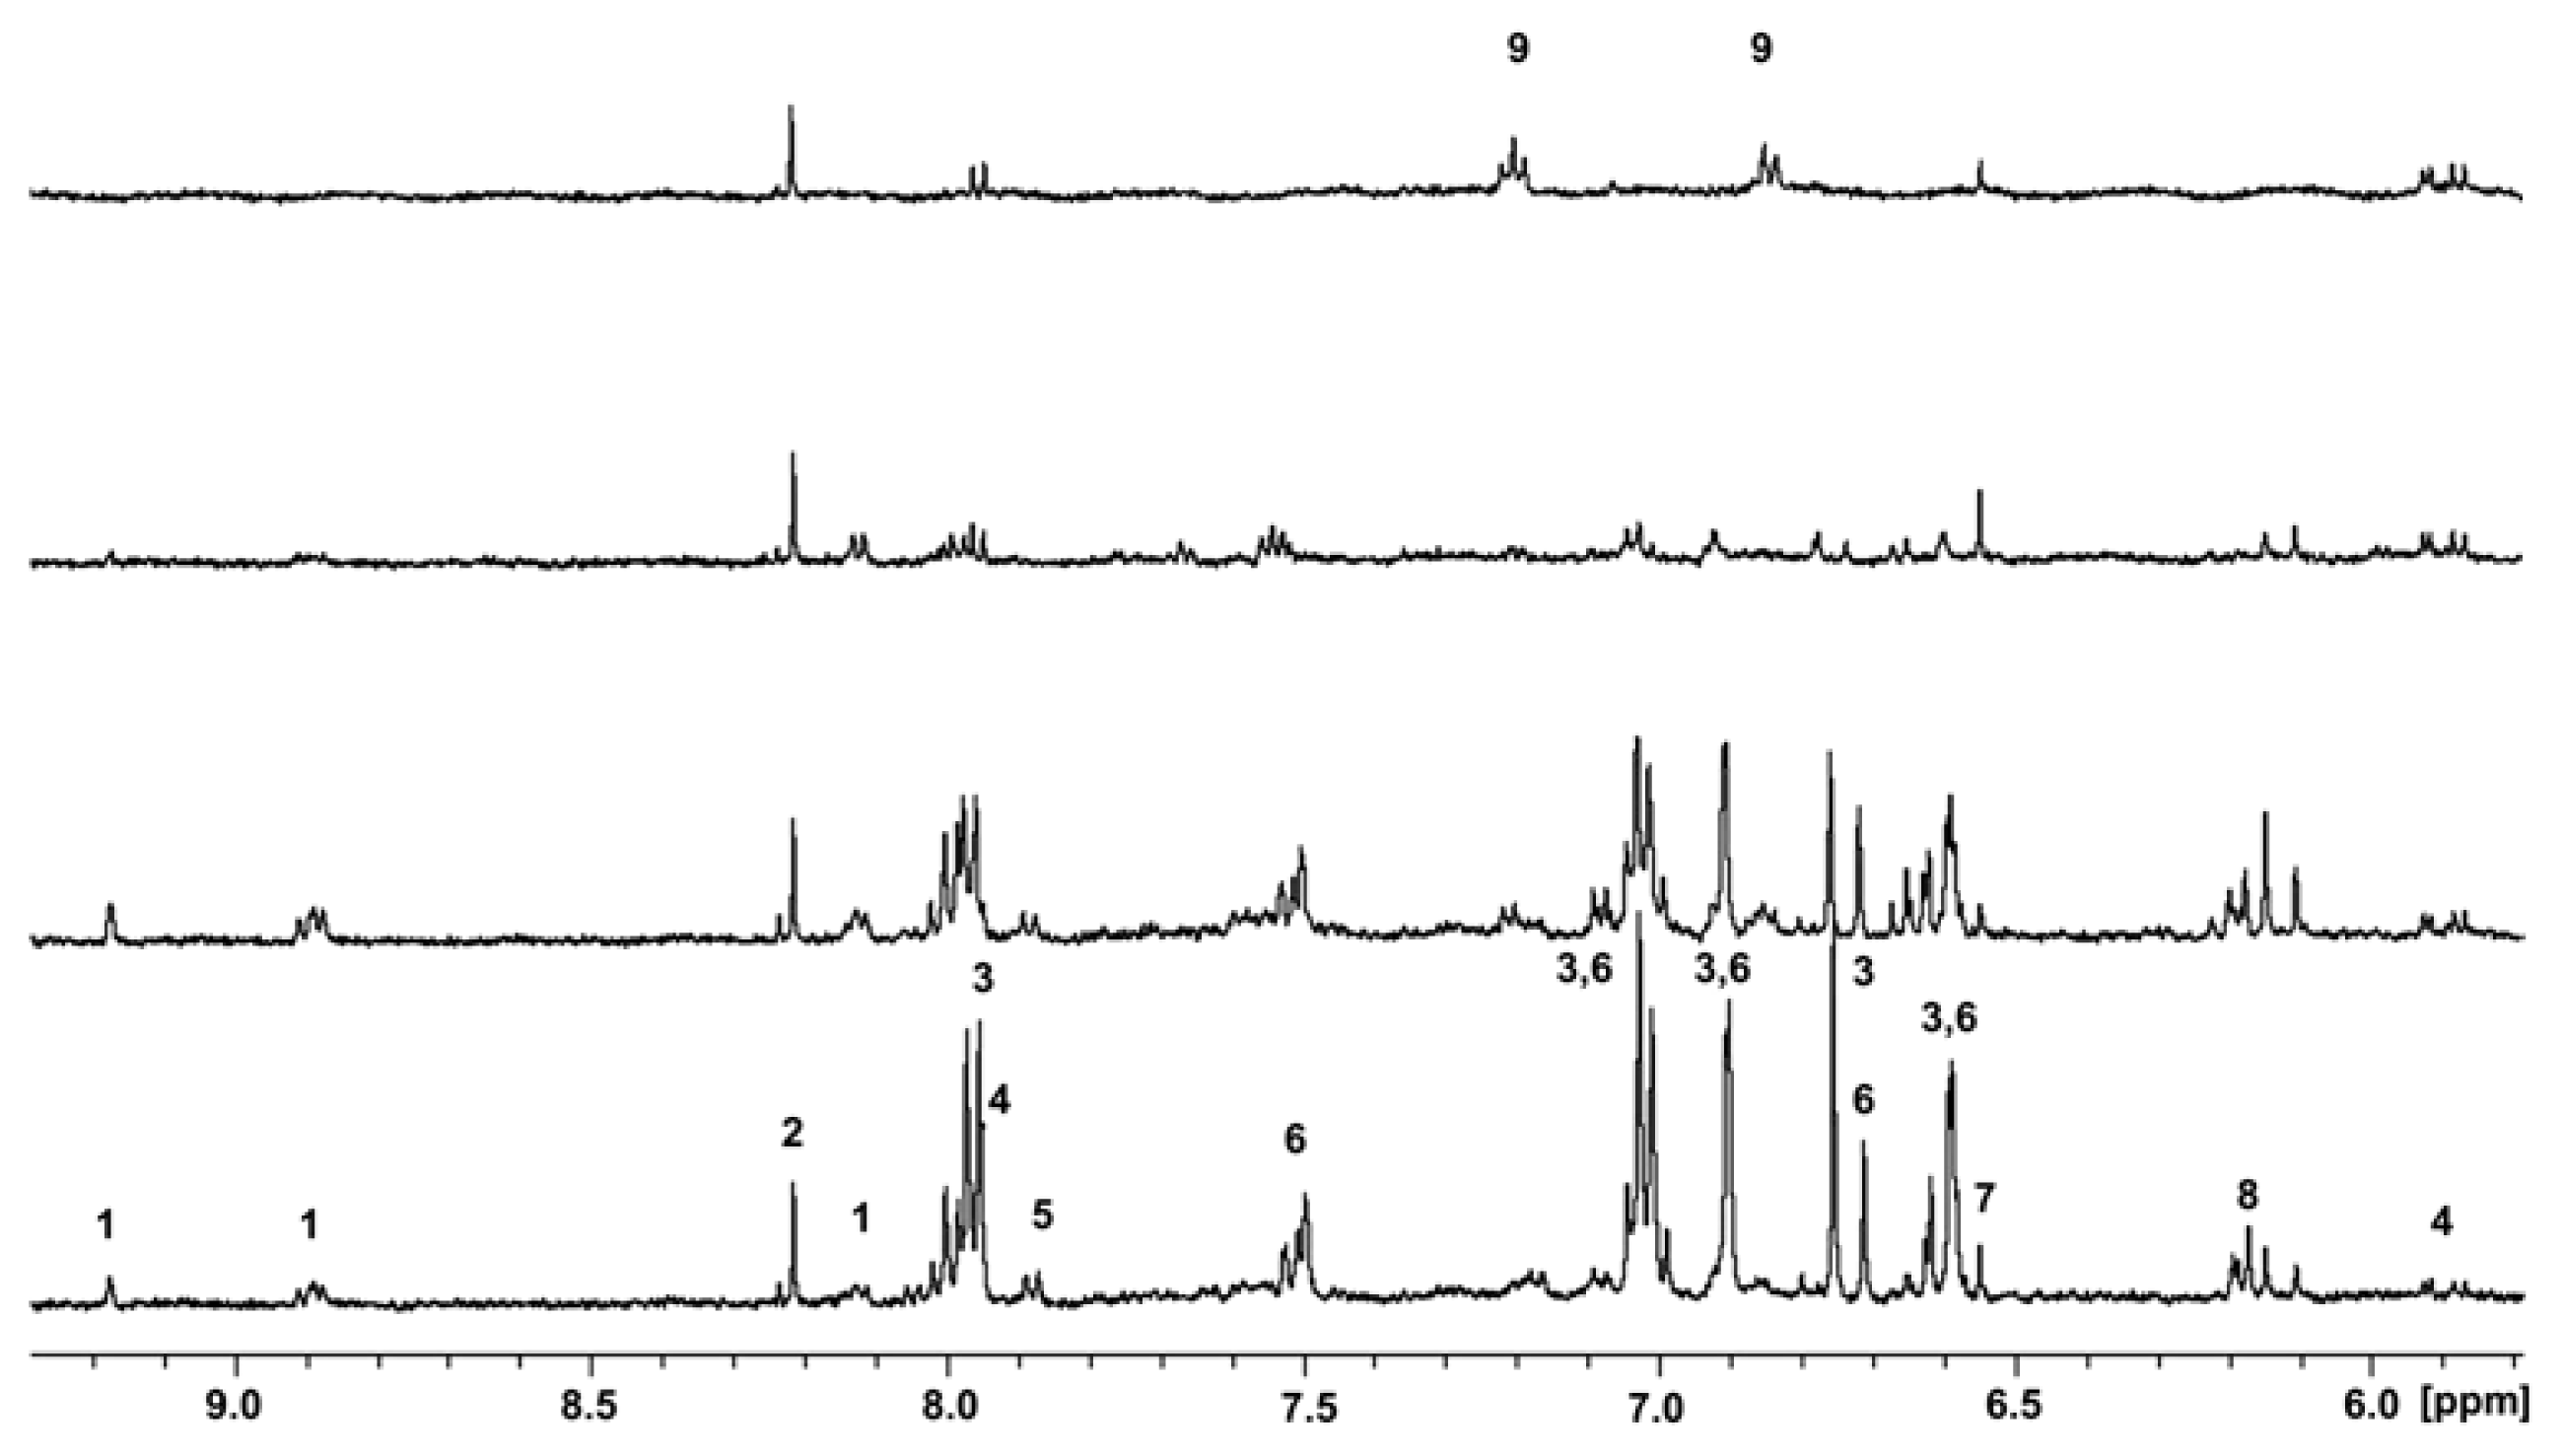
2.4. Aromatic Compounds
3. Experimental Section
3.1. Plant Materials, Vector and Strain
3.2. Extraction of Plant Material and NMR Measurements
3.3. Molecular Cloning of PAL and 4CL cDNAs
3.4. Sequence and Phylogenetic Analysis
3.5. Southern Blot and Genomic Sequences
3.6. qRT-PCR of PAL, 4CL, CH4 and CHS
3.7. Protein Extraction and Enzymatic Assays
3.8. Determination of Total Lignin Content
4. Conclusions
Supplementary Information
ijms-14-13626-s001.pdfAcknowledgments
Conflict of Interest
References
- Flores-Sanchez, I.J.; Verpoorte, R. Secondary metabolism in cannabis. Phytochem. Rev 2008, 7, 615–639. [Google Scholar]
- Li, X.; Wang, S.; Du, G.; Wu, Z.; Meng, Y. Variation in physical and mechanical properties of hemp stalk fibers along height of stem. Ind. Crops Prod 2013, 42, 344–348. [Google Scholar]
- Ware, M.A.; Tawfik, V.L. Safety issues concerning the medical use of cannabis and cannabinoids. Pain Res. Manag 2005, 10, 31A–37A. [Google Scholar]
- Jiang, H.E.; Li, X.; Zhao, Y.X.; Ferguson, D.K.; Hueber, F.; Bera, S.; Wang, Y.F.; Zhao, L.C.; Liu, C.J.; Li, C.S. A new insight into Cannabis sativa (Cannabaceae) utilization from 2500-year-old Yanghai Tombs, Xinjiang, China. J. Ethnopharmacol 2006, 108, 4014–4422. [Google Scholar]
- Kostic, M.; Pejic, B.; Skundric, P. Quality of chemically modified hemp fibres. Biorsource Technol 2008, 99, 94–99. [Google Scholar]
- Marks, M.D.; Tian, L.; Wenger, J.P.; Omburo, S.N.; Soto-Fuentes, W.; He, J.; Gang, D.R.; Weiblen, G.D.; Dixon, R.A. Identification of candidate genes affecting Δ9-tetrahydrocannabinol biosynthesis in Cannabis sativa. J. Exp. Bot 2009, 60, 3715–3726. [Google Scholar]
- Stout, J.M.; Boubakir, Z.; Ambrose, S.J.; Purves, R.W.; Page, J.E. The hexanoyl-CoA precursor for cannabinoid biosynthesis is formed by an acyl-activating enzyme in Cannabis sativa trichomes. Plant J 2012, 71, 353–365. [Google Scholar]
- Treutter, D. Significance of flavonoids in plant reistance: A review. Env. Chem. Lett 2006, 4, 147–157. [Google Scholar]
- Vogt, T. Phenylpropanoid biosynthesis. Mol. Plant 2010, 3, 2–20. [Google Scholar]
- Hahlbrock, K.; Scheel, D. Physiology and molecular biology of phenylpropanoid metabolism. Annu. Rev. Plant Physiol. Plant Mol. Biol 1989, 40, 347–369. [Google Scholar]
- Koukol, J.; Conn, E.E. The metabolism of aromatic compounds in higher plants. IV. Purification and properties of the phenylalanine deaminase of Hordeum vulgare. J. Biol. Chem 1961, 236, 2692–2698. [Google Scholar]
- Czichi, U.; Kindi, H. A model of closely assembled consecutive enzymes on membranes: Formation of hydroxycinnamic acids from l-phenylalanine on thylakoids of Dunaliella marina. Hoppe Seylers. Z Physiol. Chem 1975, 356, 475–485. [Google Scholar]
- Camm, E.L.; Towers, G.H.N. Phenylalanine ammonia lyase. Phytochemistry 1973, 12, 961–973. [Google Scholar]
- Young, M.R.; Towers, G.H.; Neish, A.C. Taxonomic distribution of ammonia lyases for l-phenylalanine and l-tyrosine in relation to lignification. Can. J. Bot 1966, 44, 341–349. [Google Scholar]
- Bandoni, R.J.; Moore, K.; Subba Rao, P.V.; Towers, G.H. Phenylalanine and tyrosine ammonia lyase activity in some Basidiomycetes. Phytochemistry 1968, 7, 205–207. [Google Scholar]
- Hodgens, D.S. Yeast phenylalanine ammonia lyase: Purification, properties, and the identification of catalytically essential dehydroalanine. J. Biol. Chem 1971, 246, 2977–2985. [Google Scholar]
- Emes, A.V.; Vining, L.C. Partial purification and properties of l-phenylalanine ammonia lyase from Streptomyces verticillatus. Can. J. Biochem 1970, 48, 613–622. [Google Scholar]
- Chang, A.; Lim, M.H.; Lee, S.W.; Robb, E.J.; Nazar, R.N. Tomato phenylalanine ammonia lyase gene family, highly redundant but strongly underutilized. J. Biol.Chem 2008, 283, 33591–33601. [Google Scholar]
- Joos, H.-J.; Halhbrock, K. Phenylalanine ammonia lyase in potato (Solanum tuberosum L.). Eur. J. Biochem 1992, 204, 621–629. [Google Scholar]
- Shang, Q.-M.; Li, L.; Dong, C.-J. Multiple tandem duplication of the phenylalanine ammonia lyase genes in Cucumis. sativus L. Planta 2012, 236, 1093–1105. [Google Scholar]
- Olsen, K.M.; Lea, U.S.; Slimestad, R.; Verheul, M.; Lillo, C. Differential expression of four Arabidopsis PAL genes; PAL1 and PAL2 have functional specialization in abiotic environmental-triggered flavonoid synthesis. J. Plant Physiol 2008, 165, 1491–1499. [Google Scholar]
- Lepelley, M.; Mahesh, V.; McCarthy, J.; Rigoreau, M.; Crouzillat, D.; Chabrillange, N.; de Kochko, A.; Campa, C. Characterization, high-resolution mapping and differential expression of three homologous PAL genes in Coffea canephora Pierre (Rubiaceae). Planta 2012, 236, 313–326. [Google Scholar]
- Cramer, C.L.; Edwards, K.; Dron, M.; Liang, X.; Dildine, S.L.; Bolwell, G.P.; Dixon, R.A.; Lamb, C.Y.; Schuch, W. Phenylalanine ammonia lyase gene organization and structure. Plant Mol. Biol 1989, 12, 367–383. [Google Scholar]
- Bell-Lelong, D.A.; Cusumano, J.C.; Meyer, K.; Chapple, C. Cinnamate-4-hydroxylase expression in Arabidopsis—Rregulation in response to development and the environment. Plant Physiol 1997, 13, 729–738. [Google Scholar]
- Mizutani, M.; Ward, E.; Dimao, J.; Otha, D.; Ryals, J.; Sato, R. Molecular cloning and sequencing of a cDNA encoding mung bean cytochrome-P450 (P450 C4H) possessing cinnamate-4-hydroxylase activity. Biochem. Biophys. Res. Comm 1993, 190, 875–880. [Google Scholar]
- Mizutani, M.; Otha, D.; Sato, R. Isolation of a cDNA and genomic clone encoding cinnamate-4-hydroxylase from Arabidopsis and its expression manner in planta. Plant Physiol 1997, 113, 755–763. [Google Scholar]
- Kawai, S.; Mori, A.; Shiokawa, T.; Kajita, S.; Katayama, Y.; Morohoshi, N. Isolation and analysis of cinnamic acid 4-hydroxylase homologous genes from a hybrid aspen, Populus kitatamiensis. Biosci. Biotechnol. Biochem 1996, 60, 1586–1597. [Google Scholar]
- Yang, D.H.; Chung, B.Y.; Kim, J.S.; Kim, J.H.; Yun, P.Y.; Lee, Y.K.; Lim, Y.P.; Lee, M.C. cDNA cloning and sequence analysis of the rice cinnamate-4-hydroxylase gene, a cytochrome P450-dependent monooxygenase involved in the general phenylpropanoid pathway. J. Plant Biol 2005, 48, 311–318. [Google Scholar]
- Betz, C.; McCollum, T.G.; Mayer, R.T. Differential expression of two cinnamate 4-hydroxylases in “Valencia” orange (Citrus sinensis Osbeck). Plant Mol. Biol 2001, 46, 741–748. [Google Scholar]
- Ehlting, J.; Hamberger, B.; Million-Rousseau, R.; Werck-Reichhart, D. Cytochrome P450 in phenolic metabolism. Phytochem. Rev 2006, 5, 239–270. [Google Scholar]
- Chapple, C. Molecular genetic analysis of plant cytochrome P450-dependent monookygenases. Annu. Rev. Plant Physiol. Plant mol. Biol 1998, 46, 311–343. [Google Scholar]
- Soltani, B.M.; Ehlting, J.; Hamberger, B.; Dougla, C.J. Multiple cis-regulatory elements regulate distinct and complex patterns of developmental and wound-induced expression of Arabidopsis thaliana 4CL gene family members. Planta 2006, 224, 1226–1238. [Google Scholar]
- Silber, M.V.; Meimberg, H.; Ebel, J. Identification of a 4-coumarate:CoA ligase gene family in the moss, Physcomitrella patens. Phytochemistry 2008, 69, 2449–2456. [Google Scholar]
- Sun, H.; Li, Y.; Feng, S.; Zou, W.; Guo, K.; Fan, C.; Si, S.; Peng, L. Analysis of five rice 4-coumarate:coenzyme A ligase enzyme activity and stress response for potential roles in lignin and flavonoid biosynthesis in rice. Biochem. Biophys. Res. Commun 2013, 430, 1151–1156. [Google Scholar]
- Lindermayr, C.; Möllers, B.; Fliegmann, J.; Uhlmann, A.; Lottspeich, F.; Meimberg, H.; Ebel, J. Divergent members of a soybean (Glycine. max L.) 4-coumarate:coenzyme A ligase gene family. Eur. J. Biochem 2002, 269, 1304–1315. [Google Scholar]
- Abe, I.; Morita, H. Structure and function of the chalcone synthase superfamily of plant type III polyketide synthases. Nat. Prod. Rep 2010, 27, 809–838. [Google Scholar]
- Dao, T.T.H.; Linthorst, H.J.M.; Verpoorte, R. Chalcone synthase and its functions in plant resistance. Phytochem. Rev 2011, 10, 397–412. [Google Scholar]
- Flores-Sanchez, I.J.; Verpoorte, R. PKS activities and biosynthesis of cannabinoids and flavonoids in Cannabis sativa L. plants. Plant Cell Physiol 2008, 49, 1767–1782. [Google Scholar]
- Koes, R.E.; Quattrocchio, F.; Mol, J.N.M. The flavonoid biosynthetic pathway in plants: Function and evolution. BioEssays 1994, 16, 123–132. [Google Scholar]
- Van den Broeck, H.C.; Maliepaard, C.; Ebskamp, M.J.M.; Toonen, M.A.J.; Koops, A.J. Differential expression of genes involved in C1 metabolism and lignin biosynthesis in wooden core and bast tissues of fibre hemp (Cannabis sativa L.). Plant Sci 2008, 174, 205–220. [Google Scholar]
- Altschul, S.F.; Lipman, D.J. Protein database searches for multiple alignments. Proc. Natl. Acad. Sci. USA 1990, 87, 5509–5513. [Google Scholar]
- SIB Swiss institute of Bioinformatic Home page. Available online: http://www.expasy.ch/tools/scanprosite (on accessed 12 February 2013).
- Rétey, J. Discovery and role of methylidene imidazolone, a highly electrophylic prosthetic group. Biochem. Biophys. Acta 2003, 424, 233–242. [Google Scholar]
- MacDonald, M.J.; D’Cunha, G.B. A modern view of phenylalanine ammonia-lyase. Biochem. Cell Biol 2007, 85, 273–282. [Google Scholar]
- Allwood, E.G.; Davies, D.R.; Gerrish, C.; Ellis, B.E.; Bolwell, G.P. Phosphorylation of phenylalanine ammonia-lyase: Evidence for a novel protein kinase and identification of the phosphorylated residue. FEBS Lett 1999, 457, 47–52. [Google Scholar]
- Rohde, A.; Morreel, K.; Ralph, J.; Goeminne, G.; Hostyn, V.; de Rycke, R.; Kushnir, S.; van Doorsselaere, J.; Joseleau, J.P.; Vuylsteke, M.; et al. Molecular phenotyping of the pal1 and pal2 mutants of Arabidopsis thaliana reveals far-reaching consequences on phenylpropanoid, amino Acid, and carbohydrate metabolism. Plant Cell 2004, 16, 2749–2771. [Google Scholar]
- Huang, J.L.; Gu, M.; Lai, Z.B.; Fan, B.F.; Shi, K.; Zhou, Y.H.; Yu, J.Q.; Chen, Z.X. Functional analysis of the arabidopsis PAL gene family in plant growth, development, and response to environmental stress. Plant Physiol 2010, 153, 1526–1538. [Google Scholar]
- Wong, J.H.; Namasivayam, P.; Abdullah, M.P. The PAL2 promoter activities in relation to structural development and adaptation in Arabidopsis thaliana. Planta 2012, 235, 267–277. [Google Scholar]
- Schneider, K.; Hövel, K.; Witzel, K.; Hamberger, B.; Schomburg, D.; Kombrink, E.; Stuible, H.-P. The substrate specificity-determining amino acid code of 4-coumarate:CoA ligase. Proc. Natl. Acad. Sci. USA 2003, 100, 8601–8606. [Google Scholar]
- Stuible, H.P.; Kombrink, E. Identification of the substrate specificity-conferring amino acid residues of 4-coumarate:coenzymeA ligase allows the rational design of mutant enzymes with new catalytic properties. J. Biol. Chem 2001, 276, 26893–26897. [Google Scholar]
- Bannai, H.; Tamada, Y.; Maruyama, O.; Nakai, K.; Miyano, S. Extensive feature detection of N-terminal protein sorting signals. Bioinformatics 2002, 18, 298–305. [Google Scholar]
- Gui, J.; Shen, J.; Li, L. Functional characterization of evolutionarily divergent 4-coumarate:coenzyme A ligases in rice. Plant Physiol 2011, 157, 574–586. [Google Scholar]
- Wanner, L.A.; Li, G.; Ware, D.; Somssich, I.E.; Davis, K.R. The phenylalanine ammonia-lyase gene family in Arabidopsis thaliana. Plant Mol. Biol 1995, 27, 327–338. [Google Scholar]
- Lee, S.W.; Robb, J.; Nazar, R.N. Truncated phenylalanine ammonia-lyase expression in tomato (Lycopersicon esculentum). J. Biol. Chem 1992, 267, 11824–11830. [Google Scholar]
- Ehlting, J.; Buttner, D.; Wang, Q.; Douglas, C.J.; Somssich, I.E.; Kombrink, E. Three 4-coumarate: Coenzyme A ligases in Arabidopsis thaliana represent two evolutionarily divergent classes in angiosperms. Plant J 1999, 19, 9–20. [Google Scholar]
- Wei, X.X.; Wang, X.-Q. Evolution of 4-coumarate: Cenzyme A ligase (4CL) gene and divergence of Larix. (Pinaceae). Mol. Physiogen. Evol 2004, 31, 542–553. [Google Scholar]
- Parkhurst, J.R.; Hodgins, B.S. Phenylalanine and tyrosine ammonia-lyase activity in Sporobolomyces pararoseus. Phytochemistry 1971, 10, 2997–3000. [Google Scholar]
- Rösler, J.; Krekel, F.; Amrhein, N.; Schmid, J. Maize phenylalanine ammonia-lyase has tyrosine ammonia-lyase activity. Plant Physiol 1997, 113, 175–179. [Google Scholar]
- Hsieh, L.-S.; Ma, G.-J.; Yang, C.-C.; Lee, P.-D. Cloning, expression, site-directed mutagenesis and immunolocalization of phenylalanine ammonia-lyase in Bambusa oldhamii. Phytochemistry 2010, 71, 1999–2009. [Google Scholar]
- Scott, D.A.; Hammond, P.M.; Brearley, G.M.; Price, C.P. Identification by high-performance liquid chromatography of tyrosine ammonia-lyase activity in purified fractions of Phaseulus vulgaris phenylalanine ammonia-lyase. J. Chromatogr 1992, 573, 309–312. [Google Scholar]
- Hyun, M.W.; Yun, Y.H.; Kim, J.Y.; Kim, S.H. Fungal and plant phenylalanine ammonia-lyase. Mycobiology 2011, 39, 257–265. [Google Scholar]
- Endler, A.; Martens, S.; Wellmann, F.; Matern, U. Unusually divergent 4-coumarate:CoA-ligases from Ruta graveolens L. Plant Mol. Biol 2008, 67, 335–346. [Google Scholar]
- Kim, K.H.; Choi, Y.H.; Verpoorte, R. NMR-based metabolomic analysis of plants. Nat. Prot 2010, 5, 536–549. [Google Scholar]
- Topsin Bruker, version 1.3, software for NMR data acquisition and processing; Bruker BioSpin GmbH: Rheistetten, Germany, 2003.
- PrimmBiotech, Inc. Home page. Available online: http://www.primmbiotech.com (on accessed 25 January 2013).
- Blastx basic local alignment search tool Home page. Available online: http://blast.ncbi.nlm.nih.gov (on accessed 10 February 2013).
- CLUSTALW. Available online: http://align.genome.jp/ (on accessed 4 March 2013).
- Dixon, R.A.; Paiva, N.L. Stress-induced phenylpropanoid metabolism. Plant Cell 1995, 7, 1085–1097. [Google Scholar]
- Saitou, N.; Nei, M. The neighbor-joining method—A new method for reconstructing phylogenetic trees. Mol. Biol. Evol 1987, 4, 406–425. [Google Scholar]
- Hall, T.A. BioEdit: A user-friendly biological sequence alignment editor and analysis program for Windows 95/98/NT. Nucleic Acids Symp. Ser 1999, 41, 95–98. [Google Scholar]
- Primer3, version 0.4.0, software for primers design; Whitehead Institute for Biomedical Research: Cambridge, MA, USA, 2007.
- Primer 3 Home page. Available online: http://primer3.wi.mit.edu (on accessed 13 November 2012).
- Premier biosoft Home page. Available online: http://www.premierbiosoft.com/molecular_beacons/index.html (on accessed 20 February 2013).
- Tamura, K.; Peterson, D.; Peterson, N.; Stecher, G.; Nei, M.; Kumar, S. MEGA5: Molecular evolutionary genetics analysis using maximum likelihood, evolutionary distance, and maximum parsimony methods. Mol. Biol. Evol 2011, 28, 2731–2739. [Google Scholar]
- Pfaffl, M.W. A new mathematical model for relative quantification in real-time PCR. Nucl. Acids Res 2001, 29, 2002–2007. [Google Scholar]
- Weitzel, C.; Petersen, M. Enzyme of phenylpropanoid metabolism in the important medicinal plant Melissa officinalis L. Planta 2010, 232, 731–742. [Google Scholar]
- Bradford, M.M. A rapid and sensitive method for the quantitation of microgram quantities of protein utilizing the principle of protein dye binding. Anal. Biochem 1976, 72, 248–254. [Google Scholar]
- Saunders, J.A.; McClure, J.W. Phytochrome controlled phenylalanine ammonia lyase activity in Hordeum vulgare plastids. Phytochemistry 1975, 14, 1285–1289. [Google Scholar]
- Chen, J.-Y.; Wen, P.-F.; Kong, W.-F.; Pan, Q.-H.; Wan, S.-B.; Huang, W.-D. Changes and subcellular localizations of the enzymes involved in phenylpropanoid metabolism during grape berry development. J. Plant Physiol. 2006, 163, 115–127. [Google Scholar]
- Brinkmann, K.; Blaschke, L.; Polle, A. Comparison of different methods for lignin determination as a basis for calibration of near-infrared reflectance spectroscopy and implications of lignoproteins. J. Chem. Ecol 2002, 28, 2483–2501. [Google Scholar]

© 2013 by the authors; licensee MDPI, Basel, Switzerland This article is an open access article distributed under the terms and conditions of the Creative Commons Attribution license (http://creativecommons.org/licenses/by/3.0/).
Share and Cite
Docimo, T.; Consonni, R.; Coraggio, I.; Mattana, M. Early Phenylpropanoid Biosynthetic Steps in Cannabis sativa: Link between Genes and Metabolites. Int. J. Mol. Sci. 2013, 14, 13626-13644. https://doi.org/10.3390/ijms140713626
Docimo T, Consonni R, Coraggio I, Mattana M. Early Phenylpropanoid Biosynthetic Steps in Cannabis sativa: Link between Genes and Metabolites. International Journal of Molecular Sciences. 2013; 14(7):13626-13644. https://doi.org/10.3390/ijms140713626
Chicago/Turabian StyleDocimo, Teresa, Roberto Consonni, Immacolata Coraggio, and Monica Mattana. 2013. "Early Phenylpropanoid Biosynthetic Steps in Cannabis sativa: Link between Genes and Metabolites" International Journal of Molecular Sciences 14, no. 7: 13626-13644. https://doi.org/10.3390/ijms140713626