Assessment of Blood Flow in Hepatocellular Carcinoma: Correlations of Computed Tomography Perfusion Imaging and Circulating Angiogenic Factors

Abstract
:1. Introduction
2. Results
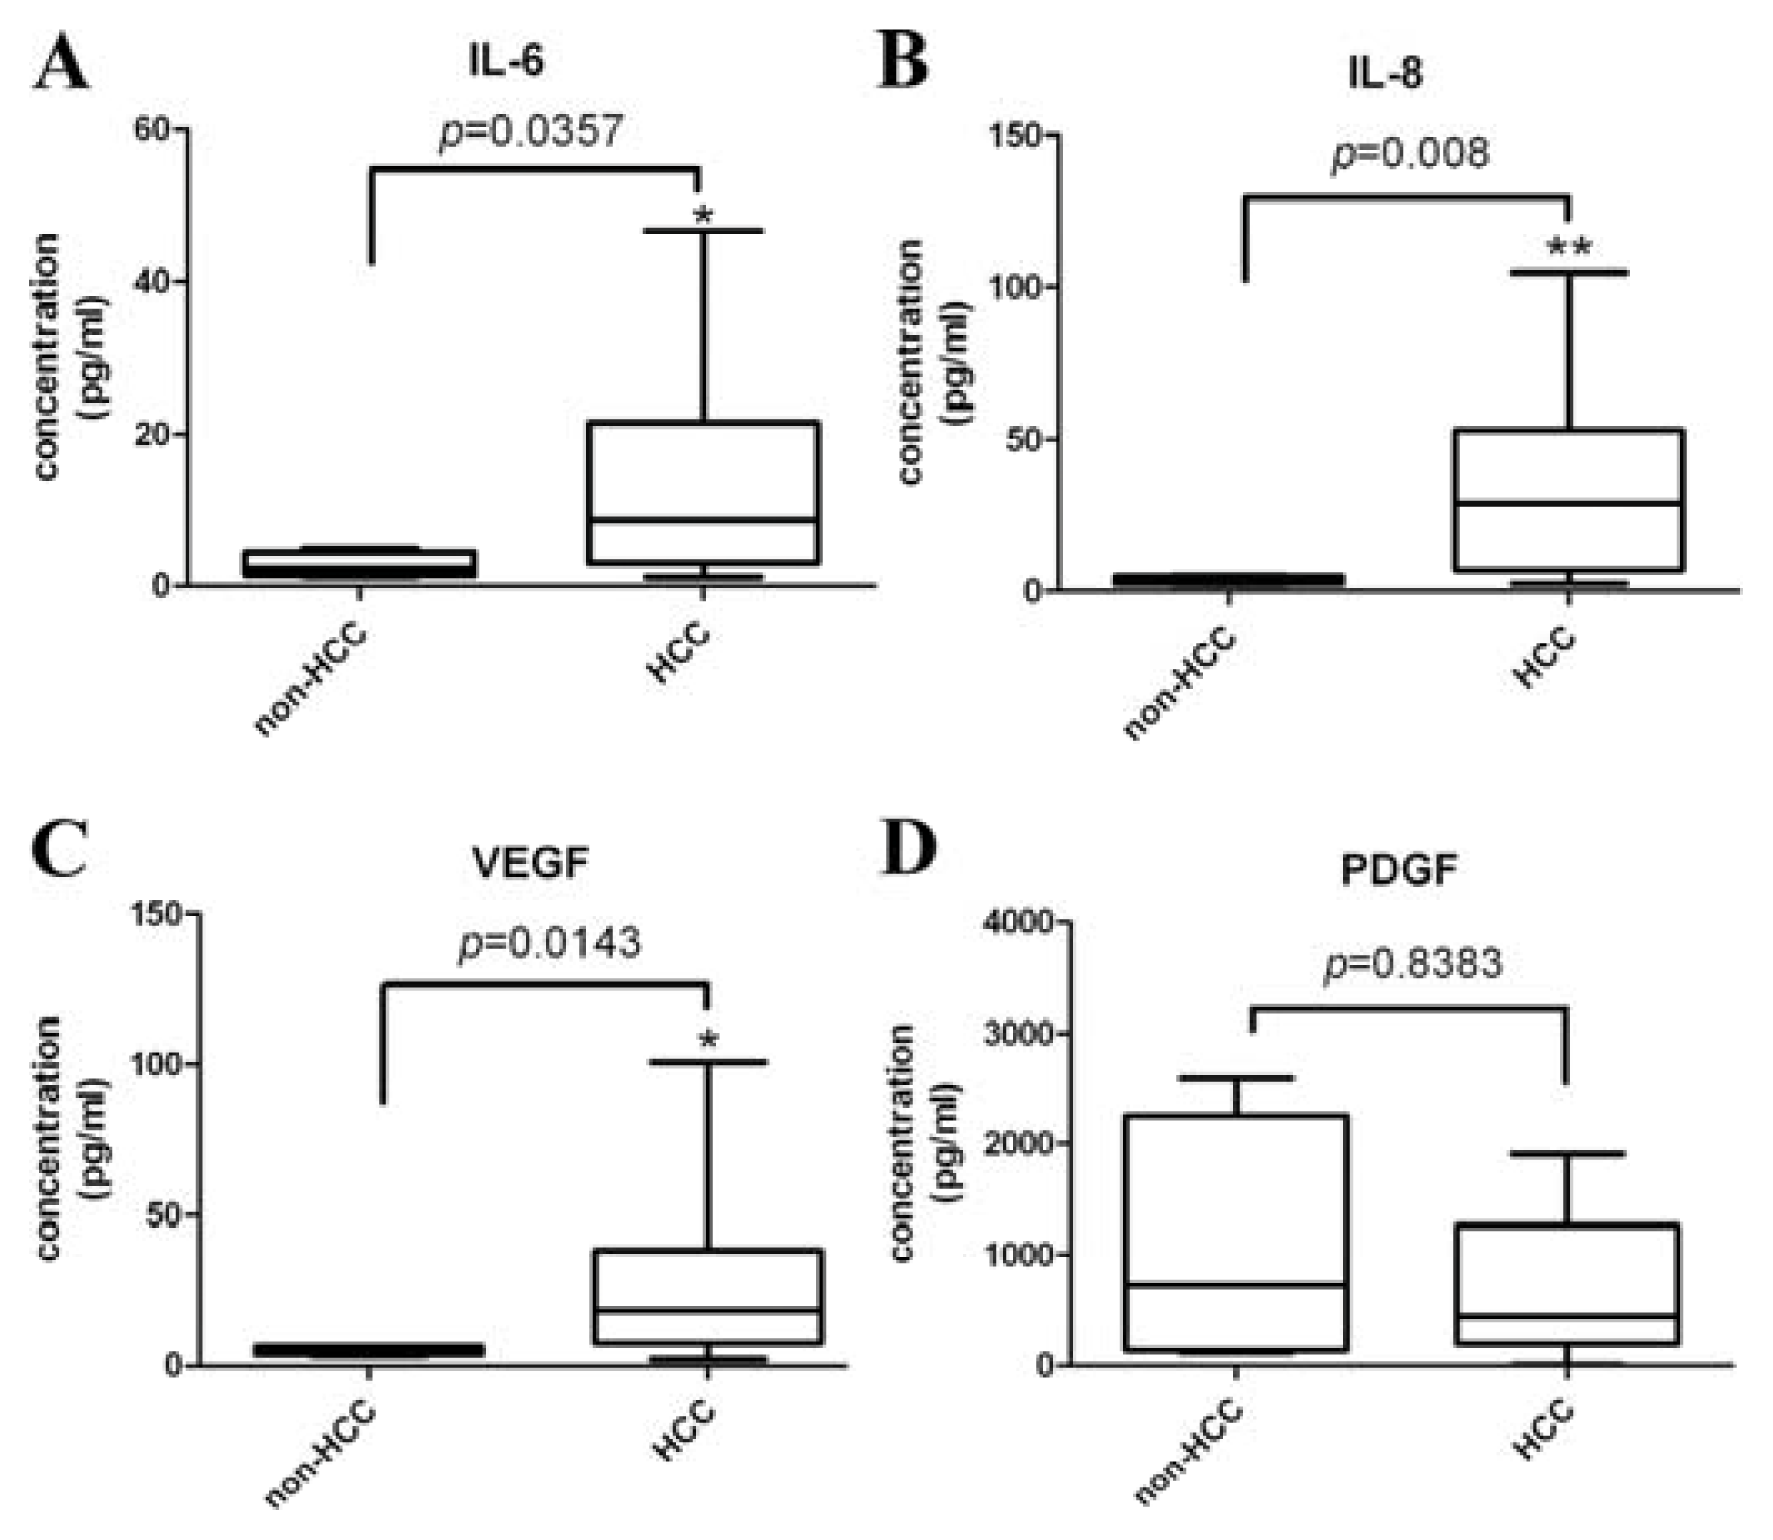
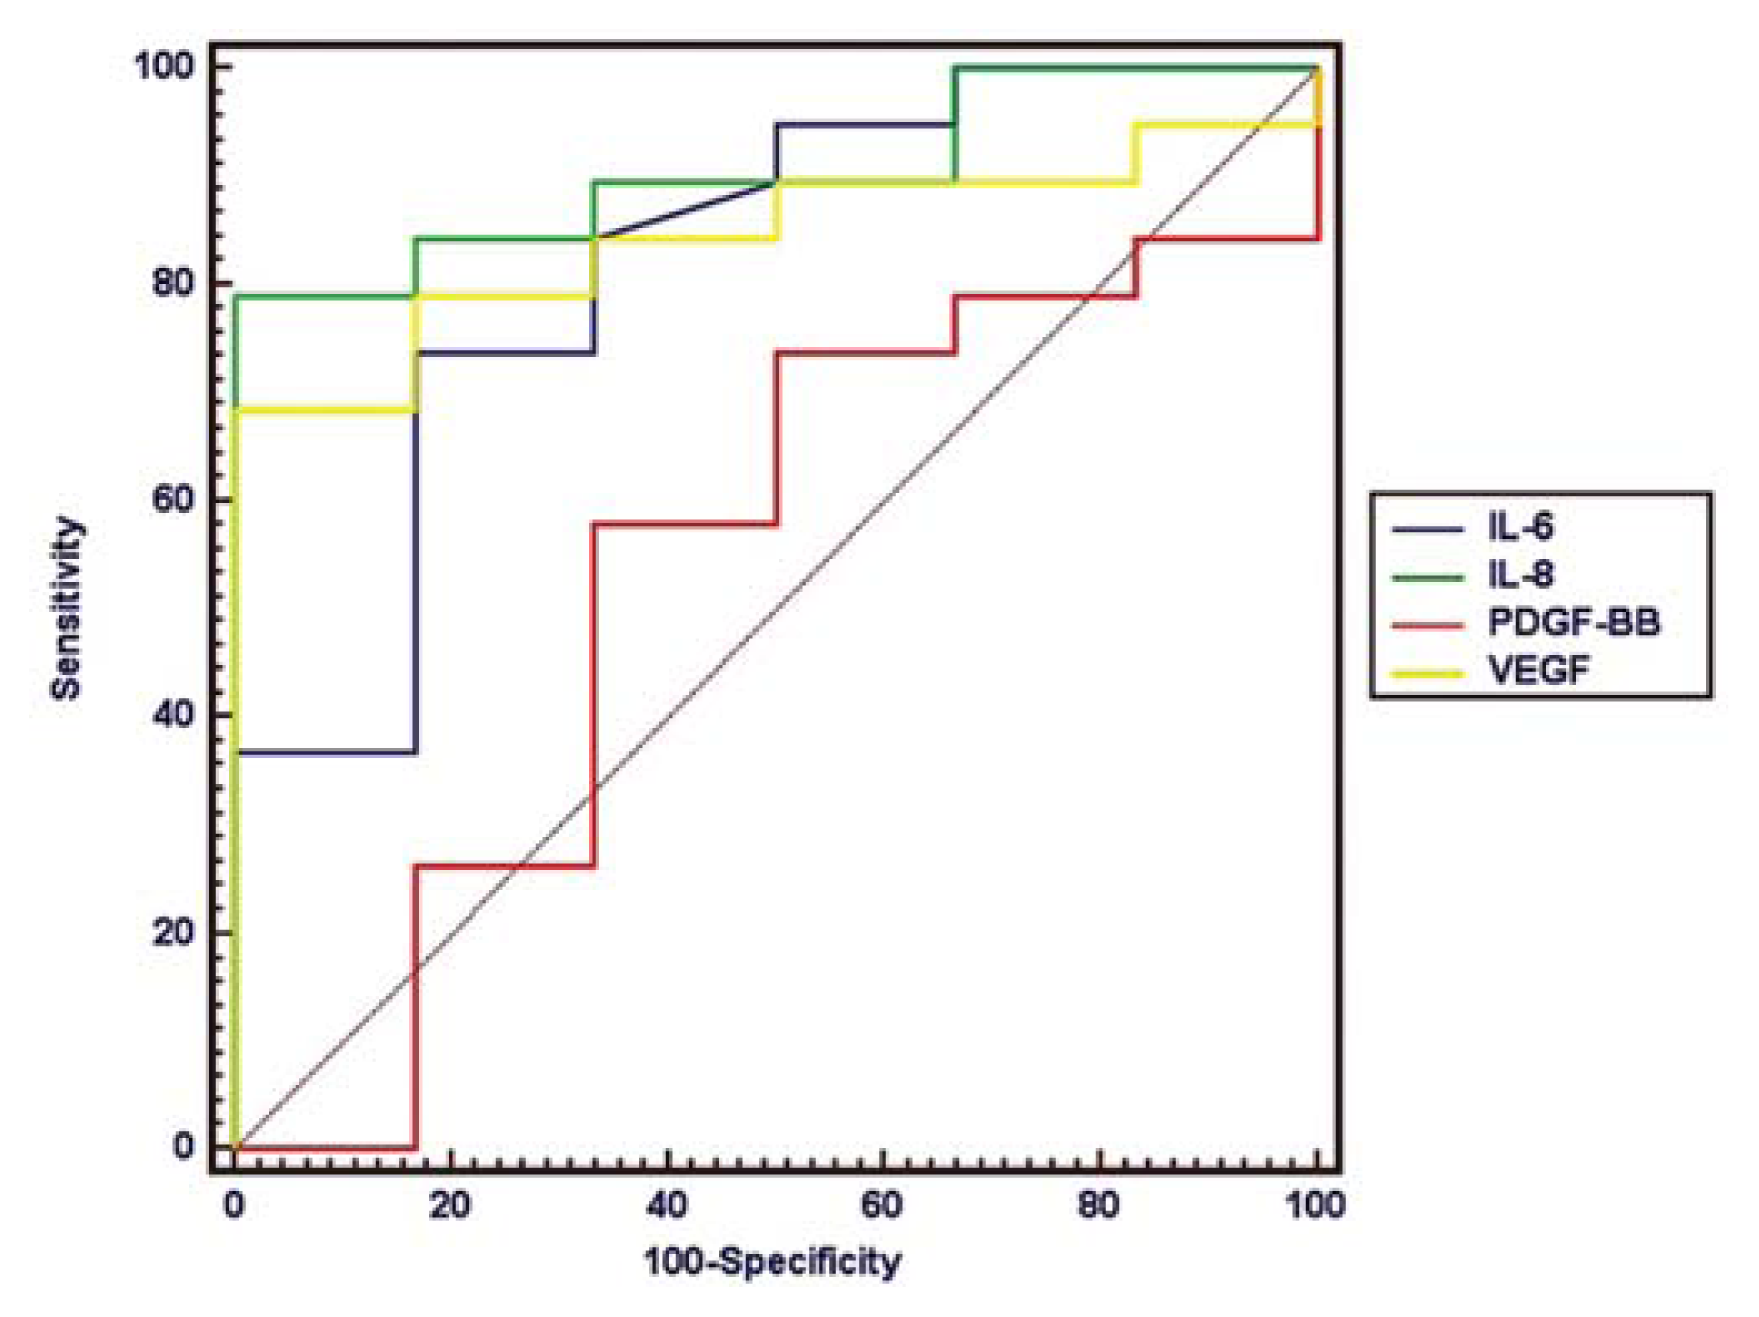
2.1. Circulating Angiogenic Factors in Patients with HCC and Controls
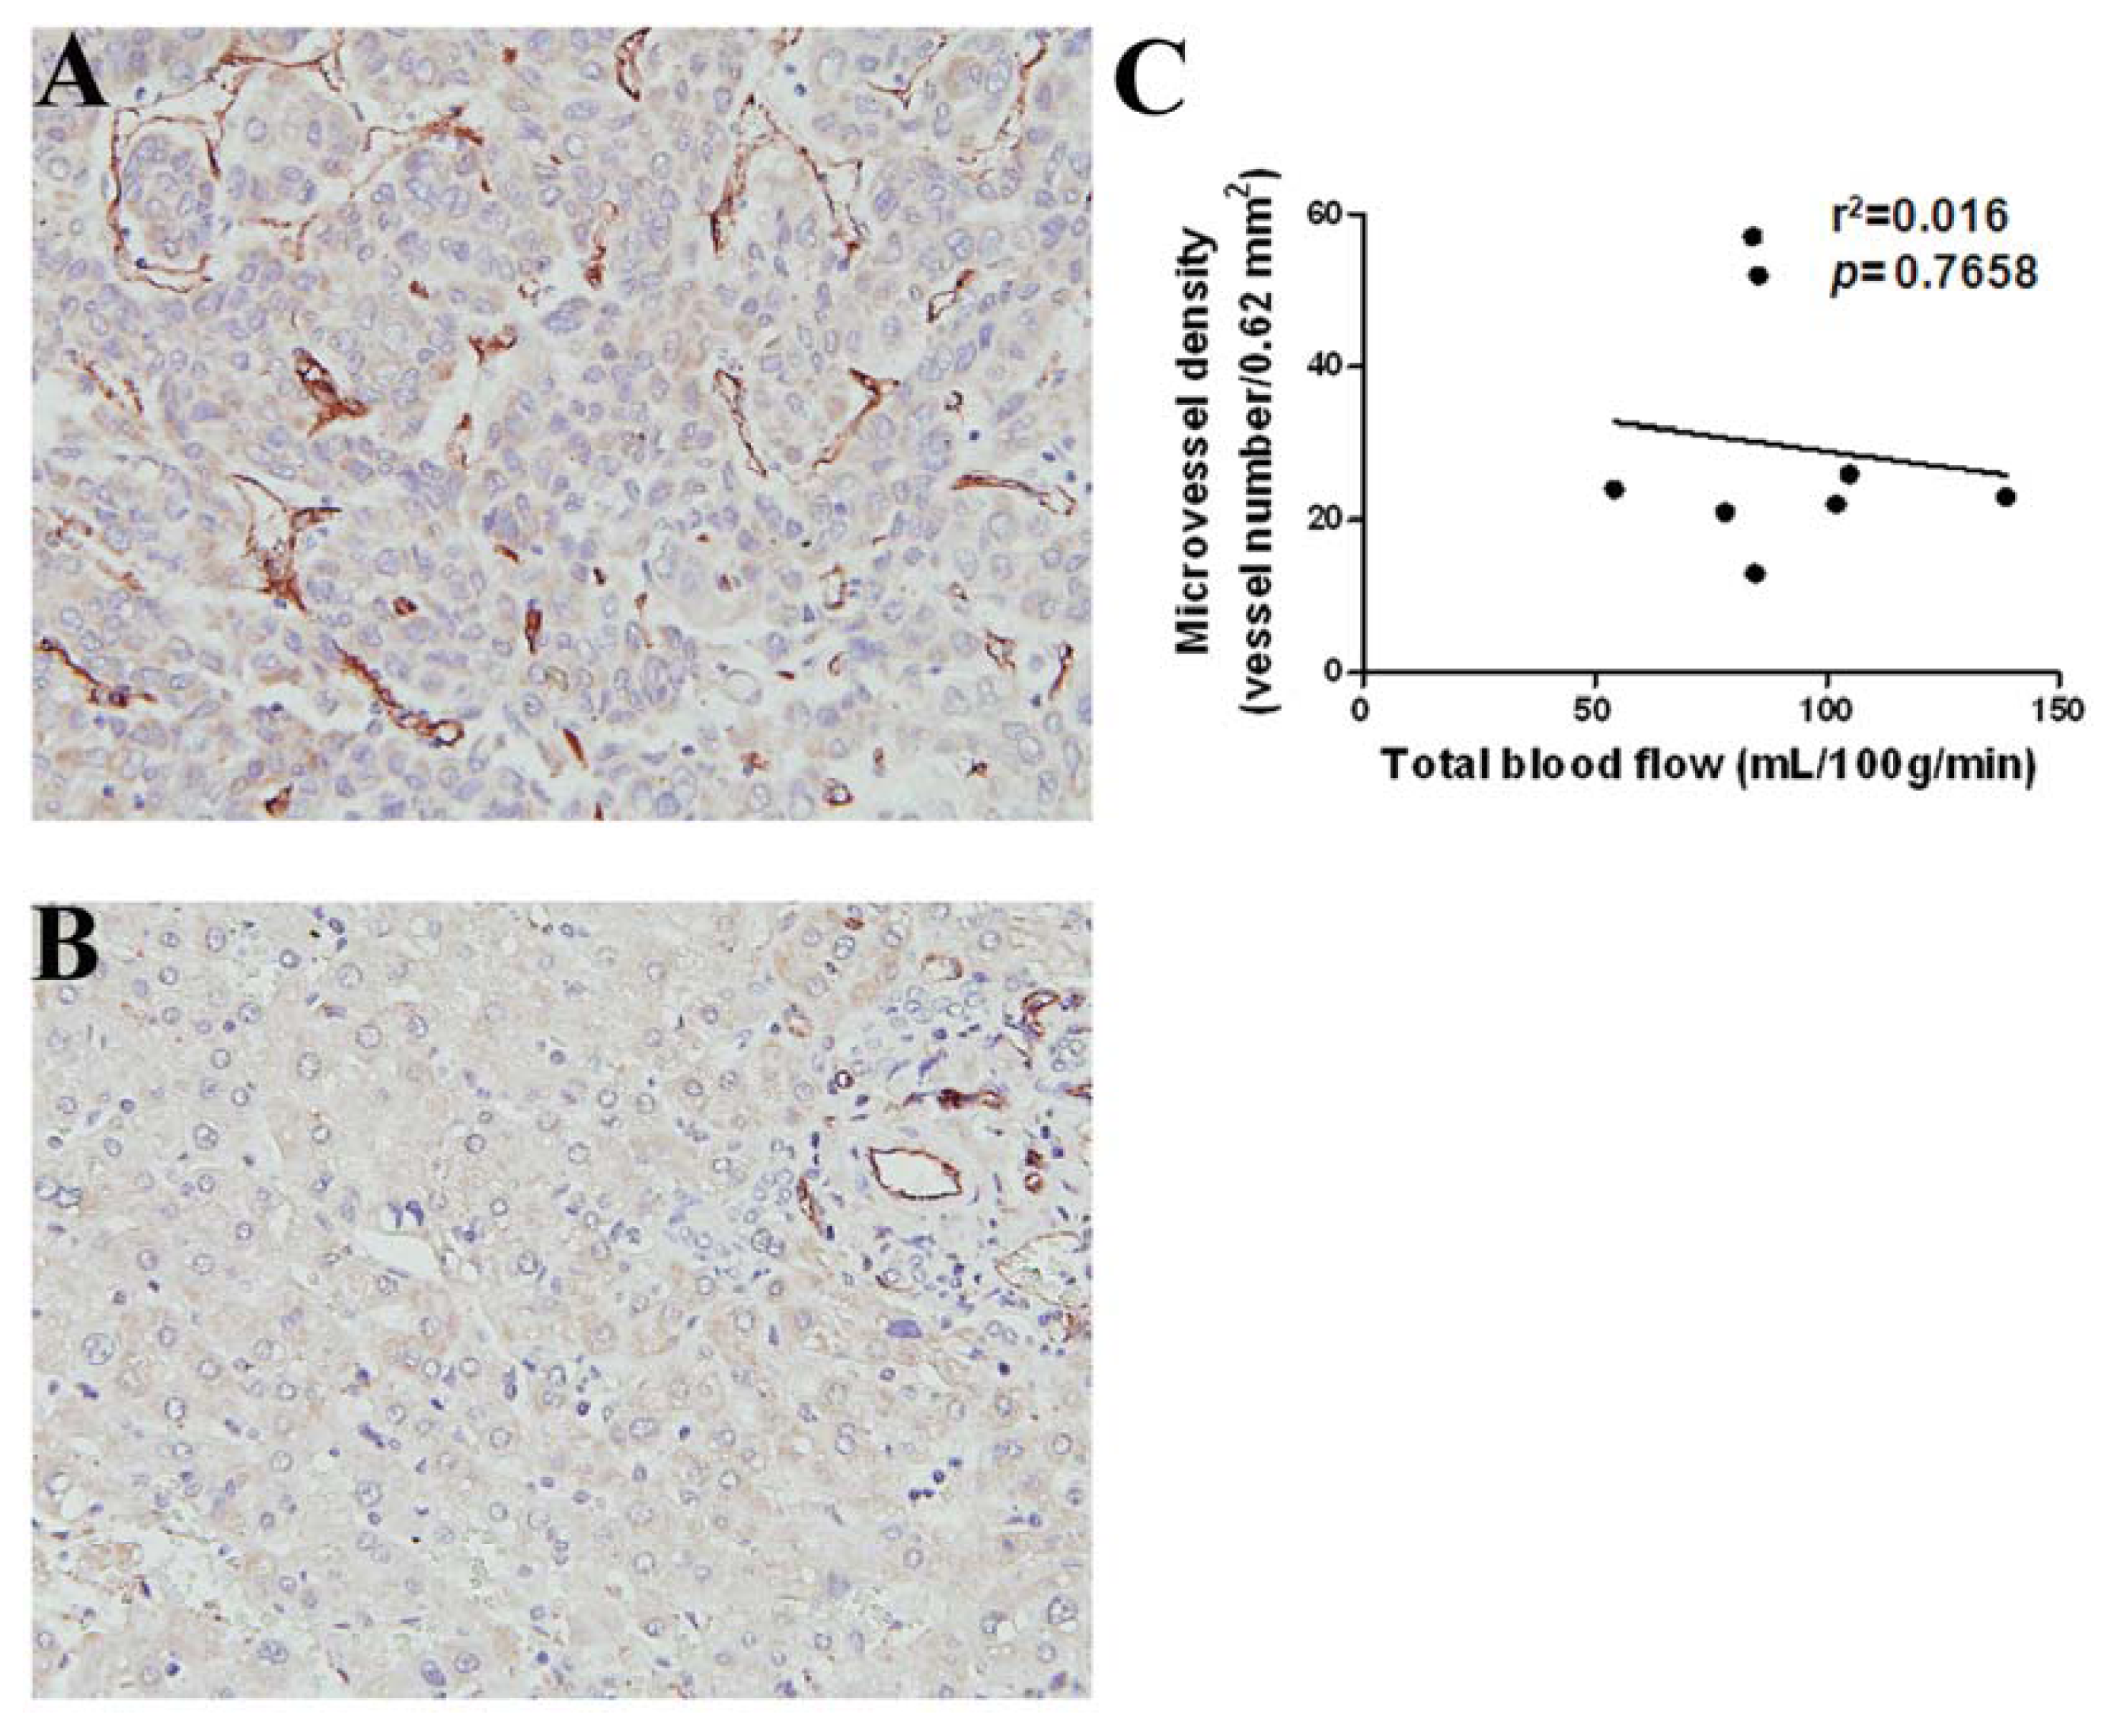
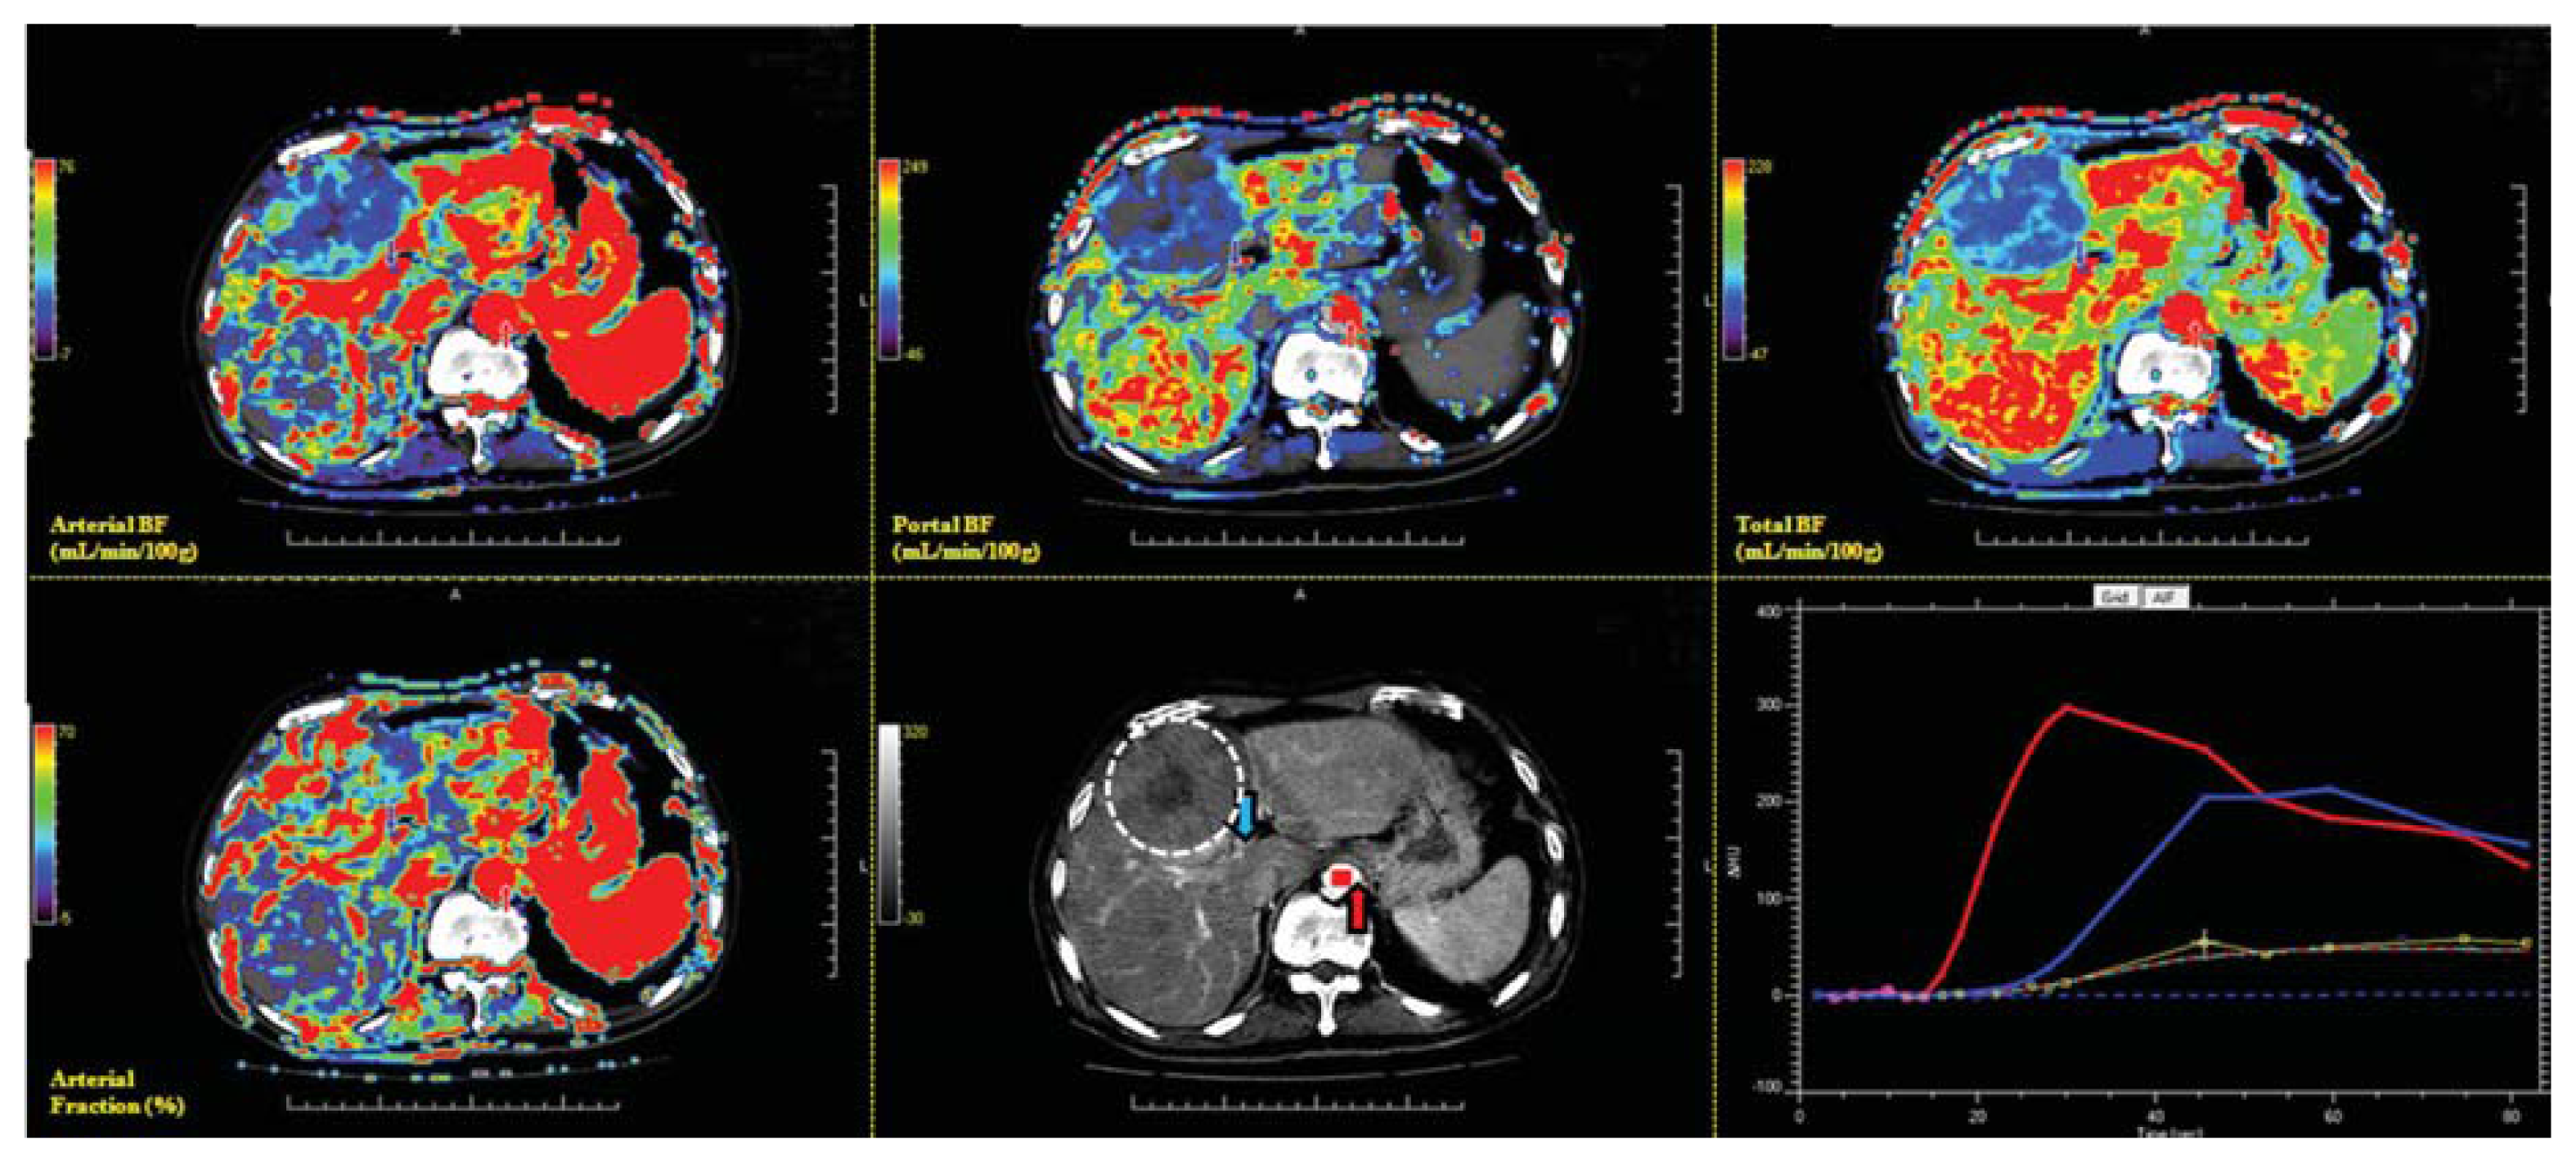
2.2. CT Perfusion Parameters and Microvessel Density (MVD)
2.3. Circulating Angiogenic Factors and CT Perfusion Parameters
2.4. HCC-Parenchyma Ratio of CT Perfusion Parameters and Circulating Angiogenic Factors
3. Discussion
4. Experimental Section
4.1. Ethics Statement
4.2. Patient Selection
4.3. Measurement of Circulating Angiogenic Factors
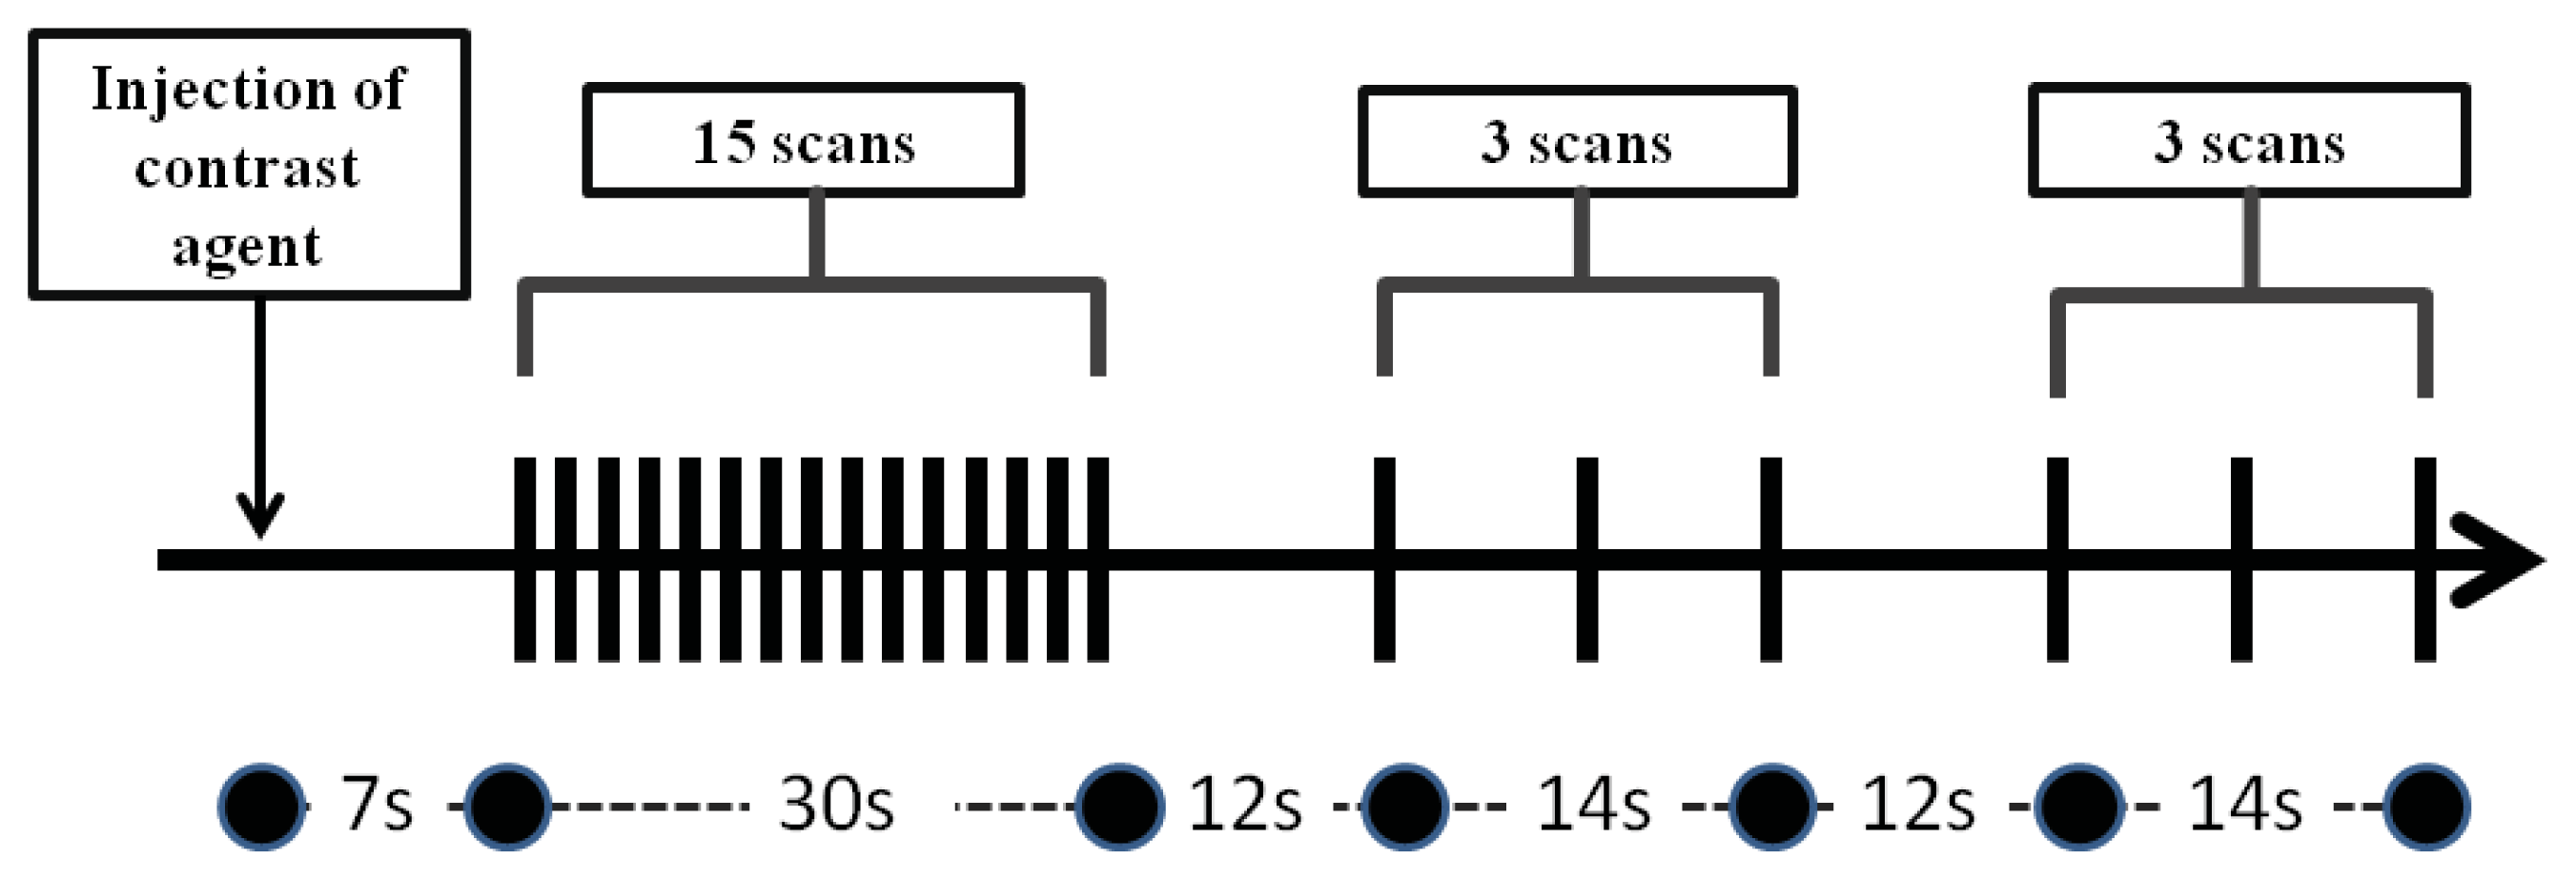
4.4. CT Perfusion Imaging
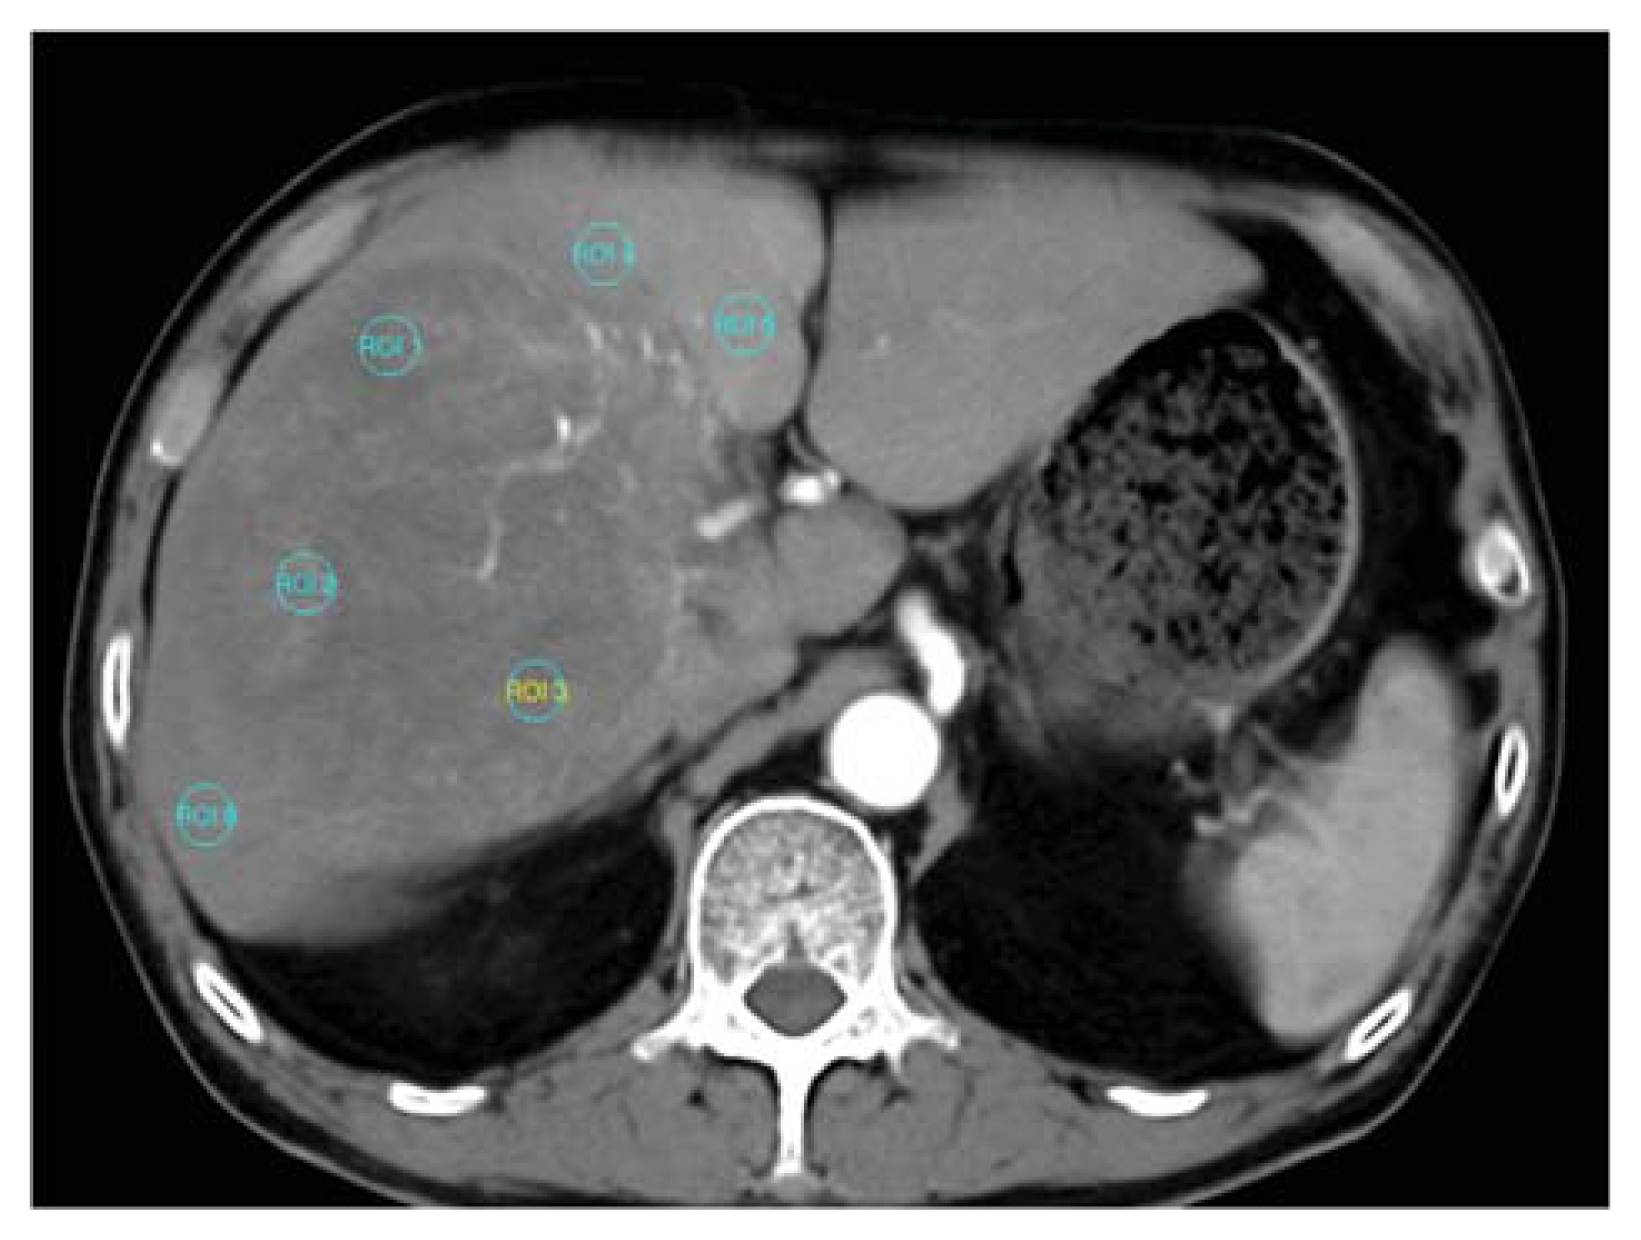
4.5. Post Processing Measurement of CT Perfusion
4.6. Immunohistochemistry (IHC) and Tumor Vascularity Counting
4.7. Statistical Analysis
5. Conclusions
Acknowledgments
Conflicts of Interest
References
- Jemal, A.; Bray, F.; Center, M.M.; Ferlay, J.; Ward, E.; Forman, D. Global cancer statistics. CA Cancer J. Clin 2011, 61, 69–90. [Google Scholar]
- Yeh, C.N.; Lee, W.C.; Jeng, L.B.; Chen, M.F. Hepatic resection for hepatocellular carcinoma in Taiwan. Eur. J. Surg. Oncol 2002, 28, 652–656. [Google Scholar]
- Folkman, J. Tumor angiogenesis: Therapeutic implications. N. Engl. J. Med 1971, 285, 1182–1186. [Google Scholar]
- Asayama, Y.; Yoshimitsu, K.; Nishihara, Y.; Irie, H.; Aishima, S.; Taketomi, A.; Honda, H. Arterial blood supply of hepatocellular carcinoma and histologic grading: Radiologic-pathologic correlation. AJR Am. J. Roentgenol 2008, 190, W28–W34. [Google Scholar]
- Miles, K.A. Perfusion CT for the assessment of tumour vascularity: Which protocol? Br. J. Radiol 2003, 76, S36–S42. [Google Scholar]
- Cuenod, C.A.; Fournier, L.; Balvay, D.; Guinebretiere, J.M. Tumor angiogenesis: Pathophysiology and implications for contrast-enhanced MRI and CT assessment. Abdom. Imaging 2006, 31, 188–193. [Google Scholar]
- Hanahan, D.; Folkman, J. Patterns and emerging mechanisms of the angiogenic switch during tumorigenesis. Cell 1996, 86, 353–364. [Google Scholar]
- Ellegala, D.B.; Leong-Poi, H.; Carpenter, J.E.; Klibanov, A.L.; Kaul, S.; Shaffrey, M.E.; Sklenar, J.; Lindner, J.R. Imaging tumor angiogenesis with contrast ultrasound and microbubbles targeted to alpha(v)beta3. Circulation 2003, 108, 336–341. [Google Scholar]
- Yang, H.F.; Du, Y.; Ni, J.X.; Zhou, X.P.; Li, J.D.; Zhang, Q.; Xu, X.X.; Li, Y. Perfusion computed tomography evaluation of angiogenesis in liver cancer. Eur. Radiol 2010, 20, 1424–1430. [Google Scholar]
- Goh, V.; Halligan, S.; Daley, F.; Wellsted, D.M.; Guenther, T.; Bartram, C.I. Colorectal tumor vascularity: Quantitative assessment with multidetector CT—Do tumor perfusion measurements reflect angiogenesis? Radiology 2008, 249, 510–517. [Google Scholar]
- Yi, C.A.; Lee, K.S.; Kim, E.A.; Han, J.; Kim, H.; Kwon, O.J.; Jeong, Y.J.; Kim, S. Solitary pulmonary nodules: Dynamic enhanced multi-detector row CT study and comparison with vascular endothelial growth factor and microvessel density. Radiology 2004, 233, 191–199. [Google Scholar]
- Chen, Y.; Zhang, J.; Dai, J.; Feng, X.; Lu, H.; Zhou, C. Angiogenesis of renal cell carcinoma: Perfusion CT findings. Abdom. Imaging 2010, 35, 622–628. [Google Scholar]
- Sahani, D.V.; Holalkere, N.S.; Mueller, P.R.; Zhu, A.X. Advanced hepatocellular carcinoma: CT perfusion of liver and tumor tissue—Initial experience. Radiology 2007, 243, 736–743. [Google Scholar]
- Zhu, A.X.; Holalkere, N.S.; Muzikansky, A.; Horgan, K.; Sahani, D.V. Early antiangiogenic activity of bevacizumab evaluated by computed tomography perfusion scan in patients with advanced hepatocellular carcinoma. Oncologist 2008, 13, 120–125. [Google Scholar]
- Pandharipande, P.V.; Krinsky, G.A.; Rusinek, H.; Lee, V.S. Perfusion imaging of the liver: Current challenges and future goals. Radiology 2005, 234, 661–673. [Google Scholar]
- Sacco, R.; Faggioni, L.; Bargellini, I.; Ginanni, B.; Battaglia, V.; Romano, A.; Bertini, M.; Bresci, G.; Bartolozzi, C. Assessment of response to sorafenib in advanced hepatocellular carcinoma using perfusion computed tomography: Results of a pilot study. Dig. Liver Dis. 2013. [Google Scholar] [CrossRef]
- Koh, T.S.; Thng, C.H.; Hartono, S.; Lee, P.S.; Choo, S.P.; Poon, D.Y.; Toh, H.C.; Bisdas, S. Dynamic contrast-enhanced CT imaging of hepatocellular carcinoma in cirrhosis: Feasibility of a prolonged dual-phase imaging protocol with tracer kinetics modeling. Eur. Radiol 2009, 19, 1184–1196. [Google Scholar]
- Ippolito, D.; Sironi, S.; Pozzi, M.; Antolini, L.; Ratti, L.; Alberzoni, C.; Leone, E.B.; Meloni, F.; Valsecchi, M.G.; Fazio, F. Hepatocellular carcinoma in cirrhotic liver disease: Functional computed tomography with perfusion imaging in the assessment of tumor vascularization. Acad. Radiol 2008, 15, 919–927. [Google Scholar]
- Chen, G.; Ma, D.Q.; He, W.; Zhang, B.F.; Zhao, L.Q. Computed tomography perfusion in evaluating the therapeutic effect of transarterial chemoembolization for hepatocellular carcinoma. World J. Gastroenterol 2008, 14, 5738–5743. [Google Scholar]
- Ippolito, D.; Sironi, S.; Pozzi, M.; Antolini, L.; Invernizzi, F.; Ratti, L.; Leone, E.B.; Fazio, F. Perfusion CT in cirrhotic patients with early stage hepatocellular carcinoma: Assessment of tumor-related vascularization. Eur. J. Radiol 2008, 73, 148–152. [Google Scholar]
- Ippolito, D.; Sironi, S.; Pozzi, M.; Antolini, L.; Ratti, L.; Meloni, F.; Invernizzi, F.; Valsecchi, M.G.; Fazio, F. Perfusion computed tomographic assessment of early hepatocellular carcinoma in cirrhotic liver disease: Initial observations. J. Comput. Assist. Tomogr 2008, 32, 855–858. [Google Scholar]
- Ippolito, D.; Bonaffini, P.A.; Ratti, L.; Antolini, L.; Corso, R.; Fazio, F.; Sironi, S. Hepatocellular carcinoma treated with transarterial chemoembolization: Dynamic perfusion-CT in the assessment of residual tumor. World J. Gastroenterol 2010, 16, 5993–6000. [Google Scholar]
- Ippolito, D.; Capraro, C.; Casiraghi, A.; Cestari, C.; Sironi, S. Quantitative assessment of tumour associated neovascularisation in patients with liver cirrhosis and hepatocellular carcinoma: Role of dynamic-CT perfusion imaging. Eur. Radiol 2012, 22, 803–811. [Google Scholar]
- Poon, R.T.; Fan, S.T.; Wong, J. Clinical implications of circulating angiogenic factors in cancer patients. J. Clin. Oncol 2001, 19, 1207–1225. [Google Scholar]
- Porta, C.; de Amici, M.; Quaglini, S.; Paglino, C.; Tagliani, F.; Boncimino, A.; Moratti, R.; Corazza, G.R. Circulating interleukin-6 as a tumor marker for hepatocellular carcinoma. Ann. Oncol 2008, 19, 353–358. [Google Scholar]
- Kim, S.J.; Choi, I.K.; Park, K.H.; Yoon, S.Y.; Oh, S.C.; Seo, J.H.; Choi, C.W.; Kim, B.S.; Shin, S.W.; Kim, Y.H.; et al. Serum vascular endothelial growth factor per platelet count in hepatocellular carcinoma: Correlations with clinical parameters and survival. Jpn. J. Clin. Oncol 2004, 34, 184–190. [Google Scholar]
- Ren, Y.; Poon, R.T.; Tsui, H.T.; Chen, W.H.; Li, Z.; Lau, C.; Yu, W.C.; Fan, S.T. Interleukin-8 serum levels in patients with hepatocellular carcinoma: Correlations with clinicopathological features and prognosis. Clin. Cancer Res 2003, 9, 5996–6001. [Google Scholar]
- Zhou, L.; Liu, J.; Luo, F. Serum tumor markers for detection of hepatocellular carcinoma. World J. Gastroenterol 2006, 12, 1175–1181. [Google Scholar]
- Fu, Q.; Zhu, J.; van Eyk, J.E. Comparison of multiplex immunoassay platforms. Clin. Chem 2010, 56, 314–318. [Google Scholar]
- Shan, Y.F.; Huang, Y.L.; Xie, Y.K.; Tan, Y.H.; Chen, B.C.; Zhou, M.T.; Shi, H.Q.; Yu, Z.P.; Song, Q.T.; Zhang, Q.Y. Angiogenesis and clinicopathologic characteristics in different hepatocellular carcinoma subtypes defined by EpCAM and alpha-fetoprotein expression status. Med. Oncol 2011, 28, 1012–1016. [Google Scholar]
- Petreaca, M.L.; Yao, M.; Liu, Y.; Defea, K.; Martins-Green, M. Transactivation of vascular endothelial growth factor receptor-2 by interleukin-8 (IL-8/CXCL8) is required for IL-8/CXCL8-induced endothelial permeability. Mol. Biol. Cell 2007, 18, 5014–5023. [Google Scholar]
- Nilsson, M.B.; Langley, R.R.; Fidler, I.J. Interleukin-6, secreted by human ovarian carcinoma cells, is a potent proangiogenic cytokine. Cancer Res 2005, 65, 10794–10800. [Google Scholar]
- McClintock, J.Y.; Wagner, E.M. Role of IL-6 in systemic angiogenesis of the lung. J. Appl. Physiol 2005, 99, 861–866. [Google Scholar]
- Sugimachi, K.; Tanaka, S.; Terashi, T.; Taguchi, K.; Rikimaru, T. The mechanisms of angiogenesis in hepatocellular carcinoma: Angiogenic switch during tumor progression. Surgery 2002, 131, S135–S141. [Google Scholar]
- Kim, K.R.; Moon, H.E.; Kim, K.W. Hypoxia-induced angiogenesis in human hepatocellular carcinoma. J. Mol. Med 2002, 80, 703–714. [Google Scholar]
- Heldin, C.H.; Westermark, B. Mechanism of action and in vivo role of platelet-derived growth factor. Physiol. Rev 1999, 79, 1283–1316. [Google Scholar]
- Luo, M.Y.; Shan, H.; Jiang, Z.B.; Li, L.F.; Huang, H.Q. Study on hepatocellular carcinoma-associated hepatic arteriovenous shunt using multidetector CT. World J. Gastroenterol 2003, 9, 2455–2459. [Google Scholar]
- Kornacker, M.; Roth, A.; Christensen, O.; Kratzschmar, J.; Wensing, G. Quantification of vascular endothelial growth factor, interleukin-8, and basic fibroblast growth factor in plasma of cancer patients and healthy volunteers—Comparison of ELISA and microsphere-based multiplexed immunoassay. Clin. Chem. Lab. Med 2008, 46, 1256–1264. [Google Scholar]
- Hsu, C.-Y.; Shen, Y.-C.; Yu, C.-W.; Hsu, C.; Hu, F.-C.; Hsu, C.-H.; Chen, B.-B.; Wei, S.-Y.; Cheng, A.-L.; Shih, T.T.-F. Dynamic contrast-enhanced magnetic resonance imaging biomarkers predict survival and response in hepatocellular carcinoma patients treated with sorafenib and metronomic tegafur/uracil. J. Hepatol 2011, 55, 858–865. [Google Scholar]
- Wang, J.; Chen, L.T.; Tsang, Y.M.; Liu, T.W.; Shih, T.T. Dynamic contrast-enhanced MRI analysis of perfusion changes in advanced hepatocellular carcinoma treated with an antiangiogenic agent: A preliminary study. AJR Am. J. Roentgenol 2004, 183, 713–719. [Google Scholar]
- Hafstrom, L.; Nobin, A.; Persson, B.; Sundqvist, K. Effects of catecholamines on cardiovascular response and blood flow distribution to normal tissue and liver tumors in rats. Cancer Res 1980, 40, 481–485. [Google Scholar]
- Bertolotto, M.; Pozzato, G.; Croce, L.S.; Nascimben, F.; Gasparini, C.; Cova, M.A.; Tiribelli, C. Blood flow changes in hepatocellular carcinoma after the administration of thalidomide assessed by reperfusion kinetics during microbubble infusion: Preliminary results. Invest. Radiol 2006, 41, 15–21. [Google Scholar]
- Kothari, M.; Guermazi, A.; White, D.; Suhy, J.; Reinhold, C. Imaging in antiangiogenesis trial: A clinical trials radiology perspective. Br. J. Radiol 2003, 76, S92–S96. [Google Scholar]
- Hsu, C.; Chen, C.N.; Chen, L.T.; Wu, C.Y.; Hsieh, F.J.; Cheng, A.L. Effect of thalidomide in hepatocellular carcinoma: Assessment with power doppler US and analysis of circulating angiogenic factors. Radiology 2005, 235, 509–516. [Google Scholar]
- Naugler, W.E.; Sakurai, T.; Kim, S.; Maeda, S.; Kim, K.; Elsharkawy, A.M.; Karin, M. Gender disparity in liver cancer due to sex differences in MyD88-dependent IL-6 production. Science 2007, 317, 121–124. [Google Scholar]
- Li, Z.P.; Meng, Q.F.; Sun, C.H.; Xu, D.S.; Fan, M.; Yang, X.F.; Chen, D.Y. Tumor angiogenesis and dynamic CT in colorectal carcinoma: Radiologic-pathologic correlation. World J. Gastroenterol 2005, 11, 1287–1291. [Google Scholar]
- Kan, Z.; Phongkitkarun, S.; Kobayashi, S.; Tang, Y.; Ellis, L.M.; Lee, T.Y.; Charnsangavej, C. Functional CT for quantifying tumor perfusion in antiangiogenic therapy in a rat model. Radiology 2005, 237, 151–158. [Google Scholar]
- Dvorak, H.F. Vascular permeability factor/vascular endothelial growth factor: A critical cytokine in tumor angiogenesis and a potential target for diagnosis and therapy. J. Clin. Oncol 2002, 20, 4368–4380. [Google Scholar]
- Wang, J.H.; Min, P.Q.; Wang, P.J.; Cheng, W.X.; Zhang, X.H.; Wang, Y.; Zhao, X.H.; Mao, X.Q. Dynamic CT evaluation of tumor vascularity in renal cell carcinoma. AJR Am. J. Roentgenol 2006, 186, 1423–1430. [Google Scholar]
- Bhatt, R.S.; Seth, P.; Sukhatme, V.P. Biomarkers for monitoring antiangiogenic therapy. Clin. Cancer Res 2007, 13, 777s–780s. [Google Scholar]
- Bruix, J.; Sherman, M.; Llovet, J.M.; Beaugrand, M.; Lencioni, R.; Burroughs, A.K.; Christensen, E.; Pagliaro, L.; Colombo, M.; Rodes, J. Clinical management of hepatocellular carcinoma. Conclusions of the barcelona-2000 EASL conference. European association for the study of the liver. J. Hepatol 2001, 35, 421–430. [Google Scholar]
- Miyazaki, S.; Murase, K.; Yoshikawa, T.; Morimoto, S.; Ohno, Y.; Sugimura, K. A quantitative method for estimating hepatic blood flow using a dual-input single-compartment model. Br. J. Radiol 2008, 81, 790–800. [Google Scholar]
- Materne, R.; Annet, L.; Dechambre, S.; Sempoux, C.; Smith, A.M.; Corot, C.; Horsmans, Y.; van Beers, B.E. Dynamic computed tomography with low- and high-molecular-mass contrast agents to assess microvascular permeability modifications in a model of liver fibrosis. Clin. Sci. (Lond. ) 2002, 103, 213–216. [Google Scholar]
- Weidner, N.; Semple, J.P.; Welch, W.R.; Folkman, J. Tumor angiogenesis and metastasis—Correlation in invasive breast carcinoma. N. Engl. J. Med 1991, 324, 1–8. [Google Scholar]


| CT perfusion parameters | HCC | Non-tumor parenchyma | Wilcoxon signed-rank test |
|---|---|---|---|
| Total BF (mL/min/100 g) | 100.13 ± 33.69 | 156.81 ± 67.55 | p = 0.002 ** |
| Arterial BF (mL/min/100 g) | 56.67 ± 20.06 | 47.62 ± 30.93 | p = 0.10 |
| Portal BF (mL/min/100 g) | 42.72 ± 28.33 | 106.33 ± 70.07 | p < 0.001 *** |
| Arterial fraction (Arterial BF/Total BF) (%) | 57.99 ± 14.77 | 36.09 ± 20.67 | p < 0.001 *** |
| CT perfusion parameters | Angiogenic factors # | |||||
|---|---|---|---|---|---|---|
| p value | IL-6 | IL-8 | VEGF | PDGF | MVD # | AFP # |
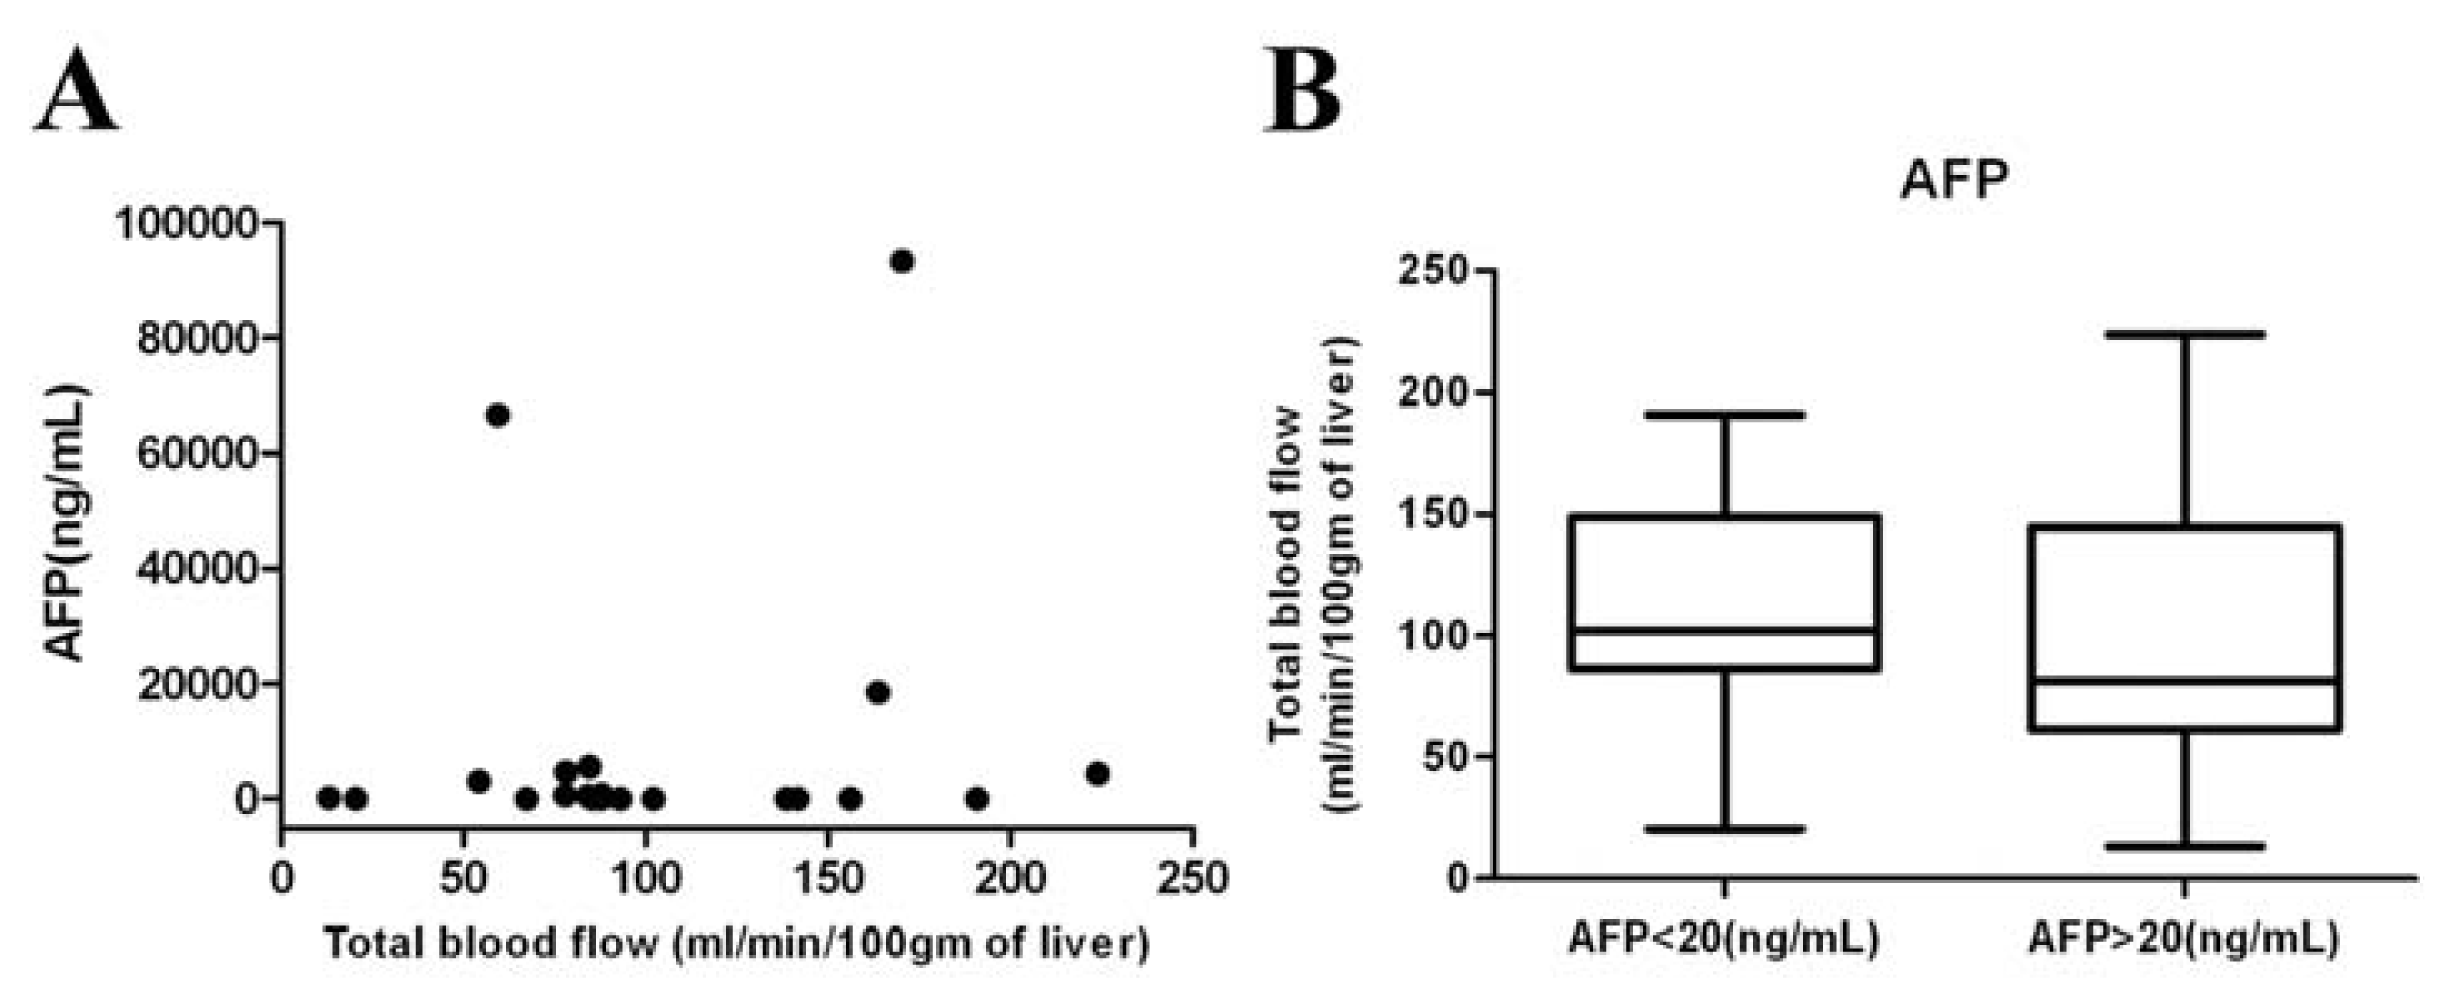
| Total BF | 0.8191 | 0.7788 | 0.8353 | 0.6820 | 0.7658 | 0.2146 |
| Arterial BF | 0.7864 | 0.7558 | 0.3398 | 0.0557 | 0.8396 | 0.7104 |
| Portal BF | 0.9357 | 0.5805 | 0.8837 | 0.4238 | 0.8702 | 0.2278 |
| Arterial fraction | 0.3227 | 0.8731 | 0.2239 | 0.1044 | 0.5364 | 0.5758 |
| HCC-parenchymal ratio of total BF | 0.9267 | 0.1520 | 0.9313 | 0.7516 | 0.5727 | 0.0029 ** |
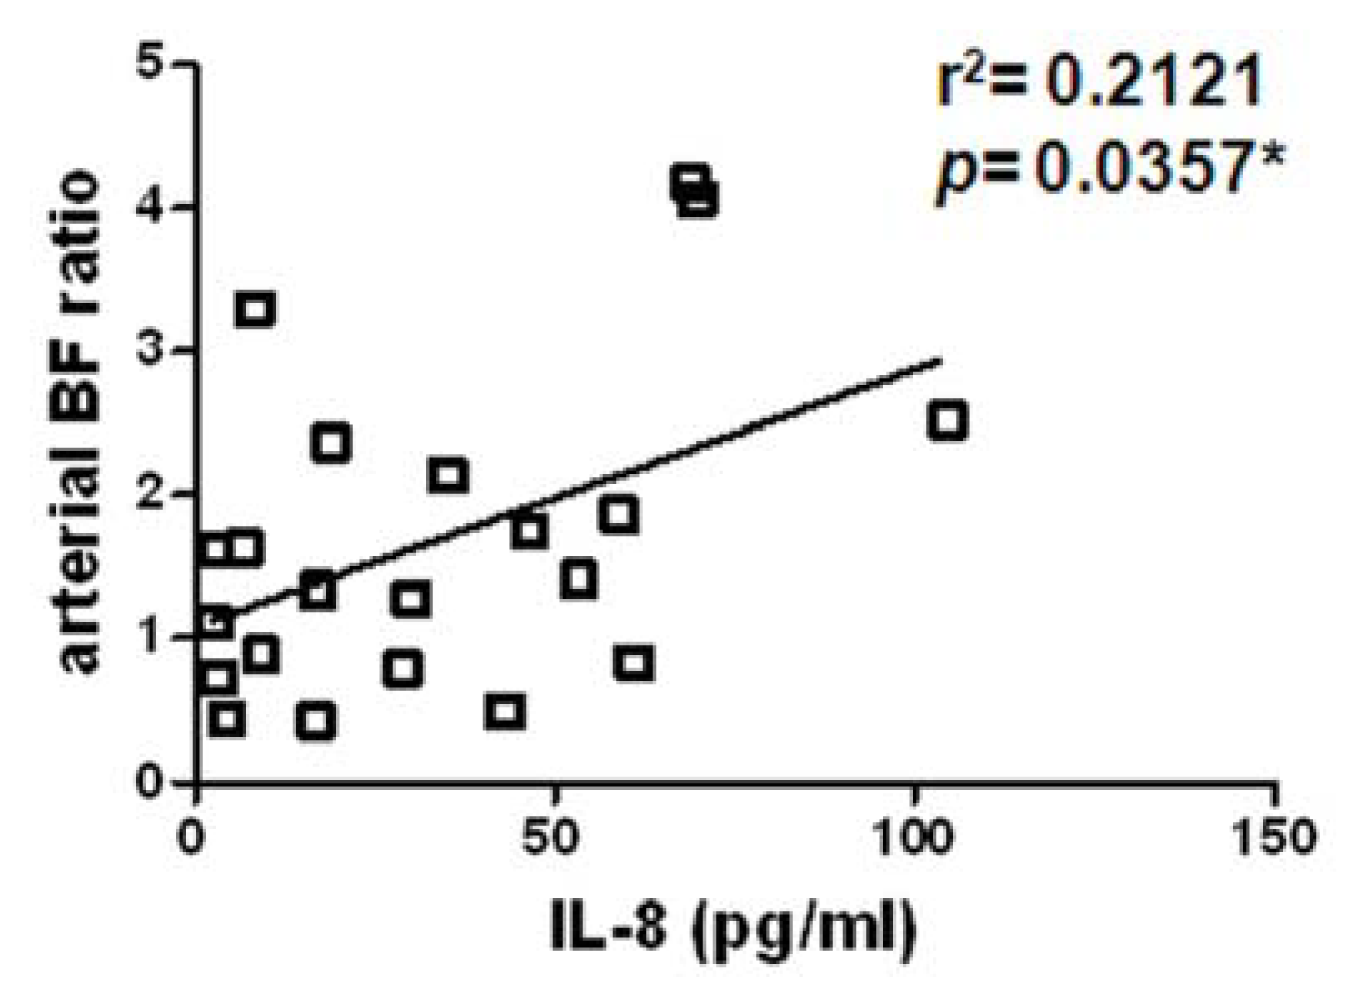
| HCC-parenchymal ratio of arterial BF | 0.8009 | 0.0357 * | 0.7571 | 0.0766 | 0.0678 | 0.0388 * |
| HCC-parenchymal ratio of portal BF | 0.8722 | 0.5982 | 0.9482 | 0.7022 | 0.5616 | 0.1138 |
| HCC-parenchymal ratio of arterial fraction | 0.3368 | 0.0792 | 0.7441 | 0.2174 | 0.2278 | 0.4538 |
© 2013 by the authors; licensee MDPI, Basel, Switzerland This article is an open access article distributed under the terms and conditions of the Creative Commons Attribution license (http://creativecommons.org/licenses/by/3.0/).
Share and Cite
Chen, Y.-W.; Pan, H.-B.; Tseng, H.-H.; Hung, Y.-T.; Huang, J.-S.; Chou, C.-P. Assessment of Blood Flow in Hepatocellular Carcinoma: Correlations of Computed Tomography Perfusion Imaging and Circulating Angiogenic Factors. Int. J. Mol. Sci. 2013, 14, 17536-17552. https://doi.org/10.3390/ijms140917536
Chen Y-W, Pan H-B, Tseng H-H, Hung Y-T, Huang J-S, Chou C-P. Assessment of Blood Flow in Hepatocellular Carcinoma: Correlations of Computed Tomography Perfusion Imaging and Circulating Angiogenic Factors. International Journal of Molecular Sciences. 2013; 14(9):17536-17552. https://doi.org/10.3390/ijms140917536
Chicago/Turabian StyleChen, Ya-Wen, Huay-Ben Pan, Hui-Hwa Tseng, Yu-Ting Hung, Jer-Shyung Huang, and Chen-Pin Chou. 2013. "Assessment of Blood Flow in Hepatocellular Carcinoma: Correlations of Computed Tomography Perfusion Imaging and Circulating Angiogenic Factors" International Journal of Molecular Sciences 14, no. 9: 17536-17552. https://doi.org/10.3390/ijms140917536