Phosphorylation of Histone H2AX in the Mouse Brain from Development to Senescence

Abstract
:1. Introduction
2. Results and Discussion
2.1. Expression of γH2AX in the Mouse Brain
2.1.1. Forebrain
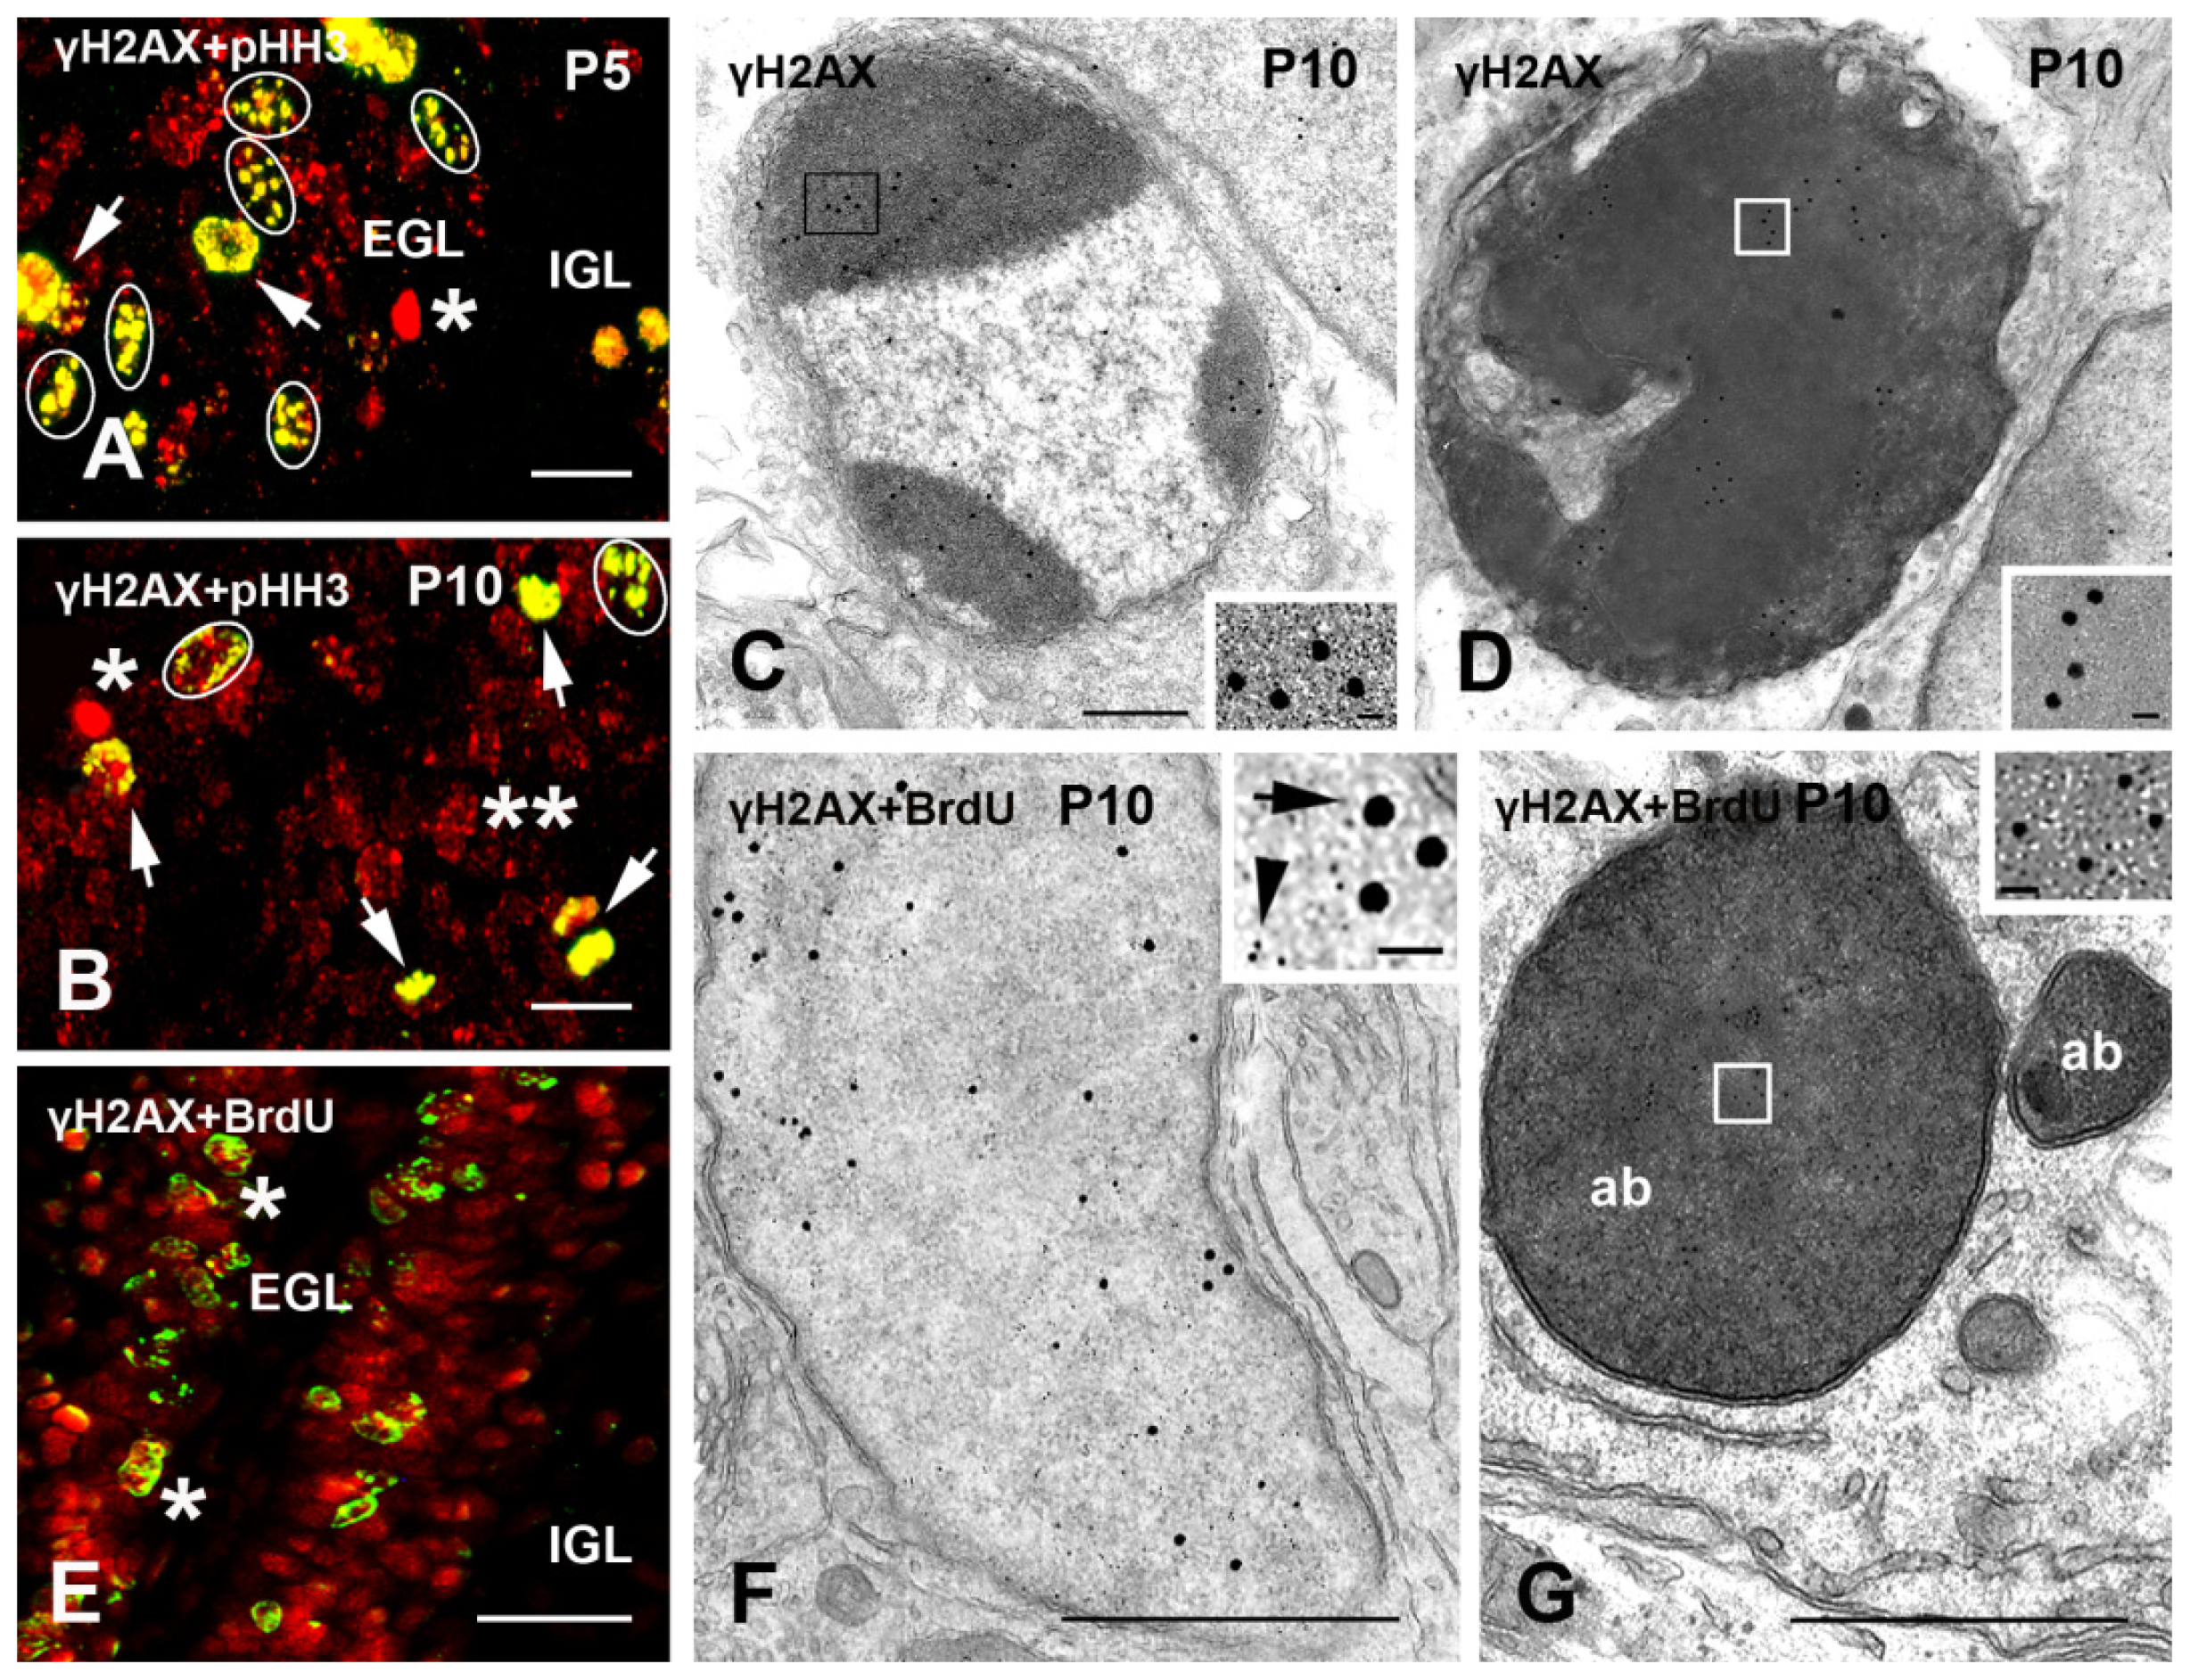
2.1.2. Cerebellum
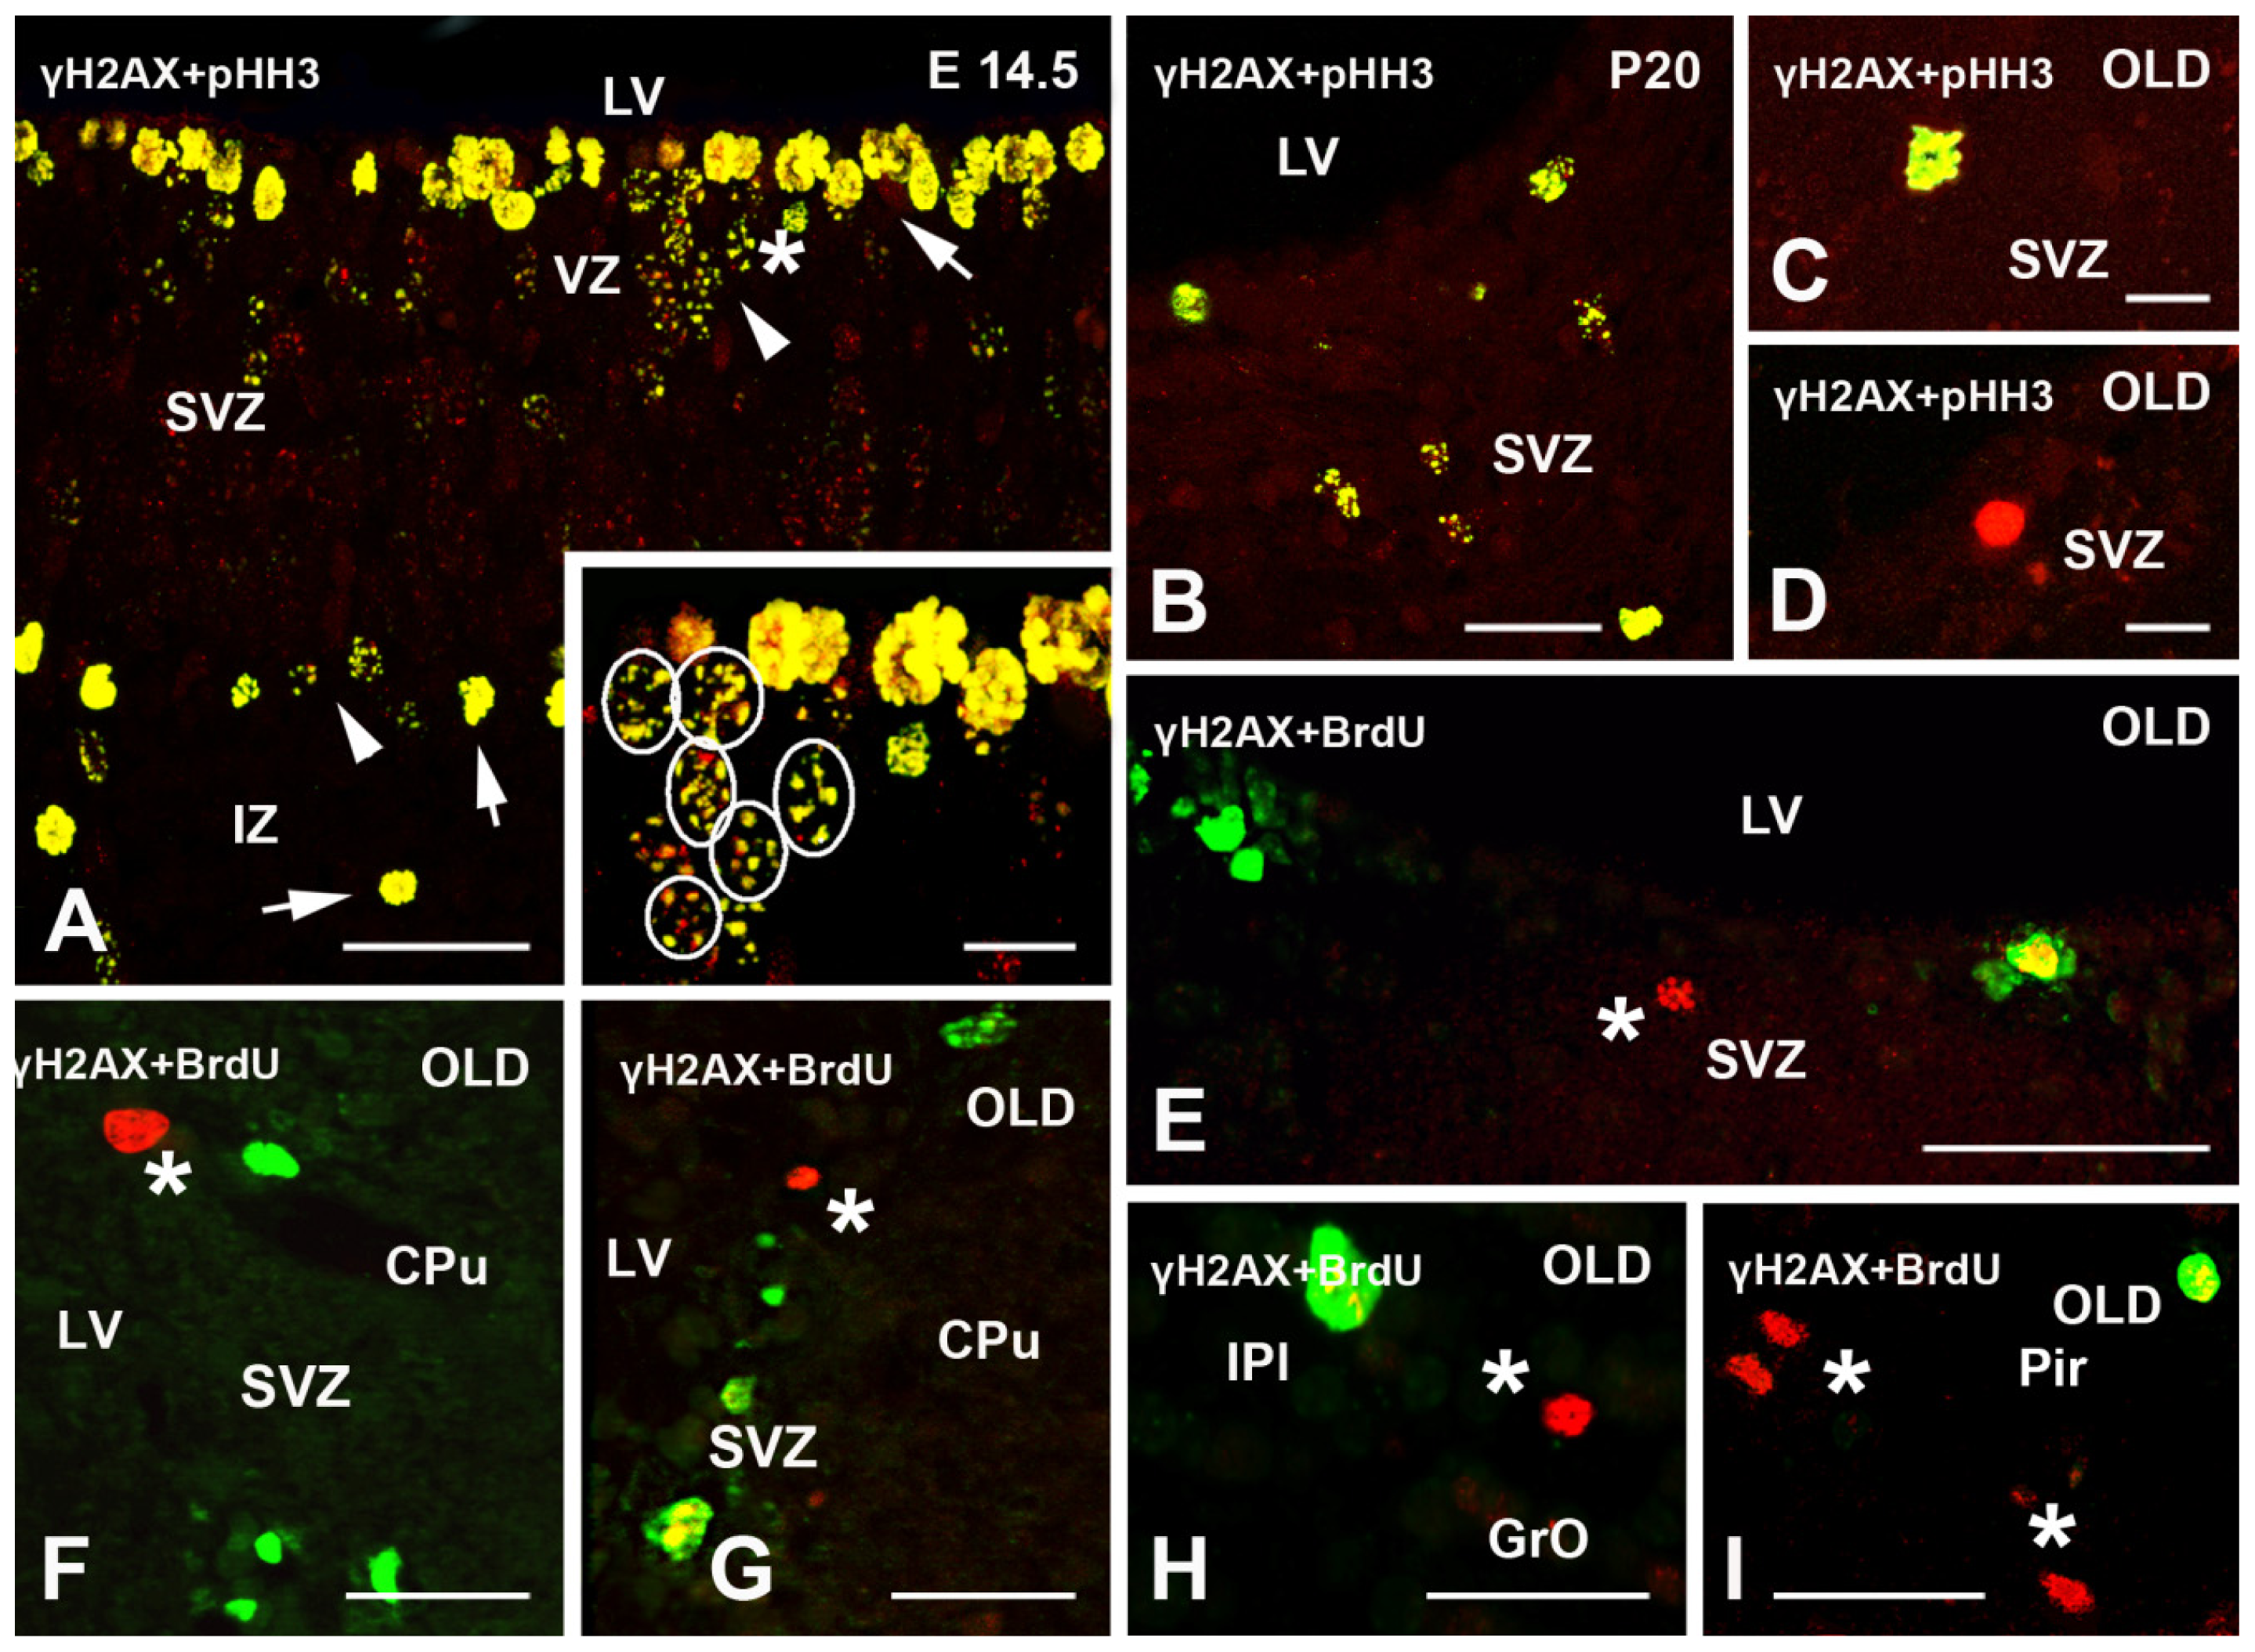
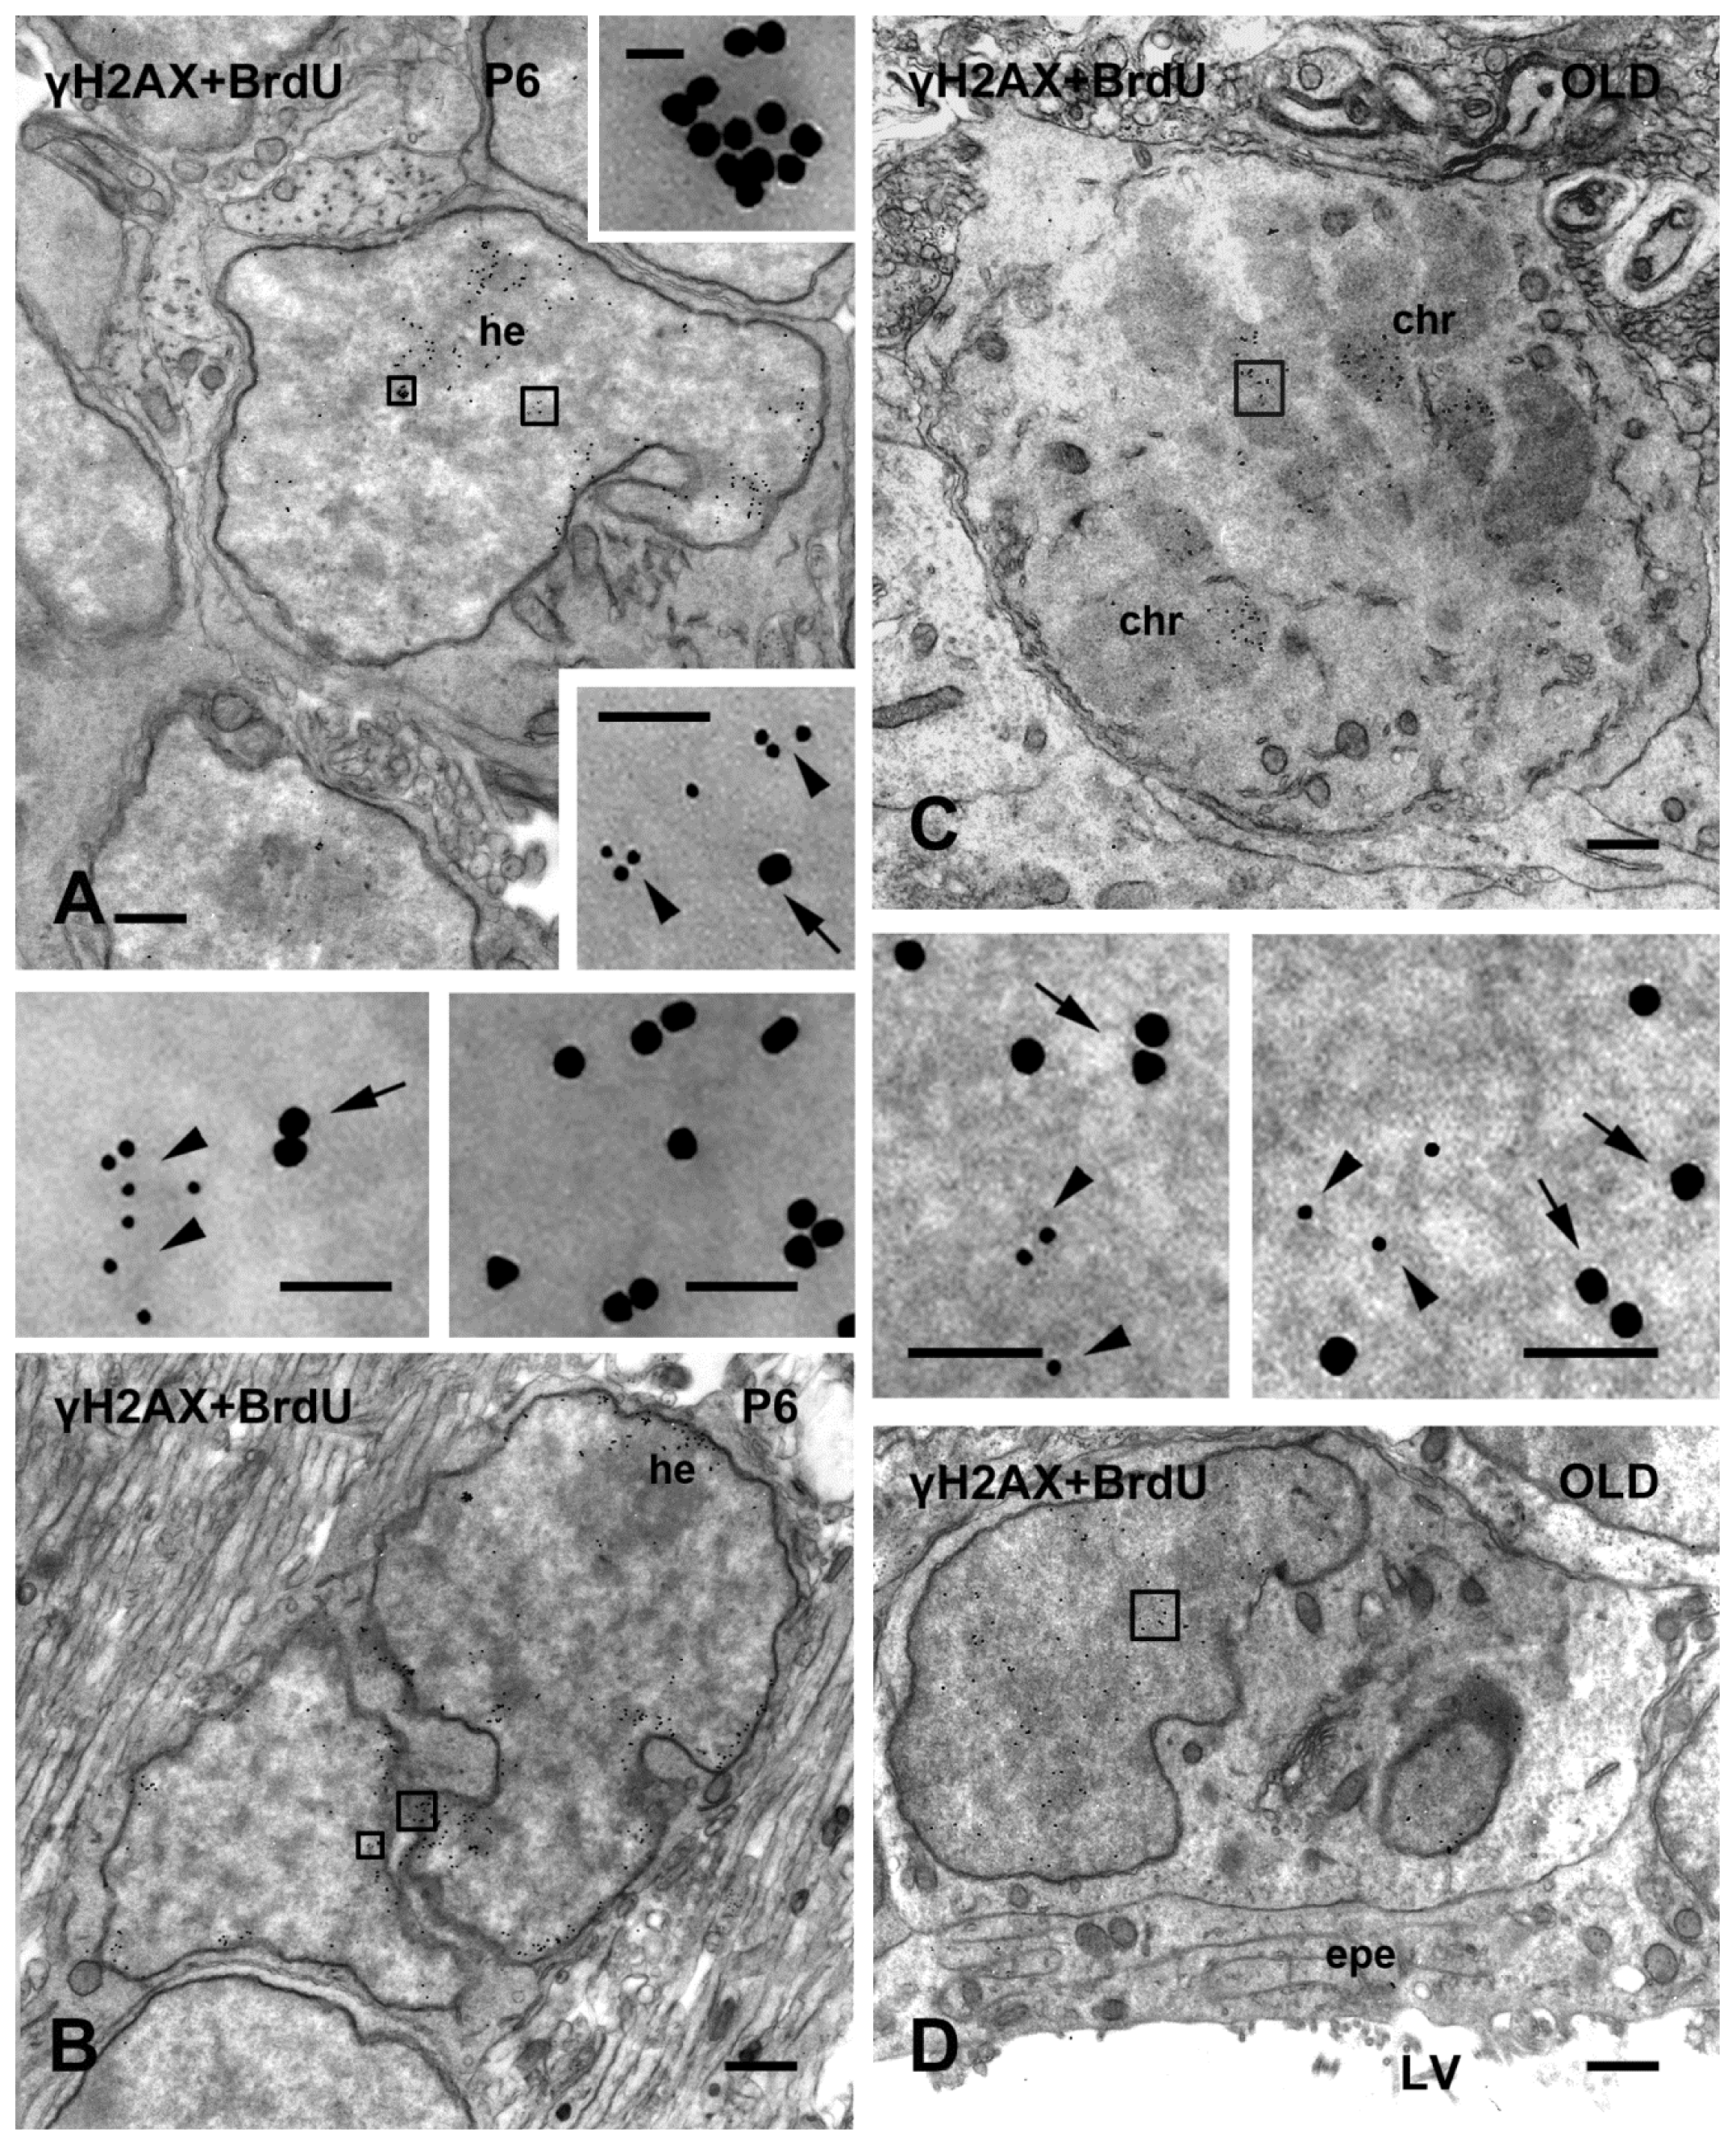
2.2. γH2AX in Proliferating/Apoptotic Cells
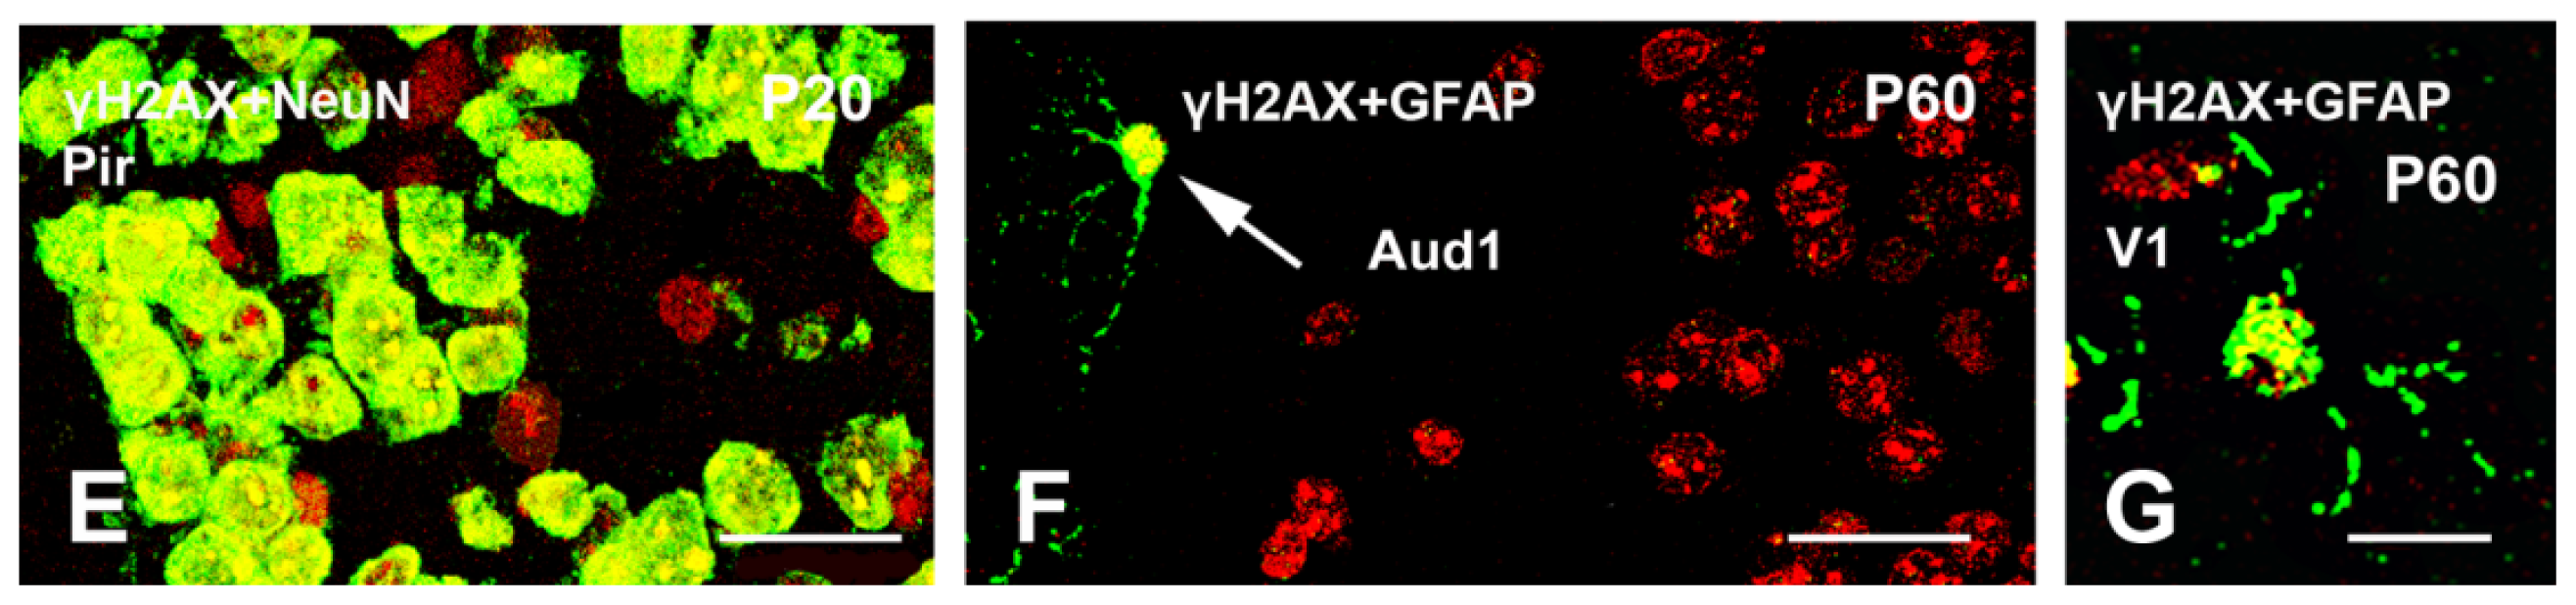
2.3. γH2AX in Postmitotic Cells
3. Experimental Section
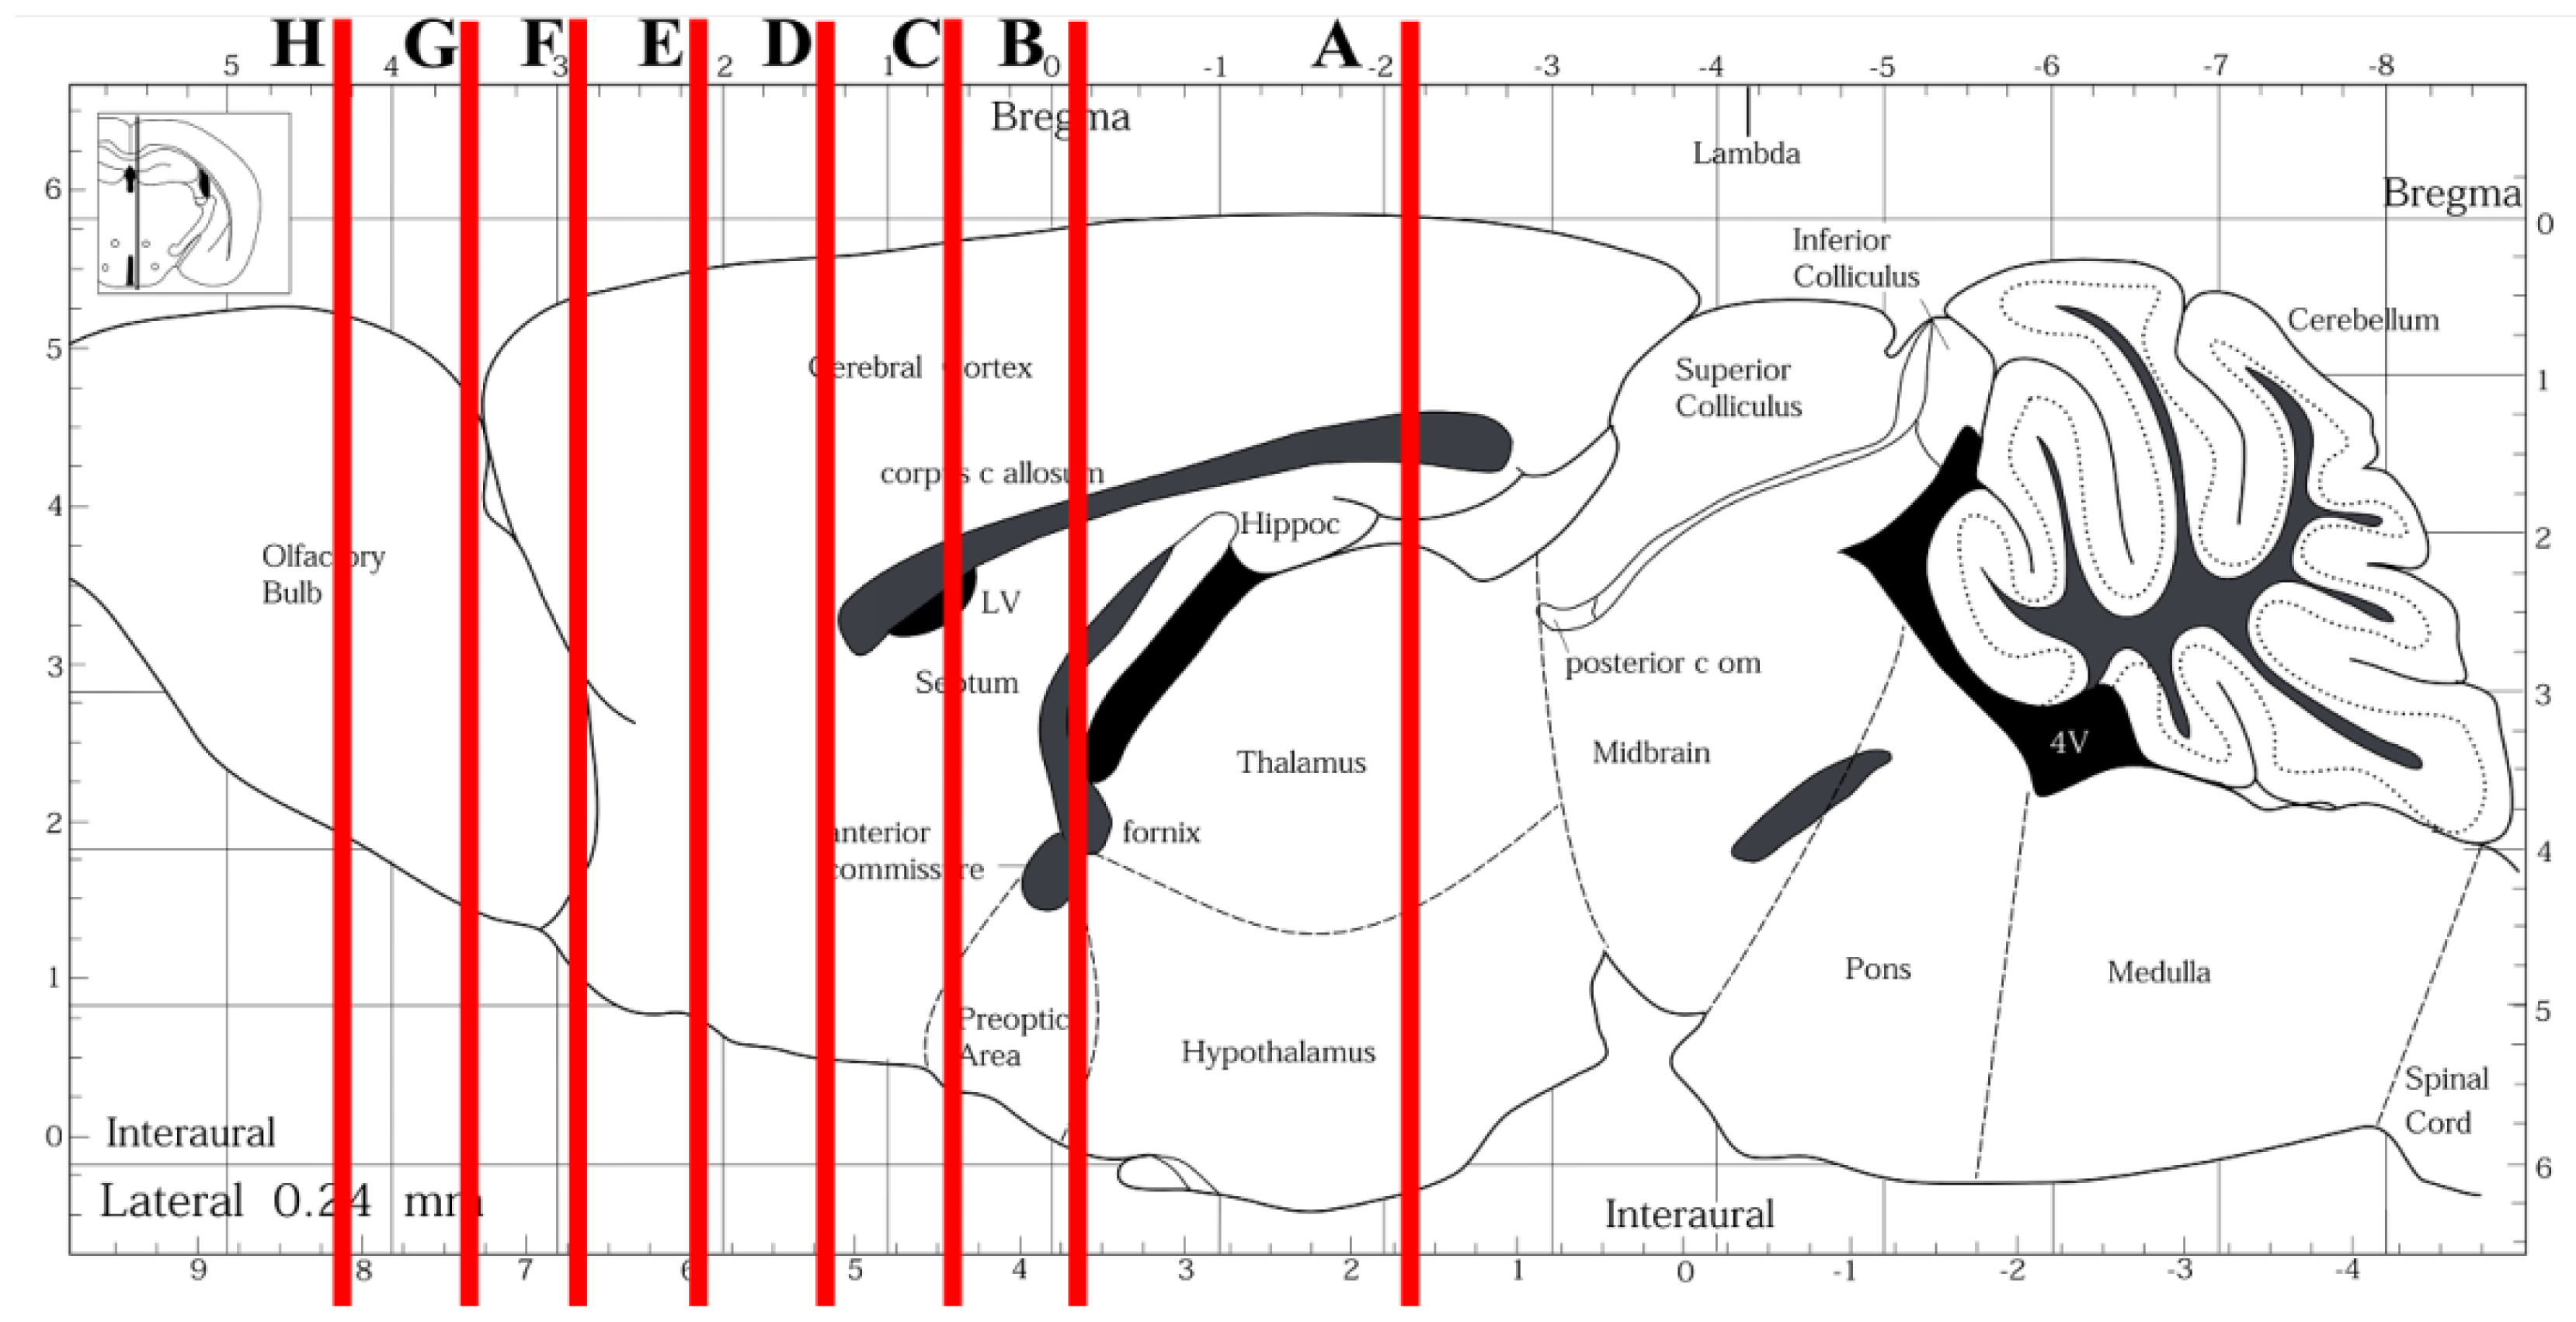
3.1. Animals
3.2. Immunocytochemistry
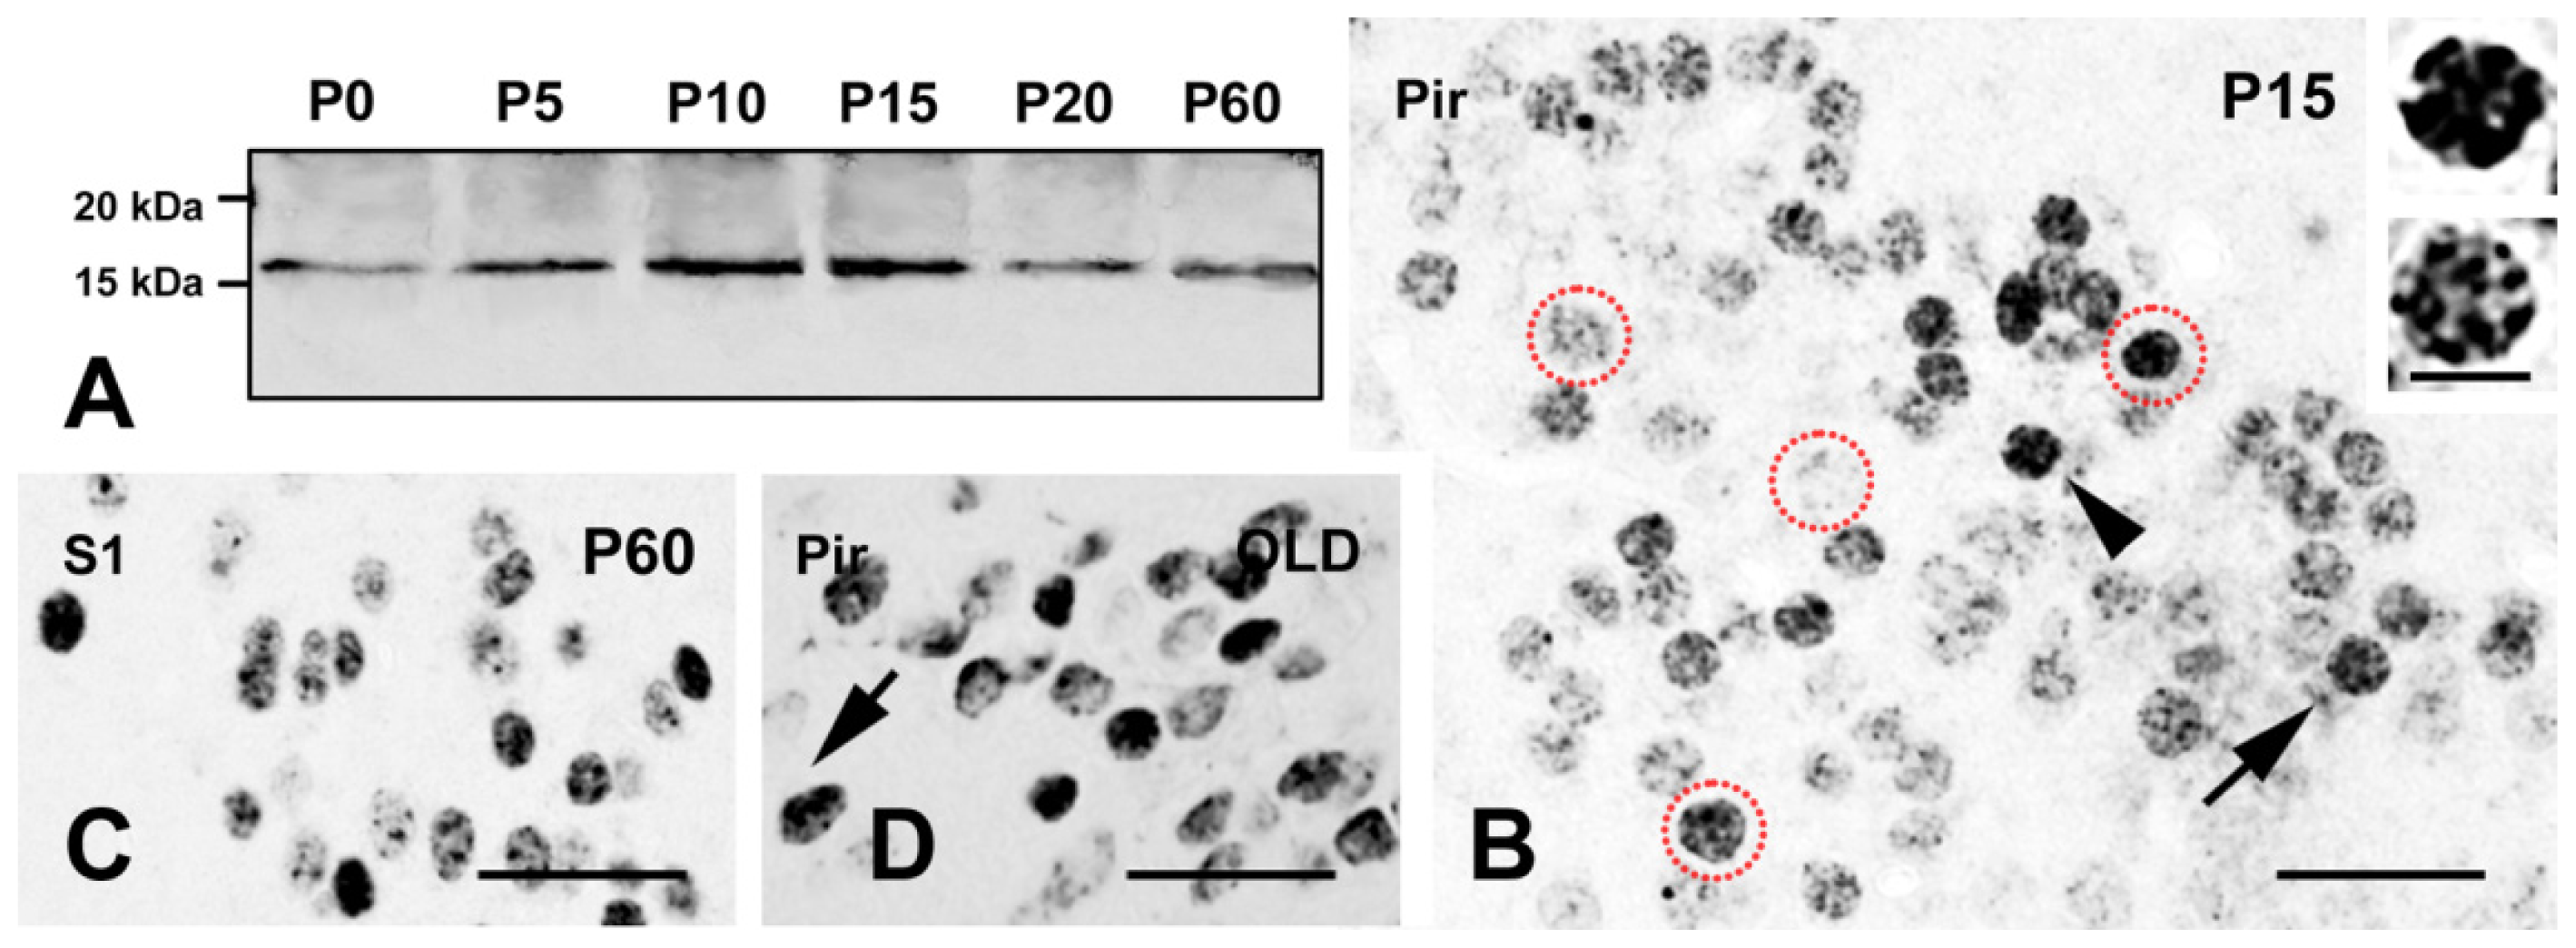
3.3. Western Blotting
3.4. Primary Antibodies
3.5. Quantitative Studies on γH2AX + BrdU Colocalization in Senescent Mice and Statistics
4. Conclusions
Acknowledgments
Conflicts of Interest
- Author ContributionsSerena Barral performed light microscopy immunocytochemical experiments, γH2AX distribution studies and western blots. Riccardo Beltramo performed quantitative studies of γH2AX+BrdU colocalization in senescent mice. Chiara Salio performed TEM studies in cerebellum. Patrizia Aimar performed TEM studies in SVZ. Laura Lossi and Adalberto Merighi conceived and designed the experiments, supervised the project, interpreted the data, and wrote the manuscript.
References
- Rogakou, E.P.; Pilch, D.R.; Orr, A.H.; Ivanova, V.S.; Bonner, W.M. DNA double-stranded breaks induce histone H2AX phosphorylation on serine 139. J. Biol. Chem 1998, 273, 5858–5868. [Google Scholar]
- Rogakou, E.P.; Boon, C.; Redon, C.; Bonner, W.M. Megabase chromatin domains involved in DNA double-strand breaks in vivo. J. Cell. Biol. 1999, 146, 905–916. [Google Scholar]
- Rothkamm, K.; Löbrich, M. Evidence for a lack of DNA double-strand break repair in human cells exposed to very low X-ray doses. Proc. Natl. Acad. Sci. USA 2003, 100, 5057–5062. [Google Scholar]
- Sedelnikova, O.A.; Rogakou, E.P.; Panyutin, I.G.; Bonner, W.M. Quantitative detection of 125 IdU-induced DNA double-strand breaks with γ-H2AX antibody. Radiat. Res 2002, 158, 486–492. [Google Scholar]
- Sedelnikova, O.A.; Horikawa, I.; Zimonjic, D.B.; Popescu, N.C.; Bonner, W.M.; Barrett, J.C. Senescing human cells and ageing mice accumulate DNA lesions with unrepairable double-strand breaks. Nat. Cell Biol 2004, 6, 168–170. [Google Scholar]
- Hesse, J.E.; Faulkner, M.F.; Durdik, J.M. Increase in double-stranded DNA break-related foci in early-stage thymocytes of aged mice. Exp. Gerontol 2009, 44, 676–684. [Google Scholar]
- Wang, C.; Jurk, D.; Maddick, M.; Nelson, G.; Martin-Ruiz, C.; von Zglinicki, T. DNA damage response and cellular senescence in tissues of aging mice. Aging Cell 2009, 8, 311–323. [Google Scholar]
- Sedelnikova, O.A.; Horikawa, I.; Redon, C.; Nakamura, A.; Zimonjic, D.B.; Popescu, N.C.; Bonner, W.M. Delayed kinetics of DNA double-strand break processing in normal and pathological aging. Aging Cell 2008, 7, 89–100. [Google Scholar]
- Villaret, A.; Galitzky, J.; Decaunes, P.; Estève, D.; Marques, M.A.; Sengenès, C.; Chiotasso, P.; Tchkonia, T.; Lafontan, M.; Kirkland, J.L.; et al. Adipose tissue endothelial cells from obese human subjects: Differences among depots in angiogenic, metabolic, and inflammatory gene expression and cellular senescence. Diabetes 2010, 592, 755–763. [Google Scholar]
- Bonner, W.M.; Redon, C.E.; Dickey, J.S.; Nakamura, A.J.; Sedelnikova, O.A.; Solier, S.; Pommier, Y. γ-H2AX and cancer. Nat. Rev. Cancer 2008, 8, 957–967. [Google Scholar]
- Dickey, J.S.; Redon, C.E.; Nakamura, A.J.; Baird, B.J.; Sedelnikova, O.A.; Bonner, W.M. H2AX: Functional roles and potential applications. Chromosoma 2009, 118, 683–692. [Google Scholar]
- Ichijima, Y.; Sakasai, R.; Okita, N.; Asahina, K.; Mizutani, S.; Teraoka, H. Phosphorylation of histone H2AX at M phase in human cells without DNA damage response. Biochem. Biophys. Res. Commun 2005, 336, 807–812. [Google Scholar]
- Löbrich, M.; Shibata, A.; Beucher, A.; Fisher, A.; Ensminger, M.; Goodarzi, A.A.; Barton, O.; Jeggo, P.A. γ-H2AX foci analysis for monitoring DNA double-strand break repair: Strengths, limitations and optimization. Cell Cycle 2010, 9, 662–669. [Google Scholar]
- Costes, S.V.; Chiolo, I.; Pluth, J.M.; Barcellos-Hoff, M.H.; Jakob, B. Spatiotemporal characterization of ionizing radiation induced DNA damage foci and their relation to chromatin organization. Mutat. Res 2010, 704, 78–87. [Google Scholar]
- Spalding, K.L.; Bergmann, O.; Alkass, K.; Bernard, S.; Salehpour, M.; Huttner, H.B.; Boström, E.; Westerlund, I.; Vial, C.; Buchholz, B.A.; et al. Dynamics of hippocampal neurogenesis in adult humans. Cell 2013, 153, 1219–1227. [Google Scholar]
- Brasnjevic, I.; Hof, P.R.; Steinbusch, H.W.; Schmitz, C. Accumulation of nuclear DNA damage or neuron loss: Molecular basis for a new approach to understanding selective neuronal vulnerability in neurodegenerative diseases. DNA Repair 2008, 7, 1087–1097. [Google Scholar]
- Ward, I.; Chen, J. Early events in the DNA damage response. Curr. Top. Dev. Biol 2004, 63, 1–35. [Google Scholar]
- Nowak, E.; Etienne, O.; Millet, P.; Lages, C.S.; Mathieu, C.; Mouthon, M.A.; Boussin, F.D. Radiation-induced H2AX phosphorylation and neural precursor apoptosis in the developing brain of mice. Radiat. Res 2006, 165, 155–164. [Google Scholar]
- Crowe, S.L.; Movsesyan, V.A.; Jorgensen, T.J.; Kondratyev, A. Rapid phosphorylation of histone H2A.X following ionotropic glutamate receptor activation. Eur. J. Neurosci 2006, 23, 2351–2361. [Google Scholar]
- Crowe, S.L.; Tsukerman, S.; Gale, K.; Jorgensen, T.J.; Kondratyev, A.D. Phosphorylation of histone H2A.X as an early marker of neuronal endangerment following seizures in the adult rat brain. J. Neurosci 2011, 31, 7648–7656. [Google Scholar]
- Myung, N.H.; Zhu, X.; Kruman, I.I.; Castellani, R.J.; Petersen, R.B.; Siedlak, S.L.; Perry, G.; Smith, M.A.; Lee, H.G. Evidence of DNA damage in Alzheimer disease: Phosphorylation of histone H2AX in astrocytes. Age 2008, 30, 209–215. [Google Scholar]
- Jeon, G.S.; Kim, K.Y.; Hwang, Y.J.; Jung, M.K.; An, S.; Ouchi, M.; Ouchi, T.; Kowall, N.; Lee, J.; Ryu, H. Deregulation of BRCA1 leads to impaired spatiotemporal dynamics of γ-H2AX and DNA damage responses in Huntington’s disease. Mol. Neurobiol 2012, 45, 550–563. [Google Scholar]
- Paxinos, G.; Franklin, K.B.J. The Mouse Brain in Stereotaxic Coordinates, 2nd Ed ed; Elsevier Academic Press: San Diego, CA, USA, 2004. [Google Scholar]
- Sedelnikova, O.A.; Pilch, D.R.; Redon, C.; Bonner, W.M. Histone H2AX in DNA damage and repair. Cancer Biol. Ther 2003, 2, 233–235. [Google Scholar]
- Jin, K.; Sun, Y.; Xie, L.; Batteur, S.; Mao, X.O.; Smelick, C.; Logvinova, A.; Greenberg, D.A. Neurogenesis and aging: FGF-2 and HB-EGF restore neurogenesis in hippocampus and subventricular zone of aged mice. Aging Cell 2003, 2, 175–183. [Google Scholar]
- Maslov, A.Y.; Barone, T.A.; Plunkett, R.J.; Pruitt, S.C. Neural stem cell detection, characterization, and age-related changes in the subventricular zone of mice. J. Neurosci 2004, 24, 1726–1733. [Google Scholar]
- Luo, J.; Daniels, S.B.; Lennington, J.B.; Notti, R.Q.; Conover, J.C. The aging neurogenic subventricular zone. Aging Cell 2006, 5, 139–152. [Google Scholar]
- Lossi, L.; Mioletti, S.; Merighi, A. Synapse-independent and synapse-dependent apoptosis of cerebellar granule cells in postnatal rabbits occur at two subsequent but partly overlapping developmental stages. Neuroscience 2002, 112, 509–523. [Google Scholar]
- Suberbielle, E.; Sanchez, P.E.; Kravitz, A.V.; Wang, X.; Ho, K.; Eilertson, K.; Devidze, N.; Kreitzer, A.C.; Mucke, L. Physiologic brain activity causes DNA double-strand breaks in neurons, with exacerbation by amyloid-β. Nat. Neurosci 2013, 16, 613–621. [Google Scholar]
- Murray, D.; Meyn, R.E. Differential repair of gamma-ray-induced DNA strand breaks by various cellular subpopulations of mouse jejunal epithelium and bone marrow in vivo. Radiat. Res. 1987, 109, 153–164. [Google Scholar]
- Tabocchini, M.A.; Rothkamm, K.; Signoretti, C.; Risse, J.; Sapora, O.; Lobrich, M. Formation and repair of DNA double-strand breaks in gamma-irradiated K562 cells undergoing erythroid differentiation. Mutat. Res 2000, 461, 71–82. [Google Scholar]
- Van Hooser, A.; Goodrich, D.W.; Allis, C.D.; Brinkley, B.R.; Mancini, M.A. Histone H3 phosphorylation is required for the initiation; but not maintenance; of mammalian chromosome condensation. J. Cell Sci 1998, 111, 3497–3506. [Google Scholar]
- Andang, M.; Hjerling-Leffler, J.; Moliner, A.; Lundgren, T.K.; Castelo-Branco, G.; Nanou, E.; Pozas, E.; Bryja, V.; Halliez, S.; Nishimaru, H.; et al. Histone H2AX-dependent GABAA, receptor regulation of stem cell proliferation. Nature 2008, 451, 460–464. [Google Scholar]
- Fernando, R.N.; Eleuteri, B.; Abdelhady, S.; Nussenzweig, A.; Andang, M.; Ernfors, P. Cell cycle restriction by histone H2AX limits proliferation of adult neural stem cells. Proc. Natl. Acad. Sci. USA 2011, 108, 5837–5842. [Google Scholar]
- Rogakou, E.P.; Nieves-Neira, W.; Boon, C.; Pommier, Y.; Bonner, W.M. Initiation of DNA fragmentation during apoptosis induces phosphorylation of H2AX histone at serine 139. J. Biol. Chem 2000, 275, 9390–9395. [Google Scholar]
- Lu, C.; Zhu, F.; Cho, Y.Y.; Tang, F.; Zykova, T.; Ma, W.Y.; Bode, A.M.; Dong, Z. Cell apoptosis: Requirement of H2AX in DNA ladder formation, but not for the activation of caspase-3. Mol. Cell 2006, 23, 121–132. [Google Scholar]
- Sluss, H.K.; Davis, R.J. H2AX is a target of the JNK signaling pathway that is required for apoptotic DNA fragmentation. Mol. Cell 2006, 23, 152–153. [Google Scholar]
- Wang, W.; Bu, B.; Xie, M.; Zhang, M.; Yu, Z.; Tao, D. Neural cell cycle dysregulation and central nervous system diseases. Prog. Neurobiol 2009, 89, 1–17. [Google Scholar]
- Pospelova, T.V.; Demidenko, Z.N.; Bukereva, E.I.; Pospelov, V.A.; Guskov, A.V.; Blagosklonny, M.V. Pseudo-DNA damage response in senescent cells. Cell Cycle 2009, 8, 4112–4118. [Google Scholar]
- Keogh, M.C.; Kim, J.A.; Downey, M.; Fillingham, J.; Chowdhury, D.; Harrison, J.C.; Onishi, M.; Datta, N.; Galicia, S.; Emili, A.; et al. A phosphatase complex that dephosphorylates γ-H2AX regulates DNA damage checkpoint recovery. Nature 2006, 439, 497–501. [Google Scholar]
- Riches, L.C.; Lynch, A.M.; Gooderham, N.J. Early events in the mammalian response to DNA double-strand breaks. Mutagenesis 2008, 23, 331–339. [Google Scholar]
- Brooks, P.J. DNA repair in neural cells: Basic science and clinical implications. Mutat. Res 2002, 509, 93–108. [Google Scholar]
- Kruman, I.I. Why do neurons enter the cell cycle? Cell Cycle 2004, 3, 769–773. [Google Scholar]
- Fishel, M.L.; Vasko, M.R.; Kelley, M.R. DNA repair in neurons: So if they don’t divide what’s to repair? Mutat. Res 2007, 614, 24–36. [Google Scholar]
- Nawrocki, A.R.; Scherer, P.E. Keynote review: The adipocyte as a drug discovery target. Drug Discov. Today 2005, 10, 1219–1230. [Google Scholar]
- Meulle, A.; Salles, B.; Daviaud, D.; Valet, P.; Muller, C. Positive regulation of DNA double strand break repair activity during differentiation of long life span cells: The example of adipogenesis. PLoS One 2008, 3, e3345. [Google Scholar]
- Latella, L.; Lukas, J.; Simone, C.; Puri, P.L.; Bartek, J. Differentiation-induced radioresistance in muscle cells. Mol. Cell. Biol 2004, 24, 6350–6361. [Google Scholar]
- Narciso, L.; Fortini, P.; Pajalunga, D.; Franchitto, A.; Liu, P.; Degan, P.; Frechet, M.; Demple, B.; Crescenzi, M.; Dogliotti, E. Terminally differentiated muscle cells are defective in base excision DNA repair and hypersensitive to oxygen injury. Proc. Natl. Acad. Sci. USA 2007, 104, 17010–17015. [Google Scholar]
- Sargeant, T.J.; Day, D.J.; Miller, J.H.; Steel, R.W. Acute in utero morphine exposure slows G2/M phase transition in radial glial and basal progenitor cells in the dorsal telencephalon of the E15.5 embryonic mouse. Eur. J. Neurosci 2008, 28, 1060–1067. [Google Scholar]
- Morin, X.; Jaouen, F.; Durbec, P. Control of planar divisions by the G-protein regulator LGN maintains progenitors in the chick neuroepithelium. Nat. Neurosci 2007, 10, 1440–1448. [Google Scholar]
- Gratzner, H.G. Monoclonal antibody to 5-bromo- and 5-iododeoxyuridine: A new reagent for detection of DNA replication. Science 1982, 218, 474–475. [Google Scholar]
- Wang, T.W.; Zhang, H.; Parent, J.M. Retinoic acid regulates postnatal neurogenesis in the murine subventricular zone-olfactory bulb pathway. Development 2005, 132, 2721–2732. [Google Scholar]
- Zhao, B.Q.; Wang, S.; Kim, H.Y.; Storrie, H.; Rosen, B.R.; Mooney, D.J.; Wang, X.; Lo, E.H. Role of matrix metalloproteinases in delayed cortical responses after stroke. Nat. Med 2006, 12, 441–445. [Google Scholar]
- Supnet, C.; Grant, J.; Kong, H.; Westaway, D.; Mayne, M. Amyloid-β-1–42 increases ryanodine receptor-3 expression and function in neurons of TgCRND8 mice. J. Biol. Chem 2006, 281, 38440–38447. [Google Scholar]
- Rass, U.; Ahel, I.; West, S.C. Defective DNA repair and neurodegenerative disease. Cell 2007, 130, 991–1004. [Google Scholar]


| Distribution of γH2AX-IR nuclei in mouse brain | ||||||||
|---|---|---|---|---|---|---|---|---|
| Age | E 14.5 | P0 | P5 | P10 | P15 | P20 | P60 | Old |
| Forebrain | ||||||||
| Cerebral cortex | − | − | − | − | + | ++ | +++ | +++ |
| SVZ/RMS/OB | +++ | + | + | +++ | ++ | ++ | ++ | ++ |
| Amygdala | − | − | − | − | + | + | ++ | − |
| Hypothalamus | − | − | − | − | − | + | ++ | − |
| Dorsal endopiriform nucleus | − | − | − | + | − | + | + | − |
| Hippocampus | − | − | − | + | + | + | + | − |
| Midbrain | − | − | − | − | + | + | + | − |
| Hindbrain | ||||||||
| Cerebellum | − | + | +++ | +++ | + | − | − | − |
| Pons | − | − | − | − | + | + | + | + |
| Quantification of γH2AX + pHH3 IR nuclei in mouse SVZ/RMS/OB and cerebellum | ||||||
|---|---|---|---|---|---|---|
| Age | % of IR nuclei | |||||
| SVZ/MS/OB | Cerebellum | |||||
| γH2AX only | pHH3 only | Colocalization | γH2AX only | pHH3 only | Colocalization | |
| E 14.5 | 29.4 | 0 | 70.6 | |||
| P0 | 22.8 | 0.8 | 76.4 | 18.8 | 1 | 80.2 |
| P5 | 33.8 | 0 | 66.2 | 21.1 | 0.3 | 78.6 |
| P10 | 22.2 | 1.2 | 76.6 | 8.4 | 1.6 | 90.0 |
| P15 | 25.5 | 0 | 74.5 | |||
| P20 | 26.6 | 0 | 73.4 | |||
| P60 | 27.3 | 0 | 72.7 | |||
| Primary antibodies | ||||||
|---|---|---|---|---|---|---|
| Antibodies | Target/epitope | Type | Dilution | Use | Supplier | Refs |
| γH2AX (Ser139) | aa 134–142 of human H2AX (C-KATQA[pS]QEY) | Mono, M | 1:200 | ICC LM | Upstate Biotechnology, Lake Placid, NY, USA | NA |
| γH2AX (Ser139) | aa 134–142 of human H2AX (C-KATQA[pS]QEY) | Poly, R | 1:500 | ICC LM WB | Millipore, Billerica, MA, USA | NA |
| γH2AX (Ser139) | Residues surrounding Ser139 of human H2AX | Poly, R | 1:25 | ICC EM | Cell Signaling Technology, Danvers, MA, USA | NA |
| pHH3 | aa 1–100 of human HH3, phosphorylated at Ser10 | Poly, R | 1:2000 | ICC LM | Abcam, Cambridge, UK | [49] |
| pHH3 | aa 7–20 of human HH3 (ARKpSTGGKAPRKQLC) | Poly, R | 1:1000 | ICC LM | Upstate Biotechnology, Lake Placid, NY, USA | [50] |
| BrdU | Exogenously administered BrdU | Mono, M | 1:5 | ICC LM | GE Healthcare, Chalfont St. Giles, UK | [51] |
| BrdU | Exogenously administered BrdU | Mono, Rat | 1:10 | ICC EM | AbD Serotec, Oxford, UK | [52] |
| NeuN | Purified neuronal nuclei from mouse brain | Mono, M | 1:100 | ICC LM | Millipore (Chemicon), Billerica, MA, USA | [53] |
| GFAP | GFAP purified from bovine spinal cord after Triton X-100 extraction | Poly, R | 1:2000 | ICC LM | Abcam, Cambridge, UK | [54] |
© 2014 by the authors; licensee MDPI, Basel, Switzerland This article is an open access article distributed under the terms and conditions of the Creative Commons Attribution license (http://creativecommons.org/licenses/by/3.0/).
Share and Cite
Barral, S.; Beltramo, R.; Salio, C.; Aimar, P.; Lossi, L.; Merighi, A. Phosphorylation of Histone H2AX in the Mouse Brain from Development to Senescence. Int. J. Mol. Sci. 2014, 15, 1554-1573. https://doi.org/10.3390/ijms15011554
Barral S, Beltramo R, Salio C, Aimar P, Lossi L, Merighi A. Phosphorylation of Histone H2AX in the Mouse Brain from Development to Senescence. International Journal of Molecular Sciences. 2014; 15(1):1554-1573. https://doi.org/10.3390/ijms15011554
Chicago/Turabian StyleBarral, Serena, Riccardo Beltramo, Chiara Salio, Patrizia Aimar, Laura Lossi, and Adalberto Merighi. 2014. "Phosphorylation of Histone H2AX in the Mouse Brain from Development to Senescence" International Journal of Molecular Sciences 15, no. 1: 1554-1573. https://doi.org/10.3390/ijms15011554