Article

Phenological, Nutritional and Molecular Diversity Assessment among 35 Introduced Lentil (Lens culinaris Medik.) Genotypes Grown in Saudi Arabia

Legume Research Group, Plant production Department, Faculty of Food and Agricultural Sciences, King Saud University, P.O. Box 2460, Riyadh 11451, Saudi Arabia
*
Author to whom correspondence should be addressed.
Int. J. Mol. Sci. 2014, 15(1), 277-295; https://doi.org/10.3390/ijms15010277
Submission received: 17 September 2013 / Revised: 27 November 2013 / Accepted: 16 December 2013 / Published: 27 December 2013
(This article belongs to the Section Biochemistry)

Abstract

:
Morphological, nutritional and molecular analyses were carried out to assess genetic diversity among 35 introduced lentil genotypes (Lens culinaris Medik.). The genotypes exhibited significant differences for their field parameters and some of them showed noticeable superiority. The nutritional and proximate analysis showed that some genotypes were excellent sources of proteins, essential amino acids, minerals, anti-oxidants, total phenolic contents (TPC) and total flavonoid contents (TFC) and hence, highlights lentil nutritional and medicinal potential. Sequence-related amplified polymorphism (SRAP) and amplified fragments length polymorphism (AFLP) markers were used to estimate the genetic variability at the molecular level. The existence of a considerable amount of genetic diversity among the tested lentil genotypes was also proven at the molecular level. A total of 2894 polymorphic SRAP and 1625 AFLP loci were successfully amplified using six SRAP and four AFLP primer pair combinations. Polymorphism information content (PIC) values for SRAP and AFLP markers were higher than 0.8, indicating the power and higher resolution of those marker systems in detecting molecular diversity. UPGMA (unweighted pair group method with arithmetic average) cluster analysis based on molecular data revealed large number of sub clusters among genotypes, indicating high diversity levels. The data presented here showed that FLIP2009-64L and FLIP2009-69L could be used as a significant source of yield, total protein, essential amino acids, and antioxidant properties. The results suggest potential lentil cultivation in the central region of Saudi Arabia for its nutritional and medicinal properties, as well as sustainable soil fertility crop.

1. Introduction

Lentil (Lens culinaris Medik.) is an annual self-pollinated diploid (2× = 2n = 14 chromosomes) species belonging to Legumnosae (Fabaceae) family. It has a relatively large haloid genome size of 4063 Mbp [1]. It is extensively grown in South Asia, Middle East, North Africa, North America and Australia. Lentil world production increased from 3.78 million tonnes (Mt) in 2007 to reach 4.4 million tons in 2011, reflecting its nutritional significance [2]. Lentil seeds contain high protein content, and considered the third-highest level of protein of any legume or nut, after soybeans and hemp. Seed protein content ranges from 22% to 34.6% [3,4]. It also has high levels of carbohydrates (55%–59%) [5,6] and elevated levels of micronutrients and vitamins [7,8]. Besides, the ease of cooking and decortication compared to most other grain legumes may account for increasing global per capita of lentil consumption over the past 50 years, and makes lentil an ideal candidate crop to improve human nutrition through food consumption on a global scale [8,9]. Moreover, owing to its nutritional and medicinal values, low levels of anti-nutrients and an ability to grow in limited water conditions, lentils are potential candidate for conservation agriculture, particularly in Mediterranean arid environments.
Assessing crop genetic variation is vital to understanding the available genetic variability and potential use for varietal improvement [10]. Lentil varieties showed considerable variation for different agro-morphological traits across various environments [1119]. Morphological variations were used to classify the world collection of lentil germplasm [20].
Advances in molecular biology have led to the development of DNA based markers that can be used for genotype identification, fingerprinting, genetic mapping and diversity assessment [17,21,22]. Several types of DNA markers have been used in lentil genetic diversity assessment and genotyping including: random amplified polymorphic DNA (RAPD) analysis [2327], inter simple sequence repeat (ISSR) [2831], simple sequence repeat (SSR) markers [17,3235], amplified fragment length polymorphism (AFLP) analysis [25,30], restriction fragment length polymorphism (RFLP) [36] and chloroplast DNA [37]. Sequence related amplified polymorphism (SRAP) is a simple and efficient molecular marker technique, with reasonable throughput rate, more reproducible than RAPDs and easier to assay than AFLPs. It can disclose numerous co-dominant markers and, most importantly, SRAP target open reading frames (ORFs) [38]. Amplified fragment length polymorphism (AFLP) markers known as a high potential fingerprinting tool due to its high level of polymorphisms, no prior sequence information is necessary and many markers can be analyzed in a short time. In addition, it is a robust and reliable method because of the stringent reaction conditions for primer annealing [39].
Promoting lentil cultivation in Saudi Arabia will enhance soil fertility and prevent soil desertification by means of areal N2 fixation and enrichment of soil organic matter. The present study was undertaken to highlight the potential of lentil cultivation under Saudi Central Region as a promising legume crop. The study also focused on estimating genetic diversity at phenological, chemical and molecular levels.

2. Results and Discussion

2.1. Phenological Performance

Descriptive values (mean, minimum, maximum, standard deviation and coefficients of variation) of combined data of November 2010 and December 2011 seasons for lentil genotypes are presented in Table 1. Mean performance for lentil genotypes exhibited significant variations for all studied parameters (Tables S1 and S2). Early maturing genotypes were ILL 3375 with 121.8 days and FLIP 2011-57L with 128.8 days. The genotype FLIP 2009-64L recorded the highest number of seeds per plant (42.6) and FLIP 2010-105L produced the highest seeds yield per plant (1.7 g) compared to the other genotypes. Analysis of variance for vegetative and reproductive traits is presented in Table 2. The results showed high and significant genotypic variance in first, second seasons and their combined data for all studied traits. The first four components in the principal component analysis account for 89.28% of the total variations (Table 3). The first and second principle components demonstrated 33.89% and 24.09% of the total variation respectively. The number of days to 50% flowering, the number of days to 95% maturity, the number of seeds/plant and seed yield/plant explained the maximum variance. The third and fourth component exhibited 16.6% and 14.67% of the total variation where plant height and number of branches/plant traits explained the variation.

2.2. Proximate Composition

Descriptive values of lentil genotypes for proximate composition, minerals contents, essentials amino acids, antioxidants and anti-nutritional factors are presented in Table 4. Coefficient of variation varied from 3.49% (moisture content) to 12.11% (ash content). The protein content varied considerably and ranged from 25.3% to 29%. Moisture content in lentil samples ranged from 11.6% to 13.6%. Fat content ranged from 0.79% to 1.19%. Ash content was found to be in the range of 2.39%–2.89% and carbohydrate ranged from 39.5% to 47.0%.
The mineral composition of 35 lentil genotypes showed that potassium and phosphorous content had significant variations among genotypes and ranged from 674.4 to 1061.2 mg/100 g and 286.9 to 546.7 mg/100 g, respectively. Variations in other minerals were also pronounced; magnesium ranged from 126.1 to 157.3 mg/100 g, calcium (64.9 to 84 mg/100 g), iron (6.57 to 8.57 mg/100 g), zinc (2.63 to 4.51 mg/100 g), manganese (1.26 to 2.85 mg/100 g) and copper ranged from 0.86 to 1.37 mg/100 g (Table S3).
Amino acid profiles for the tested lentil genotypes showed also that the essential amino acid Arginine was the most abundant amino acid in most of the lentil genotypes and ranged from 6.6 to 10 g/kg. This was followed by leucine, valine, lysine, phenylalanine, threonine, histidine, and isoleucine which ranged from 6.8 to 9.8, 5.3 to 9.0, 4.5 to 8.6, 5.1 to 8.2, 4.1 to 7.9, 3.6 to 6.1 and 3.4 to 5.6 g/kg, respectively. Tryptophan and methionine were found to be the limiting amino acids in lentil genotypes and ranged from 0.61 to 0.92, and 0.96 to 2.1 g/kg, respectively. Among non-essential amino acids, Glutamic acid was abundant and ranged from 9.1 to 11.9 g/kg. Aspartic acid was the second most abundant amino acids and ranged from 8.2 to 10.9. Other non-essential amino acids, i.e., alanine, glycine, proline, serine and tyrosine, were present in moderate amounts and cysteine was the lowest one and ranged from 0.38 to 0.67 g/kg (Tables S4 and S5).

2.3. Anti-Nutritional Factors in Lentil Genotypes

Trypsin inhibitor activity was found to vary from 2.08 in genotype FLIP 2011-43L to 2.78 in genotype FLIP 2011-55L. Genotypes ILL 10974, ILL 10975, FLIP 2011-56L, FLIP 2010-100L, FLIP 2010-99L, FLIP 2009-68L and FLIP 2009-70L showed much higher trypsin inhibitor units (TIU) than any other varieties (Table S6). Tannins content ranged from 0.59 to 0.79 for genotypes FLIP 2010-106L and ILL 10975, respectively; with an average value 0.68. Phytic acid gave an average of 0.72–1.09 with an average value of 0.92 mg/g. Genotypes FLIP 2009-70L, FLIP 2010-94L, FLIP 2009-54L and FLIP 2010-97L16 exhibited higher phytic acid values of 1.06, 1.03, 1.01 and 0.96 whereas FLIP 2009-55L, FLIP 2009-51L, ILL 3375, FLIP 2009-68L and FLIP 2010-100L showed low phytic acid values of 0.72, 0.80, 0.81, 0.81 and 0.82, respectively.

2.4. Antioxidant in Lentil Genotypes

The amount of phenolic phytochemicals and antioxidant activity of the 35 selected lentil genotypes showed that the total phenolic components (TPC) ranged from 5.7 to 20.8 mg GAE (galic acid equivalent)/g. Lentil genotypes FLIP 2010-96L (20.82 mg GAE/g), ILL 10974 (20.52 mg GAE/g), and FLIP 2010-95L (20.01 mg GAE/g) had higher phenolic content. On the other hand, ILL 10975 recorded the lowest value of 6.45 mg GAE/g. Flavonoid content for lentil seeds are tabulated (Table S7). Lentil genotype ILL3375 recorded lowest flavonoid content [4.12 mg QE (Quercetin Equivalent)/g dry seed] and ILL10974 recorded highest value (8.92 mg QE/g seed). Antioxidant activity measured as the effect of phenolic compounds on the Table S8, 2-diphenyl-1-picryl hydrazyl radical (DPPH) activity ranged from 10.61 to 23.26 μg/g for FLIP 2011-54L and ILL 10974, respectively (Table S6).

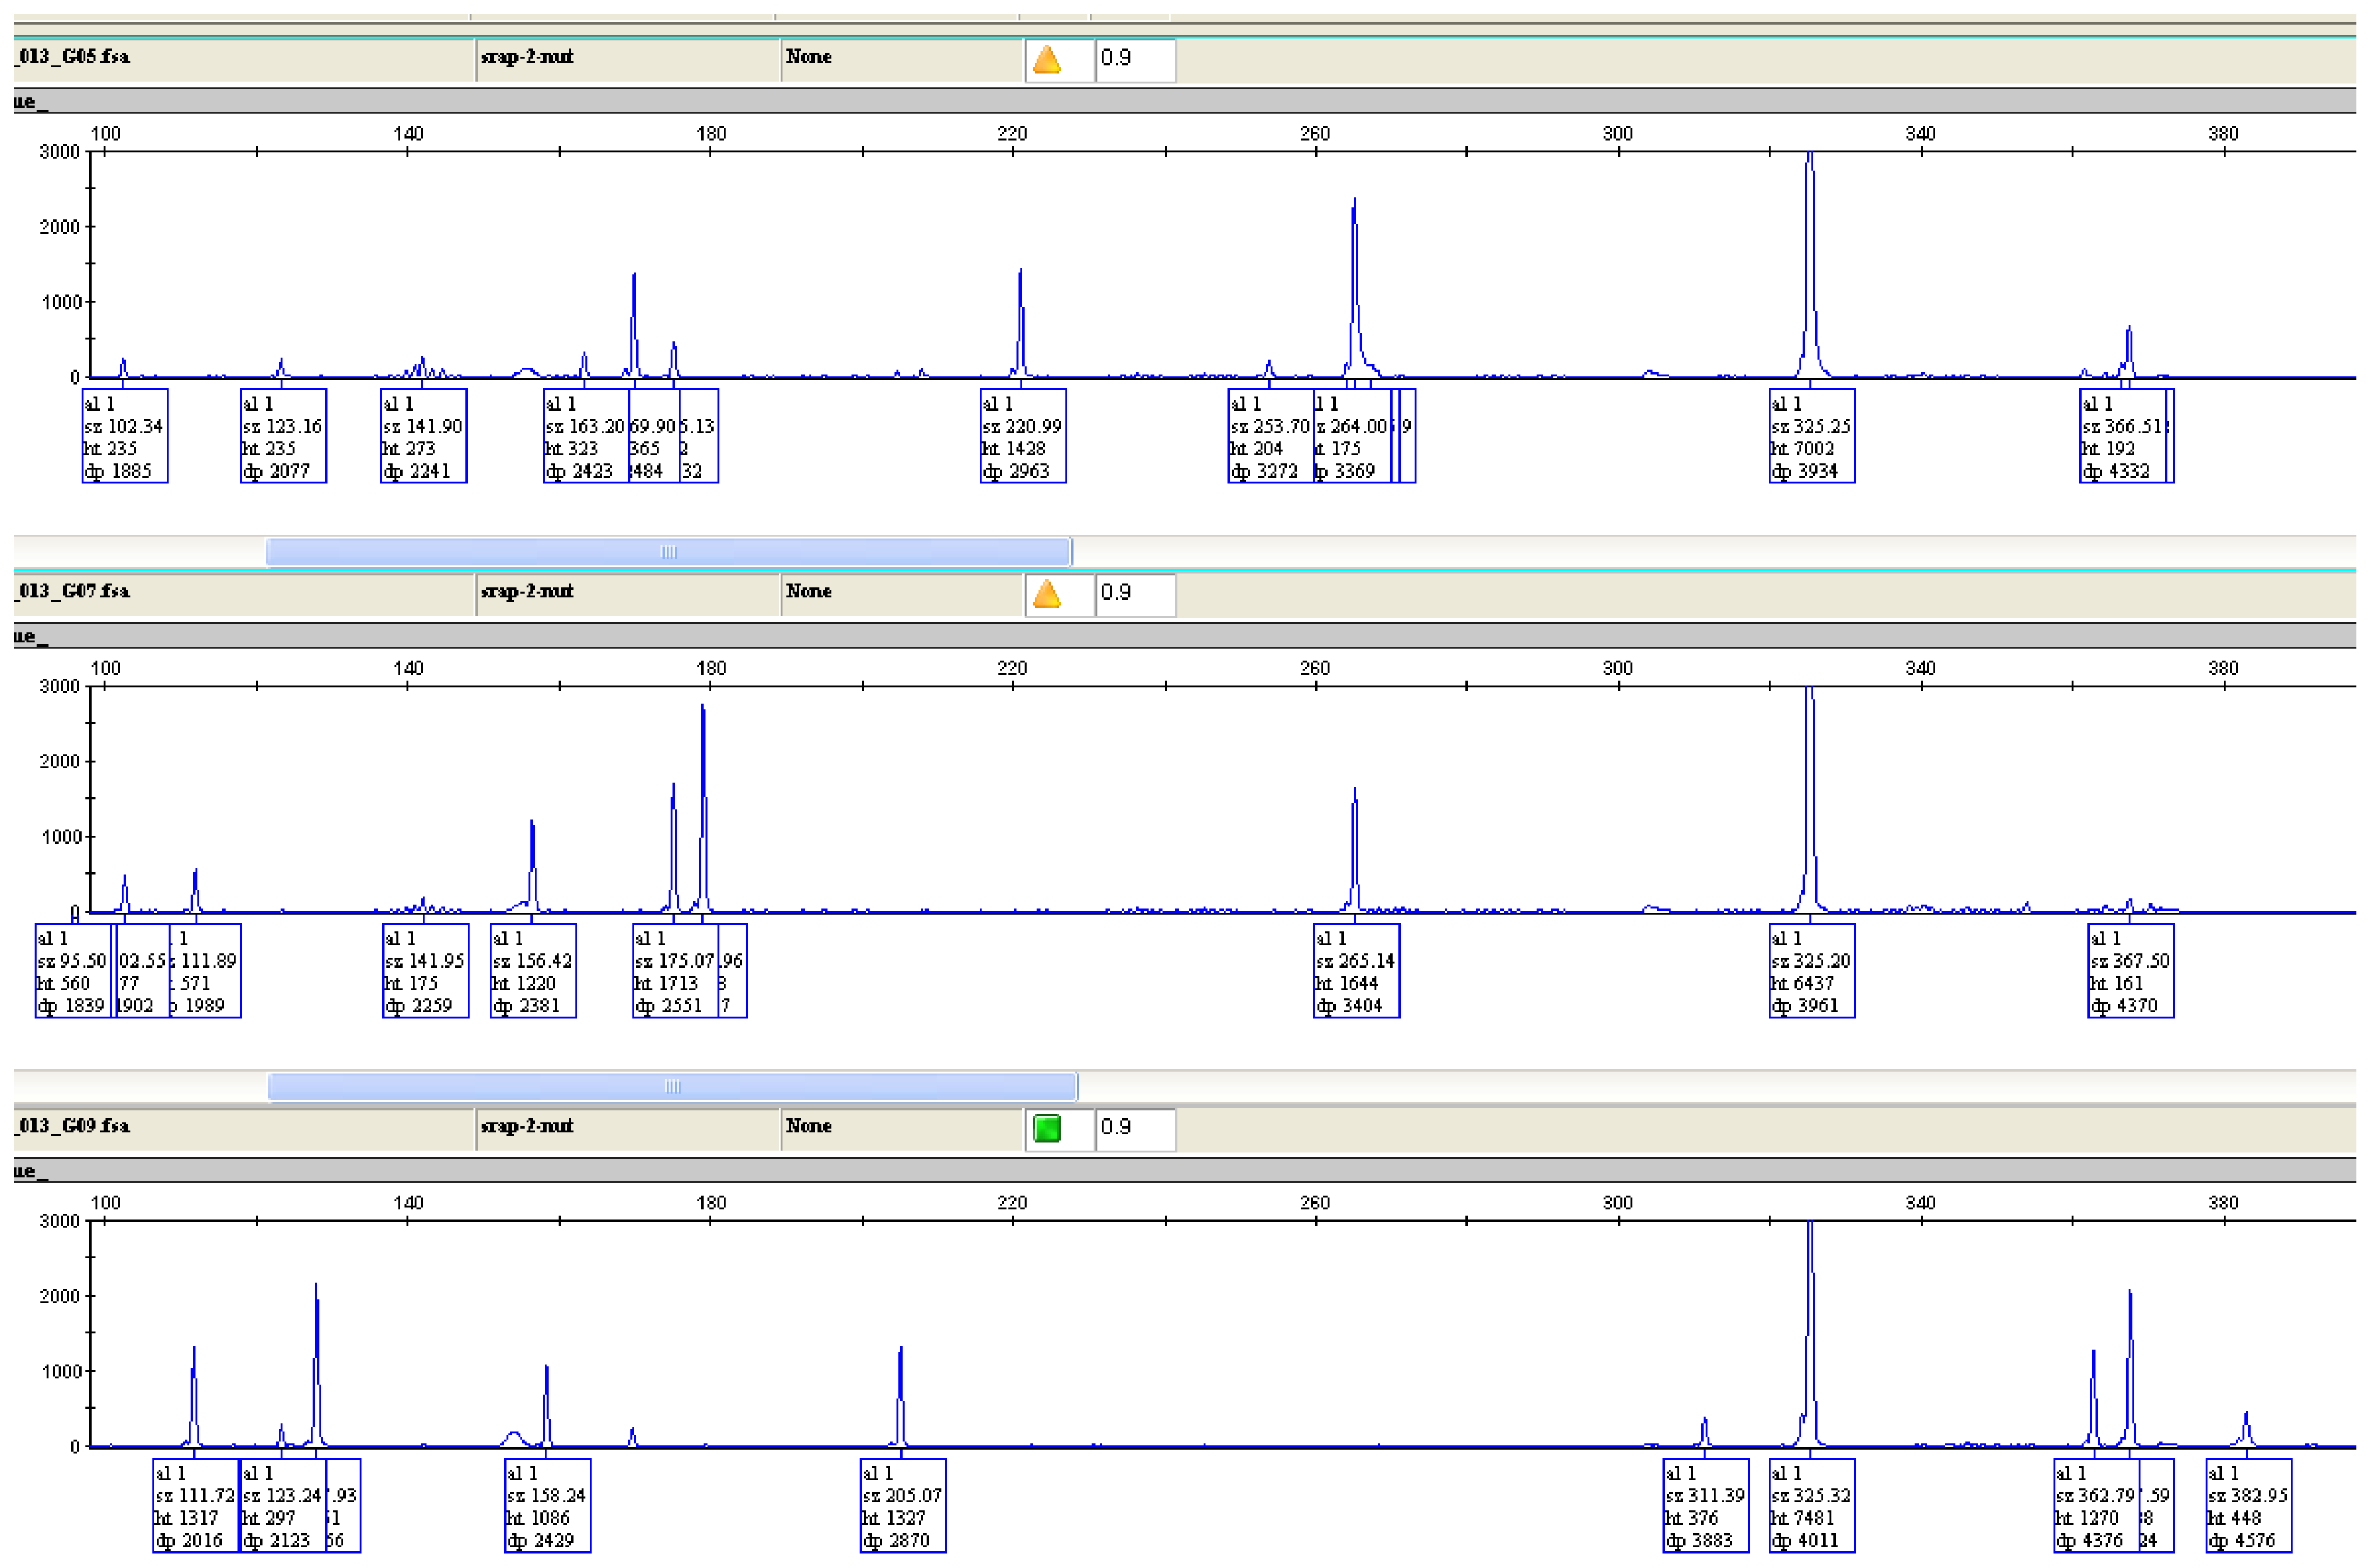
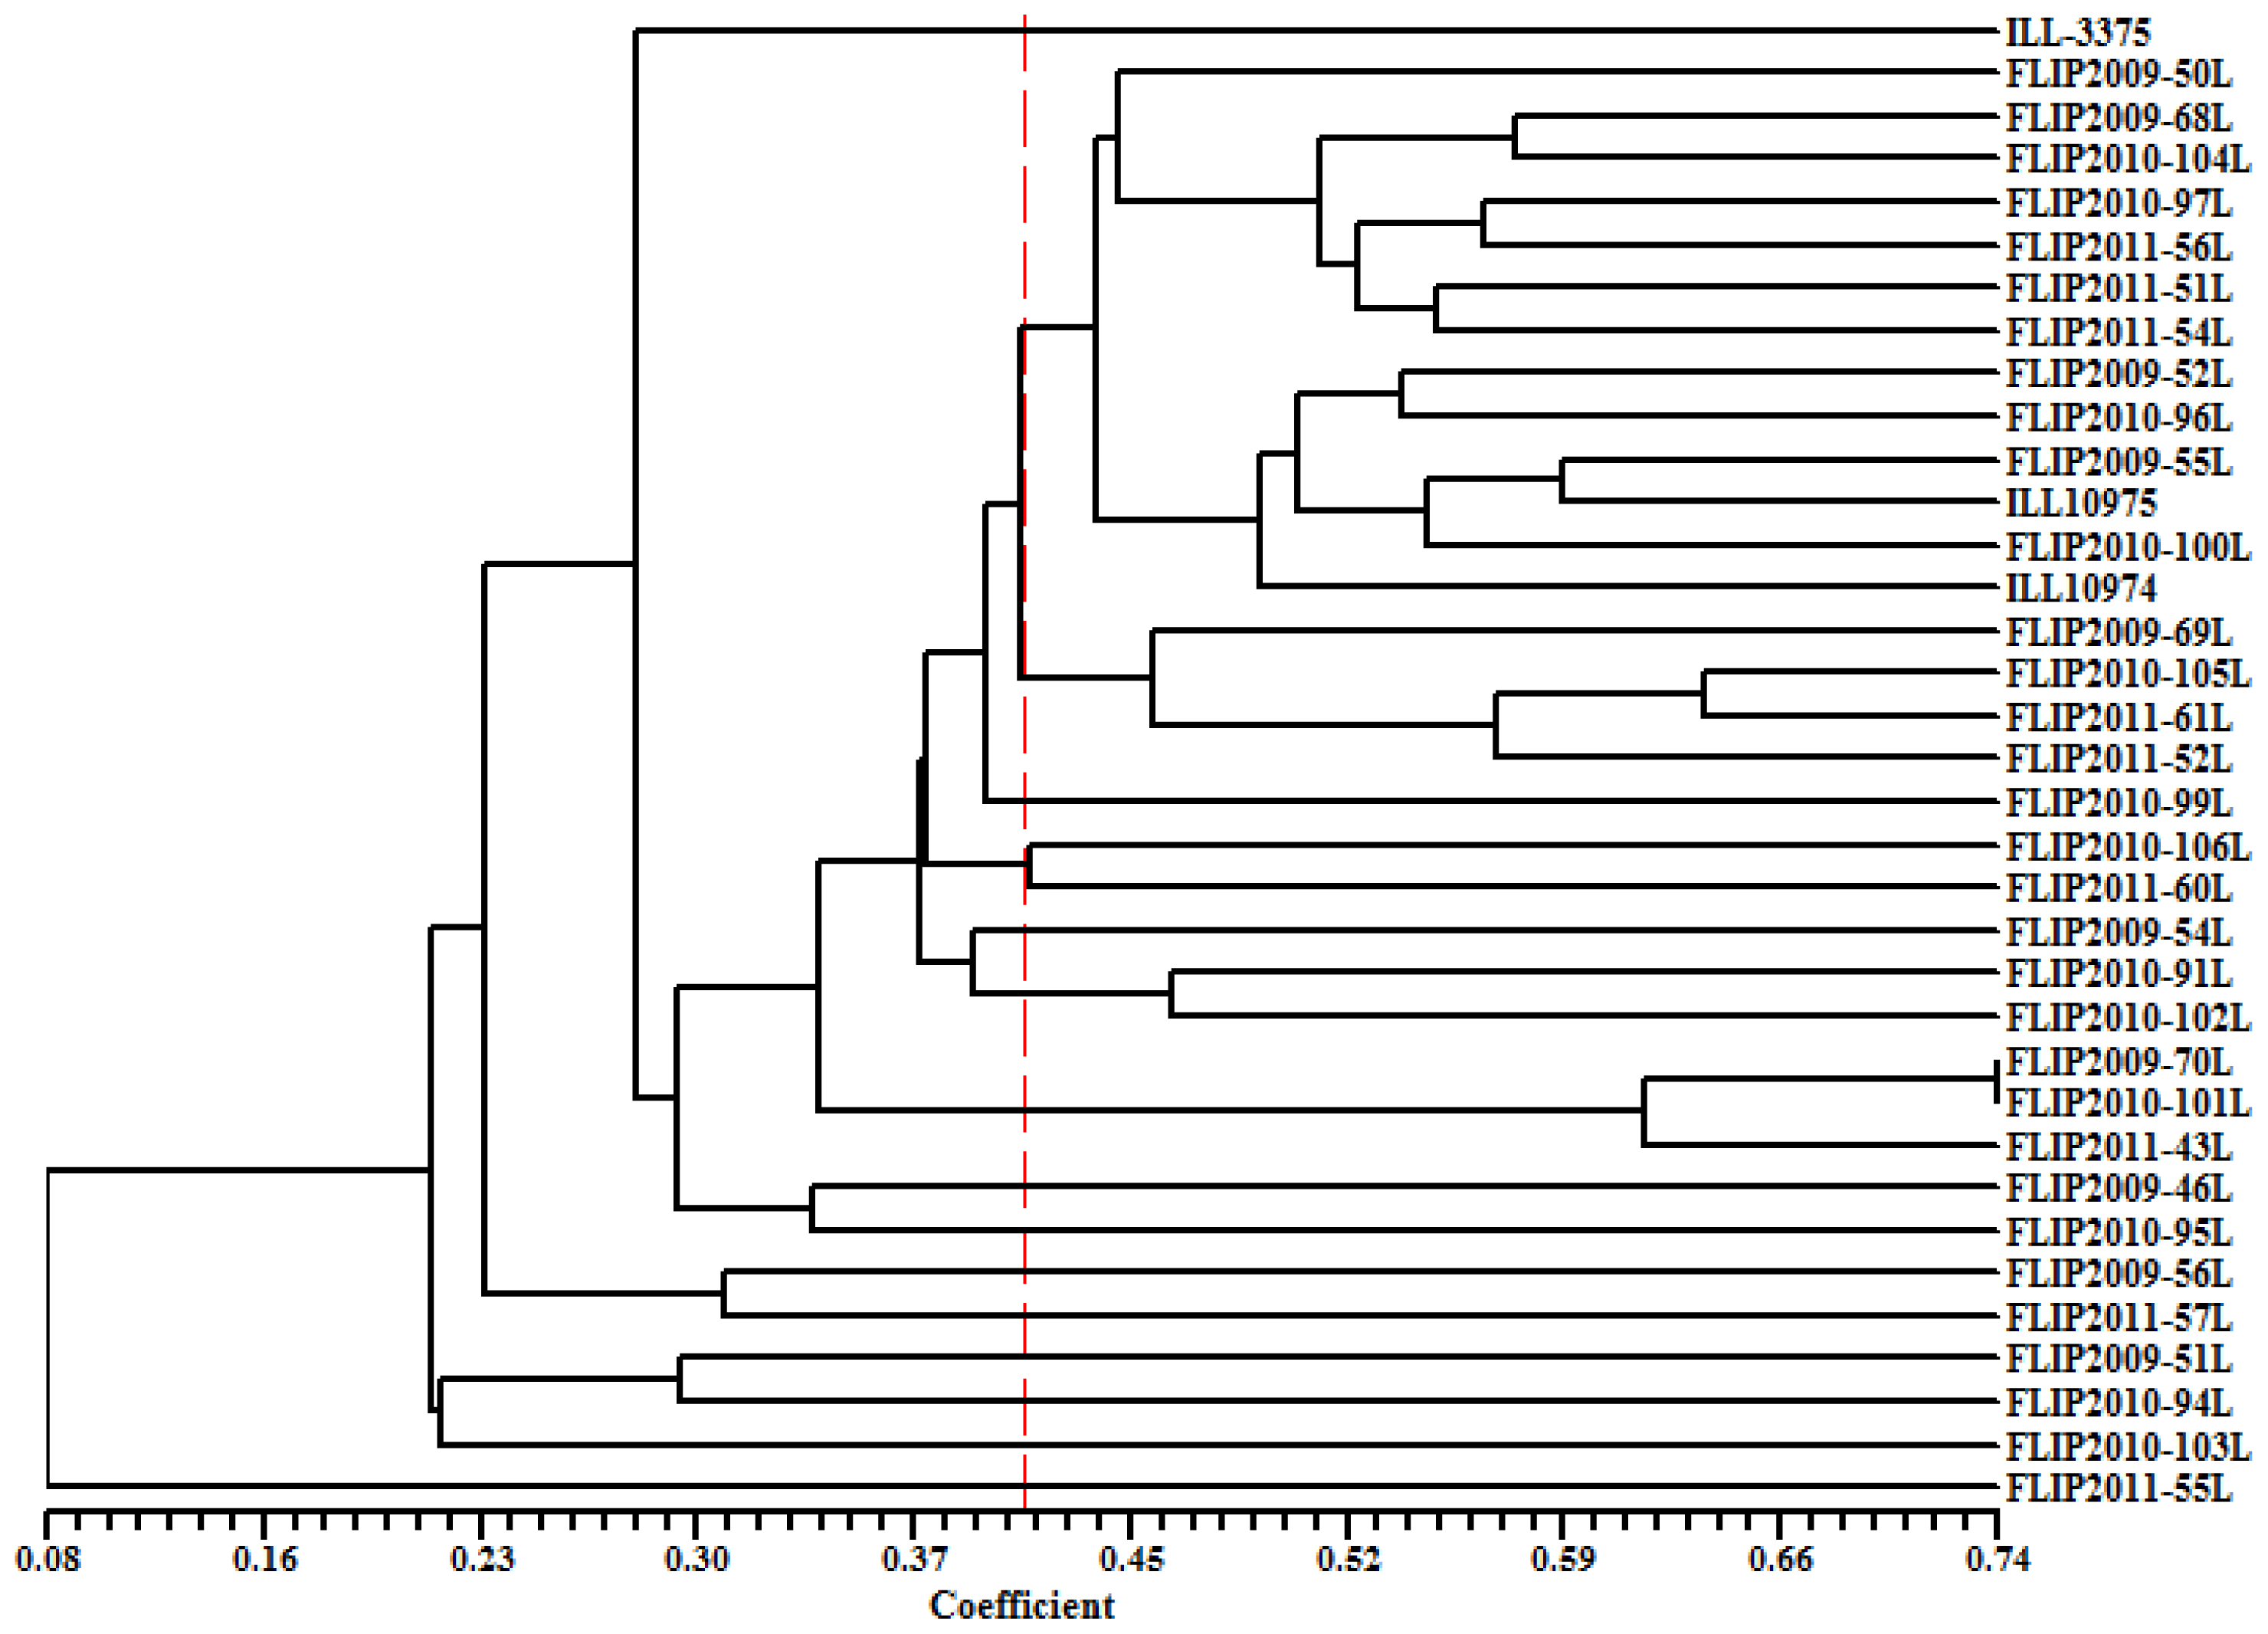
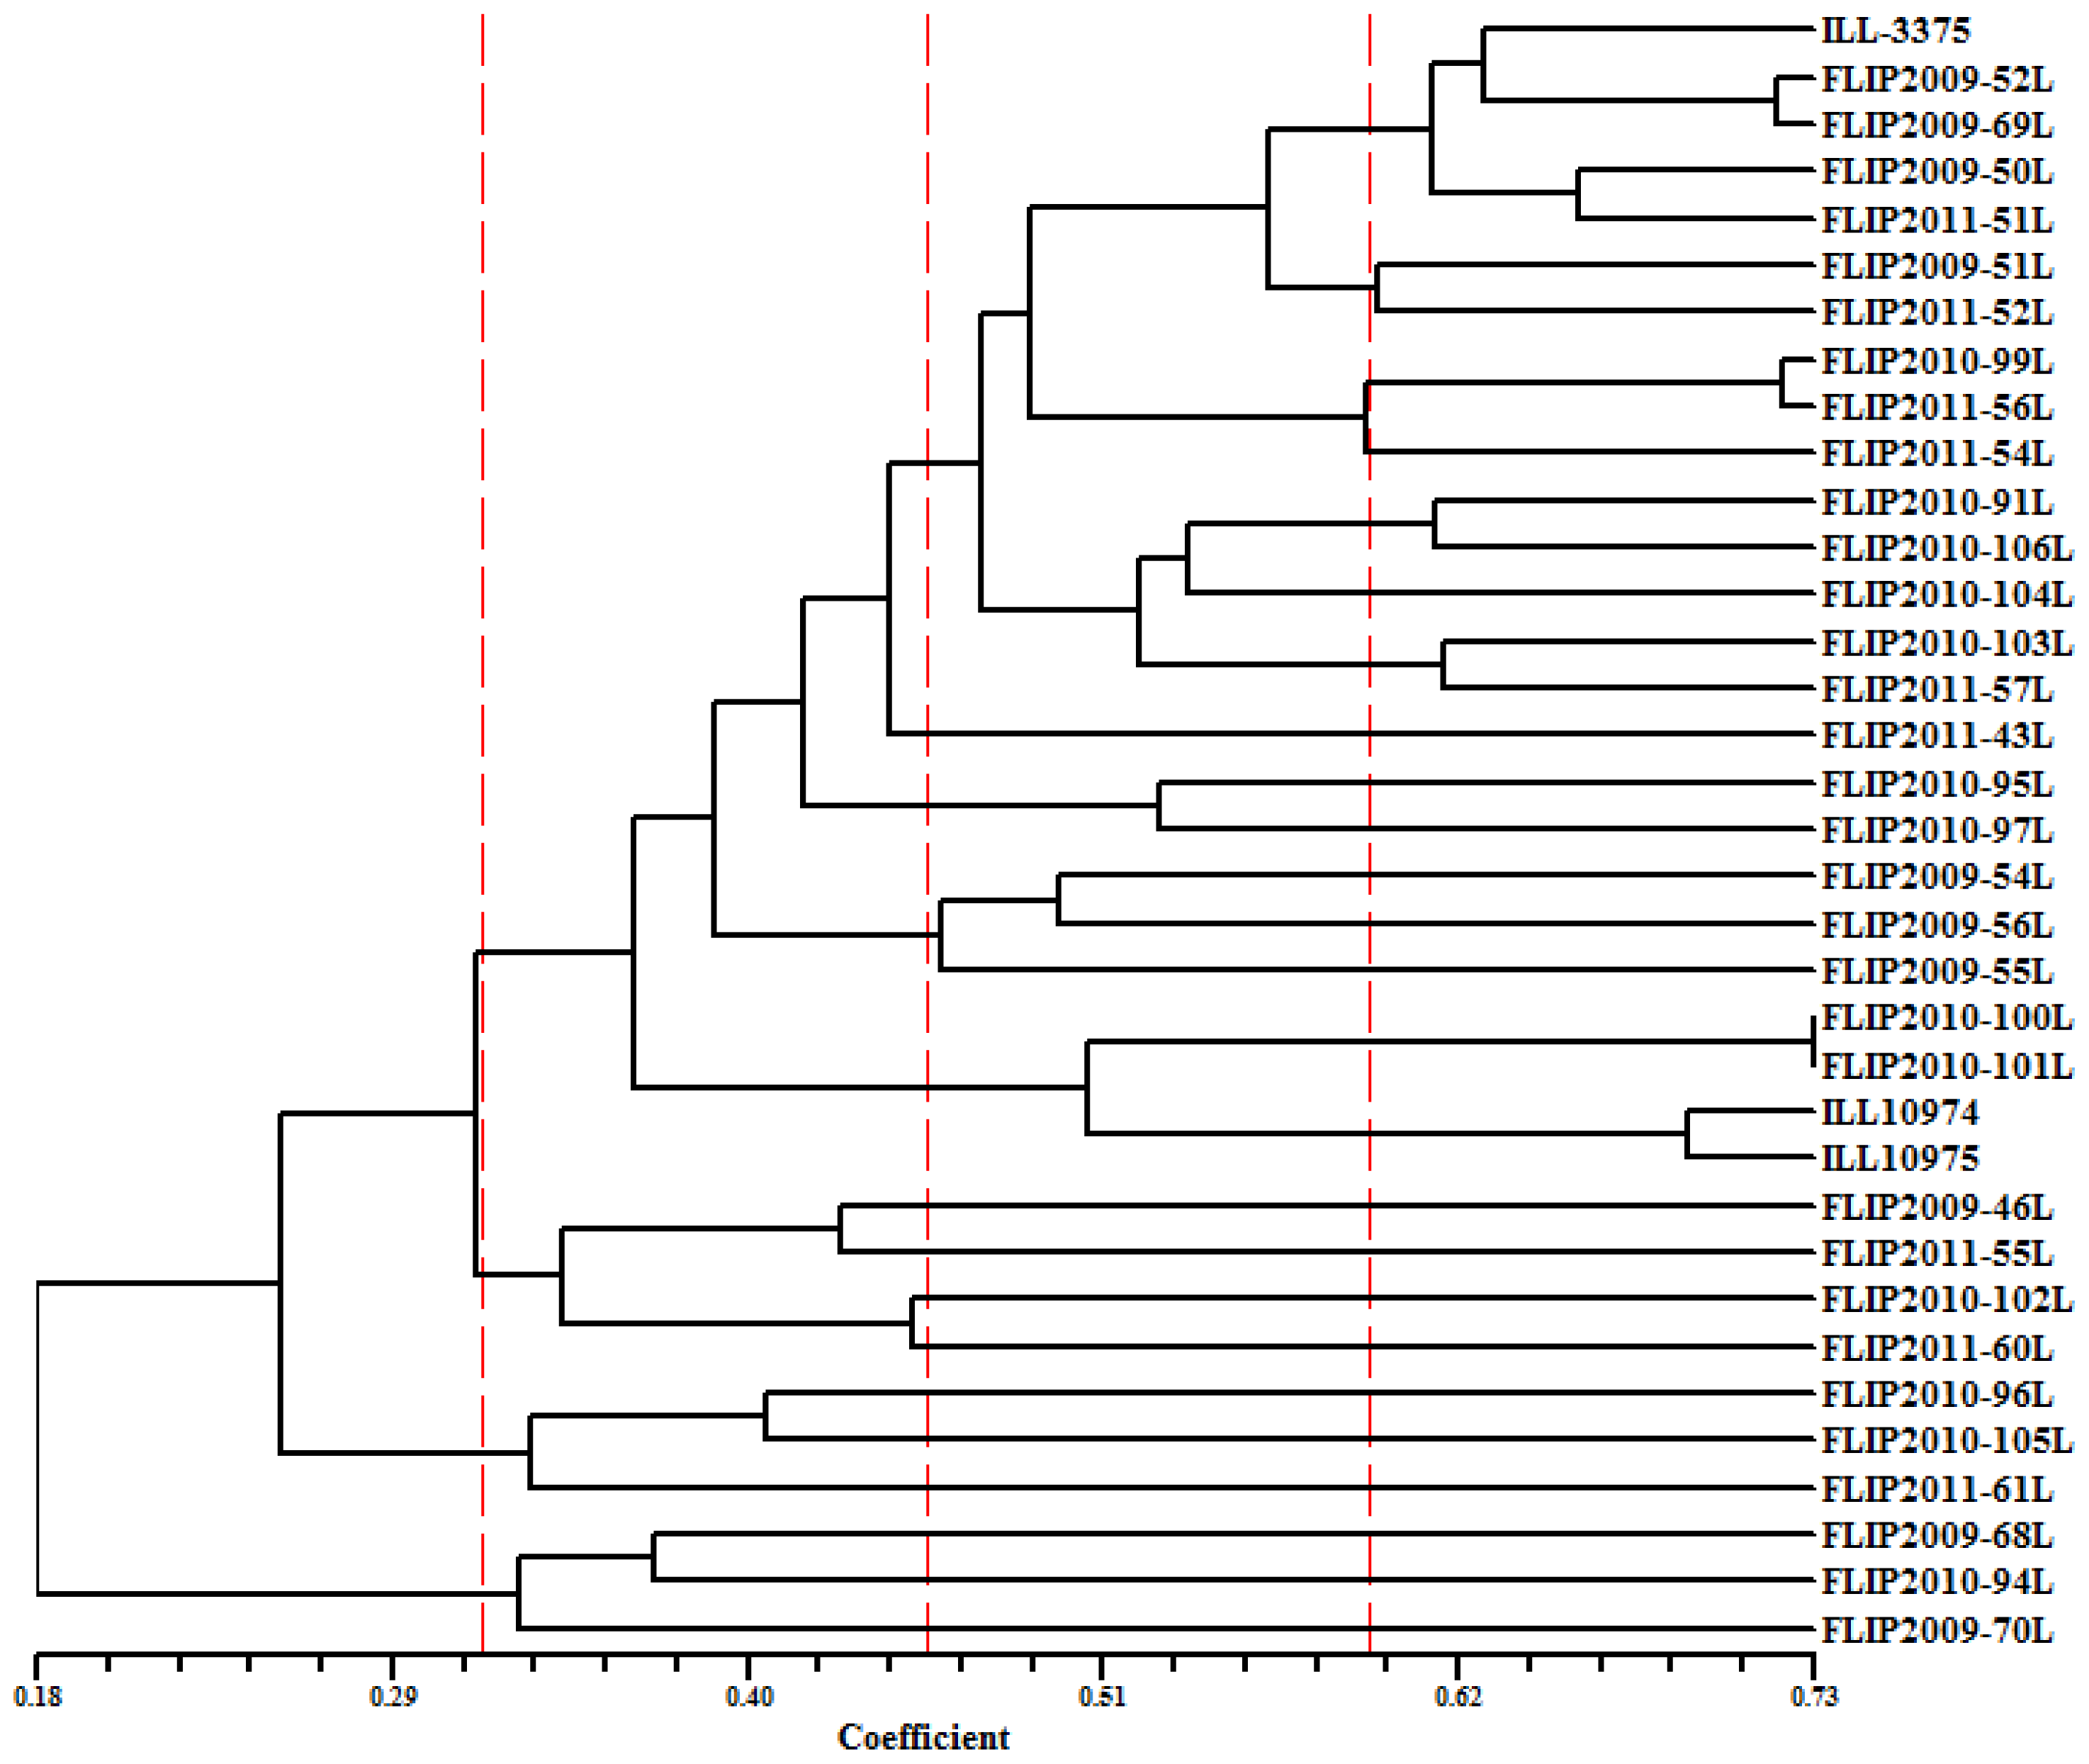
2.5. Genetic Diversity Based on SRAP and AFLP Markers

Using six SRAP primer combinations, the 35 genotypes of lentil produced 2894 amplified products with an average of 482 bands/primer across all genotypes (Table 7). All the scored bands were polymorphic. Figure 1 showed the peak patterns of the tested genotypes using SRAP primer combination ME2/EM2. Primer combination ME2/EM6 produced the highest number of fragments (1138 fragments) and primer combination ME2/EM4 produced the lowest number of fragments with only 124 fragments. PIC values measured for primer combinations were high and ranged from 0.908 to 0.984. The high PIC values reflected the power of SRAP markers to discriminate lentil genotypes and assess genetic diversity.
Genetic similarity matrix among all studied genotype pairs using Jaccard coefficients is presented in Figures S1 and S2. The highest similarity was found between genotype pair FLIP 2009-70L and FLIP 2010-101L (74%). A dendrogram constructed to explain genetic relationship using SRAP markers based on UPGMA method is presented in Figure 2. The data revealed significant genetic differences as similarities ranged from 8% to 74%. The genotype FLIP 2011-55L failed to form any cluster and was considered the most divergent genotype. The remaining genotypes were grouped in two main clusters (A and B) at 21% similarity. Group A contained only three genotypes FLIP 2010-94L, FLIP 2010-103L and FLIP 2010-94L and further separated into individual genotypes at 30% similarity level. The group B contained 31 genotypes and further divided into many sub-groups at 30% similarity, confirming the existence of a considerable amount of genetic diversity among the lentil genotypes at the molecular level.
A total of 1625 amplified bands were obtained by four AFLP primer combinations with an average of 406 bands/primer combination (Table 5). Primer combination ETC/MCTA produced the highest number of fragments which were 583 while primer combination ECC/MCCT produced the lowest number of fragments (98 fragments only). PIC values measured for individual primer combination ranged from 0.894 to 0.968 showing high resolving power of AFLP markers.
Genetic similarity matrix among studied genotypes by four AFLP primer combinations using Jaccard coefficients showed highest similarity between genotype pairs FLIP 2010-99L and FLIP 2011-56L (68%). The dendrogram constructed based on UPGMA (unweighted pair group method with arithmetic average) clustering method was used for detecting genetic diversity of genotypes (Figure 3). Cluster analysis using AFLP data was followed the SRAP data patterns. The clustering divided the 35 genotypes into two main groups (A and B). Group A contains genotypes named as FLIP 2009-70L, FLIP 2010-94L and FLIP 2009-68L. Group B contains all other genotypes and further divided into several sub-clusters at 43% similarity level. The high number of subgroups reflected the variability in studied genotypes, and marker resolution power as well.

2.6. Discussion

Germplasm genetic variability assessment with phenological parameters provides the basis for adaptation to the climatic variables of the prevailing environment. In this study, 35 lentil genotypes showed highly significant morphological variations suggesting that the genotypes have potential and warranty in breeding programs. These results were consistent with those reported by [14,18,19,4049].
Principal component analysis showed that the first four principal components (PCs) were more significant as they accounted for 89.28% of total variations. Days to flowering and seed yield in PC1 and number of seed/plant in PC2 were the most important traits and these were the most interrelated variables with each other, indicating great scope for improvement in these traits through selection. These results agree with those of [44,50] who reported that days to flowering and maturity was positively correlated with seed yield in lentil.
This PC analysis suggests that seed yield and days to flowering could be the main selection criteria, since they displayed a large amount of the variability in each PC. From the analyses of variance, all traits revealed significant variation among genotypes except for number of branches. These results are in agreement with that of [49] who found no significant difference for branch production among the mutants/mother variety. Significant variation in number of seeds per pod [51] and 100-seed weight [52] was also reported. It was reported also that [53] seed yield in lentil depends on seed size, and seed yield increased with increased number of pods per plant [50,5457]. The crude protein results are almost consistent with those reported by [58], who obtained 26% in lentil genotypes; however, [59] estimated crude protein for green and red lentils was 23.03% and 25.88%, respectively. Moreover, [60] reported around 25% protein content in lentils, and [61] reported between 24.3% and 30.2% protein contents. Moisture content ranged between 11.6% and 13.6%. Carbohydrate content ranged from 39.5% to 47% and was close to that reported earlier [6264]. Ash content was found to be in the range of 2.39%–2.89% which was in line with values described by [65,66]. Fat content ranged from 0.79% to 1.19% which was lower than those described by [62]. However, our results were more or less close to that of [66,67] who reported 1%–2% lipid content in lentil seeds.
All lentil genotypes contained relatively high amounts of calcium, potassium, phosphorous, zinc, and magnesium, manganese, iron and copper and thus, could be potential sources for human mineral requirements. The mineral contents of lentil varieties in our study were in harmony with those reported by other researchers [6871]. The amino acid composition of the lentil genotypes indicated significant variation in essential amino acids. The results obtained were fairly comparable with those reported by [58,59]. Generally, the chemical score and amino acid index are used for screening potential protein foods with reference to the FAO/WHO standard amino acid profiles established for humans [72]. The results indicate that all essential amino acids, except methionine and tryptophan, were present in considerable amounts in all the genotypes analyzed.
Antioxidants are important in reducing oxidative damage associated with many diseases, including cardiovascular disease, cancer, atherosclerosis, diabetes, immune deficiency diseases and ageing [73]. Total antioxidant activities are significantly correlated with total phenolic content (TPC) [74], and the bioavailability of polyphenols [75]. The proton radical scavenging action is known to be one of the various mechanisms for measuring antioxidant activity. DPPH is one of the compounds that possess a proton free radical and shows a maximum absorption at 517 nm. This assay determines the scavenging of stable radical species of DPPH by antioxidants. The results obtained here showed potential of lentil scavenging capacity and hence the power of free radicals elimination when incorporated in diet. Similar results were reported by [7577]. They highlighted the significance of the free radical scavenging capacity of lentil genotypes and proved their medical potential.
Good knowledge of the different DNA-based markers is an important step for plant germplasm characterization and classification, and a prerequisite for their effective application in breeding programs [78]. SRAP and AFLP markers proved to be highly efficient tools in discriminating between the 35 lentils genotypes analyzed. The number of polymorphic bands/primer reported here was higher than that reported earlier. For instance, [30] detected lower AFLP polymorphic fragments using Turkish lentil landraces and cultivars (19.8 fragments/primer). Average PIC values of 0.952 for SRAP and 0.945 for AFLP were obtained. These values were much higher than those reported for other marker systems [30]. The higher number of polymorphic fragments in the current study could be due to the higher resolution power and sensitivity of the fragment detection system used.
The comparison of the two molecular marker systems used indicated similar PIC values in AFLP and SRAP markers. Therefore, both markers systems could be recommended for assessing molecular diversity, fingerprinting and varietal discrimination. Both markers revealed a high degree of similarity in dendrogram topology, though there are little differences in some genotype positions in sub-clusters. Overall, genotypes were tending to cluster according to their origin and sometimes a few genotypes correlated with their genetic background.
Our results demonstrated that SRAP and AFLP markers were very useful for genetic classification in lentil genotypes. Nei dissimilarity matrices of AFLP and SRAP markers were compared using Mantel test. The results revealed that SRAP and AFLP markers were correlated (r = 0.189). Similar results were reported on AFLP and ISSR for genetic variation among Turkey lentil landraces [30], where significant a correlation coefficient was obtained using the Mantel test.

3. Experimental Section

Thirty five advanced breeding lines of lentils were introduced from International Center for Agricultural Research in Dry Areas (ICARDA) and used for this study. The pedigree and geographical origins of the studied genotypes are presented in Table 6. Seeds were grown at Dirab Experimental Research Station, Riyadh, Saudi Arabia (24°43′34″N, 46°37′15″E) in randomized complete block design (RCBD) layout with three replications in November 2010 and December 2011 growing seasons for field evaluation. Seeds were sown in mid-November using a hand drill. The experimental plot consisted of two rows, 30 cm apart and 3 m long (1.8 m2 size). Data were recorded on phenological parameters, including seed yield and its components. The dry seeds proximate analyses of the genotypes for crude proteins, moisture, total ash and crude fat were carried out in triplicate using the methods described in [79]. All the proximate values were reported in g/100 g seed dry weight. Carbohydrate was determined using subtraction. Percentage of nitrogen in seed samples were measured and crude protein% was calculated as nitrogen% × 6.25 [80]. Minerals content were determined according to [81]. About 100–500 μg protein sample was completely hydrolysed in HCl at 110 °C for 24 h, gradient HPLC system LC-10AT vp (Shimadzu corporation, Kyoto, Japan) with auto injector was used to determine amino acids profiles. Estimation of antioxidant activities of seed samples were also carried out. Total phenolic compounds were quantified by Folin-Ciocalteu method, according to [82]. Colorimetric aluminum chloride method was used for flavonoid determination as described by [82]. The effect of phenolic compounds on the Table S8, 2-diphenyl-1-picryl hydrazyl radical (DPPH) were used to assess antioxidant activity of the extracts. The ability of the samples to scavenge DPPH radicals was determined according to [83]. The values of total phenolic components (TPC), total flavonoid content (TFC) and DPPH (mg standard equivalent per gram of dry weight) were estimated using the equation:
TPC , TFC or DPPH in  ( mg standard equivalent per gram weight ) = [ ( A s - A b ) ( Slope ) ] ( 20 / V ) I × 1000
where: As = sample absorbance for TPC, TFC or absorbance decrease of sample for DPPH value; Ab = blank (no extract) absorbance for TPC and TFC or absorbance decrease of blank for DPPH value (extract was substituted by deionized water for blank); Slope = slope of standard curve, (20/V) = total volume of extract (20 mL)/used volume of extract (mL); I = weight of sample used (g); 1000 = factor for changing μg to mg.
Trypsin inhibitor activity was assessed according to [84] using benzoyl-dl-arginine-p-nitroanilide (BAPA) as synthetic substrate. Trypsin inhibitor unit per milligram (TIU/mg) of sample was calculated by taking absorbance at 410 nm against a blank in a spectrometer. One unit of TIU is defined as an increase of 0.01 in absorbance reading at 410 nm per 10 mL of reaction mixture. Phytic acid analysis was performed according to [85] using chromophore reagent. Tannin content was determined using the vanillin-HCl method of [86].
For molecular characterization, two-week old lentil leaves from 35 selected genotypes were collected, dropped in liquid N2, and stored at −80 °C until DNA isolation. DNA isolation was carried out using a modified SDS protocol [87] as described by [88]. Six SRAP and four AFLP primer combinations were used to estimate genetic diversity among lentil genotypes. The SRAP primer combinations used are shown in Table 7. SRAP-PCR reactions were performed in 20 μL volume containing 1× GoTaq Green Master Mix (Cat. No. M7123, Promega Corporation, Madison, WI, USA), 0.25 μM from each forward and reveries primers, 50 ng template DNA and nuclease-free water up to 20 μL. The forward primers were 5′ end labelled with FAM dye (Applied Biosystems, Foster city, CA, USA). Amplification was carried out on a TC-5000 thermal cycler (Bibby Scientific, Staffordshire, UK) as follows: initial denaturation at 94 °C for 5 min followed by five cycles of denaturing at 94 °C for 1 min, annealing at 35 °C for 1 min and elongation at 72 °C for 1 min. In the remaining 30 cycles, the annealing temperature was increased to 50 °C for 1 min with a final extension step at 72 °C for 7 min. AFLP analysis was performed following the procedure in PE Biosystems plant mapping kit (Applied Biosystems, Foster City, CA, USA) using a modified procedure from [39] and four EcoRI/MseI primer combinations, i.e., ECT/MCTG, ETA/MCTC, ETC/MCTA, and ECC/MCCT. One microliter of the PCR amplified product was mixed with 0.05 μL of the GeneScan 500 LIZ size standard (Applied Biosystems P/N 4322682) and 9 μL of Hi-Di Formamide (Applied Biosystems P/N 4311320). The mixture was denatured for 3 min at 95 °C and loaded on the 36-cm 16-capillary system of the Applied Biosystems 3130xl Genetic Analyzer. Fragment analysis for SRAP and AFLP was performed with GeneMapper Analysis Software v3.7 (Applied Biosystems) and the data were assembled in binary format allele presence (1) or (0) for Absence. The threshold for allele calling was set at 200 relative florescence units (rfu) according to [89]. Fragment analysis was carried out for allele sizes in the range of 100–500 bp. Markers showed single alleles across genotypes were eliminated from the analysis. Data generating from SRAP and AFLP analysis were analysed using Jaccard similarity coefficient [90]. Dendrogram was constructed using Jaccard similarity coefficient and the unweighted pair group method with arithmetic average (UPGMA) employing the SAHN (sequential, agglomerative, hierarchical, and nested clustering) from the NTSYSpc (ver.2.10) program (Exeter Publishing Ltd., New York, NY, USA) [91]. Analysis of variance (ANOVA) was carried out using MSTATC software (Michigan State University, East Lansing, MI, USA) and principal component analysis using XLSTAT software (Addin Soft, New York, NY, USA).

4. Conclusions

In conclusion, analysis on phenological, nutritional and molecular data was useful for assessing genetic diversity in lentils. The lentil genotypes demonstrated significant differences and some genotypes showed superiority in most of the studied parameters. Overall, the five best performing genotypes among the lentils were FLIP 2009-64L, FLIP 2009-69L, FLIP 2010-94L, FLIP 2010-101L, FLIP 2010-102 L, FLIP 2010-104 L and FLIP 2010-105 L. These genotypes, along with other high yielding genotypes, are suggested for lentil genetic improvement. Incorporation of lentils in daily human diets can thus enhance nutritional status and reduce malnutrition. Their high protein content with elevated levels of essential amino acids, along with high nutrients and antioxidants levels, makes lentil seeds an ideal meat alternative. SRAP and AFLP marker systems showed high levels of resolution and discrimination power, making them ideal systems for assessing genetic diversity and varietal discrimination.

Supplementary Information

ijms-15-00277-s001.pdf

Acknowledgments

The authors are very thankful to the King Abdul-Aziz City for Science and Technology (KACST) for their financial support, project no. (AT-30-391).

Conflicts of Interest

The authors declare no conflict of interest.

References

  1. Arumuganathan, K.; Earle, E.D. Nuclear DNA content of some important plant species. Plant Mol. Biol 1991, 9, 208–218. [Google Scholar]
  2. FAOSTAT Database. Available online: http://faostat.fao.org/site/339/default.aspx (accessed on 15 January 2013).
  3. Callaway, J.C. Hempseed as a nutritional resource: An overview. Euphytica 2004, 140, 65–72. [Google Scholar]
  4. Handbook of World Food Legumes; Salunkhe, D.; Kadam, S. (Eds.) CRC: Boca Raton, FL, USA, 1989.
  5. Zheng, G.; Han, H.; Bhatty, R. Physicochemical properties of zero amylose hull-less barley starch. Cereal Chem 1998, 75, 520–524. [Google Scholar]
  6. Frederick, M.; Cho, S.; Sarker, A.; McPhee, K.; Coyne, C.; Rajesh, P.; Ford, P. Application of biotechnology in breeding lentil for resistance to biotic and abiotic stress. Euphytica 2006, 147, 149–165. [Google Scholar]
  7. USDA National Nutrient Database for Standard Reference. Available online: http://www.ars.usda.gov/Services/docs.htm?docid=8964 (accessed on 20 December 2013).
  8. Thavarajah, D.; Thavarajah, P.; Sarker, A.; Materne, M.; Vandemark, G.; Shrestha, R.; Idrissi, O.; Hacikamiloglu, O.; Bucak, B.; Vandenberg, A. A global survey of effects of genotype and environment on selenium concentration in lentils (Lens culinaris L.): Implications for nutritional fortification strategies. Food Chem 2011, 125, 72–76. [Google Scholar]
  9. Vandenberg, A. Lentil Expansion in Canada. In Milestones in Food Legume Research; Ali, M., Kumar, S., Eds.; Indian Institute of Pulses Research: Kanpur, India, 2009; pp. 58–72. [Google Scholar]
  10. Hayward, M.D.; Breese, E.L. Population Structure and Variability. In Plant Breeding: Principles and Prospects; Hayward, M.D., Bosemark, N.O., Eds.; Chapman and Hall: London, UK, 1993; pp. 7–29. [Google Scholar]
  11. Sindhu, J.S.; Mishra, H.O. Genetic variability in Indian microsperma types of lentil. Lentil Exp. News. Serv 1982, 9, 10–11. [Google Scholar]
  12. Ramgiry, S.R.; Paliwal, K.K.; Tomar, S.K. Variability and correlation of grain yield and other qualitative characters in lentil. LENS Newsl 1989, 16, 19–21. [Google Scholar]
  13. Sarker, A.; Erskine, W. Utilization of Genetic Resources in Lentil Improvement. Proceedings of the Genetic Resources of Field Crops: Genetic Resources Symposium, EUCARPIA, Poznam, Poland, 16–20 May 2001.
  14. Tullu, A.; Kusmenoglu, I.; McPhee, K.E.; Muehlbauer, F.J. Characterization of core collection of lentil germplasm for phenology, morphology, seed and straw yields. Genet. Resour. Crop Evol 2001, 48, 143–152. [Google Scholar]
  15. Fratini, R.; Durán, Y.; García, P.; Perez de la Vega, M. Identification of quantitative trait loci (QTL) for plant structure, growth habit and yield in lentil. Span. J. Agric. Res 2007, 5, 348–356. [Google Scholar]
  16. Tullu, A.; Taran, B.; Warkentin, T.; Vandenberg, A. Construction of an intraspecific linkage map and QTL analysis for earliness and plant Height in lentil. Crop Sci 2008, 48, 2254–2264. [Google Scholar]
  17. Zaccardelli, M.; Lupo, F.; Piergiovanni, A.R.; Aghetti, G.; Sonnante, G.; Daminati, M.G.; Sparvoli, F.; Lioi, L. Characterization of Italian lentil (Lens culinaris Medik.) germplasm by agronomic traits, biochemical and molecular markers. Genet. Resour. Crop Evol 2012, 59, 727–738. [Google Scholar]
  18. Gautam, N.K.; Singh, M.; Khan, Z.; Roy, A.; Akhtar, J.; Ram, B. Assessment of lentil germplasm with respect to agromonic performance and major biotic stress. Legume Res 2013, 36, 214–219. [Google Scholar]
  19. Roy, S.; Islam, M.A.; Sarker, A.; Malek, M.A.; Rafii, M.Y.; Ismail, M.R. Determination of genetic diversity in lentil germplasm based on quantitative traits. Aust. J. Crop Sci 2013, 7, 14–21. [Google Scholar]
  20. Erskine, W.; Witcombe, J.R. Lentil Germplasm Catalog; ICARDA: Aleppo, Syria, 1984. [Google Scholar]
  21. Samec, P.; Nasinec, V. The use of RAPD technique for identification and classification of Pisum sativum L. genotypes. Euphytica 1996, 89, 229–234. [Google Scholar]
  22. Sonnante, G.; Pignone, D. Assessment of genetic variation in a collection of lentil using molecular tools. Euphytica 2001, 120, 301–307. [Google Scholar]
  23. Abo-Elwafa, A.; Muraik, K.; Shimada, T. Intra- and inter-specific variation in Lens species revealed by RAPD markers. Theor. Appl. Genet 1995, 90, 335–340. [Google Scholar]
  24. Sharma, S.K.; Dawson, I.K.; Waugh, R. Relationship among cultivated and wild lentils revealed by RAPD analysis. Theor. Appl. Genet 1995, 91, 647–654. [Google Scholar]
  25. Sharma, S.K.; Knox, M.R.; Ellis, T.H.N. AFLP analysis of the diversity and phylogeny of Lens and its comparison with RAPD analysis. Theor. Appl. Genet 1996, 93, 751–758. [Google Scholar]
  26. Ford, R.; Pang, E.C.K.; Taylor, P.W.J. Diversity analysis and species identification in lens using PCR generated markers. Euphytica 1997, 96, 247–255. [Google Scholar]
  27. Alvarez, M.; Garcia, P.; Perez de la Vega, M. RAPD polymorphism in Spanish lentil landraces and cultivars. J. Genet. Breed 1997, 51, 91–96. [Google Scholar]
  28. Fikiru, E.; Tesfaye, K.; Bekele, E. Genetic diversity and population structure of Ethiopian lentil (Lens culinaris Medikus) landraces as revealed by ISSR marker. Afr. J. Biotechnol 2007, 6, 1460–1468. [Google Scholar]
  29. Sonnante, G.; Pignone, D. The major Italian landraces of lentil (Lens culinaris Medik.): Their molecular diversity and origin. Genet. Resour. Crop Evol 2007, 54, 1023–1031. [Google Scholar]
  30. Toklu, F.; Karaköy, T.; Hakle, I.; Bicer, T.; Brandolini, A.; Kilian, B.; Ozkan, H. Genetic variation among lentil (Lens culinaris Medik.) landraces from Southeast Turkey. Plant Breed 2009, 128, 178–186. [Google Scholar]
  31. El-Nahas, A.; El-Shazly, H.; Ahmed, S.; Omran, A. Molecular and biochemical markers in some lentil (Lens culinaris Medik.) genotypes. Ann. Agric. Sci 2011, 56, 105–112. [Google Scholar]
  32. Liu, J.; Guan, J.P.; Xu, D.X.; Zhang, X.Y.; Gu, J.; Zong, X.X. Genetic diversity and population structure in lentil (Lens culinaris Medik.) germplasm detected by SSR Markers. Acta Agron. Sin 2008, 34, 1901–1909. [Google Scholar]
  33. Babayeva, S.; Akparov, Z.; Abbasov, M.; Mammadov, A.; Zaifizadeh, M.; Street, K. Diversity analysis of Central Asia and Caucasian lentil (Lens culinaris Medik.) germplasm using SSR fingerprinting. Genet. Resour. Crop Evol 2009, 56, 293–298. [Google Scholar]
  34. Hamwieh, A.; Udupa, S.M.; Sarker, A.; Jung, C.; Baum, M. Development of new microsatellite markers and their application in the analysis of genetic diversity in lentils. Breed. Sci 2009, 59, 77–86. [Google Scholar]
  35. Kaur, S.; Cogan, N.; Pembleton, L.; Shinozuka, M.; Savin, K.; Materne, M.; Forster, J. Transcriptome sequencing of lentil based on second-generation technology permits large-scale unigene assembly and SSR marker discovery. BMC Genomics 2011. [Google Scholar] [CrossRef]
  36. Havey, M.J.; Muehlbauer, F.J. Variability for restriction fragment lengths and phylogenies in lentil. Theor. Appl. Genet 1989, 77, 839–843. [Google Scholar]
  37. Muench, D.G.; Slinkard, A.E.; Scoles, G.J. Determination of genetic variation and taxonomy in lentil (Lens Miller) species by chloroplast DNA polymorphism. Euphytica 1991, 56, 213–218. [Google Scholar]
  38. Li, G.Y.; Quiros, C.F. Sequence-related amplified polymorphism (SRAP), a new marker system based on a simple PCR reaction, its application to mapping and gene tagging in Brassica. Theor. Appl. Genet 2001, 103, 455–461. [Google Scholar]
  39. Vos, P.; Hogers, R.; Bleeker, M.; Reijans, M.; Lee, T.V.; Hornes, M.; Frijters, A.; Pot, J.; Peleman, J.; Kuiper, M.; et al. AFLP: A new technique for DNA fingerprinting. Nucleic Acids Res 1995, 23, 4407–4414. [Google Scholar]
  40. Singh, K.B.; Singh, S. Evaluation of exotic germplasm in lentil. J. Agric. Res 1991, 6, 304–306. [Google Scholar]
  41. Jain, S.K.; Madaria, S.K.; Rao, S.K.; Nigam, P.K. Analysis of yield factors in lentil. Indian J. Agric. Res 1995, 29, 173–180. [Google Scholar]
  42. Chakrabotry, M.; Haque, M.F. Genetic variability and component analysis in lentil (Lens culinaris Medik.). J. Res 2000, 25, 199–204. [Google Scholar]
  43. Singh, I.; Sardana, V.; Sekhon, H. Influence of row spacing and seed rate on seed yield of lentil (Lens culinaris) under different sowing dates. Indian J. Agron 2005, 50, 308–310. [Google Scholar]
  44. Toklu, F.; Biçer, B.T.; Karaköy, T. Agro-morphological characterization of the Turkish lentil landraces. Afr. J. Biotechol 2009, 8, 4121–4127. [Google Scholar]
  45. Tuba, B.; Sakar, D. Heritability of yield and its components in lentil (Lens culinaris Medik.). Bulg. J. Agric. Sci 2010, 16, 30–35. [Google Scholar]
  46. Aghili, P.; Imani, A.; Shahbazi, H.; Alaei, Y. Study of correlation and relationships between seed yield and yield components in Lentil (Lens culinaris Medik). Ann. Biol. Res 2012, 3, 5042–5045. [Google Scholar]
  47. Sabaghnia, N.; Karimizadeh, R.; Mohammadi, M. Grouping genotypes and test environments by some cluster methods regarding genotype × environment interaction in multi-environment trials. Genetika 2012, 44, 457–473. [Google Scholar] [Green Version]
  48. Gupta, D.; Sharma, S.K. Evaluation of wild Lens taxa for agro-morphological traits, fungal diseases andmoisture stress in North Western Indian Hills. Genet. Resour. Crop Evol 2006, 53, 1233–1241. [Google Scholar]
  49. Mondal, M.A.; Puteh, A.; Malek, M.; Roy, S.; Yusop, M. Contribution of morpho-physiological traits on yield of lentil (Lens culinaris Medik). Aust. J. Crop Sci 2013, 7, 167–1172. [Google Scholar]
  50. Tuba, B.D.; Sakar, D. Studies on variability of lentil genotypes in southern Anatolia of Turkey. Not. Bot. Horti Agrobot. Cluj 2008, 36, 20–24. [Google Scholar]
  51. Dewan, M.A. Characterization of Lentil Mutants in Respect of Their Morphological and Yield Attributes. Master’s Thesis, Bangladesh Agricultural University, Mymensingh, Bangladesh, 2005. [Google Scholar]
  52. Wang, N. Quality of Western Canadian Lentils. (accessed on 20 December 2013).
  53. Mondal, M.M.A.; Howlader, M.H.K.; Akter, M.B.; Dutta, R.K. Evaluation of five advanced lentil mutants in relation to morphophysiological characters and yield. Bangladesh J. Crop Sci 2007, 18, 367–372. [Google Scholar]
  54. Yadav, S.S.; Phogat, D.S.; Solanki, I.S.; Tomer, T.S. Character association and path analysis in lentil. Indian J. Pulse Res 2003, 16, 22–24. [Google Scholar]
  55. Anzam, M.S.; Ali, A.; Iqbal, S.M.; Haqqani, A.M. Evaluation and correlation of economically important traits in exotic germplasm of lentil. Int. J. Agric. Biol 2005, 7, 959–961. [Google Scholar]
  56. Younis, N.; Hanif, M.; Sadiq, S.; Abbas, G.; Asghar, M.J.; Haq, M.A. Estimation of genetic parameters and path analysis in lentil. Pak. J. Agric. Sci 2008, 45, 44–48. [Google Scholar]
  57. Karadavut, U. Path analysis for yield and yield components in lentil. Turk. J. Field Crop 2009, 14, 97–104. [Google Scholar]
  58. Jood, S.; Bishnoi, S.; Sharma, A. Chemical analysis and physico-chemical properties of chickpea and lentil cultivars. Nahrung 1998, 42, 71–74. [Google Scholar]
  59. Boyle, J.L.; Aksay, S.; Roufik, S.; Ribereau, S.; Mondor, M.; Mondor, M.; Farnworth, E.; Rajamohamed, S.H. Comparison of the functional peoperties of pea, chickpea and lentil protein concentrates processed using ultrafiltration and isoelectric precipitation techniques. Food Res. Int 2010, 43, 537–546. [Google Scholar]
  60. Taleb, M.H.; Khodambashi, M.; Karimi, M. Study of physical and nutritional quality properties in segregating generations of lentil cross. Int. J. Agric. Crop Sci 2013, 5, 2740–2742. [Google Scholar]
  61. Wang, N.; Daun, J.K. The Chemical Composition and Nutritive Value of Canadian Pulses: Lentil (Lens culinaris); Canadian Grain Commission Grain Research Laboratory: Winnipeg, MB, Canada, 2004; pp. 8–18. [Google Scholar]
  62. Barulina, H. Lentils of the U.S.S.R. and Other Countries (in Russian); Vsesoiuznaia akademiia sel’sko khoziaistvennyk im. Lenina: Leningrad, Russia, 1930; Volume 40, pp. 1–319. [Google Scholar]
  63. Solanki, I.S.; Kapoor, A.C.; Singh, U. Nutritional parameters and yield evaluation of newly developed genotypes of lentil (Lens culinaris Medik.). Plant Foods Hum. Nutr 1999, 54, 79–87. [Google Scholar]
  64. El-Adawy, T.A.; Rahma, E.H.; Eel-Bedawey, A.A.; El-Beltagy, A.E. Nutritional potential and functional properties of germinated mung bean, pea and lentil seeds. Plant Foods Hum. Nutr 2003, 58, 1–13. [Google Scholar]
  65. Sulieman, M. Physiochemical and Structural Characterization of Germinated and Cooked Lentils (Lens culinaris). Master’s Thesis, University of Khartoum, Khartom, Sudan, 2007. [Google Scholar]
  66. Wang, N.; Hatcher, D.W.; Toews, R.; Gawalko, E.J. Influence of cooking and dehuling on nutritional composition of several varieties of lentils (Lens culinaris). LWT Food Sci. Technol 2009, 42, 842–848. [Google Scholar]
  67. Devos, P. Nutritional Value of Lentils and Chickpeas and Changes during Processing. In “Herkes Için Mercimek” Sempozyumu (in Turkish); Toprak Mahsulleri Ofisi: Ankara, Turkey, 1988; pp. 186–196. [Google Scholar]
  68. Lim, T.K. Edible Medicinal and Non-Medicinal Plants; Springer: Berlin, German, 2012; Volume 2. [Google Scholar]
  69. Urbano, G.; Porres, J.M.; Frias, J.; Vidal-Valverde, C. Nutritional Value. In Lentil: An Ancient Crop for Modern Times; Yadav, S.S., McNeil, D., Stevenson, P.C., Eds.; Springer: Heidelberg, Germany, 2007; pp. 47–93. [Google Scholar]
  70. Wang, N.; Daun, J.K. Effects of variety and crude protein content on nutrients and anti-nutrients in lentils (Lens culinaris). Food Chem 2006, 95, 493–502. [Google Scholar]
  71. Grusak, M. Nutritional and Health-Beneficial Quality. In The Lentil: Botany, Production and Uses; Erskine, W., Muehlbauer, F., Sarker, A., Sharma, B., Eds.; CABI: Oxford, UK, 2009; pp. 368–390. [Google Scholar]
  72. FAO. Energy and Protein Requirements. Available online: http://www.fao.org/docrep/003/aa040e/aa040e00.htm (accessed on 19 December 2013).
  73. Lobo, V.; Patil, A.; Phatak, A.; Chandra, N. Free radicals, antioxidants and functional foods: Impact on human health. Pharmacogn. Rev 2010, 4, 118–126. [Google Scholar]
  74. Prior, R.; Cao, G. Analysis of botanicals and dietary supplements for antioxidant capacity: A review. J. AOAC Int 2000, 83, 950–956. [Google Scholar]
  75. Amarowicz, R.; Piskuła, M.; Honke, J.; Rudnicka, B.; Troszyńska, A.; Kozłowska, H. Extraction of phenolic compounds from lentil seeds (Lens culinaris) with various solvents. Pol. J. Food Nutr. Sci 1995, 4, 53–62. [Google Scholar]
  76. Amarowicz, R.; Estrella, I.; Hernández, T.; Dueñas, M.; Troszyńska, A.; Kosińska, A.; Ronald, B. Antioxidant activity of a red lentil extract and its fractions. Int. J. Mol. Sci 2009, 10, 5513–5527. [Google Scholar]
  77. Amarowicz, R.; Estrella, I.; Hernández, T.; Robredo, S.; Troszyńska, A.; Kosińska, A. Free radical-scavenging capacity, antioxidant activity, and phenolic composition of green lentil (Lens culinaris). Food Chem 2010, 121, 705–711. [Google Scholar]
  78. Scariot, V.; de Keyser, E.; Handa, T.; de Riek, J. Comparative study of the discriminating capacity and effectiveness of AFLP, STMS and EST markers in assessing genetic relationships among evergreen azales. Plant Breed 2007, 126, 207–212. [Google Scholar]
  79. Association of Official Analytical Chemists (AOAC), Official Methods of Analysis of AOAC International, 15th ed; AOAC: Washington, DC, USA, 1990.
  80. Association of Official Analytical Chemists (AOAC), Official Methods of Analysis of AOAC International, 16th ed; AOAC: Washington, DC, USA, 1995.
  81. Association of Official Analytical Chemists (AOAC), Official Methods of Analysis of AOAC International, 18th ed; AOAC: Washington, DC, USA, 2005.
  82. Xu, B.J.; Chang, S.K. A comparative study on phenolic profiles and antioxidant activities of legumes as affected by extraction solvents. J. Food Sci 2007, 72, S159–S166. [Google Scholar]
  83. Llorach, R.; Martínez-Sánchez, A.; Tomás-Barberán, F.A.; Gil, M.I.; Ferreres, F. Characterisation of polyphenols and antioxidant properties of five lettuce varieties and escarole. Food Chem 2008, 108, 1028–1038. [Google Scholar]
  84. Kakade, M.L.; Simons, N.; Liener, I.E. An evaluation of natural vs. synthetic substrate for measuring the antitryptic activity of soy bean samples. Cereal Chem 1969, 49, 518–526. [Google Scholar]
  85. Mohamed, A.; Perera, P.; Hafez, Y. New chromophore for phytic acid determination. Cereal Chem 1986, 63, 475–478. [Google Scholar]
  86. Price, M.L.; Socoyoc, S.V.; Butler, L.G. A critical evaluation of the vanillin reaction as an assay for tannin in sorghum grain. J. Agric. Food Chem 1978, 26, 1214–1218. [Google Scholar]
  87. Molecular Genetic Analysis of Populations, A Practical Approach, 2nd ed; Hoelzel, A.R. (Ed.) Oxford University Press: New York, NY, USA, 1998.
  88. Alghamdi, S.S.; Al-Faifi, S.A.; Migdadi, H.M.; Khan, M.A.; El-Harthy, E.H.; Ammar, M.H. Molecular diversity assessment using sequence related amplified polymorphism (SRAP) markers in Vicia Faba L. Int. J. Mol. Sci 2012, 13, 16457–16471. [Google Scholar]
  89. Wooten, J.A.; Tolley-Jordan, L.R. Validation of phylogenetic signals in amplified fragment length data: Testing the utility and reliability in closely related taxa. BMC Res. Notes 2009. [Google Scholar] [CrossRef]
  90. Jaccard, P. Nouvelles recherches sur la distribution florale. Bull. Soc. Vaud. Sci. Nat 1908, 44, 223–270. [Google Scholar]
  91. Rohlf, F.J. Ntsys-pc: Numerical Taxonomy and Multivariate Analysis System, Version 2.2; Exeter Publishing Ltd: New York, NY, USA, 2005. [Google Scholar]
Figure 1. SRAP markers electropherograms of six lentil genotypes using ME2/EM2 primer combination analyzed in the GeneMapper software (Applied Biosystems, Foster City, CA, USA).
Ijms 15 00277f1
Figure 2. Dendrogram of 35 lentil genotypes generated from Sequence-related amplified polymorphism SRAP markers by Jaccard’s coefficient and UPGMA clustering method. Similarity values are shown at bottom of dendrogram.
Ijms 15 00277f2
Figure 3. Dendrogram of 35 lentil genotypes generated from Amplified fragments length polymorphism AFLP markers by Jacc, ard’s coefficient and UPGMA (unweighted pair group method with arithmetic average) clustering method. Similarity values are shown at bottom of dendrogram.
Ijms 15 00277f3
Table 1. Mean, minimum and maximum values, standard deviation (SD) and coefficient of variability (CV) of vegetative and reproductive studied traits for combined data of the two seasons (2011 and 2012) for 35 lentil studied genotypes.
CharacterMeanSDMinMaxCV
Number of days to 50% flowering102.85.26861125.1
Number of days to 95% maturing135.84.66121.8142.63.4
Plant height (cm)312.342735.77.5
Number of branches/plant3.250.4972.44.315.2
Number of seeds/plant28.45.6418.842.619.8
Seed yield/plant1.090.2220.81.520.3
Table 2. Combined mean squares estimates for studied traits. S.O.V (source of variation); DF (Degrees of Freedom); No. (Number).
S.O.VDFNo. of Days to 50% FloweringNo. of Days to 95% MaturingPlant Height (cm)No. of BranchesNo. of Seeds/PlantSeed Yield/Plant (g)
Year (Y)12597.1 **5260.0 **6956.9 **3.55 ns6296.5 **7.13 **
Error415.710.314.11.21.20.04
Genotype (G)34166.2 **130.5 **33.0 **1.50 **191.6 **0.31 **
G × Y3414.9 ns20.8 **32.3 **0.47 ns46.9 ns0.06 ns
Error13617.511.414.90.634.60.07
**Highly significant (p < 0.001);
ns, not significant.
Table 3. Eigen values, individual and cumulative percentage variations and eigen vectors explained by four principal components based on morphological traits in 35 lentil genotypes.
ComponentsP1P2P3P4
Eigen value2.0341.4460.9970.881
Variability (%)33.89424.09216.61614.679
Cumulative (%)33.89457.98674.60289.281
Eigen Vectors
Days to 50% Flowering0.502−0.467−0.0490.24
Days to 95% Maturity0.571−0.3130.1390.235
Plant Height−0.028−0.3330.718−0.604
Number of Branches/Plant−0.0640.3610.6740.625
Number of Seeds/Plant0.4320.5030.073−0.271
Seed Yield/Plant0.4810.436−0.048−0.239
Table 4. Mean, minimum values, maximum values, standard deviation (SD) and coefficient of variability (CV) of proximate analysis in lentil genotypes (on dry weight basis).
VariableMeanSDCVMinMax
Crude protein (%)27.3461.2734.6625.329.3
Moisture (%)12.6310.443.4911.613.6
Ash (%)2.600.1154.422.392.89
Fats (%)0.99910.12112.110.721.19
Carbohydrate (%)43.9972.2155.0339.547.1
Essentials Amino Acids (g/kg)
Leu8.6430.7979.226.89.8
Ile4.5690.63613.923.45.6
Phe6.3890.87513.74.98.2
Try0.79090.09111.50.610.92
His4.840.6313.023.66.1
Val7.3890.99113.425.39
Thr6.0111.08718.084.17.9
Met1.50310.312720.80.852.1
Lys7.3091.01813.944.58.6
Arg8.5261.00111.746.610
Minerals (mg/100 g)
Ca74.924.4335.9264.984.8
P412.466.516.13286.9546.7
K886.199.611.24674.41061.2
Mg138.586.985.04126.1157.3
Fe7.44830.44555.986.578.57
Mn1.53170.381824.921.262.85
Cu1.13370.161714.260.861.37
Zn3.77770.480912.732.634.51
Antioxidants
TPC a (mg GAE/g)13.4674.54633.766.4520.82
TFC b (mg QE/g)6.031.3822.894.128.92
DPPH c (μg/g)15.0923.03620.1210.6123.26
Anti-nutritional Factors
Protease inhibitors (mg/g)2.52340.18477.322.082.78
Tannins (mg/g)0.68460.0689.930.520.79
Phytic acids (mg/g)0.9280.09089.790.721.09
aTotal phenolic components calculated as galic acid equivalent/g seed;
btotal flavenoid content (mg Quercetin Equivalent/g seed);
c2-diphenyl-1-picryl hydrazyl radical (μg/g).
Table 5. Summary of sequence-related amplified polymorphism (SRAP) and amplified fragments length polymorphism (AFLP) primers combinations results. PIC: polymorphic information content.
SRAPAFLP


Primer CombinationTotal FragmentsPolymorphic FragmentsPolymorphism Rate (%)PICPrimer CombinationTotal FragmentsPolymorphic FragmentsPolymorphism Rate (%)PIC
ME1/EM11321321000.924ECT/MCTG5695691000.968
ME1/EM23933931000.964ETA/MCTC3753751000.957
ME2/EM33993991000.963ETC/MCTA5835831000.963
ME2/EM41241241000.908ECC/MCCT98981000.894
ME2/EM57087081000.970Total1625---
ME2/EM6113811381000.984Mean406.25---
Total (Mean)2894 (482)--------
Table 6. Pedigree and origin of 35 introduced lentil genotypes used. ICARDA: International Center for Agricultural Research in Dry Areas.
GenotypePedigreeOrigin
ILL 3375ILL 3375India
FLIP2009-50LILL 8090 × ILL 7685ICARDA
FLIP 2009-51LILL 7617 × ILL 4404ICARDA
FLIP 2009-52LILL 5883 × ILL 8113ICARDA
FLIP 2009-54LILL 7012 × ILL 4404ICARDA
FLIP 2009-55LILL 6783 × ILL 98ICARDA
FLIP 2009-56LILL 8077 × ILL 6994ICARDA
FLIP 2009-64L-ICARDA
FLIP 2009-68LILL 7713 × ILL 7201ICARDA
FLIP 2009-69LILL 790 × ILL 7706ICARDA
FLIP 2009-70LILL 7537 × ILL 4404ICARDA
FLIP 2010-91LILL 8114 × ILL 7555ICARDA
FLIP 2010-94LILL 7620 × ILL 8113ICARDA
FLIP 2010-95LILL 7620 × ILL 8113ICARDA
FLIP 2010-96LILL 7620 × ILL 8113ICARDA
FLIP 2010-97LILL 7620 × ILL 8113ICARDA
FLIP 2010-99LILL 7620 × ILL 8113ICARDA
FLIP2010-100LILL 2501 × ILL 7537ICARDA
FLIP 2010-101LILL 2501 × ILL 7537ICARDA
FLIP 2010-102LILL 4402 × ILL 2501ICARDA
FLIP 2010-103LILL 358 × ILL 87062ICARDA
FLIP 2010-104LILL 6037 × ILL 87062ICARDA
FLIP 2010-105LILL 7723 × ILL 87062ICARDA
FLIP 2010-106LILL 7723 × ILL 87062ICARDA
FLIP 2011-43LILL 7537 × ILL 590ICARDA
FLIP 2011-51LILL 590 × ILL 7979ICARDA
FLIP 2011-52LILL 7010 × ILL 6971ICARDA
FLIP 2011-54LILL 8090 × ILL 7980ICARDA
FLIP 2011-55LILL 8090 × ILL 7980ICARDA
FLIP 2011-56LILL 8090 × ILL 7980ICARDA
FLIP 2011-57LILL 8090 × ILL 7980ICARDA
ILL 1097496-024L × 99H046Australia
ILL 1097597-011 × 98H006-99HS001Australia
FLIP 2011-60LILL7723 × ILL8090ICARDA
FLIP 2011-61LILL7537 × ILL590ICARDA
---
Table 7. Name and sequence of SRAP primers used.
Primer nameForward 5′–3′Primer nameReverse 5′–3′
ME1TGAGTCCAAACCGGATAEM1GACTGCGTACGAATTAAT
ME2TGAGTCCAAACCGGAGCEM2GACTGCGTACGAATTTGC
ME3TGAGTCCAAACCGGAATEM3GACTGCGTACGAATTGAC

