Article

Combinatorial Measurement of CDKN1A/p21 and KIF20A Expression for Discrimination of DNA Damage-Induced Clastogenicity

1
Developmental Research Laboratories, Shionogi & Co., Ltd., 3-1-1 Futaba-cho, Toyonaka, Osaka 561-0825, Japan
2
Department of Veterinary Science, Graduate School of Life and Environmental Sciences, Osaka Prefecture University, 1-58 Rinkuu Ourai Kita, Izumisano, Osaka 598-8531, Japan
*
Author to whom correspondence should be addressed.
Int. J. Mol. Sci. 2014, 15(10), 17256-17269; https://doi.org/10.3390/ijms151017256
Submission received: 1 July 2014 / Revised: 1 September 2014 / Accepted: 9 September 2014 / Published: 26 September 2014

Abstract

:
In vitro mammalian cytogenetic tests detect chromosomal aberrations and are used for testing the genotoxicity of compounds. This study aimed to identify a supportive genomic biomarker could minimize the risk of misjudgments and aid appropriate decision making in genotoxicity testing. Human lymphoblastoid TK6 cells were treated with each of six DNA damage-inducing genotoxins (clastogens) or two genotoxins that do not cause DNA damage. Cells were exposed to each compound for 4 h, and gene expression was comprehensively examined using Affymetrix U133A microarrays. Toxicogenomic analysis revealed characteristic alterations in the expression of genes included in cyclin-dependent kinase inhibitor 1A (CDKN1A/p21)-centered network. The majority of genes included in this network were upregulated on treatment with DNA damage-inducing clastogens. The network, however, also included kinesin family member 20A (KIF20A) downregulated by treatment with all the DNA damage-inducing clastogens. Downregulation of KIF20A expression was successfully confirmed using additional DNA damage-inducing clastogens. Our analysis also demonstrated that nucleic acid constituents falsely downregulated the expression of KIF20A, possibly via p16 activation, independently of the CDKN1A signaling pathway. Our results indicate the potential of KIF20A as a supportive biomarker for clastogenicity judgment and possible mechanisms involved in KIF20A downregulation in DNA damage and non-DNA damage signaling networks.

1. Introduction

In vitro mammalian cytogenetic tests detect chromosomal aberrations in cultured mammalian cells, and are, thus, used for testing the genotoxicity of compounds. However, false positive results associated with excessive toxicity frequently occur in these tests [1]. Therefore, there is a growing demand for mechanism-based follow-up assays to confirm positive results from cytogenetic tests. In a previous study [2], we applied a toxicogenomic approach to establish a classification tool based on clastogenic mechanisms. Human lymphoblastoid TK6 cells were treated with each of eight different genotoxins, including six DNA damage-inducing genotoxins (clastogens) and two genotoxins that do not cause DNA damage. The following six DNA damage-inducing clastogens were included: two cross-linking compounds (mitomycin C: MMC and cisplatin: CP) and alkylating compounds (methyl methanesulfonate: MMS and ethyl methanesulfonate: EMS), a topoisomerase II inhibitor (etoposide: ETOP), and an antimetabolite (hydroxyurea: HU) targeting DNA synthesis. The following genotoxins that do not induce DNA damage were included: a mitotic spindle inhibitor (colchicine: COLCH) and a DNA nucleoside (adenine: ADE) that induces chromosomal aberrations in a secondary manner. Cells were exposed to each compound for 4 h, and gene expression was comprehensively examined using Affymetrix U133A microarrays. Toxicogenomics data analysis identified cyclin-dependent kinase inhibitor 1A (CDKN1A)-centered interactome as the most significant network, based on significantly-altered discriminative genes of DNA damage; moreover, CDKN1A was reported the top-ranked gene for correct classification. Our previous study also suggested that CDKN1A could be used as a biomarker for discriminating chromosomal aberrations that result from DNA damage from other types of chromosomal aberrations. Therefore, CDKN1A expression in TK6 cells could be used as a follow-up assay for validating positive results from mammalian cytogenetic tests. However, we need to pay attention during the actual decision-making process because CDKN1A expression is affected by the cytotoxic condition, as shown in the previous report. Mechanistically, CDKN1A expression is tightly controlled by the DNA damage-responsive gene p53, and upregulation of CDKN1A is reported to be affected by various factors, such as apoptosis [3], antioxidative effects [4], and a number of transcription factors [5]. Moreover, in the previous study, CDKN1A upregulation was also observed on treatment with several compounds that do not cause DNA damage; however, the extent of upregulation was lower than the optimal threshold. Identification of optimal doses and cell sampling conditions is therefore required for minimizing the risk of misclassification when applying CDKN1A as a biomarker for discriminating chromosomal aberrations. Further efforts are also warranted for minimizing risk that could lead to misjudgments, particularly when the application of this tool across multiple facilities is considered. In the present study, we hypothesized that a combinatorial measurement of the expression of multiple genes could minimize the risk of misjudgments and aid appropriate decision making. Although the previous study focused only on CDKN1A as the top-ranked among all genes with significantly altered expression, several characteristic alterations were observed in the expression of genes included in CDKN1A-centered network. The current study highlights the potential of downregulated genes as supportive biomarkers for interpreting the biological significance of CDKN1A upregulation and for facilitating correct classification.

2. Results and Discussion

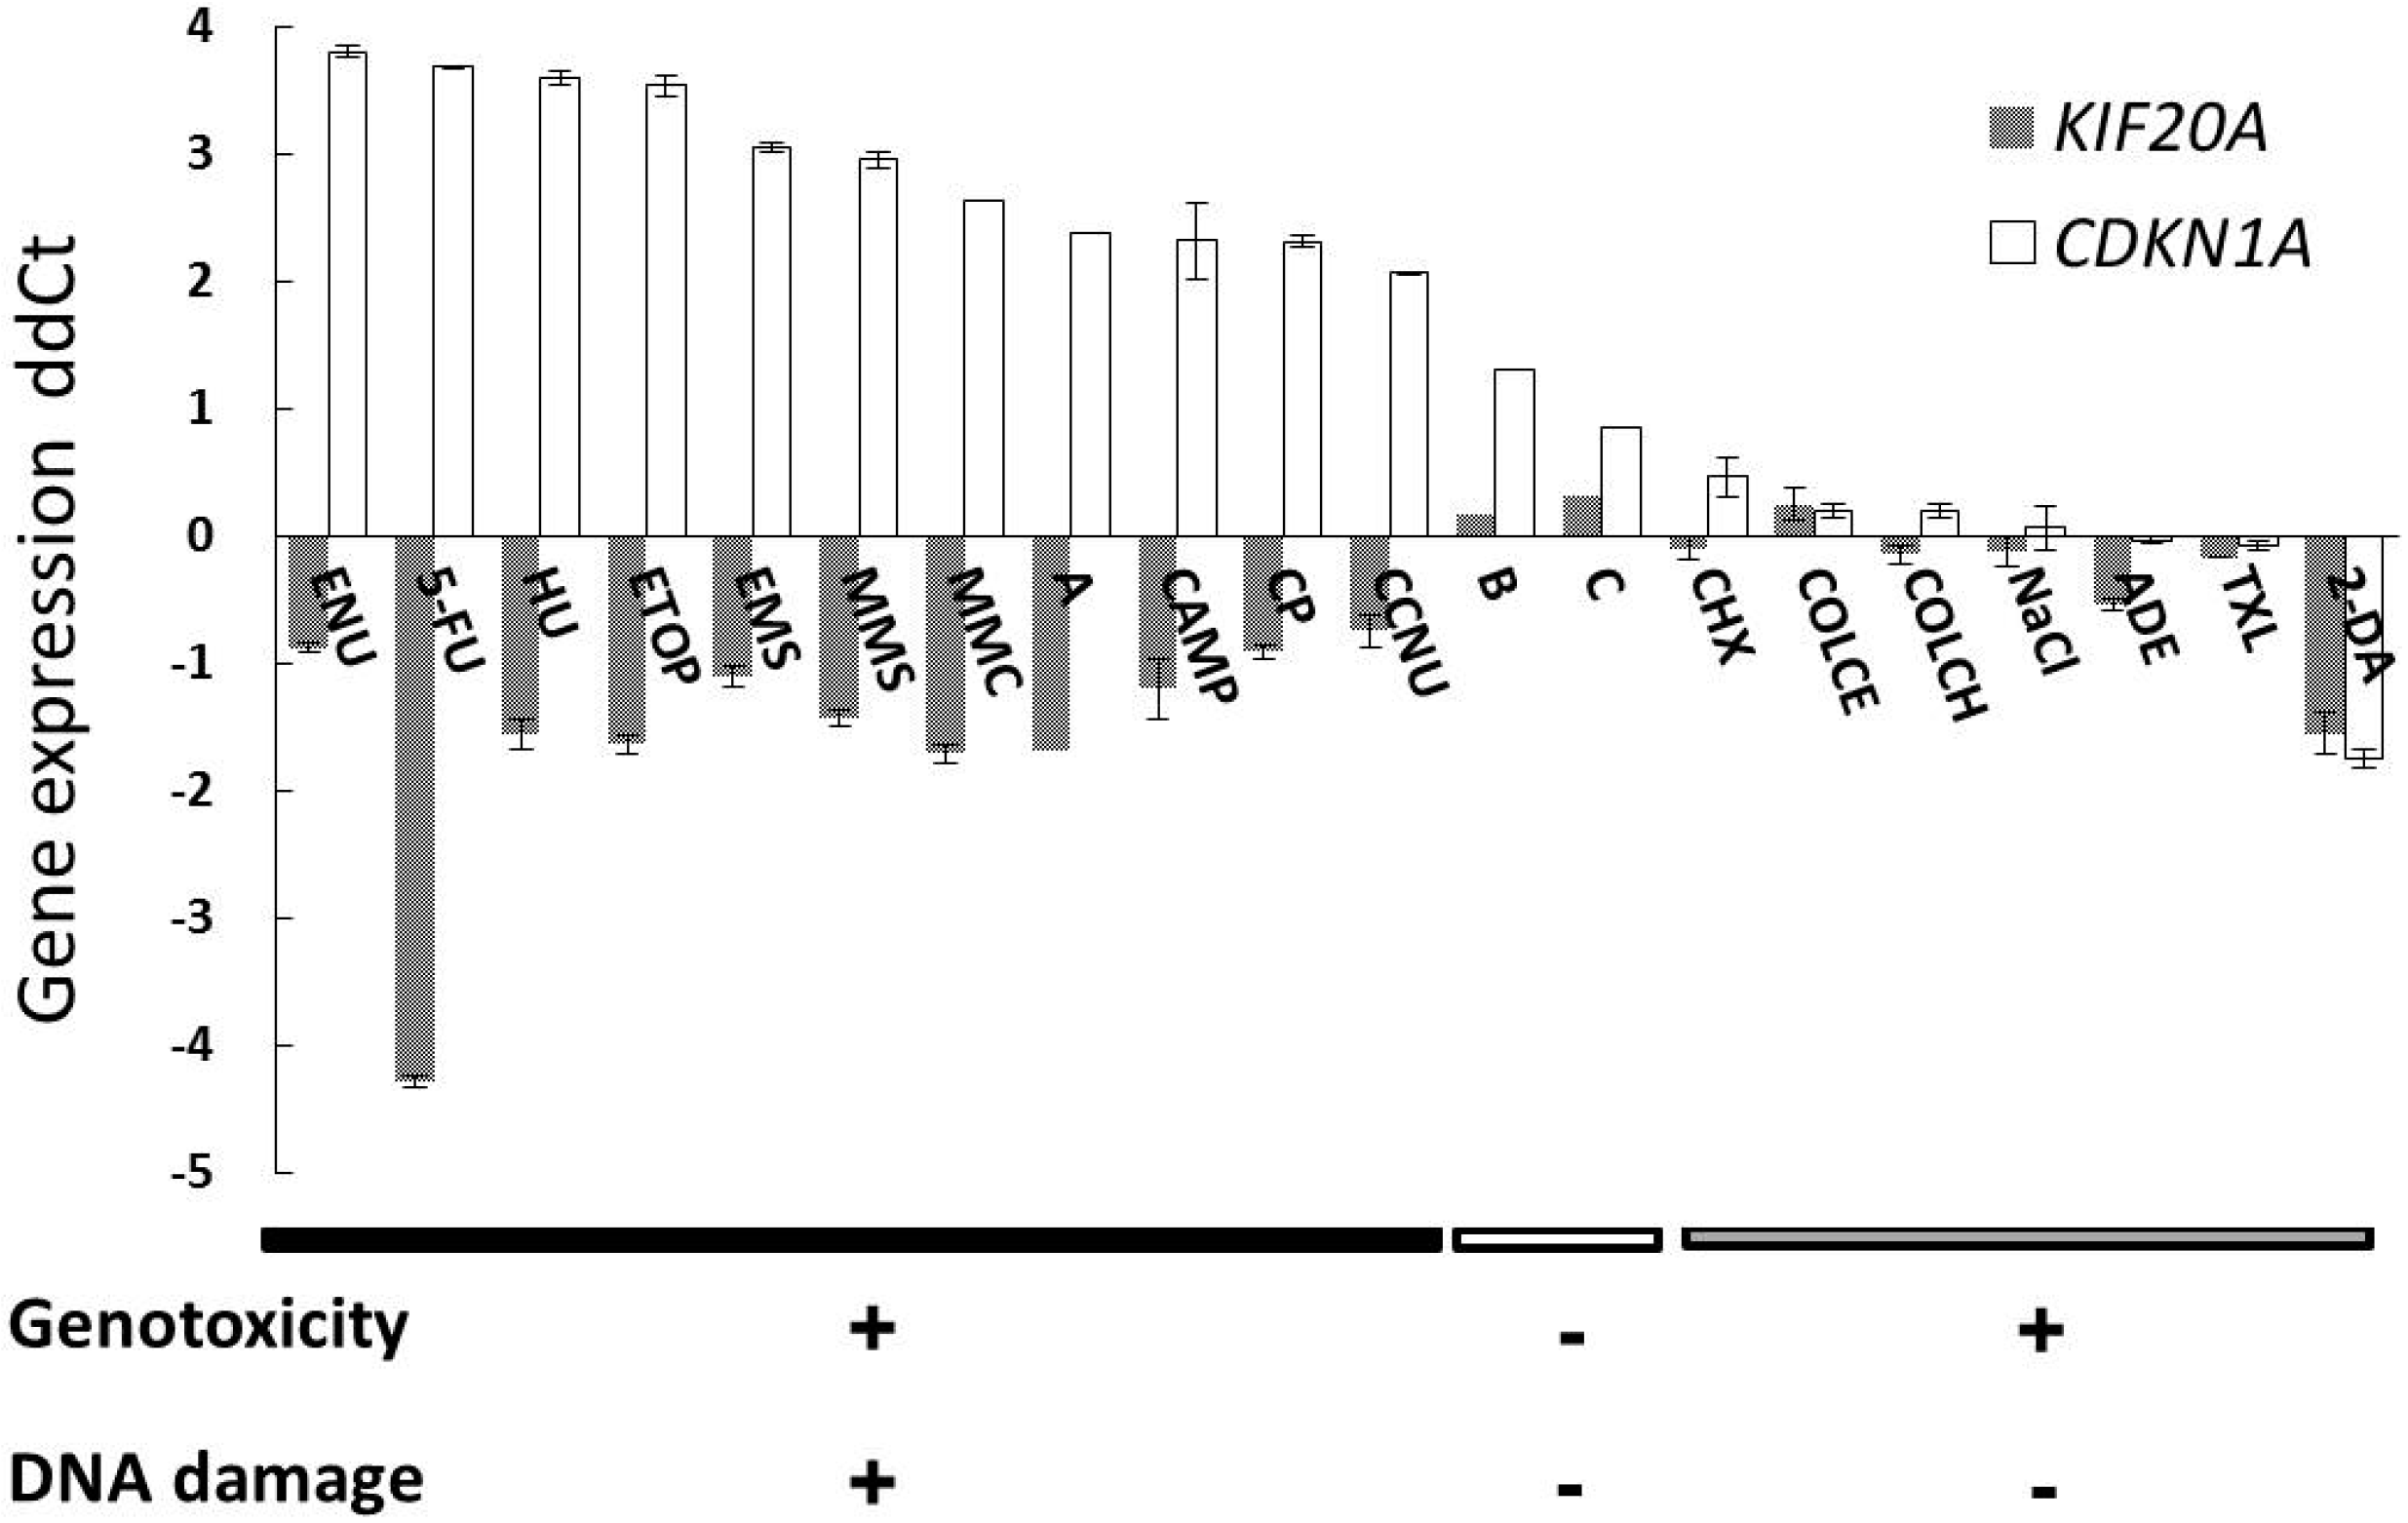
2.1. Gene Expression Profile of a Newly Selected Candidate Biomarker, KIF20A

The Human HG-U133A DNA microarray, which contains 22,000 probes, was used for performing a comprehensive analysis of gene expression in TK6 cells, individually treated with the eight genotoxins, including six DNA damage-inducing genotoxins (clastogens) and two genotoxins that do not cause DNA damage, as shown previously [2]. Of the genes involved in CDKN1A-centered network, which was revealed as the most significant network by a functional network analysis [2], four genes, ataxin 1 (ATXN1), KIF20A, Kruppel-like factor 6 (KLF6), and HMG-box transcription factor 1 (HBP1), were downregulated on treatment with DNA damage-inducing compounds. Figure 1 shows the log base 2 values of the ratio of alterations in the expression of these four genes to the means of the corresponding control. The only gene that showed consistent downregulation on treatment with all the DNA damage-inducing clastogens was KIF20A.
Figure 1. Expression profiles of four genes on treatment with the genotoxins used in microarray analysis. The genes ATXN1, KIF20A, KLF6, and HBP1, which are a part of CDKN1A-centered network, were downregulated in response to DNA damage. The log base 2 values of the ratio of alterations in the expression of these four downregulated genes to the mean values of the corresponding control obtained from the microarray data (single experiment in duplicate) are shown. TK6 cells were treated with MMC, mitomycin C; CP, cisplatin; MMS, methyl methanesulfonate; EMS, ethyl methanesulfonate; ETOP, etoposide; HU, hydroxyurea; COLCH, colchicine; and ADE, adenine; for 4 h at concentrations corresponding to 50% of relative cell growth (RCG) compared to number of cells in vehicle control, and allowed to recover for 20 h in standard cell culture medium.
Ijms 15 17256 g001
To validate the potential of KIF20A as a biomarker for clastogenic damage, TK6 cells were treated with nine test compounds, including four DNA damage-inducing clastogens (an alkylating compound, N-ethyl-N-nitrosourea: ENU; a cross-linking compound, 1-(2-chloroethyl)-3-cyclohexyl-1-nitrosourea: CCNU; a topoisomerase I inhibitor, camptothecin: CAMP; and an antimetabolite targeting DNA synthesis, 5-fluorouracil: 5-FU) and five genotoxins that do not induce DNA damage (mitotic spindle inhibitors, paclitaxel: TXL and colcemid: COLCE; a DNA precursor, 2-deoxyadenosine: 2-DA; an inhibitor of protein synthesis, cycloheximide: CHX; and a compound that affects osmolality, sodium chloride: NaCl). Furthermore, three newly-synthesized drug candidates (compounds A, B, and C), which induced 10% (positive), 0% (negative), and 2% (negative) chromosomal aberrations to the cells, respectively, were also used as test compounds. In the in vitro chromosomal aberration test, compounds for which ≥10% of the cells were aberrant were categorized as positive. In addition to these twelve test compounds, compounds examined by microarray analysis were also assessed by quantitative RT-PCR analysis (QPCR).
Table 1. A list of compounds used in the validation study.
DNA Damage ClassCompounds aMechanismConcentration (μg/mL)RCG b (%)
PositiveMMCCross-link [6]147.5
CPCross-link [7]1052.7
MMSAlkylate [8]4042.9
EMSAlkylate [8]120047.8
ETOPTopoisomerase II inhibitor [9]140.5
HUAntimetabolite in DNA synthesis [10]250041.3
ENUAlkylate [8]12544.6
CCNUCross-link [11]1054.4
CAMPTopoisomerase I inhibitor [12]0.00557.0
5-FUAntimetabolite in DNA synthesis [13]2546.0
APositive in the CA test c20450.3
NegativeCOLCHMitotic spindle inhibitor [14]0.0442.7
ADEDNA precursor [15]140044.2
TXLMitotic spindle inhibitor [16]0.2554.5
COLCEMitotic spindle inhibitor [17]1037.9
2-DADNA precursor [15]400058.5
CHXInhibitor of protein synthesis [18]80052.3
NaCl dOsmolality change [19]0.80%47.1
BNegative in the CA test c34648.5
CNegative in the CA test c34649.8
a MMC, mitomycin C; CP, cisplatin; MMS, methyl methanesulfonate; EMS, ethyl methanesulfonate; ETOP, etoposide; HU, hydroxyurea; ENU, N-ethyl-N-nitrosourea; CCNU, 1-(2-chloroethyl)-3-cyclohexyl-1-nitrosourea; CAMP, camptothecin; 5-FU, 5-fluorouracil; COLCH, colchicines; ADE, adenine; TXL, paclitaxel; COLCE, colcemid; 2-DA, 2-deoxyadenosine; CHX, cycloheximide; NaCl, sodium chloride; A, B, C, newly-synthesized compounds. All compound solutions contain DMSO (1% v/v); b RCG, relative cell growth indicated as relative number of cells compared to vehicle control; c CA test, In vitro chromosomal aberration test; and d 10% (v/v) NaCl was used. Sterilized water was used as vehicle control.
QPCR was used for examining alterations in KIF20A expression; the treatment concentrations were set at approximately 50% of relative cell growth (RCG50) compared to number of cells in vehicle control (Table 1), and shown in parallel with CDKN1A (Figure 2). KIF20A was downregulated in TK6 cells treated with all the DNA damage-inducing clastogens, including compound A; however, it was also downregulated by nucleic acid constituents such as ADE and 2-DA that do not induce DNA damage. Treatment with the compounds B and C, which are negative for clastogenicity, did not alter KIF20A expression, while CDKN1A expression was moderately upregulated (ddCt = 1.30 and 0.85, respectively).
Figure 2. Validation of expression alterations in KIF20A in parallel with CDKN1A. Quantitative RT-PCR for analysis of gene expression alterations induced in TK6 cells after treatment for 4 h with three groups of compounds: (i) DNA damage-inducing genotoxins (clastogens); (ii) compounds that do not induce chromosomal aberrations; and (iii) genotoxins that do not involve DNA damage. Compound group (i) includes ENU, N-ethyl-N-nitrosourea; 5-FU, 5-fluorouracil; HU, hydroxyurea; ETOP, etoposide; EMS, ethyl methanesulfonate; MMS, methyl methanesulfonate; MMC, mitomycin C; CAMP, camptothecin; CP, cisplatin; CCNU, 1-(2-chloroethyl)-3-cyclohexyl-1-nitrosourea; and a newly-synthesized drug candidate (designated A) positive in the in vitro chromosomal aberration test. Compound group (ii) includes two newly-synthesized drug candidates (designated B and C) negative in the in vitro chromosomal aberration test. Compound group (iii) includes CHX, cycloheximide; COLCE, colcemid; COLCH, colchicines; NaCl, sodium chloride; ADE, adenine; TXL, paclitaxel; and 2-DA, 2-deoxyadenosine. The means ± standard deviation (SD) of cycle threshold (Ct) values were shown (single experiment in duplicate).
Ijms 15 17256 g002

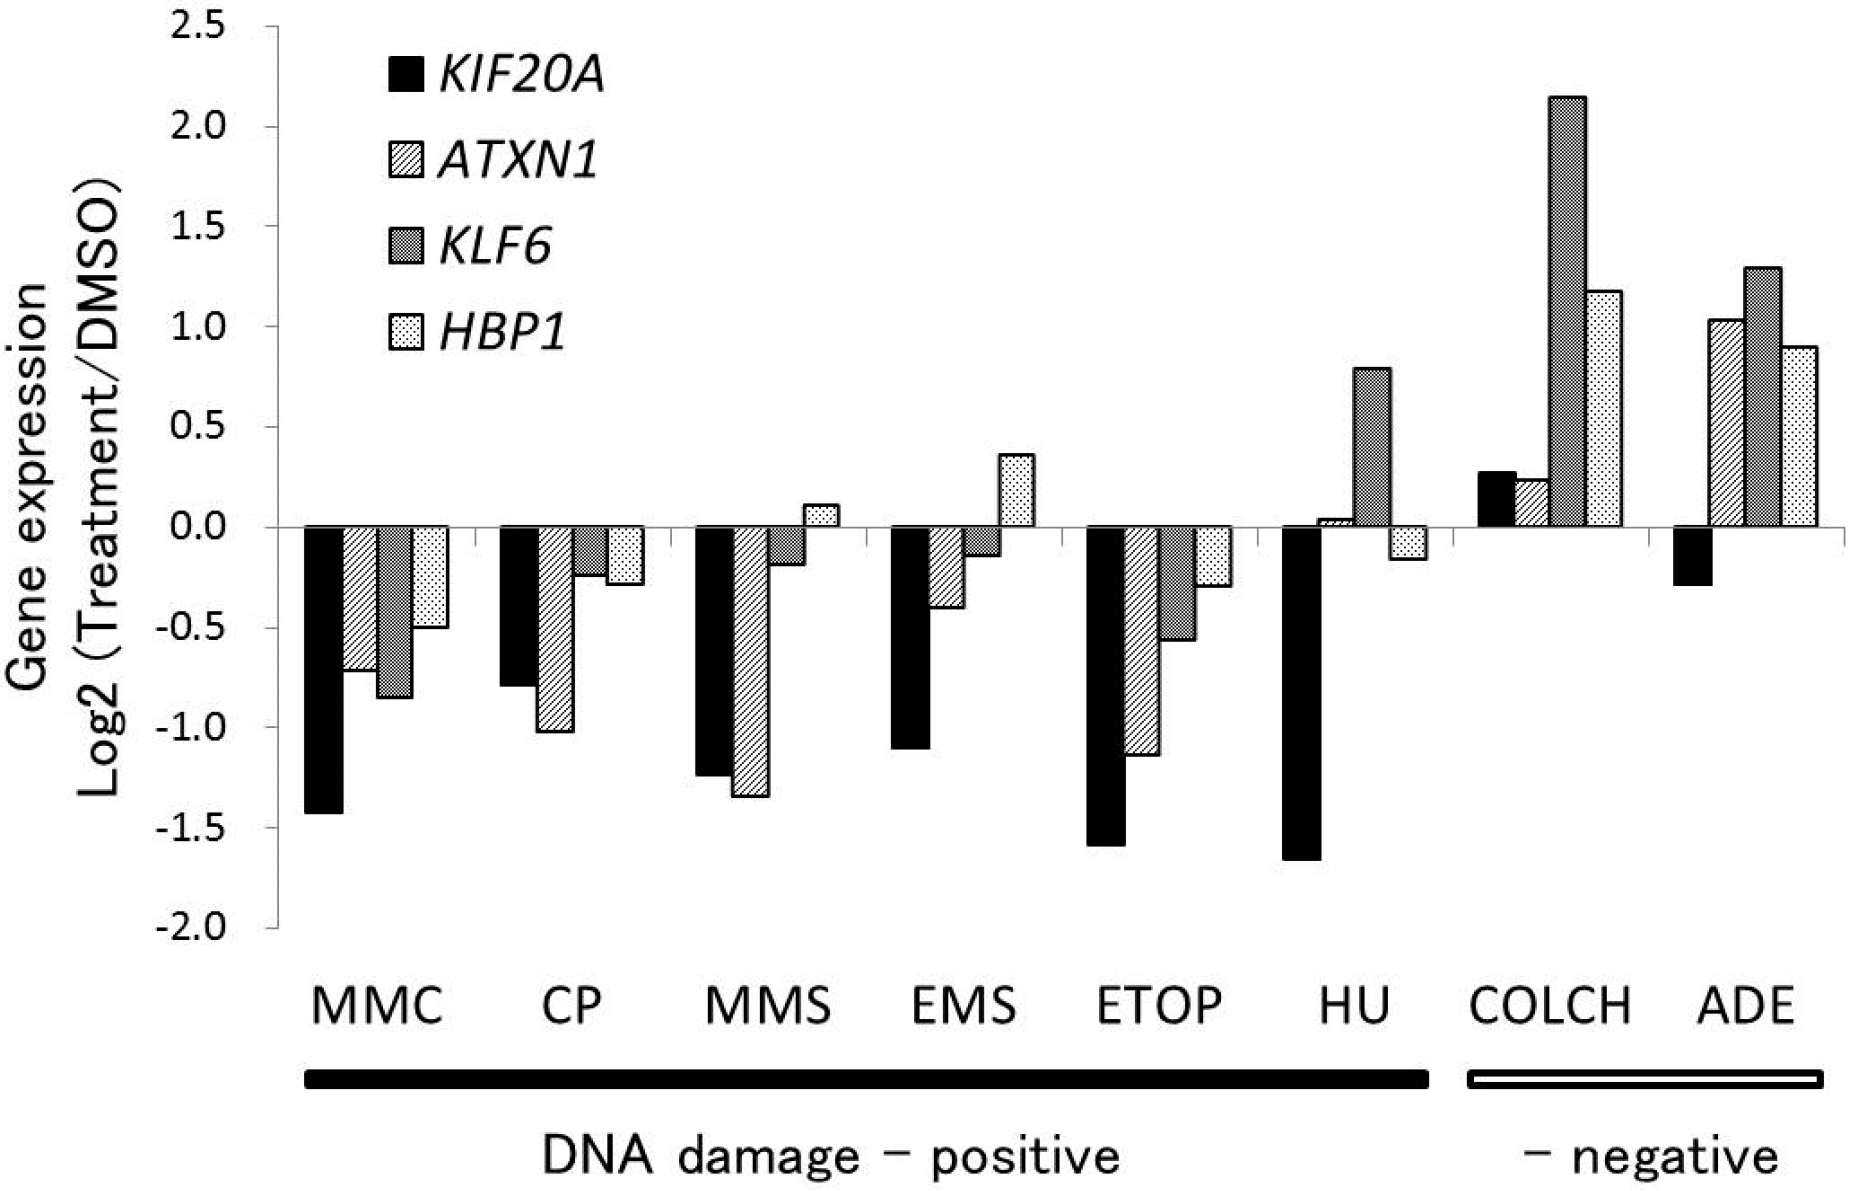
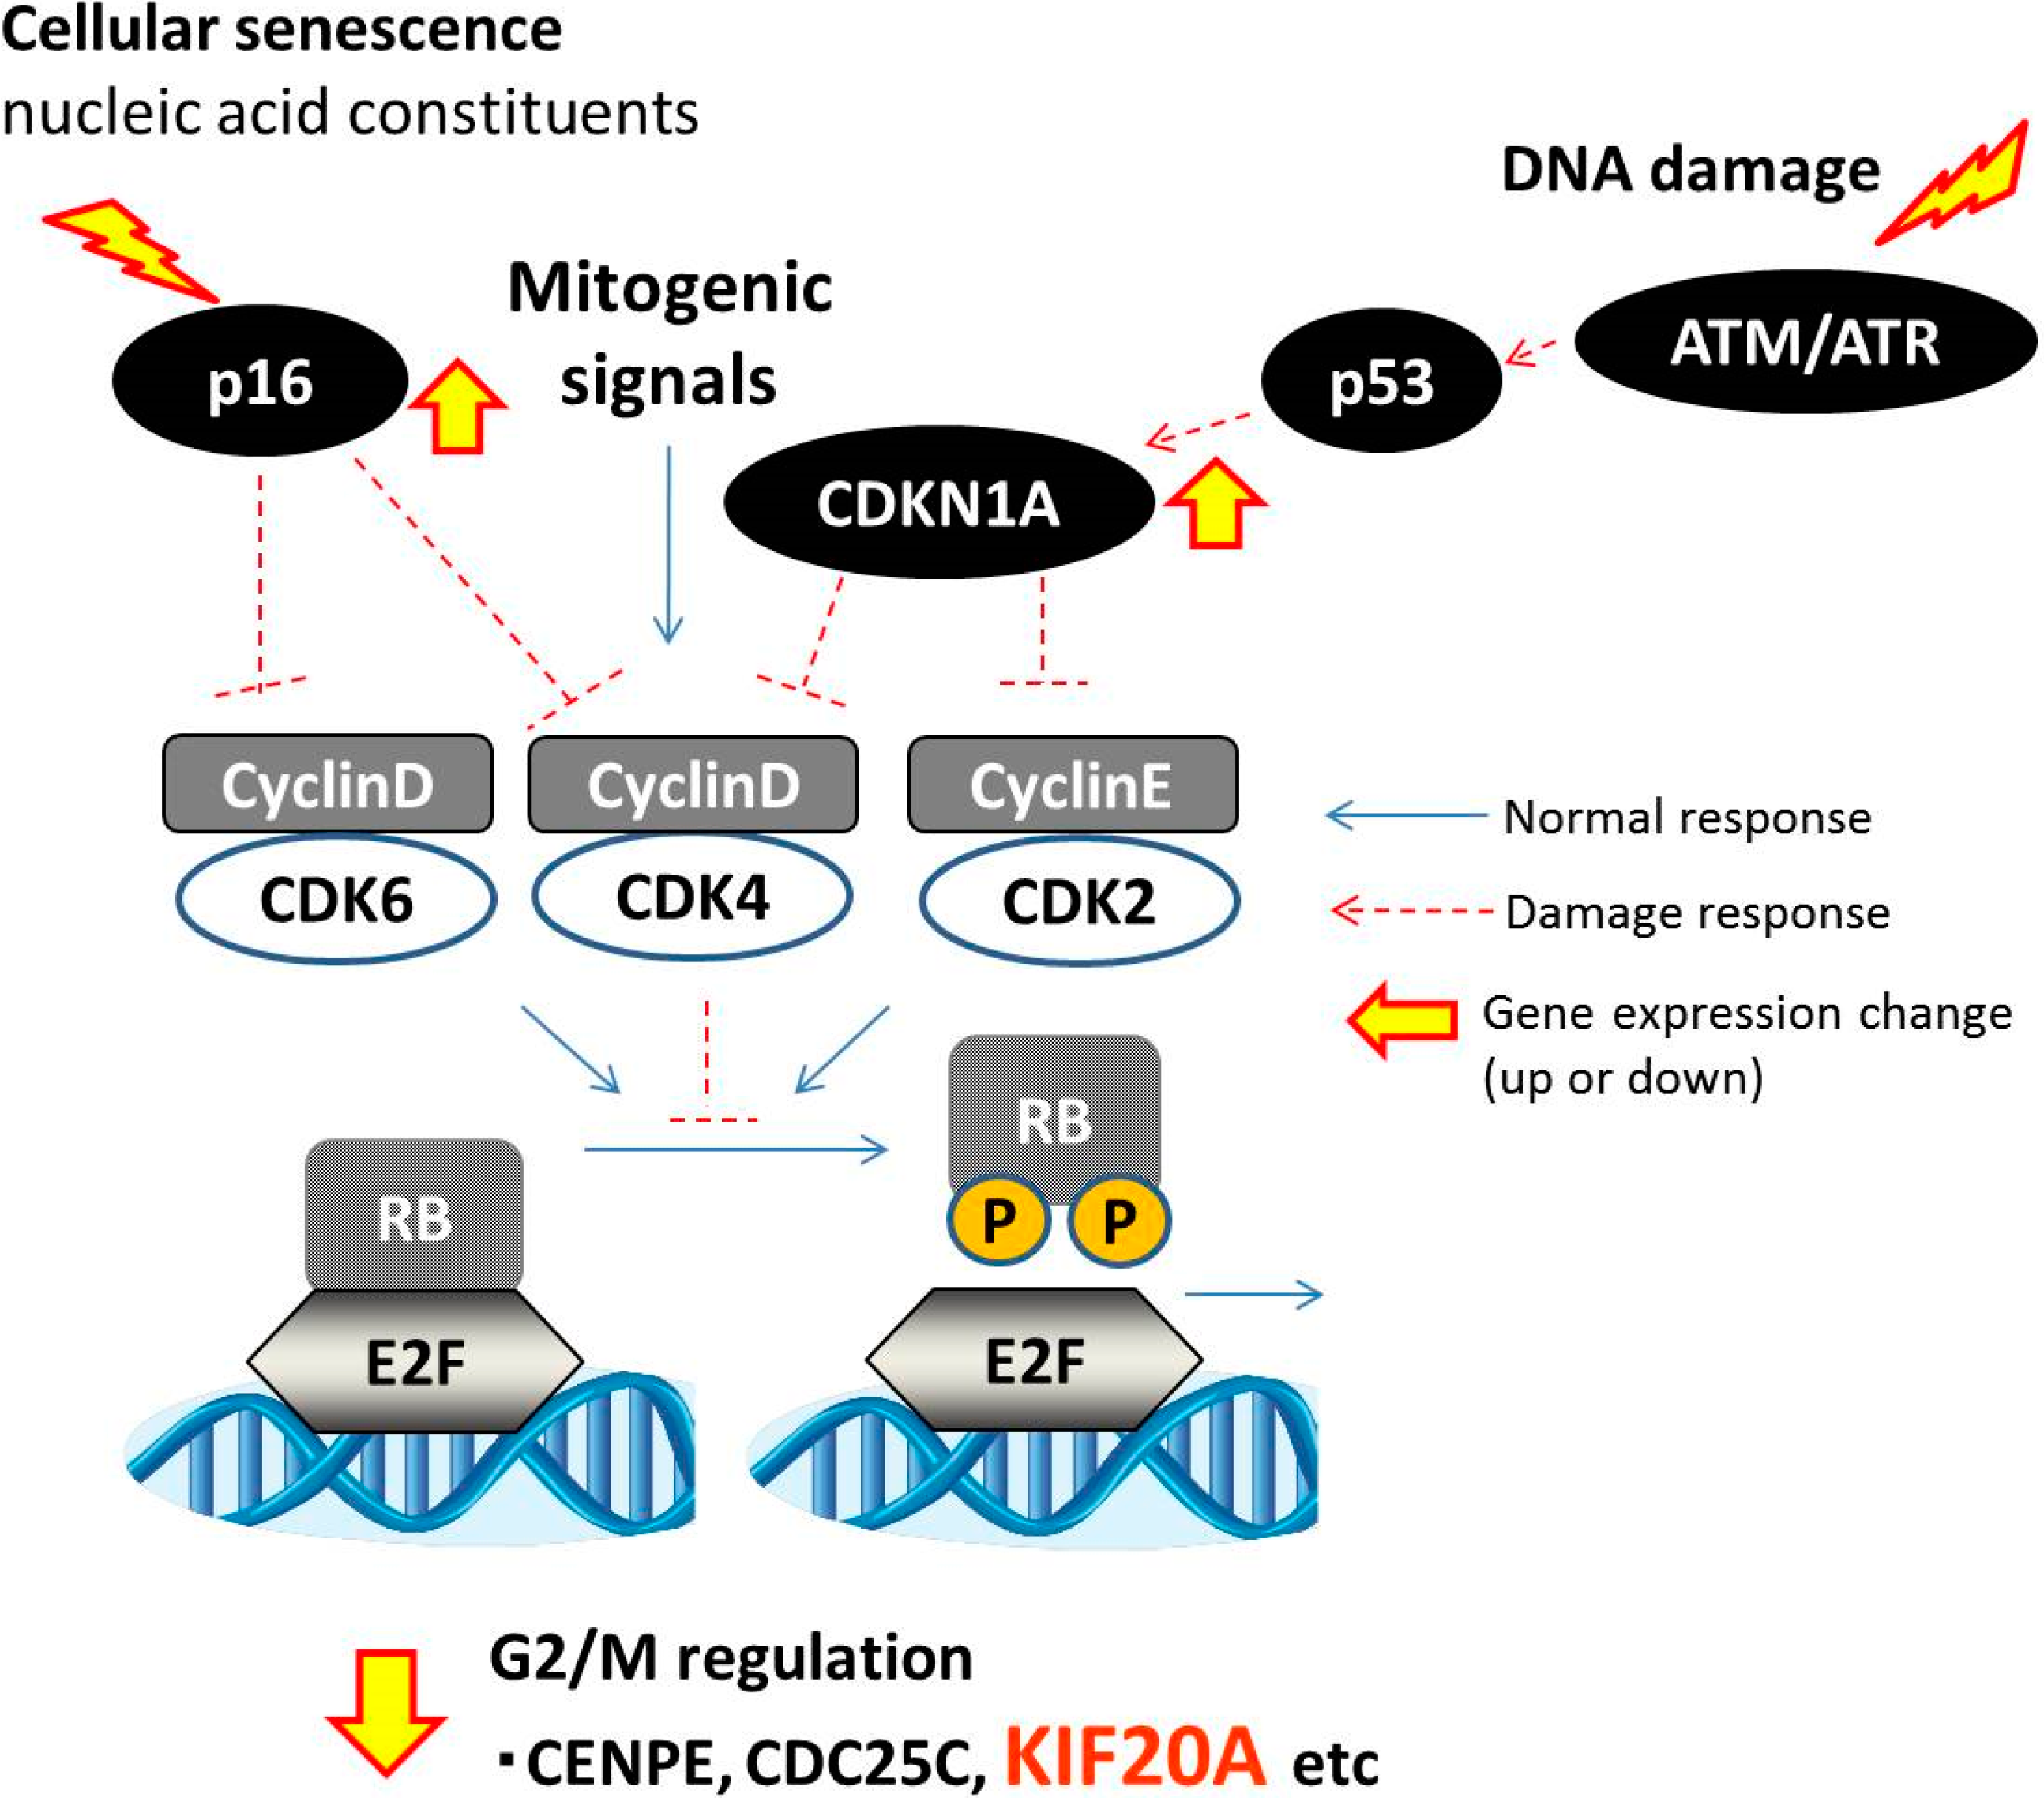
2.2. Expression Changes of Retinoblastoma (RB)/E2 Promoter Binding Factor (E2F) Regulatory Genes

The retinoblastoma (RB)/E2 promoter binding factor (E2F) pathway plays a key role in cell cycle progression from G1 to S phases, and also regulates the G2/M checkpoint [20,21]. As a result, RB-defective cells do not undergo G2/M arrest in response to a DNA damage-inducing stimulus [20], while the ectopic overexpression of E2F family proteins induces many genes involved in mitosis [21]. CDKN1A, which is DNA-damage responsive, is a potent cyclin-dependent kinase inhibitor which binds to and inhibits cyclin/CDK2 or CDK4 complexes [22], and, thus, acts as a regulator of cell cycle progression through RB/E2F pathway [23].
To clarify the relation of RB/E2F pathway and KIF20A expression change, microarray data of RB/E2F regulatory G2/M-related eight genes, CENPE, CDC25C, CDCA8, KIF11, ECT2, NEK2, CCNA2, KIF18A [20], were shown in Table 2. As a result, RB/E2F regulatory genes related to G2/M cell cycle were downregulated by all the DNA-damaging clastogens (MMC, MMS, ETOP, HU, EMS, and CP). This result suggests that RB/E2F pathway is downregulated in response to DNA damage, leading to G2/M mitotic cell cycle arrest.
Table 2. Expression change of RB/E2F regulatory genes related to G2/M cell cycle.
Gene SymbolProbe Set IDlog2 (MMC/D)log2 (MMS/D)log2 (ETOP/D)log2 (HU/D)log2 (EMS/D)log2 (CP/D)log2 (ADE/D)
CCNA2203418_at−0.345−0.463−0.602−0.635−0.680−0.305−0.771
CCNA2213226_at−0.358−0.334−0.671−0.602−0.429−0.221−0.540
CDC25C205167_s_at−0.961−0.403−0.696−0.657−0.354−0.735−1.963
CDC25C217010_s_at−0.506−0.411−0.615−0.402−0.597−0.509−1.454
CDCA8221520_s_at−0.653−0.415−0.930−0.728−0.498−0.547−1.130
CENPE205046_at−1.389−1.107−1.968−1.414−0.917−0.637−1.610
ECT2219787_s_at−0.607−0.651−1.033−0.881−0.574−0.642−1.526
KIF11204444_at−0.486−0.325−0.729−0.035−0.349−0.409−0.951
KIF18A221258_s_at−1.037−0.571−1.125−0.395−0.750−0.873−2.083
NEK2204641_at−0.832−0.500−1.186−0.861−0.436−0.394−0.602
NEK2211080_s_at−0.780−0.881−1.230−0.948−0.647−0.400−1.668
Shown are the log base 2 value of the ratio of alternations in the expression of eight genes to the mean of the corresponding control, DMSO. MMC, mitomycin C; MMS, methyl methanesulfonate; ETOP, etoposide, HU, hydroxyurea; EMS, ethyl methanesulfonate; CP, cisplatin; and ADE, adenine.
KIF20A has been reported to strongly bind E2F [24], and its expression is regulated by E2F [25]. KIF20A has been reported to be a microtubule-associated motor protein, essential for chromosome segregation and mitosis [26] and for integrating cell cycle progression with the G2/M checkpoint [27]. Taken together, the evidence suggests that KIF20A downregulation is involved in the downregulation of RB/E2F pathway as a downstream signal of CDKN1A upregulation, resulting in G2/M checkpoint activation in response to DNA damage. Furthermore, these DNA damage-related genes would serve as key biomarkers for the discrimination of DNA damage-inducing clastogenicity.
For the actual application of the newly-identified biomarker, KIF20A, as a supporting tool for the discrimination of DNA damage-inducing clastogenicity, we examined the compounds B and C, which tested negative in the chromosomal aberration test. These two compounds resulted in moderate CDKN1A upregulation (ddCt = 1.30 and 0.85, respectively) but not KIF20A downregulation. DNA double strand breaks, if left unrepaired, could lead to clastogenicity [28], and the resulting DNA imperfections induced by DNA damage-inducing clastogens could activate the G2/M checkpoint. This, in turn, suggested that the compounds B and C (which were negative for chromosomal aberration) did not induce G2/M arrest. Taken together, the data strongly supports the notion that KIF20A downregulation in relation to the G2/M checkpoint greatly enhances the ability for discrimination based on DNA damage-responsible CDKN1A.

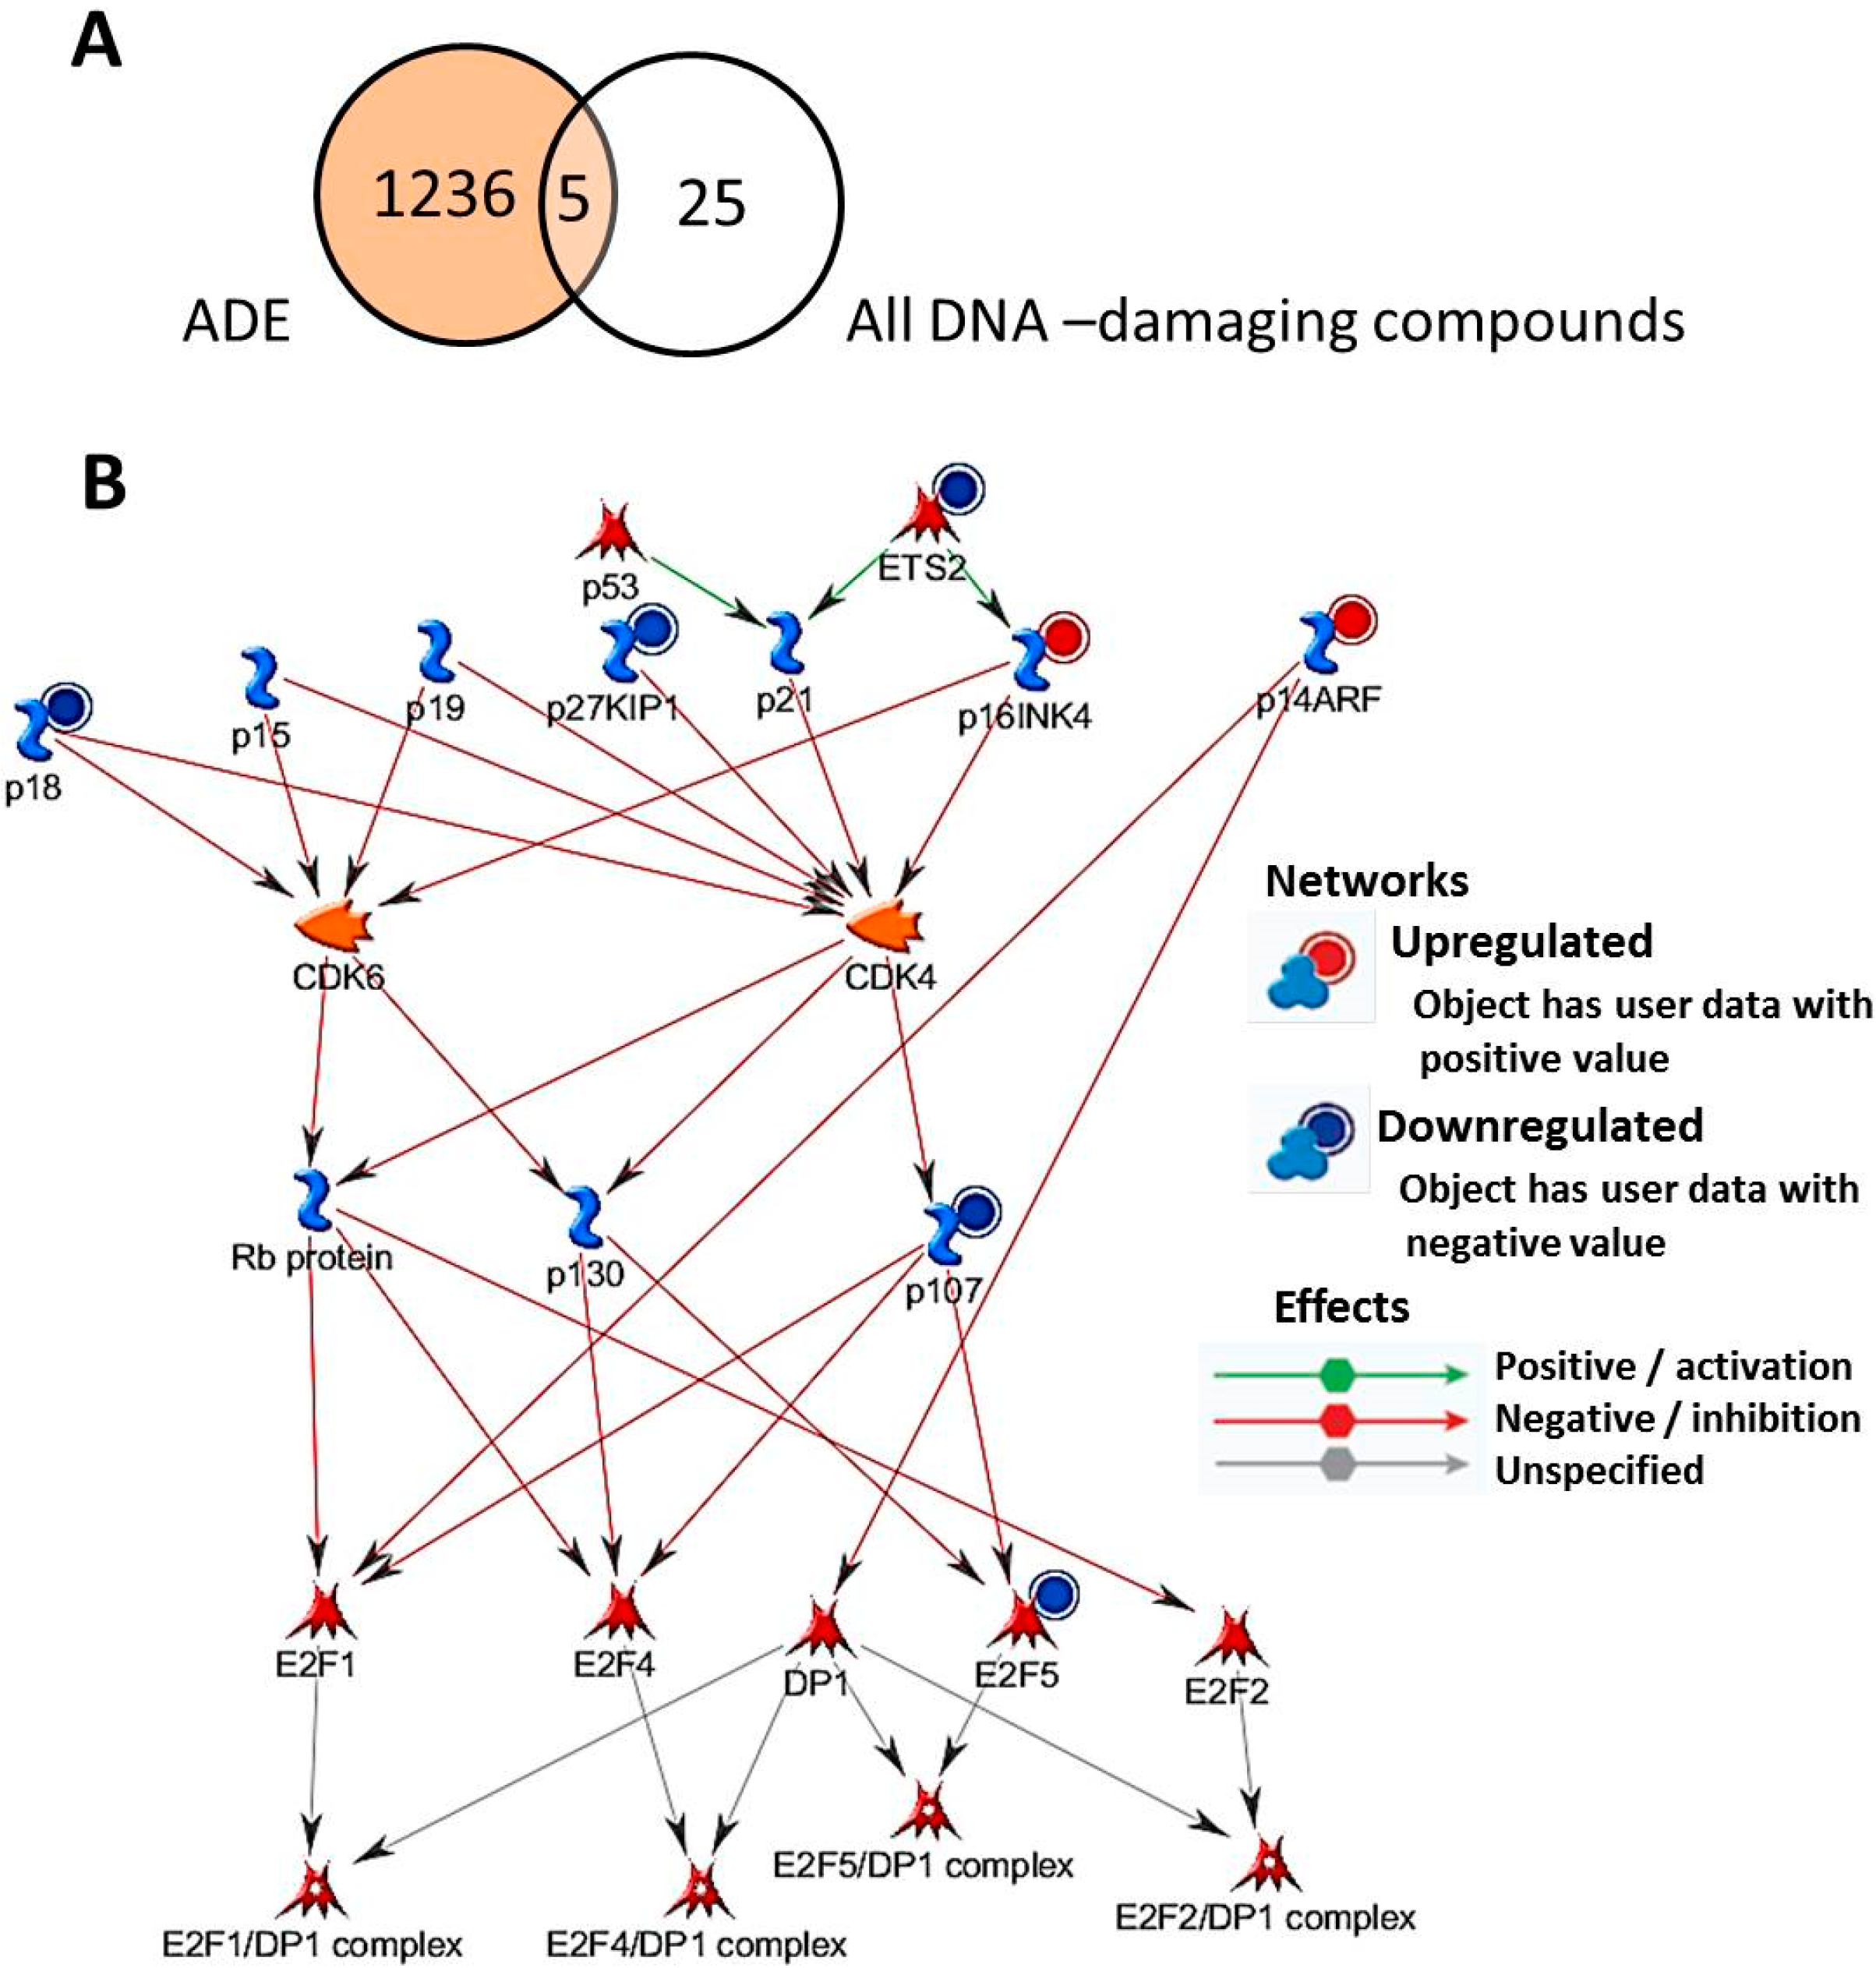
2.3. Biological Significance of Genes Differentially Regulated on Adenine (ADE) Treatment

KIF20A was downregulated on treatment with not only DNA damage-inducing clastogens but also nucleic acid constituents, including ADE and 2-DA (Figure 2). The eight RB/E2F regulatory genes related to cell cycle [20] were also downregulated on treatments with ADE, as well as DNA damage-inducing clastogens (Table 2).
To clarify the mechanism of KIF20A downregulation on treatment with nucleic acid constituents, microarray data obtained from cells treated with ADE was compared with data obtained with the other DNA damage-inducing clastogens, namely, MMC, CP, MMS, EMS, ETOP, and HU. By applying statistical criteria for gene selection, 1241 probes were selected as differentially regulated genes on treatment with ADE, while 1409, 1357, 2088, 1891, 1726, or 2647 probes represented differentially regulated genes on treatment with MMC, CP, MMS, EMS, ETOP, or HU, respectively; 30 probes showed expression alters with all DNA damage-inducing clastogens. Figure 3A shows the Venn diagram depicting the selected probes on treatments with ADE and DNA damage-inducing clastogens, and the intersection of these probes. Five of the 1241 probes were altered by ADE, as well as DNA damage-inducing clastogens, and 1236 probes were specifically altered on treatment with ADE (Table S1).
Figure 3. Pathway enrichment analysis for toxicity networks showing E2F downregulation. Venn diagram (A) showing intersection of gene sets. Five of 1241 probes were altered in common on treatments with adenine (ADE) and DNA damage-inducing clastogens, while 1236 probes were specifically altered on ADE treatment. The network comprising the regulation of cyclin-dependent kinase (CDK) 4, 6 by CDK inhibitors (B) was obtained by pathway enrichment analysis showing E2F downregulation using the 1236 ADE-induced genes depicted in (A) by MetaCore.
Ijms 15 17256 g003
The biological significance of alterations in these 1236 probes on treatment with ADE was characterized. Gene ontology (GO) analysis on these 1236 probes revealed that genes involved in RNA metabolic processes and the M-phase of the mitotic cell cycle were enriched in the probes specifically altered by ADE treatment (Table 3). To determine the possible signaling pathways leading to KIF20A downregulation, network analysis was performed on these 1236 probes that were specifically altered on treatment with ADE. Among the significant networks identified in the analysis, two networks, including “anaphase-promoting complex (APC) regulation of G1/S” and “cyclin-dependent kinase (CDK) 4, 6 regulation by cyclin/CDK inhibitors” were shown to be linked with E2F downregulation. Figure 3B illustrates one of the identified networks, cell cycle control via CDK4, 6 regulation by CDK inhibitors, and indicates that activation of p16 results in inhibition of E2Fs through CDK4, CDK6, and retinoblastoma (RB) family proteins (p130, p107, and RB), independently of CDKN1A/p21.
Table 3. Gene ontology analysis for 1236 probes selected from ADE-treated TK6 cells.
Gene Ontology IDBiological Processesp-Value (Benjamini)
GO:0016070RNA metabolic process6.15 × 10−17
GO:0006396RNA processing4.28 × 10−13
GO:0000279M phase6.26 × 10−8
GO:0007067Mitosis7.05 × 10−8
GO:0019219Regulation of nucleobase, nucleoside, nucleotide and nucleic acid metabolic process8.70 × 10−8
GO:0010468Regulation of gene expression7.34 × 10−8
GO:0000087M phase of mitotic cell cycle7.16 × 10−8
GO:0010556Regulation of macromolecule biosynthetic process9.86 × 10−8
GO:0045449Regulation of transcription1.45 × 10−7
GO:0031326Regulation of cellular biosynthetic process1.67 × 10−6
GO:0034470ncRNA processing2.09 × 10−5
GO:0016071mRNA metabolic process4.97 × 10−5
GO:0008380RNA splicing1.14 × 10−4
GO:0006397mRNA processing1.63 × 10−4
The functional annotation clustering tool DAVID (Database for Annotation, Visualization, and Integrated Discovery) was used for gene ontology (GO) analysis (p < 0.001).
Figure 4 illustrates cell cycle control via the RB/E2F pathway induced by either DNA damage-inducing clastogens, which caused downregulation of KIF20A via activation of CDKN1A, or by nucleic acid constituents (ADE) via p16 (cyclin-dependent kinase inhibitor 2A) activation, independently of CDKN1A. The p16-regulated RB/E2F pathway is reported as the cellular senescence pathway [29], which is downregulated by a variety of extrinsic physiological stresses, oncogene activation, and toxicity from oxygen free radicals [30]. Because certain compounds downregulate KIF20A expression independently of DNA damage, discrimination based on KIF20A expression must be cautiously conducted. In addition, although the present study only focused on alterations of transcriptional regulation of genes in the response to DNA damage, there is growing evidence that epigenetic changes play a critical role in the regulation of expression of genes including CDKN1A [31]. Consequently, further research is warranted regarding the involvement of epigenetic factors can affect the CDKN1A and KIF20A expression in the response to DNA damage.
Figure 4. Proposed model of the roles of CDKN1A and KIF20A in cell cycle control via RB/E2F pathway. Mitogenic signals induce cell cycle progression, regulating cyclin D/cyclin-dependent kinase (CDK) 4 or 6, and cyclin E/CDK2, and resulting in retinoblastoma (RB) phosphorylation. Phosphorylated RB releases E2F transcription factor, resulting in the induction of E2F transcriptionaltarget genes including KIF20A. DNA damage induces upregulation of CDKN1A and downregulation of KIF20A via the RB/E2F pathway. Nucleic acid constituents induce downregulation of KIF20A by activation of p16 via RB/E2F; this pathway is termed cellular senescence response.
Ijms 15 17256 g004

3. Experimental Section

3.1. In Vitro Cell Culture and Treatment

In the present study, microarray data and total RNA samples (for RT-PCR analysis) obtained previously [2] were used. Briefly, the human B lymphoblastoid cell line TK6 (DS Pharma Biomedical Co., Ltd., Osaka, Japan) was grown in suspension in RPMI 1640 medium (Sigma Aldrich, St. Louis, MO, USA) supplemented with 10% (v/v) heat-inactivated horse serum (Gibco Invitrogen Corporation, Grand island, NY, USA), 100 U/mL of penicillin, and 100 μg/mL of streptomycin (Sigma Aldrich). Cells were maintained at 37 °C in a humidified atmosphere of 5% CO2. Exponentially growing cultures (at cell density of 5 × 10⁵ cells/mL) were treated with the compounds. MMS, EMS, ETOP, HU, COLCH, ADE, ENU, CCNU, 5-FU, CAMP, TXL, 2-DA, and CHX were purchased from Sigma Aldrich. MMC, CP, and COLCE were purchased from Kyowa Hakko Kirin Co., Ltd. (Tokyo, Japan), Nippon Kayaku Co., Ltd. (Tokyo, Japan), and Wako Pure Chemical Industries, Ltd. (Osaka, Japan), respectively. Compounds A, B, and C were synthesized as drug candidates by Shionogi & Co., Ltd. (Osaka, Japan). These compounds were dissolved in dimethyl sulfoxide (DMSO; Wako Pure Chemical Industries, Ltd.) at a final concentration of 1% (v/v) in cell culture medium. NaCl was purchased from Wako Pure Chemical Industries, Ltd., dissolved in sterilized water and filtered prior to use. All test solutions were prepared immediately prior to use.
After treatment with the compounds for 4 h, a fraction of cells were lysed in RLT buffer (RNeasy Mini Kit, Qiagen, Valencia, CA, USA) and collected for gene expression analysis. The cytotoxicity of the compounds was evaluated by means of relative cell growth (RCG). For this purpose, the remaining cells were washed with PBS and allowed to recover for 20 h in standard cell culture medium. For microarray and quantitative RT-PCR analyses, cells were treated with particular concentrations of each compound, which resulted in approximately 50% reduction in RCG (RCG50). As CDKN1A expression was reported to be a biomarker for DNA damage-inducing clastogenicity under RCG50 [2], the concentration indicated RCG50 was used as a treatment condition for analysis of supportive marker. Single culture of each compound was tested in one experiment (duplicates).

3.2. Microarray Analysis

Microarray analysis was performed using Human HG-U133A DNA microarrays (n = 2/compound; Affymetrix, Santa Clara, CA, USA) and samples treated with MMC, MMS, EMS, CP, ETOP, HU, COLCH, and ADE, in accordance with standard procedure [2]. The Affymetrix Microarray Analysis Suite 5.0 (MAS 5.0, Affymetrix) algorithm was used for calculating the signal value and making a detection call for each probe.
Data from microarray analysis was imported into Spotfire® DecisionSite 9.1.1 for Functional Genomics (Spotfire, Göteborg, Sweden). All signal intensities for each chip were normalized to the average value of all probes on the chip. First, each probe that was judged as presence in at least one microarray among the measured ones was selected for further analysis. The genes whose expression was altered on treatment with the compounds were extracted by calculating the following two statistical parameters for each selected probe: (i) average signal intensity from all microarrays after mean scaling; and (ii) fold change in gene expression between treated and control samples. The following two criteria, namely, signal intensity of >0.1 and fold change of ≥1.5 or ≤0.5, were used to filter probes meeting the two previous statistical criteria.

3.3. Analysis of Biological Significance of Genes with Altered Expression on ADE Treatment

The functional annotation online tool DAVID (Database for Annotation, Visualization, and Integrated Discovery, [32]) was used for gene ontology (GO) analysis. A level 5 analysis was adopted for the GO terms of the biological process (threshold count >2). GO terms with p values (corrected by Benjamini method) of <0.001 were listed. MetaCore (Thomson Reuters, New York, NY, USA) software was used for functional analysis of genes whose expression was specifically altered on ADE treatment. The network was constructed based on pre-defined molecular interactions in the MetaCore database. A p value of <0.01, with the false-discovery rate adjusted using the Benjamini‑Hochberg procedure, was considered statistically significant in the network analysis.

3.4. Quantitative RT-PCR Analysis (QPCR)

QPCR was performed on all the samples obtained in the study, as follows. High Capacity cDNA Reverse Transcription Kit (Applied Biosystems, Foster City, CA, USA) was used, according to the manufacturer’s instructions, for the synthesis of cDNA from total RNA; for each reaction, 1 μg of total RNA was used as template in a total volume of 20 μL. For each QPCR, 2 μL of cDNA was used as template, and TaqMan Gene Expression Assay reagents (for KIF20A, assay ID: Hs00993573_m1; GAPDH, TaqMan Endogenous Controls, predesigned assay reagent, ABI, Applied Biosystems) were used as gene-specific probe and primer sets. TaqMan® Gene Expression Master Mix and ABI PRISM 7900HT System (Applied Biosystems) were used, according to the manufacturer’s instructions, for the reactions and measuring transcript levels, respectively. The conditions for reverse transcription and amplification include 50 °C for 2 min, 95 °C for 10 min, followed by 40 cycles of 95 °C for 15 s and 60 °C for 1 min. The comparative Ct method was used for calculating the resulting cycle threshold (Ct) values; for each calculation, GAPDH was used as an endogenous reference gene for normalizing expression levels of target genes. Values were reported as the means of duplicate analyses.

4. Conclusions

In conclusion, KIF20A could be used as a biomarker for identifying DNA damage-inducing clastogenicity in conjunction with CDKN1A. We have previously reported that CDKN1A expression could be used as a biomarker for discriminating chromosomal aberrations that result from DNA damage [2]; it is to be noted, however, that CDKN1A expression is affected by the cytotoxic condition. In the present study, KIF20A was selected for increasing the accuracy of the discrimination tool, as it was downregulated by all the DNA damage-inducing compounds used in the gene expression analysis. Even though KIF20A could be downregulated via p16 activation independently of CDKN1A, we found that KIF20A could be effectively used as a supportive biomarker for identifying chromosomal aberrations that result from DNA damage when CDKN1A expression is upregulated. We concluded that the utilization of combined assays analyzing KIF20A and CDKN1A expression is appropriate for discriminating DNA damage-inducing clastogens, because it overcomes their individual drawbacks. A large-scale validation study involving diverse sets of DNA damage-inducing and negative compounds will be needed for studying the association between CDKN1A and KIF20A in the response to clastogens; in the meantime, the utilization of KIF20A biomarker in a simple follow-up assay, in conjunction with CDKN1A, can effectively aid appropriate decision making during genotoxicity screening of drug candidates.

Supplementary Materials

Supplementary materials can be accessed at: https://www.mdpi.com/1422-0067/15/10/17256/s1.

Supplementary Files

Supplementary File 1

Acknowledgments

The authors thank Mikinori Torii and Motonobu Ueno for their unqualified support of this research. This study was funded by Shionogi & Co., Ltd., Osaka, Japan.

Author Contributions

Study conception and design: Rina Sakai and Takeki Uehara; Acquisition of data: Rina Sakai, Hiroyuki Oka, and Chiaki Kondo; Analysis and interpretation of data: Yuji Morikawa and Takeki Uehara; Drafting the manuscript: Rina Sakai; Supervision for the experimental work: Hirofumi Miyajima; Critical revision: Kihei Kubo and Takeki Uehara.

Conflicts of Interest

The authors declare no conflict of interest.

References

  1. Kirkland, D.J.; Müller, L. Interpretation of the biological relevance of genotoxicity test results: The importance of thresholds. Mutat. Res. 2000, 464, 137–147. [Google Scholar]
  2. Sakai, R.; Kondo, C.; Oka, H.; Miyajima, H.; Kubo, K.; Uehara, T. Utilization of CDKN1A/p21 gene for class discrimination of DNA damage-induced clastogenicity. Toxicology 2014, 315, 8–16. [Google Scholar]
  3. Martinez, L.A.; Yang, J.; Vazquez, E.S.; Rodriguez-Vargas Mdel, C.; Olive, M.; Hsieh, J.T.; Logothetis, C.J.; Navone, N.M. p21 modulates threshold of apoptosis induced by DNA-damage and growth factor withdrawal in prostate cancer cells. Carcinogenesis 2002, 23, 1289–1296. [Google Scholar]
  4. Chinery, R.; Brockman, J.A.; Peeler, M.O.; Shyr, Y.; Beauchamp, R.D.; Coffey, R.J. Antioxidants enhance the cytotoxicity of chemotherapeutic agents in colorectal cancer: A p53-independent induction of p21WAF1/CIP1 via C/EBPβ. Nat. Med. 1997, 3, 1233–1241. [Google Scholar]
  5. Gartel, A.L.; Goufman, E.; Tevosian, S.G.; Shih, H.; Yee, A.S.; Tyner, A.L. Activation and repression of p21WAF1/CIP1 transcription by RB binding proteins. Oncogene 1998, 17, 3463–3469. [Google Scholar]
  6. Iyer, V.N.; Szybalski, W. A molecular mechanism of mitomycin action: Linking of complementary DNA strands. Proc. Natl. Acad. Sci. USA 1963, 50, 355–362. [Google Scholar]
  7. Zwelling, L.A.; Kohn, K.W. Mechanism of action of cis-dichlorodiammineplatinum(II). Cancer Treat. Rep. 1979, 63, 1439–1444. [Google Scholar]
  8. O’Neill, J.P.; Schenley, R.L.; Hsie, A.W. Cytotoxicity and mutagenicity of alkylating agents in cultured mammalian cells (CHO/HGPRT system): Mutagen treatment in the presence or absence of serum. Mutat. Res. 1979, 63, 381–385. [Google Scholar]
  9. Liu, L.F.; Liu, C.C.; Alberts, B.M. Type II DNA topoisomerases: Enzymes that can unknot a topologically knotted DNA molecule via a reversible double-strand break. Cell 1980, 19, 697–707. [Google Scholar]
  10. Hendricks, S.P.; Mathews, C.K. Differential effects of hydroxyurea upon deoxyribonucleoside triphosphate pools, analyzed with vaccinia virus ribonucleotide reductase. J. Biol. Chem. 1998, 273, 29519–29523. [Google Scholar]
  11. Kohn, K.W. Interstrand cross-linking of DNA by 1,3-bis(2-chloroethyl)-1-nitrosourea and other 1-(2-haloethyl)-1-nitrosoureas. Cancer Res. 1977, 37, 1450–1454. [Google Scholar]
  12. Pommier, Y.; Redon, C.; Rao, V.A.; Seiler, J.A.; Sordet, O.; Takemura, H.; Antony, S.; Meng, L.; Liao, Z.; Kohlhagen, G.; et al. Repair of and checkpoint response to topoisomerase I-mediated DNA damage. Mutat. Res. 2003, 532, 173–203. [Google Scholar]
  13. McLeod, H.L.; Sludden, J.; Hardy, S.C.; Lock, R.E.; Hawksworth, G.M.; Cassidy, J. Autoregulation of 5-fluorouracil metabolism. Eur. J. Cancer 1998, 34, 1623–1627. [Google Scholar]
  14. Owellen, R.J.; Hartke, C.A.; Dickerson, R.M.; Hains, F. Inhibition of tubulin-microtubule polymerization by drugs of the Vinca alkaloid class. Cancer Res. 1976, 36, 1499–1502. [Google Scholar]
  15. Scott, D.; Galloway, S.M.; Marshall, R.R.; Ishidate, M., Jr.; Brusick, D.; Ashby, J.; Myhr, B.C. International commission for protection against environmental mutagens and carcinogens—Genotoxicity under extreme culture conditions. A report from ICPEMC Task Group 9. Mutat. Res. 1991, 257, 147–205. [Google Scholar]
  16. Schiff, P.B.; Fant, J.; Horwitz, S.B. Promotion of microtubule assembly in vitro by taxol. Nature 1979, 277, 665–667. [Google Scholar]
  17. Hashimoto, K.; Todo, T. Mitotic slippage underlies the relationship between p53 dysfunction and the induction of large micronuclei by colcemid. Mutagenesis 2013, 28, 457–464. [Google Scholar]
  18. Schneider-Poetsch, T.; Ju, J.; Eyler, D.E.; Dang, Y.; Bhat, S.; Merrick, W.C.; Green, R.; Shen, B.; Liu, J.O. Inhibition of eukaryotic translation elongation by cycloheximide and lactimidomycin. Nat. Chem. Biol. 2010, 6, 209–217. [Google Scholar]
  19. Ashby, J.; Ishidate, M., Jr. lastogenicity in vitro of the Na, K, Ca and Mg salts of saccharin; and of magnesium chloride; consideration of significance. Mutat. Res. 1986, 163, 63–73. [Google Scholar]
  20. Eguchi, T.; Takaki, T.; Itadani, H.; Kotani, H. RB silencing compromises the DNA damage-induced G2/M checkpoint and causes deregulated expression of the ECT2 oncogene. Oncogene 2007, 26, 509–520. [Google Scholar]
  21. Ishida, S.; Huang, E.; Zuzan, H.; Spang, R.; Leone, G.; West, M.; Nevins, J.R. Role for E2F in control of both DNA replication and mitotic functions as revealed from DNA microarray analysis. Mol. Cell. Biol. 2001, 21, 4684–4699. [Google Scholar]
  22. Poon, R.Y.; Jiang, W.; Toyoshima, H.; Hunter, T. Cyclin-dependent kinases are inactivated by a combination of p21 and Thr-14/Tyr-15 phosphorylation after UV-induced DNA damage. J. Biol. Chem. 1996, 271, 13283–13291. [Google Scholar]
  23. Johnson, D.G.; Schneider-Broussard, R. Role of E2F in cell cycle control and cancer. Front. Biosci. 1998, 3, d447–d448. [Google Scholar]
  24. Xu, X.; Bieda, M.; Jin, V.X.; Rabinovich, A.; Oberley, M.J.; Green, R.; Farnham, P.J. A comprehensive ChIP-chip analysis of E2F1, E2F4, and E2F6 in normal and tumor cells reveals interchangeable roles of E2F family members. Genome Res. 2007, 17, 1550–1561. [Google Scholar]
  25. Van Oevelen, C.; Wang, J.; Asp, P.; Yan, Q.; Kaelin, W.G., Jr.; Kluger, Y.; Dynlacht, B.D. A role for mammalian Sin3 in permanent gene silencing. Mol. Cell 2008, 32, 359–370. [Google Scholar]
  26. Fontijn, R.D.; Goud, B.; Echard, A.; Jollivet, F.; van Marle, J.; Pannekoek, H; Horrevoets, A.J. The human kinesin-like protein RB6K is under tight cell cycle control and is essential for cytokinesis. Mol. Cell. Biol. 2001, 21, 2944–2955. [Google Scholar]
  27. Ren, B.; Cam, H.; Takahashi, Y.; Volkert, T.; Terragni, J.; Young, R.A.; Dynlacht, B.D. E2F integrates cell cycle progression with DNA repair, replication, and G2/M checkpoints. Genes 2002, 16, 245–256. [Google Scholar]
  28. Van Gent, D.C.; Hoeijmakers, J.H.; Kanaar, R. Chromosomal stability and the DNA double-stranded break connection. Nat. Rev. Genet. 2001, 2, 196–206. [Google Scholar]
  29. Ohtani, N.; Yamakoshi, K.; Takahashi, A.; Hara, E. The p16INK4a-RB pathway: Molecular link between cellular senescence and tumor suppression. J. Med. Investig. 2004, 51, 146–153. [Google Scholar]
  30. Lundberg, A.S.; Hahn, W.C.; Gupta, P.; Weinberg, R.A. Genes involved in senescence and immortalization. Curr. Opin. Cell. Biol. 2000, 12, 705–709. [Google Scholar]
  31. Scholpa, N.E.; Zhang, X.; Kolli, R.T.; Cummings, B.S. Epigenetic changes in p21 expression in renal cells after exposure to bromate. Toxicol. Sci. 2014. [Google Scholar] [CrossRef]
  32. DAVID. Available online: http://david.abcc.ncifcrf.gov/ (accessed on 27 February 2014).

